


Introduction
The tempo and mode of early animal evolution remains one of the biggest conundrums in biology. It is now known that phylum-level lineages were long established by the early Cambrian, ca. 541 Ma (Peterson and Butterfield Reference Peterson and Butterfield2005; Butterfield Reference Butterfield2007) and there is evidence for earlier fossils that push back the origin of animals at least to the late Neoproterozoic, for example, the vendobionts of Ediacara and fossil embryos of Doushantuo (635–542 Ma) (Jensen et al. Reference Jensen, Gehling and Droser1998; Yin et al. Reference Yin, Zhu, Knoll, Yuan, Zhang and Hu2007); but most of these have disputed affinities, including the bilaterian-like ichnofossils at ~555 Ma (Evans et al. Reference Evans, Hughes, Gehling and Droser2020). The apparently sudden emergence of multicellular animals at the base of the Cambrian greatly puzzled Darwin (Reference Darwin1859), who argued that fossil discoveries would eventually solve this conundrum. Indeed many body fossils from the Ediacaran are now known, however interpretations of them as independent lineages or stem groups of metazoans is still debated (Cunningham et al. Reference Cunningham, Liu, Bengtson and Donoghue2017), with only Kimberella (Fedonkin and Waggoner Reference Fedonkin and Waggoner1997) argued to be “widely accepted” as a metazoan (Wray Reference Wray2015). Aside from the varied interpretations of Ediacaran soft-bodied biota, there is nevertheless a large gap in time between fossils and the molecular clock estimates that place the divergence of major animal clades at 800 Ma or earlier (Peterson and Butterfield Reference Peterson and Butterfield2005; although see Cunningham et al. Reference Cunningham, Liu, Bengtson and Donoghue2017). The lack of consensus on the timing of the appearance of the first multicellular animals is exacerbated by, or maybe due to, the fact that we lack criteria by which to recognize early animals definitively in the fossil record (Antcliffe et al. Reference Antcliffe, Callow and Brasier2014; Turner Reference Turner2021).
Our current understanding of the phylogenetic relationships of early branching taxa is key to interpreting the evolution of metazoan traits and knowing what to look for in the rock record. Molecular sequence analysis of such deep branching is obscured by saturation and long-branch attraction resulting in a yet incomplete knowledge of the higher-level relationships among Metazoa (Philippe et al. Reference Philippe, Derelle, Lopez, Pick, Borchiellini, Boury-Esnault, Vacelet, Renard, Houliston, Queinnec, Da Silva, Winicker, Le Guayader, Leys, Jackson, Schreiber, Erpenbeck, Morgenstern and Woerheide2009, Reference Philippe, Brinkmann, Lavrov, Littlewood, Manuel, Wörheide and Baurain2011; Edgecombe et al. Reference Edgecombe, Giribet, Dunn, Hejnol, Kristensen, Neves, Rouse, Worsaae and Sørensen2011). Nevertheless, molecular systematics have greatly advanced our understanding of the relationships within Metazoan lineages. Trees combining both molecular and morphological characters support the monophyly of the major Metazoan groups, Deuterostomia (Ambulacraria + Chordata) and Protostomia (Spiralia + Ecdysozoa), and support the group Bilateria + Cnidaria (Gröger and Schmid Reference Gröger and Schmid2001; Eernisse and Peterson Reference Eernisse, Peterson, Cracraft and Donoghue2004; Peterson et al. Reference Peterson, McPeek and Evans2005; Edgecombe et al. Reference Edgecombe, Giribet, Dunn, Hejnol, Kristensen, Neves, Rouse, Worsaae and Sørensen2011). Yet, the relationships of Porifera, Ctenophora, and Placozoa are not well resolved. Although the debate is ongoing, a compelling body of evidence places sponges as the sister group of the rest of Metazoa (Wörheide et al. Reference Wörheide, Dohrmann, Erpenbeck, Larroux, Maldonado, Voigt, Borchiellini, Lavrov, Becerro, Uriz, Maldonado and Turon2012; Whelan et al. Reference Whelan, Kocot, Moroz and Halanych2015, Reference Whelan, Kocot, Moroz, Mukherjee, Williams, Paulay, Moroz and Halanych2017; Feuda et al. Reference Feuda, Dohrmann, Pett, Philippe, Rota-Stabelli, Lartillot, Wörheide and Pisani2017). This is relevant, because sponges have a highly specialized morphology that has not changed since they first appear in the fossil record. Stasis in their general shape is likely because the sponge body plan is highly specialized for filtration (Manuel et al. Reference Manuel, Borchiellini, Alivon, Le Parco, Vacelet and Boury-Esnault2003), and so a sponge, or a sponge-type animal, should be a good candidate when looking for fossil evidence of early diversification of animals. It is not known, however, when the sponge “filtering” body plan arose (Erpenbeck and Wörheide Reference Erpenbeck and Wörheide2007; Cunningham et al. Reference Cunningham, Liu, Bengtson and Donoghue2017; Dohrmann and Wörheide Reference Dohrmann and Wörheide2017).
Molecular clock data suggest that Porifera diverged from the metazoan lineage as early as 800 Ma to 650 Ma—the Tonian to Cryogenian interval (Peterson and Butterfield Reference Peterson and Butterfield2005; Cunningham et al. Reference Cunningham, Liu, Bengtson and Donoghue2017)—and the earliest irrefutable sponge fossils are ca. 535 Ma (Antcliffe et al. Reference Antcliffe, Callow and Brasier2014). There is a gap of at least ~100 Myr and up to 300 Myr between the oldest sponge fossil recognized as such and the oldest signal from the biochemical record of sponge-derived steranes, which agree with the molecular clock estimates (Fig. 1) (Botting and Nettersheim Reference Botting and Nettersheim2018; Zumberge et al. Reference Zumberge, Love, Cárdenas, Sperling, Gunasekera, Rohrssen, Grosjean, Grotzinger and Summons2018).
Diagram showing the timeline of the evolution of metazoans and indicating the position of the fossils Otavia antiqua (Brain et al. Reference Brain, Prave, Hoffmann, Fallick, Botha, Herd, Sturrock, Young, Condon and Allison2012) at 750 Ma, considered either a testate amoeba or sponge, and Eocyathispongia qiania at 650 Ma, proposed as a sponge (Yin et al. Reference Yin, Zhu, Davidson, Bottjer, Zhao and Tafforeau2015). The appearance of sterane molecules, thought to reflect the presence of sponge biomolecules, is also shown at 700 Ma (Zumberge et al. Reference Zumberge, Love, Cárdenas, Sperling, Gunasekera, Rohrssen, Grosjean, Grotzinger and Summons2018). Molecular clocks suggest that animals evolved at 800 Ma or earlier, but the oldest metazoan ichnofossils are found at ~555 Ma.

Some candidate fossils have been proposed that might fill this gap, but their affinities with sponges are contentious (Love et al. Reference Love, Grosjean, Stalvies, Fike, Grotzinger, Bradley, Kelly, Bhatia, Meredith, Snape, Bowring, Condon and Summons2009; Brain et al. Reference Brain, Prave, Hoffmann, Fallick, Botha, Herd, Sturrock, Young, Condon and Allison2012; Antcliffe Reference Antcliffe2013; Schuster et al. Reference Schuster, Vargas, Knapp, Pomponi, Toonen, Erpenbeck and Wörheide2018). Most of these fossils are represented only by scarce spicule-like elements that can also be explained by abiogenesis (Antcliffe et al. Reference Antcliffe, Callow and Brasier2014). Sponge tissues (or other organic materials) are highly unlikely to be preserved unless in anoxic and reducing conditions for sufficient time to allow replacement of tissue by minerals (Supplementary Fig. 1); thus, it is very unlikely that choanocyte chambers or pinacocytes would be found in the fossil record, as proposed by Yin et al. (Reference Yin, Zhu, Davidson, Bottjer, Zhao and Tafforeau2015). However, despite the fact that sponge tissues do not preserve well, the organization retained by the spicules can still preserve a general body outline (Supplementary Fig. 2). Putative metazoan body-fossil candidates of unknown affinity include Otavia antiqua (Brain et al. Reference Brain, Prave, Hoffmann, Fallick, Botha, Herd, Sturrock, Young, Condon and Allison2012), a 0.3 to 5 mm organism from the Otavi and Nama Group in the Okavuvu Formation in Namibia dated at 760 Ma; Eocyathispongia qiania (Yin et al. Reference Yin, Zhu, Davidson, Bottjer, Zhao and Tafforeau2015), from the Doushantou Formation in central Guizhou, China dated at 600 Ma; and Thectardis avalonensis (Clapham et al. Reference Clapham, Narbonne, Gehling and Anderson2004), from the Mistaken Point and Drook Formations dated at 575 Ma. All of these have a proposed poriferan affinity, or alternatively are considered possible amoebae (Otavia), or are thought to represent a state (stage) of other known vendobionts (Thectardis) (Porter and Knoll Reference Porter and Knoll2000; Sperling et al. Reference Sperling, Peterson and Laflamme2011; Antcliffe et al. Reference Antcliffe, Callow and Brasier2014).
A reassessment of fossils is therefore needed to close the sponge fossil gap or to recognize its true existence. Fossils necessarily lag behind the actual date of origin of a clade, because the likelihood of finding a fossil depends on the abundance and biomass of the organisms that preceded them. As we lack other ways to time calibrate molecular clocks, it has become obvious that establishing hard-point benchmarks is important. These benchmarks can be direct fossil evidence or molecular footprints, but both are still subject to interpretation; for example, the sterane biomarkers used to claim the presence of crown group demosponges at 715 Ma (Zumberge et al. Reference Zumberge, Love, Cárdenas, Sperling, Gunasekera, Rohrssen, Grosjean, Grotzinger and Summons2018) are also found in pelagophyte algae (Nettersheim et al. Reference Nettersheim, Brocks, Schwelm, Hope, Not, Lomas, Schmidt, Schiebel, Nowack, De Deckker, Pawlowski, Bowser, Bobrovskiy, Zonneveld, Kucera, Stuhr and Hallmann2019). Some putative body fossils do not show spicules (e.g., Turner Reference Turner2021), and although that does not rule out a sponge affinity, how can we recognize a sponge without spicules in the fossil record? As morphology is often our main, if not the only, source of paleontological data, we need to explore the relation between form and function in modern groups (e.g., Gould Reference Gould, Grene and Mendelsohn1976) and to see if it is possible to extrapolate it to the past.
A body of literature suggests that a mathematical relationship exists between the form of a sponge and its excurrent flow (or feeding) (Bidder Reference Bidder1923; Reiswig Reference Reiswig1971a; Morganti et al. Reference Morganti, Ribes, Yahel and Coma2019). Sponge bodies are organized around a branching aquiferous system (Bergquist Reference Bergquist1978; Leys and Hill Reference Leys and Hill2012). Water enters canals through ostia, ~20-μm-diameter holes on the surface of the body through incurrent canals to the choanocyte chambers whose beating flagella generate the suction to drive the water flow. Chambers are arranged in parallel, and a gasket of cells or mucus around the collars effectively divides the incurrent and excurrent flow, giving rise to a unidirectional stream of water from the ostium to the excurrent vent, the osculum (Leys et al. Reference Leys, Yahel, Reidenbach, Tunnicliffe, Shavit and Reiswig2011; Asadzadeh et al. Reference Asadzadeh, Kiørboe, Larsen, Leys, Yahel and Walther2020). The pressure drop across the sponge body relies on the continuity of flow, and consequently, there is a predictable relationship between the area of the incurrent and excurrent openings (Reiswig Reference Reiswig1975a; Vogel Reference Vogel1977). Recently it has been found that the pumping power of a sponge (as determined by its excurrent flow) is proportional to its size (Strehlow et al. Reference Strehlow, Pineda, Duckworth, Kendrick, Renton, Abdul Wahab, Webster and Clode2017; Morganti et al. Reference Morganti, Ribes, Yahel and Coma2019). Moreover, the area of the osculum alone can be used to predict the excurrent flow (Morganti et al. Reference Morganti, Ribes, Moskovich, Weisz, Yahel and Coma2021). It has been found that in the range of 5–20 m, depth-induced morphological changes do not affect the performance of the sponge pump (Gökalp et al. Reference Gökalp, Kooistra, Rocha, Silva, Osinga, Murk and Wijgerde2020), and overall, the size-corrected total osculum area to surface area ratio is constant, regardless of the different habitats (depths) in which the sponge lives. These studies strongly suggest that there might be a fixed relationship between the cross-sectional area of the incurrent and excurrent openings that is optimal for the energy budget of the sponge.
Here we examine a range of morphological characters that contribute directly to the sponge “pump” and then test which metric best characterizes this physiological quality in extant sponges. We then apply that metric to a range of test data representing fossils from known sponge fauna from the Phanerozoic Era, the Cambrian and Paleogene, and finally we test whether this metric can be used to determine whether the Precambrian fossil T. avalonensis has the characteristics of a sponge pump.
Methods
Morphometric Data
The taxonomic span of the whole dataset covers three major classes of Porifera: Demospongiae, Calcarea, and Hexactinellida. Morphometric data were gathered from modern and fossil sponge genera from a range of sources (see Table 1 for a complete list of species and shapes, and Fig. 2 for examples of common shapes). Individuals of Haliclona cf. permollis (N = 17) were measured from images taken using a GoPro6 camera and a plastic ruler as a scale in tide pools near the Bamfield Marine Science Centre, Bamfield, British Columbia, Canada. Haliclona permollis is encrusting and has multiple oscula per patch, so patches with multiple oscula were considered to be individuals. Images of Geodia barretti (N = 4) and Sycon coactum (N = 4) came from unpublished data previously gathered by one of us (S.P.L.). Data for Aphrocallistes vastus (N = 10) came from Leys et al. (Reference Leys, Yahel, Reidenbach, Tunnicliffe, Shavit and Reiswig2011). Data for H. mollis (N = 10), Neopetrosia problematica (N = 5), Tethya californiana (N = 5), Cliona delitrix (N = 9), and Callyspongia vaginalis (N = 12) came from unpublished data associated with Ludeman et al. (Reference Ludeman, Reidenbach and Leys2017). Data for fossil sponges cover the two extremes of the Phanerozoic, the Cambrian (N = 42 specimens from 12 species; images from the ROM virtual fossil gallery [ROM 2011]) and Paleogene Periods (N = 37 specimens from 16 species; images from Frisone et al. [2016]), and the Ediacaran putative sponge Thectardis avalonensis (N = 125; data from Clapham et al. [Reference Clapham, Narbonne, Gehling and Anderson2004]).
Reference images of modern (A–H) and fossil (I, J) sponges to illustrate shapes and a diagram indicating how the area was calculated for oscula (K, gray shaded) and sponge surface area (K, dashed line) from images of encrusting (i), spherical-shaped (ii), and conical-shaped (iii) sponges. A–C, Encrusting multi-oscula (A, Cliona delitrix, B, Neopetrosia proxima, C, Haliclona mollis); D, E, spherical (D, Geodia barretti, E, Tethya californiana); F–H, conical (F, Callyspongia vaginalis, G, Aphrocallistes vastus, H, Sycon coactum); I, Choia, spherical; J, Vauxia, conical.

Extant and fossil species examined in the analyses. Class/Period letter codes: Dem, Demospongiae; Hex, Hexactinellida; Cal, Calcarea; Quat, Quaternary; PG, Paleogene; Ꞓ, Cambrian. Origin of data: 1, images collected and measured in this study; 2, images obtained from the source cited, measurements done in this work; 3, images and measurements from the source cited. Sources: I, this work; II, Ludeman et al. Reference Ludeman, Reidenbach and Leys2017; III, Leys et al. Reference Leys, Yahel, Reidenbach, Tunnicliffe, Shavit and Reiswig2011; IV, Frisone et al. Reference Frisone, Pisera and Preto2016; V, ROM 2011.

Linear measurements of sponge body size or gross morphology (length, width, osculum diameter), were made using ImageJ (FIJI, v. 1.43r; National Institutes of Health, Bethesda, MD, USA). Shape was estimated as the closest surface (i.e., sphere, cylinder, cone, frustum, or ellipsoid) to calculate the sponge surface area (SA) and volume (V) (Table 1). To calculate the area of the osculum (OSA, following conventional terminology), oscula were either approximated using the formula for the area of a circle or ellipsoid or directly measured using the area tool of ImageJ; the difference between these two procedures was 0.7% in a sample of 20 measurements (Supplementary Table 1). The measurements used were chosen to be comparable between both modern and fossil sponges.
Quantification of the Sponge Pump
To correlate the morphological metrics with filtration capacity in modern sponges—the pump—the density of choanocyte chambers (cc) was counted from scanning electron micrographs (SEM) available for G. barretti, C. vaginalis, Cli. delitrix, T. californiana, N. problematica, and H. mollis (unpublished data). Tissue preparation for SEM was reported in Ludeman et al. (Reference Ludeman, Reidenbach and Leys2017) and Leys et al. (Reference Leys, Kahn, Fang, Kutti and Bannister2018).
Oscular flow rates came from a range of sources. Excurrent flow rates were measured for T. californiana and N. problematica that were collected by SCUBA divers near the Bamfield Marine Science Centre. Five individuals of each were quickly transferred to a tank with flow-through seawater from 30 m depth and left undisturbed with the exception of a daily flush by pipette to remove excess surface sediment that comes from the seawater system. Excurrent speed from the osculum was measured using a custom-made thermistor flowmeter (LaBarbera and Vogel Reference LaBarbera and Vogel1976) calibrated with a Vectrino II Acoustic Doppler Velocimeter (Nortek, Norway). Data were recorded every second and binned in 10 second medians to calculate an average of 10 minutes. Images of each osculum were captured using a GoPro6 camera. Excurrent flow rates for C. vaginalis, Cli. delitrix, and H. mollis were obtained from supplementary data in Ludeman et al. (Reference Ludeman, Reidenbach and Leys2017), and for A. vastus, from supplementary data in Leys et al. (Reference Leys, Yahel, Reidenbach, Tunnicliffe, Shavit and Reiswig2011).
The volumetric (oscular) flow rate (Q; l s−1) was estimated using the formula Q = OSA · U o, where OSA is the osculum area (cm2) and U o is the excurrent speed (cm s−1)
Data Analysis and Statistics
To assess the extent of allometry, the data were log transformed before analysis. Because the data were not normally distributed (Shapiro-Wilk test, W = 0.54, p < 0.05), a nonparametric Kruskal-Wallis test was used to compare the log-transformed osculum area to surface area ratio (x = log (OSA/SA), hereafter the OSA/SA ratio) between classes, and a Dunn post hoc test with Bonferroni-corrected p-values was used to evaluate significance. The reduced major axis slope of the logOSA to logSA ratio, hereafter called the OSA/SA slope, was considered the “sponge pump character” and the slopes were compared between modern and fossil sponge groups using a chi-squared test of difference for nonnormally distributed data. Correlation and regression analyses were used to understand the contribution of each morphological variable to the pumping rate of the modern species. Data were manipulated in MS Excel, statistical analyses were performed in SigmaPlot v. 14 (Systat), and PAST (Hammer et al. Reference Hammer, Harper and Ryan2001). Graphs were plotted in MS Excel, PAST (v. 4.03), and SigmaPlot v. 14 (Systat), and figures were assembled in Adobe Illustrator (CS 5) or Inkscape v. 1.0.2.
Results
Sponge Morphology and the Sponge Pump Character
The relationship between the morphology of each sponge and the properties of the sponge pump, hereafter called the “sponge pump character,” was examined by comparing morphometrics for (1) gross morphology (osculum area and surface area of the whole sponge), (2) the pump unit (estimated density of choanocyte chambers), and (3) the excurrent speed (U o), and (4) oscular (volumetric) flow rate (Q) (Fig. 3).
Correlation of morphometrics to pumping rate of extant sponges plotted on log-transformed data. A, Osculum area (cm2) to surface area (cm2). B, Estimated number of choanocyte chambers to surface area (cm2). C, Estimated number of choanocyte chambers to volumetric flow rate (Q, ml s−1). D, Volumetric flow rate (Q, ml s−1) to surface area (cm2). E, Excurrent speed (U o, cm s−1) to Osculum area (cm2) of Demospongiae. Ee′, Excurrent speed (U o, cm s−1) to osculum area (cm2) of all modern sponges, including Hexactinellida. F, Volumetric flow rate (Q, ml s−1) to ratio of osculum area/surface area (OSA/SA). Species are Tethya californiana (▮), Neopetrosia problematica (▾), Haliclona mollis (◆), Geodia barretti (▴), Cliona delitrix (■), Callyspongia vaginalis (●), and Aphrocallistes vastus (○).

The cross-sectional area of the osculum (OSA) was proportional to the surface area (SA) of the sponge (r s = 0.89, p < 0.001) (Fig. 3A, Table 2). The surface area of the sponge was directly proportional to the total number of choanocyte chambers in the sponge (r s = 0.68, p = 0.09) (Fig. 3B), and the number of choanocyte chambers was directly proportional to the oscula (volume) flow rate (r s = 0.86, p = 0.01) (Fig. 3C). Therefore, the volume pumped (oscula flow rate, Q) was also positively correlated with surface area of the whole sponge (r s = 0.88, p < 0.001) (Fig. 3D) and with the volume of the sponge (r s = 0.68, p < 0.001) (Supplementary Fig. 3). The excurrent speed was strongly correlated with the osculum area for demosponges only (r s = 0.74, p < 0.001) (Fig. 3E) but was less well correlated with area of the osculum when both demosponges and hexactinellids were included (r s = 0.2, p = 0.07) (Fig. 3Ee′, inset). It is noteworthy that the density of choanocyte chambers was not correlated with the oscula (volumetric) flow rate (Supplementary Fig. 4), but instead was constant across all flow rates. However, the ratio of the osculum area to surface area was correlated with the oscula flow rate (r s = 0.71, p < 0.001) (Fig. 3F), which suggests that the osculum to surface area OSA/SA ratio appears to be a morphological character that correlates well with the sponge pump as measured by its excurrent flow.
Slopes of the correlation of pumping rate to size and shape of extant sponges. OSA, osculum area; SA, sponge surface area; Q, volumetric (oscula) flow rate; U o, excurrent speed; No. cc, number of choanocyte chambers; CI, confidence interval.

Testing the OSA/SA as a Metric for the Sponge Pump for Modern and Fossil Sponges
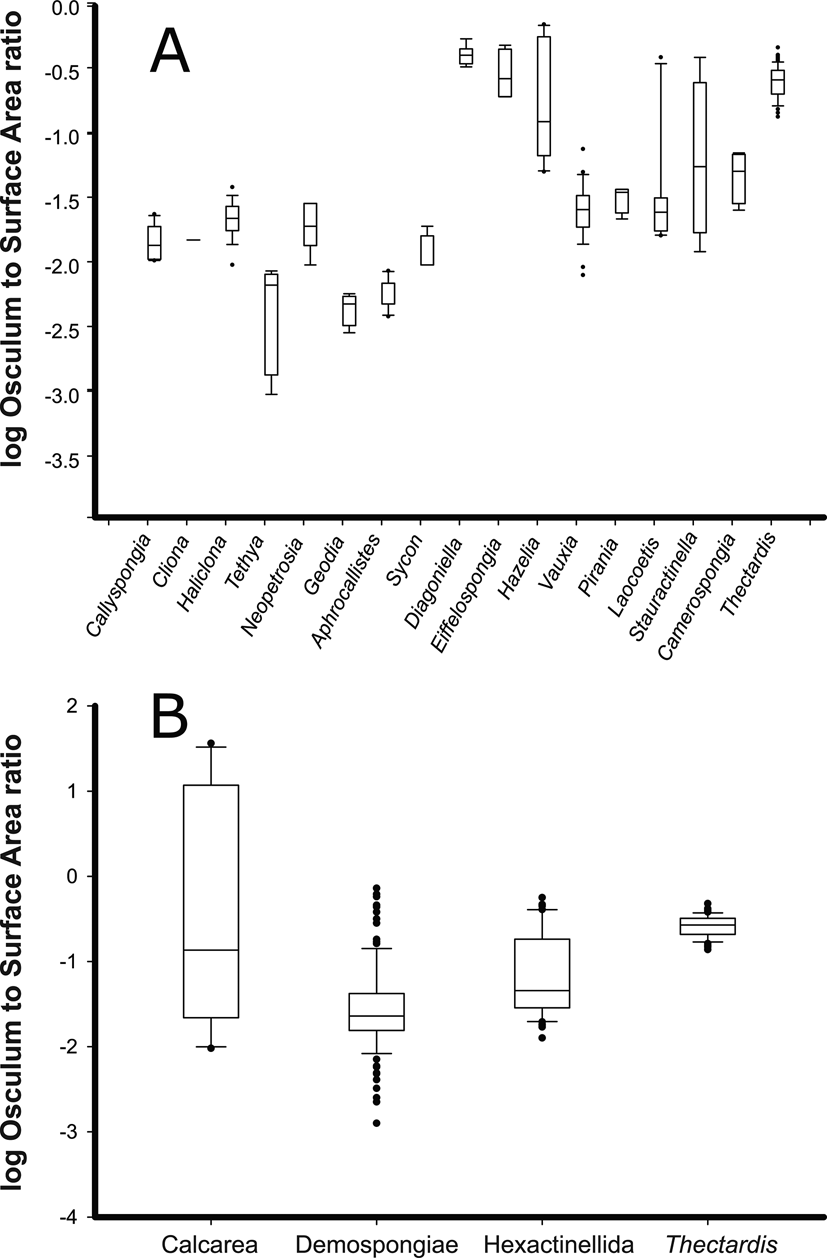
First, we examined variability of the OSA/SA ratio among individuals of a species. Variability of the OSA/SA ratio for individuals of Haliclona cf. permollis was minimal (R 2 = 0.91 p < 0.001) (Supplementary Tables 2, 3, Supplementary Figs. 5, 6). We then compared the OSA/SA ratio across species and found that the average OSA/SA for any species was not informative about the sponge pump character by itself (Fig. 4A,B). For instance, the OSA/SA ratio for modern sponges was consistently lower than for fossil species, especially for demosponges (Fig. 4A). This difference between ratios of fossil and modern genera was significant for Demospongiae (Z = 5.8, p < 0.05); however, it was not significant for fossil and modern Hexactinellida (Z = 1.2, p = 0.25), nor for Calcarea (Z = 1.06, p < 0.3). Furthermore, if all modern and fossil species were grouped together by class, the OSA/SA could not distinguish sponges by class in all cases (Fig. 4B). For example, a Dunn post hoc test with Bonferroni-corrected p-values showed that the OSA/SA ratio was different between Demospongiae and Hexactinellida (Z = 4.8, p < 0.05), Demospongiae and Calcarea (Z = 2.4, p < 0.05), and it was different between Demospongiae and Thectardis (Z = 11.8, p < 0.05). However, the difference between Hexactinellida and Calcarea (Z = 0.97, p = 0.3) and between Thectardis and Calcarea (Z < 1, p = 0.9) was not significant. Finally, the difference between Hexactinellida and Thectardis was significant (Z = 6.3, p < 0.05), indicating that this value alone (OSA/SA) was not a useful metric for the sponge pump across sponges, whether modern or fossil.
Log-transformed ratio of the osculum area to surface area (OSA/SA) of fossil (Diagoniella, Eiffelospongia, Hazelia, Vauxia, Pirania, Laocoetis, Stauractinella, Camerospongia, Thectardis) and modern (Haliclona, Neopetrosia, Callyspongia, Cliona, Tethya, Aphrocallistes, Sycon) sponge genera. A, Individual species/genera. B, Genera grouped into higher taxa for modern and fossil genera. Modern sponges have a ratio of 0.01–0.02. Sources: Leys et al. (Reference Leys, Yahel, Reidenbach, Tunnicliffe, Shavit and Reiswig2011); ROM (2011); Clapham et al. (Reference Clapham, Narbonne, Gehling and Anderson2004); Frisone et al. (Reference Frisone, Pisera and Preto2016); Ludeman et al. (Reference Ludeman, Reidenbach and Leys2017); and unpublished data.
However, when we compared the reduced major axis regression slopes of OSA/SA for fossil and modern sponges of the same class, we found a more complex relationship. For modern and fossil Demospongiae, the slopes of the OSA/SA ratio for all individuals were different (ꭓ2 = 17.4, p < 0.05) (Fig. 5A); however, the slopes for fossil sponges from the Paleogene and Cambrian did not differ (ꭓ2 = 3.6, p = 0.06) (Fig. 5B). In the case of Hexactinellida, the slopes for all fossil species differed from those for the modern species (Fig. 5C), but grouped by period, the slopes of Paleogene, Cambrian, and modern hexactinellids did not differ (Fig. 5D) (Table 3). A limited dataset (n = 10) for Calcarea also suggests that the slopes for modern and fossil Calcarea do not differ (common slope equation Y = 0.8X − 1.6; ꭓ2 = 0.35, p = 0.5) (Supplementary Fig. 7). Between classes, the slope of the OSA/SA ratio for all Demospongiae differed from that for all Hexactinellida (ꭓ2 = 9.48, p < 0.05) (Fig. 5E).
The relationship between osculum area and surface area. Scatter plots of log osculum area vs. log surface area. A, Modern Demospongiae (dash; Y = 0.87X − 1.65; R 2 = 0.9; p < 0.05) vs. fossil Demospongiae (solid; Y = 1.33X − 1.58; R 2 = 0.7; p < 0.05). B, Cambrian (solid; Y = 1.36X − 1.54), Paleogene (dot; Y = 2.36X − 3.87) and modern Demospongiae (dash). C, Modern hexactinellids (dash; Y = 1.07X − 1.58; R 2 = 0.9; p < 0.05) vs. fossil hexactinellids (solid; Y = 0.72X − 0.7; R 2 = 0.6; p < 0.05). D, Cambrian Hexactinellida (solid; Y = 0.96X − 0.37), Paleogene Hexactinellida (dot; Y = 1.37X − 1.99), modern Hexactinellida (dash). E, All Hexactinellida (solid; Y = 0.74X − 0.73; R 2 = 0.7; p < 0.05) vs. all Demospongiae (dash-dot; Y = 0.99X − 1.56; R 2 = 0.7; p < 0.05). F, All Demospongiae (dash-dot) vs. Thectardis (solid; Y = X − 0.57; R 2 = 0.8; p < 0.05). Legends for species/genera in A and B: Tethya californiana (▮), Neopetrosia problematica (▾), Haliclona mollis (◆), Geodia barretti (▴), Cliona delitrix (■), Callyspongia vaginalis (●), Aphrocallistes vastus (○), Hamptoniella (⁃), Capsospongia (+), Crumillospongia (■), Fieldospongia (×), Hazelia (○). Legends for species/genera in C and D: Aphrocallistes vastus (●), Diagoniella (□), Laocoetis (×), Stauractinella (○), Anomochone (◆), Hexactinella (*). Legends for species/genera in E and F: Aphrocallistes vastus (●), Diagoniella laocoetis (×), Stauractinella (○), Anomochone (◆), Hexactinella (*),Ventriculites (▴), Camerospongia (⁃), Coronispongia (○), Cavispongia (▾), Siphonia (+), Tethya californiana (▮), Neopetrosia problematica (▾), Haliclona mollis (◆), Geodia barretti (▴), Cliona delitrix (■), Callyspongia vaginalis (●), Hamptoniella (⁃), Capsospongia (+), Crumillospongia (□), Fieldospongia (×), Hazelia (○),Wapkia (◆), Takakkawia (*), Vauxia (▴), Pirania (○), Verruculina (▾), Rhoptrum (●), Ozotrachelus (■), Vaceletia (▴), Jereopsis (▾), Thectardis (*).

Slopes of the correlation of osculum area (OSA) to surface area (SA) comparing modern and fossil forms. Slopes are plotted on log-transformed data. CI, confidence interval.

Finally, we compared the slope of the OSA/SA for the putative sponge Thectardis avalonensis (Clapham et al. Reference Clapham, Narbonne, Gehling and Anderson2004) to all hexactinellids and all demosponges and found it to be different from that of all Hexactinellida (ꭓ2 = 10.56, p < 0.05), but not different from that of all Demospongiae (ꭓ2 = 0.01, p = 0.89) (Fig. 5F).
Discussion
The Pump “Character” of Extant Sponges
A relationship between the total pumping activity of a sponge and the volume of a sponge has long been suggested (Reiswig Reference Reiswig1971a, Reference Reiswig1975a), indicating that sponges function as volume-dependent pumps. Recent work has confirmed this morphometric relationship, showing that the ratios of osculum diameter to spongocoel base (McMurray et al. Reference McMurray, Pawlik and Finelli2014) and to volume (Goldstein et al. Reference Goldstein, Riisgård and Larsen2019; Kealy et al. Reference Kealy, Busk, Goldstein, Larsen and Riisgård2019; Morganti et al. Reference Morganti, Ribes, Yahel and Coma2019) are the major determinants of sponge pumping rate. After volume scaling, smaller sponges tend to pump less water than bigger sponges (Morganti et al. Reference Morganti, Ribes, Yahel and Coma2019) and multi-oscular sponges pump as a population of single-osculum (“module”) sponge units (Kealy et al. Reference Kealy, Busk, Goldstein, Larsen and Riisgård2019). Furthermore, scaling is such that the excurrent flow from a sponge can be determined by the area of the osculum (Bidder Reference Bidder1923; Morganti et al. Reference Morganti, Ribes, Moskovich, Weisz, Yahel and Coma2021), which allows these metrics to be effectively used to extrapolate sponge pumping rates in situ (Morganti et al. Reference Morganti, Ribes, Moskovich, Weisz, Yahel and Coma2021).
Our analyses take these findings one step further. We show that the sponge pump (excurrent speed and flow rate) is directly proportional to the number of choanocyte chambers, and that the sponge pump is also directly proportional to a ratio we call the OSA/SA, a proportion of the excurrent flow area (the area of the osculum) to incurrent filtration area (the sponge surface area). The available data therefore support the idea that the OSA/SA ratio reflects the number of pumping units in a sponge. We found that for a range of individuals of different sizes, the OSA/SA metric is characteristic for each sponge class, which suggests that each class has distinct pumping capabilities constrained by the structure of the aquiferous system. Finally, we illustrate that this metric is conserved in fossils of the same classes of sponges, and we can separate out, by class, well-described fossils of sponges from two extremes of the Phanerozoic, Cambrian (Miaolingian Epoch), Paleogene (Eocene Epoch) and recent Quaternary (Holocene Epoch). Applying the same approach to fossils of putative sponges could therefore provide a powerful tool for classifying a fossil as a sponge or not, as we show using one test on the putative sponge fossil from the Ediacaran, T. avalonensis.
The Sponge Pump and Body Wall Thickness
The scaling of excurrent flow with osculum area is a straightforward measure of the sponge pump, and it seems surprising that it should hold true across the vast range of sponge morphologies and modes of feeding. For example, it might be thought that the excurrent flow would depend on wall thickness, because a thick wall should provide more volume for choanocyte chambers. This was considered by Kealy et al. (Reference Kealy, Busk, Goldstein, Larsen and Riisgård2019), who pointed out that it has been shown that the pump unit is the individual choanocyte (Asadzadeh et al. Reference Asadzadeh, Larsen, Riisgård and Walther2019). Thick-walled sponges may have more chambers, but smaller chambers, and thus a similar number of pump units per volume (Ludeman et al. Reference Ludeman, Reidenbach and Leys2017). For example Geodia barretti, which is a very thick-walled high microbial abundance (HMA) sponge, has a lower chamber density due to the microbe-packed mesohyl and correspondingly filters less volume of water per unit of time compared with an equivalent-shaped low microbial abundance (LMA) sponge (Weisz et al. Reference Weisz, Lindquist and Martens2008). In general, HMA sponges tend to be thicker, with a denser mesohyl and a lower volume-specific pumping rate. We found that chamber density also did not vary significantly with surface area (Supplementary Fig. 4). This latter outcome suggests that the sponge form is highly constrained and goes some way to explaining why the filter-feeding body plan of sponges is apparently unchanged over so many millions of years.
The geometry of the sponge constrains the pump through the principle of continuity of flow (Vogel Reference Vogel1994). In particular, the constraint comes from the proportion of the incurrent to the excurrent area. The incurrent area is the combined area of the ostia. This metric is generally not accessible in fossils, but we can assume that it is directly proportional to the external surface area as seen in modern species. One caveat concerning these relationships is the necessary inadequacy of surface area calculations, as all measurements require assumptions and idealizations of sponge true shape. This bias might have a greater influence in some shapes over others, but for species that are closely conical, tubular, or spherical, error can be largely ignored. Even though the best-preserved and most complete specimens were included for this study, fossilization may also add error due to tectonic deformation, and specimens may have been preserved at different stages of decay. Nevertheless, despite these assumptions and uncertainties, the relationship of osculum area to surface area seems to hold across a great range of morphologies of extant and fossil genera.
The Value of OSA/SA over Volume as a Metric for Other Sponge Shapes and Classes
Traditionally, morphological studies have used volume as a proxy for mass. Nevertheless, volume is a difficult metric to obtain even for modern specimens (McMurray et al. Reference McMurray, Pawlik and Finelli2014; Strehlow et al. Reference Strehlow, Pineda, Duckworth, Kendrick, Renton, Abdul Wahab, Webster and Clode2017; Goldstein et al. Reference Goldstein, Riisgård and Larsen2019), and if not measured directly, the analysis requires assumptions about the density of the sponge tissue, which can vary significantly between LMA and HMA sponges (Reiswig Reference Reiswig1971a, Reference Reiswig1975b; Weisz et al. Reference Weisz, Lindquist and Martens2008; Ludeman et al. Reference Ludeman, Reidenbach and Leys2017). Because volume is length cubed, the error in volume is three times larger than the error that arises from measured length. On the other hand, a linear dimension such as length alone can overlook the scalar differences from two different shapes of the same length (Corruccini Reference Corruccini1987; Junger et al. Reference Junger, Falsetti and Wall1995). Surface area has the advantage of having the same units as osculum cross-sectional area, resulting in a dimensionless ratio, the OSA/SA, which can be readily compared among fossil and modern individuals of all sizes and shapes.
However, even a simplified shape ratio like this has its complications. The accurate calculation of surface area is not an easy task, and it is particularly challenging in sponges with crenulations and those with serious deviations from ideal shapes, and yet with a big enough dataset, the approximations of ideal shapes still converge on a class-specific shared slope. While the OSA/SA ratio has a narrow range in a wide diversity of modern sponges, the range is large when fossils are included. Nevertheless, we found that the slope of this metric is distinctive for both demosponges and hexactinellids for which detailed morphometric data were available. The differences in slopes are not too surprising, given the marked differences in morphology between the two sponge classes. The syncytial tissue of hexactinellids supports very large acellular flagellated chambers and makes for a very open aquiferous system, often with very large oscula. In comparison, the cellular tissue of demosponges supports comparatively much smaller choanocyte chambers, narrower canals, and a vast range of oscula morphologies.
It is noteworthy that for the few species of Calcarea we studied, the slope of the OSA/SA was distinct from that of both demosponges and hexactinellids, despite being tubular (or conical) like hexactinellids. No homoscleromorph sponges were included in this analysis, but our finding that there is a class-specific slope predicts that the slope of the OSA/SA for Homoscleromorpha will be distinct from that of the other classes. To be certain that our approximations of shape did not influence the relationships we found, we tested the influence of the selected shape for surface area approximation by running the test on datasets using the cylinder, spheres, frustum, and cones or only cylinders and spheres. The overall the statistics and conclusions remained the same, suggesting that the test is robust.
The Sponge Character in the Fossil Record
Sponges are one of the first animal groups to diverge from the metazoan lineage; however, their time of origin is not resolved, partly because of the lack of undisputed fossils at the time that molecular clocks estimate their origin (Wörheide et al. Reference Wörheide, Dohrmann, Erpenbeck, Larroux, Maldonado, Voigt, Borchiellini, Lavrov, Becerro, Uriz, Maldonado and Turon2012; Ryan et al. Reference Ryan, Pang, Schnitzler, Nguyen, Moreland, Simmons, Koch, Francis, Havlak, Smith, Putnam, Haddock, Dunn, Wolfsberg, Mullikin, Martindale and Baxevanis2013; Whelan et al. Reference Whelan, Kocot, Moroz and Halanych2015; Feuda et al. Reference Feuda, Dohrmann, Pett, Philippe, Rota-Stabelli, Lartillot, Wörheide and Pisani2017). Molecular clock estimates place the origin of animals at 800 Ma, and the oldest known sponge at 535 Ma (Antcliffe et al. Reference Antcliffe, Callow and Brasier2014; Schuster et al. Reference Schuster, Vargas, Knapp, Pomponi, Toonen, Erpenbeck and Wörheide2018; Sperling and Stockey Reference Sperling and Stockey2018). Because fossils are necessary to time calibrate the molecular clock, it is important to have an accurate as possible interpretation of the fossil record. Also needed are methods to combine morphological and molecular data to integrate fossils into divergence time analysis (Peterson and Butterfield Reference Peterson and Butterfield2005). A handful of Precambrian fossils have been proposed as potential pre-metazoan, “sponge-like” animals, which could close this gap (Clapham et al. Reference Clapham, Narbonne, Gehling and Anderson2004; Maloof et al. Reference Maloof, Rose, Beach, Samuels, Calmet, Erwin, Poirier, Yao and Simons2010; Brain et al. Reference Brain, Prave, Hoffmann, Fallick, Botha, Herd, Sturrock, Young, Condon and Allison2012; Yin et al. Reference Yin, Zhu, Davidson, Bottjer, Zhao and Tafforeau2015; Turner Reference Turner2021).
Recent paleontological findings suggest the presence of early metazoans in the Ediacaran Period. Both indirect evidence, such as interpreted bilaterian ichnofossils ca. 555 Ma (Evans et al. Reference Evans, Hughes, Gehling and Droser2020), and three-dimensional preservation of Namacalathus hermanastes suggest a minimum date for the lophotrochozoan clade at ca. 560 Ma (Shore et al. Reference Shore, Wood, Butler, Zhuravlev, McMahon, Curtis and Bowyer2021). If these findings are corroborated with further observations, the lack of undisputable sponge fossils during this interval (800–560 Ma) is puzzling, unless the environment was not conducive to the preservation of soft tissue and assuming that early sponges lacked a mineral skeleton (Antcliffe et al. Reference Antcliffe, Callow and Brasier2014; but see Nadhira et al. Reference Nadhira, Sutton, Botting, Muir, Gueriau, King, Briggs, Siveter and Siveter2019). On the other hand, molecular phylogenies suggest a deep Cryogenian divergence for crown group Porifera, implying that spiculate sponges should be present in the late Neoproterozoic (Cryogenian–Ediacaran); but so far none fits the criteria proposed by Antcliffe et al. (Reference Antcliffe, Callow and Brasier2014), who argue that the earliest sponge spicules do not appear until well into the Cambrian at 535 Ma.
The three criteria proposed by Antcliffe et al. (Reference Antcliffe, Callow and Brasier2014) refer to character, diagnosis, and time constraints, that is, the characters used should be useful to identify sponges, they should be present in the fossil, and the age of the rocks should be well constrained. There are three body-fossil candidates of unknown affinity to which these criteria could be applied: (1) Otavia antiqua from the Otavi and Nama Groups, with the oldest occurrence in the Okavuvu Formation in Namibia, is dated at 760 Ma (Brain et al. Reference Brain, Prave, Hoffmann, Fallick, Botha, Herd, Sturrock, Young, Condon and Allison2012); (2) Eocyathispongia qiania from the Doushantou Formation in central Guizhou, China, dated at 600 Ma, is a single specimen folded within (Yin et al. Reference Yin, Zhu, Davidson, Bottjer, Zhao and Tafforeau2015); and (3) T. avalonensis from the Mistaken Point and Drook Formations, dated at 575 Ma, is a cone-shaped organism with a putative opening at the top (Clapham et al. Reference Clapham, Narbonne, Gehling and Anderson2004).
Otavia is a 0.3 to 5 mm organism with openings of highly irregular morphology that are dispersed throughout the body. It has no clear anchoring point as would be expected for a sessile animal, and so its morphology most readily resembles a testate amoeba or even abiogenic calciphosphate grains (Porter and Knoll Reference Porter and Knoll2000; Antcliffe et al. Reference Antcliffe, Callow and Brasier2014). Eocyathispongia is even smaller than Otavia, reaching only 1.2 mm across. It has been likened to a sponge because of inner cavities that open to a tube with an osculum-like aperture (Yin et al. Reference Yin, Zhu, Davidson, Bottjer, Zhao and Tafforeau2015). Yet the folded shape is unlike sponges, as it unnecessarily minimizes the area available for feeding, and although the cavities are proposed as chambers (Yin et al. Reference Yin, Zhu, Davidson, Bottjer, Zhao and Tafforeau2015), it lacks any obvious openings that might be true ostia as opposed to gaps in a testate amoeba (Botting and Muir Reference Botting and Muir2018). Moreover, such “honeycomb” structures have been reported in a testate amoeba cast resulting from mineral precipitation (Porter and Knoll Reference Porter and Knoll2000). From the morphometric standpoint, there is only one specimen, which makes any further analysis of dimensions impossible. In contrast, there are tens of specimens of T. avalonensis, all of which are cones of different sizes. Sperling et al. (Reference Sperling, Peterson and Laflamme2011) use a length-to-width ratio assuming a conical shape to suggest that Thectardis has poriferan affinity, but others suggest that Thectardis is instead a taphomorph of the late decay stage of other rangeomorphs such as Charniodiscus (Antcliffe et al. Reference Antcliffe, Callow and Brasier2014), like the ivesheadiomorphs (Liu et al. Reference Liu, McIlroy, Antcliffe and Brasier2011).
If Thectardis is a taphomorph, we would expect to find preservational stages from Charniodiscus to Thectardis, but there is no evidence of this taphonomic succession and more importantly, based on morphology, Thectardis is never associated with remnants of a holdfast that are typically the most decay-resistant element of the rangeomorphs. In addition, Thectardis has sharp angles that are not consistent with the soft angles shown by Charniodiscus, and no taphonomic process has been described that could potentially alter a specimen geometry in this way. A paleoecological analysis to infer ecological interactions in sessile organisms, which can help distinguish taphomorphs from true taxa, showed that Thectardis was the only taxon lacking interspecific interactions or associations (Mitchell and Butterfield Reference Mitchell and Butterfield2018). This lack of associations is not based on the low abundance of Thectardis relative to the rangeomorphs, as similarly abundant rangeomorphs were within the model (e.g., Hiemalora and Bradgatia). This ecological disparity is consistent with Thectardis having a substantially different feeding mode than the osmotrophic feeding typical of the Rangeomorpha.
One suggestion is that some Ediacaran fauna may have fed via symbioses using microbes associated with the surface sediments (McIlroy et al. Reference McIlroy, Dufour, Taylor and Nicholls2021). While that is a valid option, Thectardis is also an ideal candidate to test the effectiveness of the OSA/SA as a metric of sponge pump character. The ratio of width to length of the conical organism means there would be a larger incurrent than excurrent area. The OSA/SA ratio for Thectardis was considerably higher (0.25) than that of modern demosponges (0.01), but it lay within the range of the Cambrian demosponge genera Hazelia and Hamptoniella (0.1–0.6) and the calcarean Eiffelospongia (0.2–0.45). Also, the slope of the OSA/SA ratio of Thectardis specimens was not statistically different from the slope of that for Demospongiae, which suggests that Thectardis could indeed have been a sponge, sharing the gross morphometrics and the pump character of demosponges. The minimum age for Thectardis, however, is 575 Ma, so although this could bring the fossil record and the molecular predictions a bit closer, a large fossil gap still remains to be explained. The OSA/SA is another line of evidence for use in studying the affinity of Porifera with putative fossils and for establishing a basis for future palaeoecological reconstructions.
Implications of the Sponge Pump Character for the Evolution of Sponges
The fact that a dimensionless ratio of very few morphological characters can predict sponge excurrent speed illustrates how tightly constrained the sponge body plan is. It is perhaps surprising that such a diversity of sponge types exist (Hooper and Van Soest Reference Hooper and Van Soest2002; Van Soest et al. Reference Van Soest, Boury-Esnault, Vacelet, Dohrmann, Erpenbeck, De Voogd, Santodomingo, Vanhoorne, Kelly and Hooper2012). Short of losing choanocyte chambers for carnivory (Vacelet and Boury-Esnault Reference Vacelet and Boury-Esnault1995), sponges are tied to a tight set of parameters to maintain their pump character. But having a dimensionless ratio that can predict the sponge pump is especially important when it comes to interpreting body fossils and their ecology. Our analysis of a small set of middle Cambrian and Paleogene sponges (Table 1) shows that form is tightly correlated with the OSA/SA ratio over a range of sizes, and modern sponge data show that osculum area is positively correlated with excurrent flow (McMurray et al. Reference McMurray, Pawlik and Finelli2014; Morganti et al. Reference Morganti, Ribes, Yahel and Coma2019). This means that the dimensions of modern sponges are probably very similar to early Cambrian forms, and it implies that the OSA/SA ratio might also be used to estimate the excurrent velocity of known sponge fossils for which we only have osculum size and surface area. In addition, from excurrent velocity, it might also be possible to estimate the effect of sponges on the water column in paleoecological contexts, and from that it might be possible to determine whether sponge fossils were HMA or LMA and in turn provide insight into the dissolved and particulate content of the oceans in which those sponges lived (Reiswig Reference Reiswig1971b, Reference Reiswig1981; de Goeij et al. Reference de Goeij, Moodley, Houtekamer, Carballeira and van Duyl2008, Reference de Goeij, De Kluijver, Van Duyl, Vacelet, Wijffels, De Goeij, Cleutjens and Schutte2009, Reference de Goeij, van Oevelen, Vermeij, Osinga, Middelburg, de Goeij and Admiraal2013; Weisz et al. Reference Weisz, Lindquist and Martens2008).
Conclusions
The correlations between morphology and pumping rates shown here confirm that the character that best represents a sponge is its total osculum cross-sectional area (OSA), because it is proportional to the total surface area of a sponge (Bidder Reference Bidder1923; Goldstein et al. Reference Goldstein, Riisgård and Larsen2019; Kealy et al. Reference Kealy, Busk, Goldstein, Larsen and Riisgård2019; Morganti et al. Reference Morganti, Ribes, Moskovich, Weisz, Yahel and Coma2021). The total OSA scales allometrically with sponge size and its excurrent speed and can be considered the main functional trait of a sponge. The ratio of the total OSA to total sponge surface area seems to be conserved across a wide range of sponges, justifying its use as a morphometric character for most members of the Porifera. The ratio of osculum cross-sectional area to sponge surface area varies very little in most sponges and is suggested to be a good indicator of elements such as the number of choanocyte chambers and the pumping rate. This analysis suggests that if sponges are, and always were, pumps, then the first sponges should show this relationship of OSA to SA and a decreasing ratio as size scales up. In this light, the putative sponge fossil Thectardis avalonensis aligns well with the slope of modern demosponges, and its morphology is consistent with an aquiferous-system filter-feeding mechanism.
Acknowledgments
We thank J. B. Caron and the Royal Ontario Museum (ROM) for discussions and access to imagery at the ROM; and A. Pisera (Polish Academy of Sciences) and A. R. Palmer, L. R. Leighton, and J. P. Zonneveld (University of Alberta) for helpful discussion and comments on a draft of this work. We are grateful to E. Matveev for help with data organization. Funding for this research came from an NSERC Discovery Grant to S.P.L.
Data Availability Statement
Data for this study are available at the Education and Research Archive (ERA) at the University of Alberta at: https://doi.org/10.7939/r3-xw9s-8674.


 Open access