

Obesity is an increasing health problem worldwide, especially as it is often associated with a number of risk factors of type 2 diabetes and CVD, such as insulin resistance, dyslipidemia, elevated arterial pressure and chronic low-grade inflammation, all clustering into the metabolic syndrome (MetSynd)( Reference Mottillo, Filion and Genest 1 ). In obese subjects, weight loss cannot be achieved without a reduction in energy intake, leading to a catabolic status, which affects essentially adipose tissues. However, the loss of fat mass during energy restriction is often accompanied by a more or less severe loss of fat-free mass (mostly muscle), especially in subjects with low physical activity( Reference Ballor, Katch and Becque 2 – Reference Weinheimer, Sands and Campbell 5 ). As a consequence, nutritional strategies aiming weight loss should also consider the preservation of muscle as a priority and include nutrients likely to maintain protein homoeostasis.
Among candidate nutrients, there is growing evidence regarding a direct role of n-3 PUFA in protein metabolism. Indeed, in various conditions associated with protein catabolism in rodent models (e.g. ageing, sepsis, starvation, cancer or immobilisation), dietary supplementation with n-3 long-chain PUFA (LC, >18 carbons) has been reported to alleviate, at least partly, the loss of lean/muscle mass, in relation with an improvement in insulin signalling( Reference Kamolrat, Gray and Thivierge 6 – Reference You, Park and Song 11 ). In contrast, the potential effects of n-3 PUFA supplementation on muscle mass preservation during energy restriction have been less investigated, and the results remain conflicting. In a number of studies, obese patients on a low- or very low-energy diet lost fat-free mass, without the protective effect of added n-3 PUFA( Reference Baxheinrich, Stratmann and Lee-Barkey 12 – Reference Thorsdottir, Tomasson and Gunnarsdottir 15 ). In contrast, in obese patients consuming isolipidic diets rich in SFA, n-6 PUFA or n-3 PUFA, all patients lost fat-free mass, but to a lesser extent in those on the n-3 PUFA-rich diet( Reference Kriketos, Robertson and Sharp 16 ). In addition, overweight or obese people often exhibit insulin resistance, and n-3 PUFA have been shown to improve insulin sensitivity in these subjects( Reference Kalupahana, Claycombe and Moustaid-Moussa 17 – Reference Lopez-Alarcon, Martinez-Coronado and Velarde-Castro 19 ). In a first attempt to characterise the effects of n-3 PUFA on muscle protein homoeostasis in a rodent model, we fed energy-restricted rats with diets rich in MUFA, α-linolenic acid (ALA, 18 : 3 n-3, the vegetal precursor of n-3 LC-PUFA) or n-3 LC-PUFA, for 4 weeks. n-3 LC-PUFA supplementation resulted in the highest weight loss, whereas muscle mass was the same in the third group at the end of restriction, suggesting a trend towards a better preservation of muscle mass (relative to body weight) in response to n-3 LC-PUFA( Reference Guelzim, Huneau and Mathe 20 ). This trend was accompanied by a higher activation of the early steps of insulin signalling in the liver (phosphorylation of insulin receptor and insulin receptor substrate-1 (IRS-1)). This increase in insulin sensitivity was associated with the enrichment of both the liver and the muscle with n-3 LC-PUFA, thus supporting the hypothesis of a mechanistic link between changes in membrane fatty acid (FA) composition and insulin sensitivity( Reference Vessby 21 ). However, under our previous experimental conditions, enrichment of the muscle with n-3 LC-PUFA was not paralleled with an enhanced activation of the insulin signalling pathway.
When investigating the potential metabolic regulations by dietary n-3 PUFA, the nature of these PUFA should also be taken into account. Indeed, on the one hand, marine sources of n-3 LC-PUFA may be not sustainable and, on the other hand, some people do not consume fish or fish products because of limited availability, high cost or personal choices. Thus, the possibility that some of the beneficial effects attributed to n-3 LC-PUFA could be achieved by their vegetable precursor ALA has to be considered( Reference Turchini, Nichols and Barrow 22 ). We and others addressed this question in humans or in animal models, and reported beneficial effects of dietary ALA on some markers and risk factors of the MetSynd, including insulin sensitivity( Reference Baxheinrich, Stratmann and Lee-Barkey 12 , Reference Fedor and Kelley 23 – Reference Poudyal, Panchal and Ward 28 ). Of note, with the exception of two of our previous studies( Reference Guelzim, Huneau and Mathe 20 , Reference Tesseraud, Chartrin and Métayer-Coustard 29 ), mechanistic studies on the effect of n-3 FA on protein metabolism used LC-PUFA only. In the growing chicken, dietary ALA enhanced the development of the Pectoralis muscle and improved insulin sensitivity in this muscle( Reference Guelzim, Huneau and Mathe 20 ). In contrast, in energy-restricted rats, we failed to show an effect of ALA on insulin sensitivity as well as on the preservation of muscle mass( Reference Guelzim, Huneau and Mathe 20 ). However, it remains possible that the level and/or duration of energy restriction were not sufficient to induce a significant loss of muscle mass in our energy-restricted rats, as shown previously( Reference Chevalier, Bos and Azzout-Marniche 30 ). Besides, because of the time needed for a diet-induced modification of tissue FA composition to occur, the hypothesis that providing n-3 PUFA before energy restriction would be more efficient than during energy restriction only has to be considered( Reference Munro and Garg 14 ).
The aim of the present study was to further investigate the effects of n-3 PUFA (ALA or LC-PUFA) on protein metabolism during energy restriction in rats, by focusing on their potential role as co-regulators of the insulin signalling cascade in the muscle. To overcome the inconclusive results of the previous study, significant changes in our insulin-resistant rat model were made. First, the rats used in the present study were adults (6-month old) in order to prevent mitigation of restriction-induced muscle loss due to growth-associated anabolic drive. Second, rats were fed diets rich in MUFA, ALA or LC n-3 PUFA, not only during the restriction phase but also during the induction of insulin resistance, in order to modify the FA composition of phospholipids in the muscle cell membranes before energy restriction. Finally, both the duration and the level of energy restriction were increased, and a non-restricted control group was included. These changes to the previous experimental design enabled us to ultimately unveil some beneficial effects of n-3 PUFA on the prevention of muscle loss during energy restriction, in relation to an enhancement in insulin sensitivity.
Methods
Animals
For the present study, 24-week-old male Wistar rats (forty-eight rats) (Harlan), initially weighing 475 (sem 28) g, were individually housed in a room maintained at 23±1°C with an artificial 12 light–12 h dark cycle (lights on at 05.00 hours). The cage floor was wired to prevent rats from eating faeces and litter, and metal artifacts (rings, balls) were provided for environmental enrichment. They were fed ad libitum a standard pelleted diet (SAFE A04, Teklad 20-18S; Harlan) and acclimated to local conditions for 1 week. They had free access to water at all times. Body weight was monitored weekly throughout the experimental period. The study was performed according to the European directive for use and care of laboratory animals (2010/63/UE) and the ARRIVE (Animal Research: Reporting of In Vivo Experiments) guidelines, and local animal ethics committee approval and consent of the ministerial committee for animal experimentation (ref. 00734.01) were obtained. The group size was determined according to a power test for insulin concentration. It was higher than what was used in previous studies, including ours, for characterisation of the main outcomes such as body composition and plasma biomarkers( Reference Guelzim, Huneau and Mathe 20 ).
Diets
All the diets were manufactured by UPAE (INRA). High-oleic sunflower oil, sunflower oil and rapeseed oil were provided by Terres Univia, and fish oil was a gift from Olvéa. During the first period (induction of the MetSynd), three high-fat induction (HFI) diets were designed. These diets were isoenergetic (20·17 kJ/g) and contained (as energy) 15·6 % protein, 54·5 % lipid and 29·9 % carbohydrate (online Supplementary Table S1), but differed in lipids provided, and thus in their FA composition. HFI-OLE diet was rich in MUFA (oleic acid, OLE, 18 : 1 n-9 – essentially), whereas the n-3 FA-rich HFI-ALA and HFI-LC diets were designed to provide similar amounts of n-3 FA (calculated target value 10·3 % of total FA) as ALA or n-3 LC-PUFA, respectively. Besides, oil blends were used to provide the same amount of linoleic acid (LA, 18 : 2 n-6) in the three diets (calculated target value, 20·0 %). The analytical values of the FA profile in the three diets are given in Table 1. For the second period (energy-restriction phase), three high-fat restriction (HFR) diets were designed with the same energy content (19–20 MJ/kg, lipid accounting for 56–58 % energy) and FA profile as in the respective HFI diets. To prevent nutritional deficiencies, protein and micronutrients were increased at each restriction step for the loss of carbohydrate (online Supplementary Table S1). The proportions of protein and micronutrients that were needed at each step were calculated according to the spontaneous food intake during the last week of the induction phase and the restriction level, to ensure that daily intake of these nutrients (in relation to body weight) did not vary along the restriction phase.
Fatty acid composition (mol/100 mol) of the high-fat induction and restriction experimental dietsFootnote *
OLE, diet rich in 18 : 1 n-9; ALA, diet rich in 18 : 3 n-3; LC, diet rich in n-3 long-chain PUFA; ND, not detected (detection limit 0·1–0·2 % of total fatty acids).
* Values are means for aliquots of each diet. Only major or nutritionally important fatty acids are given. Calculated target values were 20·0 % for 18 : 2 n-6 in the three diets, and 10·3 % for 18 : 3 n-3 and long-chain n-3 PUFA in the ALA and LC diets, respectively.
Study design (Fig. 1)
Induction phase
Study design. HFI, high-fat induction diet; HFR, high-fat restriction diet; OLE, diet rich in oleic acid (18 : 1 n-9); ALA, diet rich in α-linolenic acid (18 : 3 n-3); LC, diet rich in n-3 long-chain PUFA (>18 carbons); AL, rats fed ad libitum during both the induction and the restriction phases; R, rats fed ad libitum during the induction phase, and then energy restricted. ![]() , Times of blood sampling;
, Times of blood sampling; ![]() times of killing and dissection.
times of killing and dissection.

Following 1-week adaptation to housing conditions, forty-eight rats were randomly allocated to one of three HFI diets for 4 weeks (twelve rats per group). The average body weight was similar in all groups at the beginning of the induction phase (Fig. 2). Body weight and food intake were monitored weekly. On the first and last days of the induction phase, after an overnight fast, 300 μl blood was collected from the tail vein into Microvette tubes containing heparin (Sarstedt) and centrifuged at 4°C for 10 min at 1700 g for plasma extraction and storage at −80°C.
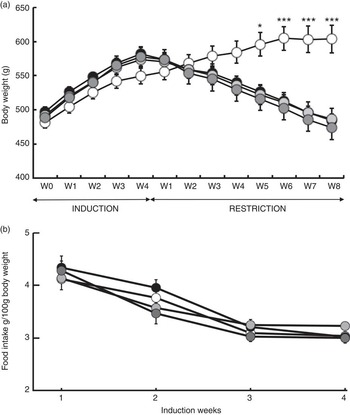
Body gain (g) and food intake (g per 100 g of body weight). (a) Changes in body weight in response to a 4-week ad libitum (AL) induction phase followed by an 8-week energy restriction phase. (b) Changes in food intake and body weight in response to a 4-week food induction. Values are means (twelve rats per group), with their standard errors. * P<0·05 and *** P<0·001 v. the OLE-AL group, according to post hoc Tukey–Kramer analysis. R, restricted; OLE, diet rich in oleic acid (18 : 1 n-9); ALA, diet rich in α-linolenic acid (18 : 3 n-3); LC, diet rich in n-3 long-chain PUFA; W, weeks. ![]() , OLE-AL;
, OLE-AL; ![]() , OLE-R;
, OLE-R; ![]() , ALA-R;
, ALA-R; ![]() , LC-R.
, LC-R.
Restriction phase
Among the twenty-four rats fed the HFI-OLE diet, twelve rats were continued being fed ad libitum (OLE-AL group). To induce weight loss, the thirty-six remaining rats were allocated to their respective HFR diets for 8 weeks (twelve rats in each of the OLE-R, ALA-R and LC-R groups). The mean spontaneous energy intake during the 4th week of the induction period (61·86 (sem 2·09) kJ/100 g body weight) was used to determine the amount of food provided during each week of the restriction period, using the following restriction pattern: 75 % of the spontaneous energy intake during the first restriction week, 60 % during the 2 following weeks and then 50 % during the last 5 weeks. For each rat, the amount of food provided was adjusted every week according to the evolution of body weight during the restriction phase. At the end of 8 weeks of restriction, rats were fasted overnight. After blood samples were collected from the tail vein, rats were deeply anaesthetised by isoflurane inhalation (IsoFlo; Axience). The abdominal cavity was opened, and 1 IU/kg body weight of insulin (Actrapid; Novo Nordisk) – or saline for one rat in each group – was injected into the inferior vena cava. Skin was rapidly incised, and the right Gastrocnemius muscle was exposed. Next, 10 min after insulin injection, a biopsy of the Gastrocnemius muscle was rapidly frozen in liquid N2 and stored at −80°C for the assessment of activation of insulin pathway. Rats were then killed by exsanguination by section of the inferior vena cava, and 2 ml of blood was collected and centrifuged as described above for plasma extraction and storage. Meanwhile, the following organs and tissues were dissected and weighed for the determining body composition: liver, spleen, small intestine, kidneys, heart, visceral adipose tissue and the remaining carcass. The muscles of both the legs (Gastrocnemius, Tibialis anterior, Soleus and the remaining muscles) were also carefully dissected and weighed for assessing the changes in muscle mass. Finally, samples of the right Gastrocnemius muscle were snap-frozen in liquid N2 and stored at −80°C for determining mRNA levels, whereas the remaining muscle samples were frozen at −20°C for determining lipid content and FA composition. Dissections were conducted in a blinded manner.
Analyses
Chemical analyses
Diet and muscle lipids
Lipids of the Gastrocnemius muscle were characterised using the Phenotyping Platform (UMR1348 PEGASE). About 100 mg of muscle lipid was diluted in 500 µl of chloroform and placed in a pre-packed silica column (Silica Sep Pak Cartridges; Waters SAS) for separating neutral and polar lipids( Reference Juaneda and Rocquelin 31 ). Neutral lipids were first eluted with petroleum diethyl ether, and polar lipids were thereafter recovered by eluting the Sep Pak column with methanol. The solvents were evaporated, and the lipids were weighed and analysed after methylation. Lipids of the diets were also extracted( Reference Folch, Lees and Sloane-Stanley 32 ), and then derivatised by BF3/methanol( Reference Morisson and Smith 33 ). Derivatised FA of the diets and the Gastrocnemius muscle were analysed on a Autosystem XL gas chromatograph (PerkinElmer), equipped with a fused silica gel capillary column (0·25 mm i.d., 330 m), filled with a stationary phase (80 % biscyanopropyl and 20 % cyanopropylphenyl) and by using margaric acid (C17) as the internal standard. The temperature was programmed from 45 to 240°C at 20 to 35°C/min, whereas the injector and detector temperatures were maintained at 220 and 280°C, respectively. Results are expressed as percentages of the total FA content.
Plasma parameters
At the end of both the induction and the restriction phases, glucose concentration was determined immediately on whole blood collected from conscious rats using an Accu-Chek® glucometer (Roche Diagnostics). Plasma TAG and cholesterol concentrations were determined by colorimetric enzymatic methods using the kits provided by Randox and BioMérieux, respectively( Reference Fossati and Prencipe 34 , Reference Richmond 35 ). Plasma insulin was determined by enzyme immunoassay using a specific kit (Mercodia). The homeostasis model assessment of insulin resistance (HOMA) index was calculated using the following formula: (fasting insulin (pmol/l)×fasting glucose (mmol/l))/22·5.
Plasma concentrations of IL-1β and IL-6, plasminogen activator inhibitor-1 (PAI-1), monocyte chemotactic protein-1 (MCP-1) and α2-macroglobulin were determined using multiplexed immunoassays (Merck Millipore) on a Bioplex-200 analyser (Bio-Rad Laboratories).
Proteins involved in insulin signalling
The following total and phosphorylated proteins were assessed by Western blotting in the Gastrocnemius muscle using specific antibodies provided by Cell Signaling Technology: IRS-1 and phosphorylated-IRS-1 (Tyr895), RAC-α serine/threonine-protein kinase (AKT) or protein kinase B and phosphorylated-AKT (Ser473), mammalian target of rapamycin (mTOR) and phosphorylated-mTOR (Ser2448), and ribosomal protein S6 (S6RP) and phosphorylated-S6RP (Ser240/244).
Gene expression
Total RNA was extracted from the Gastrocnemius muscle samples (150 mg) using Trizol reagent (Invitrogen), and synthesis of complementary DNA (cDNA) was performed using 500 ng of total RNA using a high-capacity cDNA reverse-transcription kit, based on the use of hexamer probes (Applied Biosystems). Target genes were those coding for proteolysis: Fbxo32 (F-box protein 32), MuRF1 (muscle ring finger-1 or E3 ubiquitin protein ligase), Psma1 (proteasome subunit α type 1), Ubb (ubiquitin B), Capn2 (calpain 2), Ctsd (cathepsin D) and InsR (insulin receptor). The primers listed in the online Supplementary Table S2 were used for quantitative PCR on a 7300 real-time PCR system (Applied Biosystems), as described previously(
Reference Chotechuang, Azzout-Marniche and Bos
36
). Primer sequences were designed using Primer ExpressTM (Applied Biosystems) software and were from Eurogentec. Gene expression was determined using the
 $$2^{{\minus \Delta C_t} }} $$
formula using hypoxanthine phosphoribosyltransferase (Hprt) as the reference (ΔC
t
=C
t
target gene–C
t
Hprt).
$$2^{{\minus \Delta C_t} }} $$
formula using hypoxanthine phosphoribosyltransferase (Hprt) as the reference (ΔC
t
=C
t
target gene–C
t
Hprt).
Calculations and statistics
Statistical analysis of the data collected at the end of the restriction phase was carried out using two-way ANOVA with energy intake (i.e. restriction v. ad libitum) and lipid source nested in energy as fixed effects (GLM procedure, SAS 9.1; SAS Institute). When possible, data collected at the end of the induction period were introduced in the model as co-variables to control for the subject effect. For HOMA, plasma glucose, insulin, TAG and cholesterol, post-induction values were used as co-variables for the analysis of the corresponding post-restriction data. Body weight at the end of the induction phase was used as a co-variable for the analysis of all data related to post-restriction body composition.
In order to control for family-wise error rate, Tukey–Kramer adjustments were used for post hoc analysis of least-square means.
Results
Body weight and body composition
During the 4 weeks of induction of the MetSynd, weekly body weight gain and food intake did not significantly differ between the four groups (Fig. 2). Total body weight gain averaged 80 (sem 6) g, and the mean food intake during the last week was 61·86 (sem 2·09) kJ/100 g body weight. During the restriction phase, the OLE-AL group, fed ad libitum, continued to gain weight until the 5th week and then stabilised (+9 % compared with mean body weight at the end of the induction period). In response to food restriction, all restricted rats lost weight, without significant difference between groups, and returned to their initial values (start of the induction phase) at the end of the restriction phase (Fig. 2). The FA composition of the diets had no significant effect on weight loss in restricted rats, whatever the restriction week.
Compared with the OLE-AL group, the absolute weights of adipose tissues and organs such as the liver, spleen, small intestine, kidneys and heart were affected by energy restriction in the three restricted groups, with no effect of dietary FA composition (Table 2). This was also true for the relative weight, as expressed as percentage of body weight (data not shown). In contrast, the absolute weight of carcass was affected by both energy restriction and FA composition of the diet. Indeed, carcass weight in the LC-R group was 5 % lower than that observed in the ALA-R group. No difference was observed between groups when carcass weight was expressed as percentage of body weight (data not shown). With regard to leg muscles, when compared with the OLE-AL group, the weight of the Gastrocnemius and Tibialis anterior muscles were significantly lower in the OLE-R group, but not in the ALA-R and LC-R groups. These effects were also observed when considering not only individual muscles but also all muscles of the two legs taken as a whole (Table 2). In contrast to other muscles, the weight of the Soleus muscle was significantly lower in the ALA-R group than in the OLE-AL group, but was not affected in the OLE-R and LC-R groups (Table 2).
Body composition (g) after an 8-week dietary restriction (Mean values with their standard errors, twelve rats per group using ANCOVA analysis with body weight at the start of energy restriction as a co-variable)

OLE, diet rich in oleic acid (18 : 1 n-9); AL, ad libitum; R, restricted; ALA, diet rich in α-linolenic acid (18 : 3 n-3); LC, diet rich in n-3 long-chain PUFA; FA, fatty acid; carcass, remaining part of the body after removal of head, tail, paws, skin, internal organs and all adipose tissues; VAT, visceral adipose tissue including epididymal, mesenteric, retroperitoneal and perirenal adipose tissues; m., muscle; R, right; L, left.
a,b,c Mean values within a line with unlike superscript letters were not significantly different (P<0·05), according to post hoc Tukey–Kramer analysis.
Muscle lipid content and fatty acid composition
Lipid content (Table 3)
Lipid content of the Gastrocnemius muscle (Mean values with their standard errors, twelve rats per group)
OLE, diet rich in oleic acid (18 : 1 n-9); AL, ad libitum; R, restricted; ALA, diet rich in α-linolenic acid (18 : 3 n-3); LC, diet rich in n-3 long-chain PUFA; FA, fatty acid.
a,b Mean values within a line with unlike superscript letters were not significantly different (P<0·05), according to post hoc Tukey–Kramer analysis.
Absolute (mg per muscle) or relative (mg per 100 mg muscle) values of both polar and neutral lipids did not differ in the OLE-R and LC-R groups, compared with the OLE-AL group. In contrast, these values were lower in the ALA-R group (P=0·0546 only for the absolute content of polar lipids). Despite the fact that the respective proportions of neutral and polar lipids did not differ significantly between the four groups, polar lipids were quantitatively less affected than neutral lipids in the ALA-R group.
Phospholipid fatty acid (online Supplementary Table S3)
Taken as a whole, the relative proportions of SFA (33–35 %), MUFA (15–16 %) and PUFA (49–51 %) were not, or only marginally, affected by energy restriction or dietary FA composition. With regard to the three major SFA and MUFA, the OLE-R group did not differ from the OLE-AL group, whereas the muscle samples of the of ALA-R group contained more 16 : 0 and less 18 : 0, and that of the LC-R group contained slightly more 16 : 0 and slightly less 18 : 0 and 18 : 1 n-9. With regard to the relative proportions of n-3 and n-6 PUFA, which are provided directly by the diet or synthetised from dietary precursors, the OLE-AL and OLE-R groups (of which dietary lipids had the same FA composition) differed only by a higher LA content in the OLE-R group. Muscle phospholipids of the ALA-R and LC-R groups exhibited a higher proportion of LA and a lower proportion of n-6 LC derivatives compared with the OLE-AL and OLE-R groups. Those of the ALA-R group were enriched not only in ALA, but also in 22 : 5 n-3 and 22 : 6 n-3, whereas those of the LC-R group were enriched in all n-3 LC derivatives (20 : 5, 22 : 5 and 22 : 6).
Neutral lipid fatty acids (online Supplementary Table S4)
The relative proportions of SFA, MUFA and PUFA were affected by both energy restriction and dietary FA. However, the FA profile was identical in the OLE-AL and OLE-R groups, suggesting that the significant effect of energy restriction mostly reflects the specific FA composition of the diet in two out of three restricted groups. Indeed, neutral lipids of the ALA-R group differed mostly from those of the OLE-AL group by a lower proportion of OLE (a major FA) and a higher proportion of ALA, 22 : 5 n-3 and 22 : 6 n-3. Neutral lipids of the LC-R group differed from those of the OLE-AL group by a decrease in OLE and 20 : 4 n-6 and an increase in ALA and all n-LC derivatives.
Plasma metabolic and inflammatory markers
During the induction phase, glycaemia, insulinaemia, HOMA and cholesterolaemia increased significantly in all groups, whereas triglyceridemia increased in the OLE-AL, OLE-R and ALA-R groups, but not in the LC-R group (Table 4). At the end of the induction phase, glycaemia, insulinaemia and HOMA did not differ between groups, whereas final concentrations of TAG and cholesterol were lower in the LC-R group than in the other three groups. During the restriction phase, the OLE-AL group showed a further increase in insulinaemia and HOMA, whereas plasma concentrations of glucose, TAG and cholesterol did not vary (Table 5). In response to energy restriction, insulinaemia, triglyceridemia and HOMA decreased in the three restricted groups, whereas glycaemia decreased in the ALA-R group only, and cholesterolaemia was not affected. As a consequence, final concentrations of insulin and TAG, as well as HOMA, were lower in the three restricted groups compared with the OLE-AL group, whereas final concentrations of glucose and cholesterol were similar in all the groups.
Effect of high-fat diets on plasma biomarkers during the 4-week induction phase (Mean values with their standard errors, twelve rats per group before (initial values) and at the end (final values) of the 4-week induction phase on a high-fat diet)Footnote †

HOMA, homeostasis model of insulin resistance; OLE, diet rich in oleic acid (18 : 1 n-9); AL, ad libitum; R, restricted; ALA, diet rich in α-linolenic acid (18 : 3 n-3); LC, diet rich in n-3 long-chain PUFA; FA, fatty acid.
a,b Mean values within a line with unlike superscript letters were not significantly different (P<0·05), according to post hoc Tukey–Kramer analysis.
* P<0·05, ** P<0·01, *** P<0·001 between initial and final values.
† Final values were compared after adjustment for the corresponding initial values used as a co-variable.
Effect of energy restriction on plasma biomarkers (Mean values with their standard errors, twelve rats per group before (initial values) and at the end (final values) of the 4-week induction phase on a high-fat diet)Footnote †

HOMA, homeostasis model of insulin resistance; OLE, diet rich in oleic acid (18 : 1 n-9); AL, ad libitum; R, restricted; ALA, diet rich in α-linolenic acid (18 : 3 n-3); LC, diet rich in n-3 long-chain PUFA; FA, fatty acid.
a,b Mean values within a line with unlike superscript letters were not significantly different (P<0·05), according to post hoc Tukey–Kramer analysis.
* P<0·05, ** P<0·01, *** P<0·001 between initial and final values.
† Final values were compared after adjustment for the corresponding initial values used as a co-variable.
At the end of the restriction period, plasma concentrations of inflammatory markers (IL-1β, IL-6 and PAI-1) were below the detection threshold or too low to provide reliable means (data not shown). Values for fibrinogen, MCP-1 and α2-macroglobulin in the three restricted groups did not differ from those in the OLE-AL group (data not shown).
Insulin signalling pathway
The relative phosphorylation levels of Gastrocnemius muscle proteins involved in insulin signalling were assessed by Western blotting in response to an insulin injection. The relative expression of InsR (insulin receptor) mRNA was also estimated by quantitative PCR (qPCR). When compared with saline-injected rats, the muscle insulin response, as assessed by the proportion of phosphorylated proteins of the insulin cascade, was increased in all groups for IRS1 and AKT. Only a trend was observed in some rats for mTOR, whereas insulin injection had a very weak effect, if any, on S6RP (online Supplementary Fig. S1).
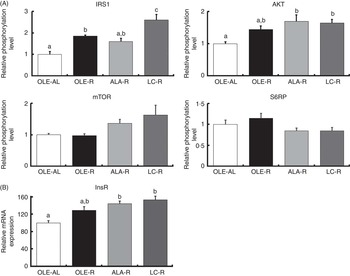
Thus, after 12 weeks on a hyperlipidic diet, rats remained sensitive to insulin stimulation, whether ad libitum or restricted. When compared with the ad libitum condition, energy restriction enhanced the phosphorylation of IRS1 and AKT (P<0·001 and P=0·006, respectively), as well as InsR mRNA levels (P<0·001) (Fig. 3). When compared with the OLE-AL group, the phosphorylation levels of IRS1 and AKT, as well as the InsR mRNA level, were significantly increased in the LC-R group. The same pattern was observed in the ALA-R group, except for IRS1 phosphorylation. Regarding the OLE-R group, only IRS1 phosphorylation was significantly increased. In contrast, the phosphorylation levels of mTOR and S6RP were not significantly affected by energy restriction, whatever the diet.
Insulin signalling pathway in the Gastrocnemius muscle from rats receiving an injection of insulin at 1 IU/kg. (A) Relative phosphorylation level of proteins involved in insulin signalling. (B) Relative expression of insulin receptor mRNA. Phosphorylated protein contents were normalised to total (non-phosphorylated+phosphorylated) protein contents. Values are percentage of mean controls (eleven rats per group), with their standard errors. a,b,c Mean values with unlike letters were not significantly different (P<0·05), according to post hoc Tukey–Kramer analysis. IRS1, insulin receptor substrate; AKT, protein kinase B (PKB); mTOR, mammalian target of rapamycin; S6RP, S6 ribosomal protein; InsR, insulin receptor; AL, ad libitum; R, restricted; OLE, diet rich in oleic acid (18 : 1n-9); ALA, diet rich in α-linolenic acid (18 : 3n-3); LC, diet rich in n-3 long-chain PUFA.
Markers of proteolysis (Fig. 4)
Relative expression of Gastrocnemius muscle mRNA involved in proteolytic systems. Fbxo32 (or MAFbx) and Murf1 encode proteins involved in the ubiquitin–proteasome system. Ctsd (cathepsin D) encodes a protein involved in the lysosomal system. Capn2 (calpain 2) encodes a protein involved in the calcium-dependent system. Values are percentage of mean controls (twelve rats per group), with their standard errors. a,b Mean values with unlike letters were not significantly different (P<0·05), according to post hoc Tukey–Kramer analysis. AL, ad libitum; R, restricted; OLE, diet rich in oleic acid (18 : 1 n-9); ALA, diet rich in α-linolenic acid (18 : 3 n-3); LC, diet rich in n-3 long-chain PUFA (>18 carbons).
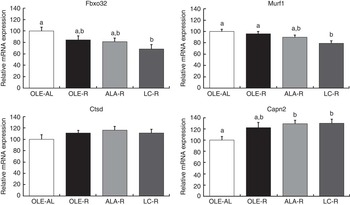
As the muscle proteins are essentially degraded by the ubiquitin–proteasome system, the relative expressions of Fbxo32, Murf1, Psma1 and Ubb mRNA were first assessed in the Gastrocnemius muscle by qPCR. Transcript levels of Fbxo32 and Murf1 genes were globally decreased by energy restriction (P=0·0168 and P=0·0300, respectively). However, according to post hoc analysis, and when compared with the OLE-R group, the decrease was significant only in the LC-R group (−30 and −20 % for Fbxo32 and Murf1, respectively), whereas those measured in the OLE-R and ALA-R groups were unchanged. There was no difference in the expression levels of Psma1 and Ubb transcripts between groups (data not shown). Other proteolytic systems play a minor role in muscle. However, there was an activation of the Ca-dependent system by energy restriction, with regard to the Capn2 mRNA levels (P=0·0039). According to post hoc analysis, this activation was significant in the ALA-R and LC-R groups and not in the OLE-R group. Finally, whatever the energy-restricted group, no change was observed in the transcript levels of the Ctsd gene, involved in the lysosomal system, compared with the OLE-AL group.
Discussion
The aim of the present study was to further investigate the effects of n-3 PUFA (ALA or LC-PUFA) on protein metabolism during energy restriction in rats, by focusing on their potential role as co-regulators of the insulin signalling cascade in the muscle. More specifically, we tested the hypothesis that n-3 PUFA could contribute to maintain muscle mass during energy restriction, through an enhancement of insulin sensitivity. Our previous restrained rat model had not allowed us to confirm this hypothesis( Reference Guelzim, Huneau and Mathe 20 ), which led us to re-think our experimental design for the present study. For this purpose, adult rats were preferred to growing rats and the FA composition of the diets differed not only during the restriction phase but also during the induction period in order to induce larger changes in the FA profiles of the muscles. This improved model allowed us to explore the effects of dietary n-3 PUFA on protein metabolism and insulin sensitivity at the skeletal muscle level, during energy restriction. Besides, a direct comparison of the effect of vegetable and marine sources of n-3 PUFA is now permitted because the same amount of total n-3 FA was provided in the ALA-R and LC-R groups.
Validation of the model
Induction of insulin resistance
The ad libitum provision of three high-fat diets rich in either MUFA (OLE-HFI), ALA (ALA-HFI) or LC-PUFA (LC-HFI) for 4 weeks led to regular body weight gain in all groups (Fig. 2), associated with an increase in blood markers of insulin resistance (glycaemia, insulinaemia and HOMA index) (Table 4), which provided us with a suitable model of insulin resistance. In particular, body weight gain was the same in all groups, which excluded effects of specific dietary FA during the induction of the MetSynd, and precluded confounding factors due to differences in body weight at the start of restriction. Besides, the level of insulin resistance was the same in all groups, which is important for assessing the effects of dietary FA on insulin signalling during energy restriction.
Effects of energy restriction
First, although ad libitum fed rats (OLE-AL group) continued gaining weight, all energy-restricted groups lost body weight, irrespective of the diet, which proved the absence of interaction with dietary FA (Fig. 2). Second, when considering only rats fed the MUFA-rich diet, there was a small (5 %) but significant mass loss in most leg muscles in energy-restricted rats (OLE-R group) as compared with the control ad libitum-fed rats (OLE-AL rats) (Table 2). In previous studies assessing the effects of energy restriction in genetically or nutritionally obese adult rats, body weight loss was not paralleled by muscle mass loss( Reference Chevalier, Bos and Azzout-Marniche 30 , Reference Adechian, Remond and Gaudichon 37 – Reference Jackman, Steig and Higgins 39 ). In the present study, muscle loss was probably the consequence of a longer duration (8 weeks) and a higher severity (up to 50 %) of energy restriction. Third, our experimental conditions resulted in an improvement in insulin sensitivity in response to energy restriction (Table 5). This is consistent with numerous studies in energy-restricted obese subjects, showing that weight loss is associated with an improvement in whole-body insulin sensitivity( Reference Baxheinrich, Stratmann and Lee-Barkey 12 , Reference Krebs, Browning and McLean 18 , Reference Gunnarsdottir, Tomasson and Kiely 40 – Reference Plat, Jellema and Ramakers 42 ). Altogether, using this improved model allowed us to explore adequately the phenotypic and metabolic effects of dietary n-3 PUFA during energy restriction in relation to body composition, protein homoeostasis and insulin sensitivity at the skeletal muscle level.
Effect of dietary fatty acids on muscle in response to energy restriction
In contrast with all measured adipose tissues and organs, of which weight was affected in the three restricted groups, irrespective of dietary FA, the leg muscle mass of energy-restricted rats supplemented with n-3 PUFA did not differ from the ad libitum group (Table 2). Most importantly, this beneficial effect was the same in response to both the n-3 LC-PUFA and the precursor ALA. This effect was observed in the all the leg muscles, and also in two of individually dissected muscles, the Gastrocnemius and the Tibialis anterior muscles, two fast-twitch muscles, but not in the Soleus muscle, a slow-twitch muscle. This is consistent with previous studies showing that slow-twitch muscles are less responsive to energy restriction than fast-twitch muscles with regard to improvement in insulin sensitivity( Reference Sharma, Sequea and Castorena 43 ) (see also below). Of note, the skeletal muscles differ from the heart, another red muscle, whose mass was affected to the same extent in the three energy-restricted groups, and was not protected from weight loss by n-3 PUFA.
Effect of dietary fatty acids on insulin sensitivity in relation to protein homoeostasis in muscle
Our finding that n-3 PUFA ensure better preservation of the muscle mass during weight loss in rats suggests various effects of these FA on protein homoeostasis. First, activation of the insulin-dependent IRS1/AKT pathway, together with the expression of InsR, was the most enhanced in response to the LC-PUFA-rich diet and to a lesser extent in response to the ALA-rich diet (Fig. 3). This up-stream insulin signalling including AKT is common to downstream regulation of both proteosynthesis and proteolysis. Regarding a possible enhancement of protein synthesis, our findings differ partly from the previous ones. Indeed, in growing animals( Reference Tesseraud, Chartrin and Métayer-Coustard 29 , Reference Bergeron, Julien and Davis 44 , Reference Gingras, White and Chouinard 45 ), ageing rats( Reference Kamolrat, Gray and Thivierge 6 ) and humans( Reference Smith, Atherton and Reeds 46 , Reference Smith, Atherton and Reeds 47 ), insulin signalling is activated by n-3 PUFA via an enhanced phosphorylation of proteins directly involved in protein synthesis and ribosomal transcription, such as mTOR, S6K1 and S6RP. In the present study, phosphorylation of mTOR and S6RP was not significantly modified by energy restriction, as previously shown( Reference Sharma, Castorena and Cartee 48 ) (Fig. 3). This difference between early and late (mTOR signalling) activation of protein synthesis is in accordance with the very weak or absent response to insulin injection (v. saline) or insulin signalling downstream AKT, whereas upstream AKT insulin pathway sensitivity was preserved in all rats, whether ad libitum or restricted, which allowed highlighting the potential effects of dietary FA (online Supplementary Fig. S1).
In contrast with downstream AKT insulin signalling that targets protein synthesis (mTOR signalling), proteolysis was regulated by dietary FA. In energy-restrained rats fed n-3 LC PUFA, the down-regulation of Murf1 and Fbox32, two major genes involved in the ubiquitin–proteasome system (Fig. 4), is in agreement with previous evidence that dietary fish oils could interfere with the ubiquitin–proteasome pathway and modulate the expression of Murf1 ( Reference Khal and Tisdale 7 , Reference Whitehouse, Smith and Drake 9 – Reference You, Park and Song 11 ). Transcript levels of Ctsd, involved in the lysosomal proteolytic system, were not affected by energy restriction or dietary FA, whereas that of Capn2, involved in the Ca-dependent proteolytic system, was enhanced in both groups fed n-3 PUFA. This absence or paradoxical effect of n-3 PUFA is probably of minor or no physiological consequence, as these two proteolytic systems plays only a minor role in muscle proteolysis during energy restriction( Reference Carbone, McClung and Pasiakos 49 ).
Taken together, the activation of the early steps of insulin signalling together with the absence of activation of downstream protein synthesis pathway and the down-regulation of major proteolytic genes strongly suggest that the preservation of muscle mass during weight loss in rats receiving a diet rich in n-3 PUFA relies on an alleviated proteolysis rather than on enhanced protein synthesis.
Mechanistic hypotheses
FA profile of the Gastrocnemius muscle was dramatically affected by dietary FA (online Supplementary Tables S3 and S4). There were no possible confounding factors due to food intake (meal size relative to body weight was the same in all restricted rats) or restriction itself (FA profile was globally the same in the OLE-AL and OLE-R groups). Not only the muscle of the LC-R rats, but also that of ALA-R rats, were significantly enriched in n-3 LC-PUFA, showing that the capacity of dietary ALA to be converted and to enrich tissues in LC derivatives was preserved during energy restriction and weight loss, in agreement with our previous study( Reference Guelzim, Huneau and Mathe 20 ). From a mechanistic point of view, changes in sarcolemma FA composition, by modifying membrane fluidity, may influence insulin sensitivity by altering insulin binding to its receptor (InsR) and subsequent downstream signalling( Reference Liu, Baracos and Quinney 50 ). Accordingly, a few interventional studies in rodents have shown that dietary n-3 LC-PUFA improved insulin responsiveness at the membrane level in the muscle with regard to number and phosphorylation of InsR( Reference Liu, Baracos and Quinney 50 , Reference Taouis, Dagou and Ster 51 ), IRS1 phosphorylation( Reference Taouis, Dagou and Ster 51 ) and glucose transport( Reference Liu, Baracos and Quinney 50 , Reference Sohal, Baracos and Clandinin 52 , Reference Storlien, Jenkins and Chisholm 53 ). In the present study, there was indeed a positive correlation between the proportion of n-3 long-chain PUFA and the phosphorylation level of IRS1, the initial activation step of the insulin cascade (R 0·5662, P=0·0093). This supports, to our knowledge for the first time, a possible relationship between FA composition of the sarcolemma, early steps of insulin signalling and preservation of muscle mass in response to a challenge of protein homoeostasis. As compared with the diet rich in n-3 LC-PUFA, the less pronounced effects of the ALA-rich diet are in accordance with the lesser enrichment of muscle phospholipids with n-3 LC-PUFA (online Supplementary Table S3). Nevertheless, a limitation of the present study relies on the very low conversion of ALA into LC-PUFA in humans compared with rats, which prevents observations in our rats fed the ALA-rich diet to be directly translated to humans( Reference Plourde and Cunnane 54 ).
To our knowledge, the present study is the first report of a protective effect of dietary n-3 PUFA on muscle mass during energy restriction aiming weight loss in adult rats. A greater expression level of the InsR and an enhanced activation of the early steps of insulin signalling in the muscle are associated with an enrichment of muscle phospholipids in n-3 LC-PUFA. Despite the fact that some molecular effects are less pronounced in the ALA-R group than in the LC-R group, the vegetable precursor ALA, supplied by rapeseed oil, had the same overall efficiency as its long-chain derivatives from fish oil, in terms of maintaining muscle mass and insulin sensitivity. Further studies will be designed to delineate more precisely the relationships between dietary n-3 PUFA, structural changes in plasma membrane and the early steps of insulin signalling. Special attention should be paid to insulin and IGF1 binding (number and activity of the receptors) on the one hand, and on glucose uptake via GLUT4, on the other hand.
From a clinical point of view, nutritional strategies using dietary n-3 PUFA in obese subjects should consider the opportunity of a preventive n-3 supplementation – that is, before energy restriction and weight loss.
Acknowledgements
The authors acknowledge the valuable contribution of Stéphanie Coelho, MSc student, who contributed to the running of the study, and of Morgane Dufay for animal care and help with dissection and sampling. The authors thank Philippe Guesnet (PG Consulting, Bures-sur-Yvette, France) for his help on fatty acid profiling of the experimental diets, and Sophie Tesseraud (URA, INRA, Nouzilly, France) and Dalila Azzout-Marniche (UMR0914) for offering their advice on insulin signalling characterisation.
The present study was supported by a grant from Terres Univia, 11 rue de Monceau, CS 60003, 75008, Paris, France (D. H., G. G., grant no. 910P1A). Terres Univia had no role in the design, analysis or writing of this article. D. H. formulated the research questions, designed the study and wrote the paper. G. G. carried out most of the study, analysed the data and wrote the paper. V. M. and J. M. contributed to carry out some biochemical analyses; J.-F. H. contributed to analyse the data; and N. S. and C. L. G. contributed to discuss the research question concerning the use of rapeseed oil.
N. S. and C. L. G. are employees of Terres Univia, an inter-professional, not for profit association. The authors declare no conflicts of interest.
Supplementary Material
For supplementary material/s referred to in this article, please visit http://dx.doi.org/doi:10.1017/S0007114516003111


