


1. Introduction
Rayleigh–Bénard (RB) convection, characterised by the natural circulation of a fluid between two horizontal plates subjected to a temperature difference, is a fundamental phenomenon in fluid dynamics with significant implications for various industrial and geophysical processes (Rayleigh Reference Rayleigh1916; Siggia Reference Siggia1994; Bodenschatz, Pesch & Ahlers Reference Bodenschatz, Pesch and Ahlers2000; Ahlers, Grossmann & Lohse Reference Ahlers, Grossmann and Lohse2009; Chillà & Schumacher Reference Chillà and Schumacher2012). A fundamental parameter in characterising RB convection (RBC) is the Rayleigh number ( $Ra = g \beta \Delta T H^3/(\nu \kappa )$), representing the ratio of the buoyancy and viscous forces in the fluid. Here, $g$ is the acceleration due to gravity, $\beta$ is the coefficient of thermal expansion, $\Delta T$ is the temperature difference between the plates, $H$ is the distance between the plates, $\nu$ is the kinematic viscosity and $\kappa$ is the thermal diffusivity.
The dynamics of the thermal boundary layer (BL) in RBC plays a crucial role in understanding heat transfer mechanisms because the main temperature drop occurs across the BLs which therefore constitute the main resistance for global heat transport (Shraiman & Siggia Reference Shraiman and Siggia1990; Grossmann & Lohse Reference Grossmann and Lohse2000; Sun, Cheung & Xia Reference Sun, Cheung and Xia2008). In recent years, significant attention has been paid to investigations of the BL dynamics (Wagner, Shishkina & Wagner Reference Wagner, Shishkina and Wagner2012; Zhou & Xia Reference Zhou and Xia2013; Scheel & Schumacher Reference Scheel and Schumacher2014). A special feature of the RBC is that, unlike channel flow, the fluid does not flow continuously along the wall. Three different regions result from the fact that thermal plumes coming from the bulk impinge at the plate (plume impact), and detach at a certain distance from the impact zone (plume ejection), whereas in geometries of laterally confined RBC, the detachment area usually occurs at the opposite end of the plate. Impact and ejection zones are connected by a shear flow across the central area (shear-dominated) (van der Poel et al. Reference van der Poel, Ostilla-Mónico, Verzicco, Grossmann and Lohse2015; Schumacher et al. Reference Schumacher, Bandaru, Pandey and Scheel2016; Scheel & Schumacher Reference Scheel and Schumacher2017; Pandey Reference Pandey2021). The local thickness of the thermal BL is the smallest just after the impact zone and grows in the large-scale circulation (LSC) plane towards the opposite sidewall (Wagner et al. Reference Wagner, Shishkina and Wagner2012; Pandey Reference Pandey2021). Furthermore, the mean temperature profile near the wall displays deviations from the Prandtl–Blasius–Pohlhausen (PBP) profile, a phenomenon particularly pronounced with smaller Prandtl numbers ( $Pr = \nu /\kappa$) and larger $Ra$ (van Reeuwijk, Jonker & Hanjalić Reference van Reeuwijk, Jonker and Hanjalić2008; Shishkina et al. Reference Shishkina, Horn, Wagner and Ching2015; Ching et al. Reference Ching, Leung, Zwirner and Shishkina2019; Tai et al. Reference Tai, Ching, Zwirner and Shishkina2021). At higher $Ra$, these deviations are evident across all three regions (Zhou et al. Reference Zhou, Stevens, Sugiyama, Grossmann, Lohse and Xia2010, Reference Zhou, Sugiyama, Stevens, Grossmann, Lohse and Xia2011; Scheel, Kim & White Reference Scheel, Kim and White2012; Shi, Emran & Schumacher Reference Shi, Emran and Schumacher2012; Stevens et al. Reference Stevens, Zhou, Grossmann, Verzicco, Xia and Lohse2012; Wang, He & Tong Reference Wang, He and Tong2016; Wang et al. Reference Wang, Xu, He, Yik, Wang, Schumacher and Tong2018). Although dynamic rescaling (Zhou & Xia Reference Zhou and Xia2010) improves the agreement in the shear and impact region, significant deviations persist, especially in the ejection region (Pandey Reference Pandey2021).
At low Prandtl numbers, thermal diffusion dominates over viscous effects, leading to different BL dynamics compared with higher- $Pr$ fluids. The thermal BL thickness in low- $Pr$ fluids exceeds that of the viscous BL, exposing it to direct interaction with the turbulent flow. Previous studies, including those by Scheel & Schumacher (Reference Scheel and Schumacher2016), Schumacher et al. (Reference Schumacher, Bandaru, Pandey and Scheel2016), Scheel & Schumacher (Reference Scheel and Schumacher2017) and Pandey (Reference Pandey2021), extensively explored these dynamics through numerical investigations. Scheel & Schumacher (Reference Scheel and Schumacher2017) conducted high-resolution direct numerical simulations at $Pr$ values of 0.005 and 0.021, focusing on statistical quantities such as energy dissipation rates and BL thickness scales. They found that the critical $Ra$ for transitioning to fully turbulent BLs decreases as $Pr$ decreases. The numerical results by Scheel & Schumacher (Reference Scheel and Schumacher2017) and Pandey (Reference Pandey2021) suggest that BLs in low- $Pr$ convection remain transitional rather than fully turbulent within a Rayleigh number range $Ra \le 10^{10}$, although increasing fluctuations are observed with increasing $Ra$.
$Ra$.
While numerical simulations enable valuable insights, experimental investigations provide empirical evidence and are crucial for validating computational models. So far, the study by Naert, Segawa & Sano (Reference Naert, Segawa and Sano1997) is the only one we are aware of that experimentally measures the BL thickness in liquid metal convection. The authors used a movable thermocouple to determine the temperature profile in mercury at the centre of the top plate and examined different approaches for determining the BL thickness. Here, our study aims to experimentally investigate thermal BL dynamics in turbulent liquid metal RBC and provides the first experimental data comparing the thermal BL characteristics both inside and outside the shear-dominated region. We analyse temperature profiles, fluctuation statistics and scaling behaviour, and compare our experimental findings with existing numerical studies.
2. Thermal BL dynamics in liquid metal convection
2.1. Local vertical temperature gradient in two distinct regions
The experimental set-up has been thoroughly described in our previous work (Schindler et al. Reference Schindler, Eckert, Zürner, Schumacher and Vogt2022). The cylindrical cell has an aspect ratio  $\varGamma$ of 0.5, with dimensions $D = 320$ mm and $H = 640$ mm. Two copper plates on the upper and lower sides are in contact with the eutectic alloy GaInSn, enabling the investigation of very low $Pr$ values ranging from 0.026 to 0.033. The variation in $Pr$ arises from the temperature sensitivity of both $\nu$ and $\kappa$, which comes into play as the mean bulk temperature in the convection cell changes with $Ra$. Our specific focus here lies in analysing the thermal BL structure near the top cold plate. Figure 1(a) shows the sensor arrangement configured for that purpose. Two ultrasonic Doppler velocimetry (UDV) sensors are positioned at a distance of 0.016 $H$ from the top plate to measure the horizontal velocity of the LSC, $u_{lsc}$, at their cross-section. For measurements of the thermal gradient in the fluid near the top plate, two thermocouple arrays are embedded in the top plate at distances of 0.02 $D$ and 0.33 $D$ away from the centre. Each of these arrays contains 10 individual thermocouples, their exact vertical positions are shown in figures 1(c) and 1(d).
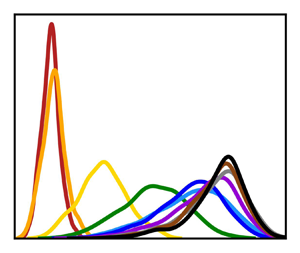
(a) Schematic of the experimental set-up with thermocouple arrays and UDV sensors. (b) Probability distribution of the LSC direction along the top plate for  $Ra = 3.7\times 10^8$, and probability distribution of temperature data from thermocouple arrays for the same $Ra$, at the centre of the plate (c) and near the side wall (d).

Examples of the temperature data obtained from these two arrays at  $Ra = 3.7\times 10^8$ are depicted as probability density functions (PDFs) in figures 1(c) and 1(d), respectively. Here, we use the normalised temperature defined as $\varTheta = (T-T_{cold})/(T_{bulk}-T_{cold})$, where $T_{cold}$ denotes the top plate temperature, and $T_{bulk}$ is the mean bulk temperature obtained by averaging the temperatures of the top and bottom plates, $T_{bulk}=(T_{cold}+T_{hot})/2$. Three distinct zones can be identified in the temperature profiles measured at the centre (figure 1c): within the thermal BL, at the edge of the thermal BL and outside of the BL. The PDFs near the plate are narrow and feature temperatures lower than those of the ambient fluid, confirming their location within the thermal BL. The temperature distributions exhibit an almost Gaussian shape in this area, which means there is only a minimal influence from the bulk flow. It is interesting to note the presence of negative values of $\varTheta$ in this zone, indicating that the values measured by the thermocouple arrays are sometimes lower than $T_{cold}$. This occurs because the thermal boundary conditions are generally not ideal in liquid metal convection experiments, even when using copper heat exchanger plates. At some point, the heat conduction in the copper plates can no longer compensate for the temperature fluctuations in the fluid quickly enough. For example, Horanyi, Krebs & Müller (Reference Horanyi, Krebs and Müller1999) observed large-scale temperature fluctuations in liquid sodium, which they attributed to an interplay between convective heat transport in the sodium and the conductive equalisation of temperature fluctuations in the adjacent copper plates. Moving to the next zone above this area, the PDFs appear significantly wider and thus suggest an area at the edge of the thermal BL in which the shear flow along the plate is already gaining influence. Finally, we identify a mixing zone, where the measured temperature data are distributed around a constant background temperature at $\varTheta = 1$. The skewness in the PDFs observed in this zone is likely attributed to the presence of large-scale thermal plumes and associated turbulent mixing, which cause significant temperature fluctuations and lead to asymmetry in the temperature distributions.
Figure 1(d) illustrates that the temperature PDFs recorded by the second thermocouple array near the side wall show only minor variations with respect to their maximal values and appear flatter and broader compared with the centre region. This can be interpreted as an initial indication that the flow influence and related fluctuations in the thermal BL are becoming stronger when the measuring position changes from the centre towards the side wall. While it is evident that the centre of the plate corresponds to the shear-dominated region, the dominance of the LSC-induced shear flow parallel to the copper plate decreases towards the periphery where effects due to plume impact and ejection at the top plate also come into play.
The UDV sensors are used to determine the LSC direction along the top plate according to the procedure suggested by Zürner et al. (Reference Zürner, Schindler, Vogt, Eckert and Schumacher2019). Figure 1(b) presents an exemplary PDF for  $Ra = 3.7\times 10^8$. Here, the location of the thermocouple array near the side wall is aligned with 0 $^\circ$. Highly turbulent and transient LSC structures with constant changes in flow direction along the plates were observed by flow measurements in the same set-up (Wondrak et al. Reference Wondrak, Sieger, Mitra, Schindler, Stefani, Vogt and Eckert2023). Nevertheless, one or two preferred directions often emerge (for example, here at 75 $^\circ$ and 285 $^\circ$), but these vary from experiment to experiment and are therefore difficult to predict. This means that, at different times, our off-centre thermocouple array can be located either upstream (in the impact region) or downstream (in the ejection region) of the LSC, or even to the side of the LSC plane.
2.2. Statistics of the temperature profiles
For both thermocouple arrays, we compute the root mean square value of the temperature fluctuations which is defined as  $\sigma _{T}(z) = \langle (T-\langle T \rangle )^2\rangle ^{1/2}$, where $\langle \rangle$ indicates time-averaging, and normalise it by the temperature difference between the lower and upper plates $\langle \Delta T \rangle$. These root-mean-square values would be negligible in a laminar BL (Wang et al. Reference Wang, Xu, He, Yik, Wang, Schumacher and Tong2018), but our data in figure 2 suggest that the BL is not entirely laminar. According to previous studies (Zhou & Xia Reference Zhou and Xia2013; Scheel & Schumacher Reference Scheel and Schumacher2016; Pandey Reference Pandey2021) temperature fluctuations are smallest within the thermal BL, reach their maximum at the edge of the BL, and decline in the bulk region. The location of $\sigma _{T,{max}}$ can be considered as the position at the edge of the thermal BL where the characteristic temperature profile meets the ambient fluid. For both measuring positions at the centre and the near-wall region, figures 2(a) and 2(b) show $\sigma _{T,{max}}$ occurring close to the mean thermal BL thickness, defined as $H/(2Nu)$ (Ahlers et al. Reference Ahlers, Grossmann and Lohse2009; Shishkina & Thess Reference Shishkina and Thess2009; Chillà & Schumacher Reference Chillà and Schumacher2012). A reduction in the BL thickness with increasing $Ra$ is reflected by the reduction in the distance between $\sigma _{T,{max}}$ and the top plate at $z$ = 0. At the highest $Ra$ considered here, $\sigma _{T,{max}}$ appears to be closer to the plate in the near-wall region than in the centre, whereas the locations of the $\sigma _{T,{max}}$ are similar in both regions for lower $Ra$. This rough observation does not seem to be consistent with the results of Pandey (Reference Pandey2021), who found a significant thickening of the BL thickness in the ejection zone. However, Pandey (Reference Pandey2021) was able to focus his evaluation on the ejection area by moving the measurement points along with the changing LSC plane. We do not have this possibility in the experiment, so we detect a temporal mixture of plume ejection, plume impact and situations in which we measure outside the LSC plane. Pandey (Reference Pandey2021) also observed a clear decreasing trend of the BL thickness in the ejection region for increasing $Ra$.
$Ra$.
Temperature fluctuation profile in the centre (a) and near-wall (b) regions. Vertical lines with corresponding colours represent the mean thermal BL thicknesses,  $H/(2Nu)$. (c) Maximum value of temperature fluctuations normalised by $\Delta T$ as a function of $Ra$.
$Ra$.

In figure 2(c), we plot the normalised values  $\sigma _{T,{max}}$ as a function of $Ra$. The exponent of the slope is $Ra^{-0.102}$ for the centre region and $Ra^{-0.120}$ for the side wall region. Especially in the side wall region, this scaling is similar to the recently reported value of $-$0.118 (Samuel et al. Reference Samuel, Bode, Scheel, Sreenivasan and Schumacher2024), even though their value derives from spatial averaging and their configuration (Cartesian domain with $\varGamma = 4$) differs from that considered in this study. However, previous experimental studies with $\varGamma = 0.5$ (Castaing et al. Reference Castaing, Gunaratne, Heslot, Kadanoff, Libchaber, Thomae, Wu, Zaleski and Zanetti1989; Wu & Libchaber Reference Wu and Libchaber1992; Niemela et al. Reference Niemela, Skrbek, Sreenivasan and Donnelly2000) have reported steeper exponents for the central region, approximately $-$0.144 to $-$0.147, indicating a stronger dependence on $Ra$. Additionally, Samuel et al. (Reference Samuel, Bode, Scheel, Sreenivasan and Schumacher2024) found that the exponent can vary depending on the spatial range considered, with their values changing to $-$0.140 in the bulk region. Here, we focus solely on the maximum temperature fluctuation values near the plate.
The decline in  $\sigma _{T,{max}}/\Delta T$ is explained by Pandey (Reference Pandey2021) with the argument that, with increasing $Ra$, the temperature difference between the plate and the ambient fluid at the edge of the BL decreases which is confirmed by our temperature profiles presented in figure 3(b). This should also reduce the temperature difference between the bulk fluid and the plumes that are formed. Correspondingly, the decrease of $\sigma _{T,{max}}$ is particularly pronounced at the off-centre position, as plume ejection events are expected to occur only near the side wall, not at the centre. Moreover, figure 2(c) shows that $\sigma _{T,{max}}$ is larger in the near-wall region compared with the centre region across the entire range of $Ra$ examined here. This is to be expected, as the influence of the shear flow decreases the further away the observation point is from the centre of the plate. Large-scale velocity fluctuations associated with plume impact or ejection are becoming more relevant near the side wall. Due to the small $Pr$, this is directly reflected in the behaviour of the thermal BL, indicating a starting mixing between the BL and the turbulent bulk flow. In contrast, in the shear-dominated region, where no significant velocity components normal to the plate surface occur, there is less exchange between thermal BL and bulk flow.
Dimensionless mean temperature profiles as functions of  $z/\delta _{T}(x,t)$ in the centre (a) and near-wall (b) regions. (c) Shape factor $S$ as a function of $Ra$. The horizontal line denotes the shape factors for the Prandtl–Blasius case ( $S\sim 2.47$ for $0.026 \leq Pr \leq 0.033$).

The averaged temperature profiles beneath the top plate are plotted in figures 3(a) and 3(b). Many previous studies have shown that dynamically rescaled profiles can provide an intuitive comparison with the PBP profile (Zhou et al. Reference Zhou, Sugiyama, Stevens, Grossmann, Lohse and Xia2011; Scheel et al. Reference Scheel, Kim and White2012; Shi et al. Reference Shi, Emran and Schumacher2012; Stevens et al. Reference Stevens, Zhou, Grossmann, Verzicco, Xia and Lohse2012; Wang et al. Reference Wang, He and Tong2016, Reference Wang, Xu, He, Yik, Wang, Schumacher and Tong2018). A time-averaged temperature profile in a fixed reference frame as a function of the height  $z$ contains mixed dynamics with contributions from inside and outside the BL range, as the BL thickness is constantly changing during the measurement. To achieve a clear separation of those dynamics, Zhou & Xia (Reference Zhou and Xia2010) studied BL quantities within a time-dependent frame that varied with the instantaneous BL thickness. The rescaled vertical distances and the averaged temperature profiles in the dynamic frame are defined as
 $$\begin{gather} \xi^*(t) = z/\delta_T(x, t), \end{gather}$$
 $$\begin{gather}\varTheta^*(\xi^*) = \langle \varTheta(z, t)|_{z= \xi^*(t)\delta_T(x,t)}\rangle. \end{gather}$$
 Here, the instantaneous local thermal BL  $\delta _T(x, t)$ is obtained using the slope method (Zhou et al. Reference Zhou, Sugiyama, Stevens, Grossmann, Lohse and Xia2011; Scheel et al. Reference Scheel, Kim and White2012; Wagner et al. Reference Wagner, Shishkina and Wagner2012), where $\delta _T(x, t)$ is the distance from the plate to an intersection point where the line with the slope of the temperature profile directly at the plate meets the bulk temperature. Here, $\sigma _{T,{max}}$ is used to specify the number of data points used for calculating the temperature slope within the BL $( 0 \le z \le z(\sigma _{T,{max}}))$. The number of selected sensors depends on $Ra$ since the position of $\sigma _{T,{max}}$ varies with $Ra$, but this number for a given $Ra$ remains fixed over time.
Previous studies show that the dynamically rescaled temperature profile agrees well with the PBP profile in the impact and shear-dominated regions, indicating a laminar behaviour of the BL in these regions (Zhou & Xia Reference Zhou and Xia2010; van der Poel et al. Reference van der Poel, Ostilla-Mónico, Verzicco, Grossmann and Lohse2015; Pandey Reference Pandey2021). In contrast, the profile deviates significantly from the PBP profile in the ejection region due to stronger turbulent fluctuations. Consistent with these previous studies, our measurements in the shear-dominated region demonstrate a very good agreement with the PBP profile for all  $Ra$ (see figure 3a), whereas significant deviations from the PBP profile are observed for the off-centre position (see figure 3b). Here, the difference to the PBP profile increases with growing $Ra$, indicating an increase in disturbances impairing the laminar character of the BL.
To quantitatively investigate the deviation of the temperature profile from the PBP profile, we calculate the shape factor  $S^*$ from the temperature profile in the dynamic frame, which is defined as (Scheel et al. Reference Scheel, Kim and White2012; Scheel & Schumacher Reference Scheel and Schumacher2017; Pandey Reference Pandey2021)
 $$\begin{gather} \delta_{d}^* = \int_{0}^{\infty} \left( 1-\frac{\varTheta^*}{\varTheta^*_{max}}\right) {\rm d} \xi^*, \end{gather}$$
 $$\begin{gather}\delta_{m}^* = \int_{0}^{\infty} \left(1-\frac{\varTheta^*}{\varTheta^*_{max}}\right) \frac{\varTheta^*}{\varTheta^*_{max}}\,{\rm d}\xi^*, \end{gather}$$
 $$\begin{gather}S^*=\delta_{d}^* / \delta_{m}^*. \end{gather}$$
 Here,  $\delta _{d}^*$ and $\delta _{m}^*$ represent the displacement and momentum thicknesses of the profiles after being rescaled by the dynamic frame. In figure 3(c), the black line denotes the shape factor for the PBP profile, $S \sim 2.47$ in the range $0.026 \leq Pr \leq 0.033$. We observe that $S^*$ is smaller than 2.47 for almost all of our measurements. The difference between the dynamically rescaled temperature profiles and the PBP profile increases with increasing $Ra$. This is because the BL becomes thinner and more strongly influenced by turbulence, which means that the profile reaches its asymptotic value more slowly (Pandey Reference Pandey2021). Larger deviations are found in the region near the side wall, which is more affected by turbulent fluctuations of the flow. The results in figure 3(c) demonstrate that the local thermal BLs are not fully laminar whereby the nature of the BL becomes increasingly transient with growing $Ra$.
$Ra$.
2.3. Scaling of BL thickness with  $Ra$
$Ra$

Figure 4 presents the thickness of both the mean thermal and viscous BLs as a function of  $Ra$. The local instantaneous thermal BL $\delta _T(x,t)$ is determined using the slope method, as described in § 2.2. From these data, we then compute the time-averaged value for each $Ra$, denoted as $\delta _T = \langle \delta _T(x,t) \rangle$. The continuous reduction of the mean thickness of the thermal BL, $\delta _T$, with increasing $Ra$, is evident for both the shear-dominated region at the plate centre and the position near the side wall. Moreover, the width of the thermal BL is larger near the side wall. The thermal BL thickness is inversely proportional to the vertical diffusive heat flux at the plate, which obviously increases with $Ra$ and is lower near the sidewall than in the shear-dominated region. It has also been reported in previous studies (Wagner et al. Reference Wagner, Shishkina and Wagner2012; Scheel & Schumacher Reference Scheel and Schumacher2014; Pandey Reference Pandey2021) that the variation of the BL width aligns with the direction of the LSC along the plate, in particular, the BL thickness increases in the downstream direction from the plate centre.
Time-averaged thermal and viscous BL thicknesses as a function of  $Ra$.
$Ra$.

We observe different scaling exponents for the two measuring positions under consideration here. While  $\delta _T$ shows a $Ra^{-0.20}$ scaling at the centre region (in accordance with Naert et al. Reference Naert, Segawa and Sano1997), it scales like $Ra^{-0.26}$ near the side wall. The same value of $-$0.26 has been reported by Scheel & Schumacher (Reference Scheel and Schumacher2016) for $\delta _T$ averaged over the plate area. Pandey (Reference Pandey2021) obtained an exponent of $-$0.25, also for a horizontally averaged value of $\delta _T$. In view of the aspect that the shear-dominated zone probably only occupies a small part of the total area of the plate, this result is understandable. In our case, the different exponents also mean that the difference in BL thickness between the centre and the side wall region is greatest at low $Ra$, whereas the thicknesses are similar at high $Ra$. This observation is consistent with the findings of Pandey (Reference Pandey2021), who observed a much steeper decline of $\delta _T$ in the ejection region as compared with the shear-domination zone.
Another parameter for characterising BL behaviour is the displacement thickness (Schlichting & Gersten Reference Schlichting and Gersten2016). It provides a measure of the effective thickness of the thermal BL and is defined in a fixed frame as Scheel & Schumacher (Reference Scheel and Schumacher2017)
 \begin{equation} \delta_{T,{dis}} = \int_{0}^{\infty} \left(1-\frac{\bar{T}}{\bar{T}_{bulk}}\right) {\rm d} z.\end{equation}
 Scheel & Schumacher (Reference Scheel and Schumacher2017) suggest that the displacement thickness scales with  $Ra^{-0.25}$ for a laminar BL, whereas it decreases with an exponent of $-$0.1 for a turbulent BL. It is shown in figure 4 that $\delta _{T,{dis}}$ decreases with an exponent of $-$0.26 for both measuring positions. This analysis indicates that our thermal BLs are still in a transitional state and therefore exhibit laminar-like scaling rather than turbulence-like scaling.
Figure 4 also contains the viscous BL thickness,  $\delta _v$, for comparison. However, this variable is not directly accessible for direct measurements in our current experimental set-up. Instead, we employ the equation for the Blasius BL thickness (Schlichting & Gersten Reference Schlichting and Gersten2016), defined as $\delta _{\nu }=aH/\sqrt {Re_H}$, under the assumption that the viscous BL remains in the laminar regime. Here, the height $H$ is used as the characteristic length for Reynolds number, $Re_H=u_{LSC}H/\nu$. The characteristic LSC velocity, $u_{LSC}$, is measured as the time-averaged horizontal velocity beneath the top plate by means of the UDV sensors shown in figure 1(a) (see also Zürner et al. Reference Zürner, Schindler, Vogt, Eckert and Schumacher2019). To determine $\delta _{\nu }$ and the appropriate coefficient $a$, we adopt the assumption that the ratio of the thermal BL to the viscous BL remains constant for a given $Ra$. Shishkina et al. (Reference Shishkina, Stevens, Grossmann and Lohse2010) derived the following relationship between the thermal BL and the viscous BL for $3 \times 10^{-4} \leq Pr \leq 3$:
 \begin{equation} \delta_{T}/\delta_{\nu}\sim Pr^{{-}0.357+0.022\log Pr}.\end{equation}
 Since  $u_{LSC}$ is measured at the intersection of the two UDV measuring lines at the centre of the top plate (see figure 1a), we input the $\delta _{T}$ data from the centre position into (2.7). The resulting coefficient was found to be $a \sim 0.53$, which is similar to values reported in previous studies: $a = 0.482$ by Grossmann & Lohse (Reference Grossmann and Lohse2002) and $a = 0.6$ by Zhou & Xia (Reference Zhou and Xia2010). The $\delta _{\nu }$ data presented in figure 4 decrease with a scaling of $Ra^{-0.22}$. This scaling is consistent with $Re \sim Ra^{0.45}$, which has been identified in many previous studies (Qiu & Tong Reference Qiu and Tong2001; Grossmann & Lohse Reference Grossmann and Lohse2002; Ahlers et al. Reference Ahlers, Grossmann and Lohse2009; Scheel & Schumacher Reference Scheel and Schumacher2017; Schindler et al. Reference Schindler, Eckert, Zürner, Schumacher and Vogt2022; Xu, Zhang & Xia Reference Xu, Zhang and Xia2022). Consequently, this leads to a $Ra$ dependence of $\delta _{\nu }\sim Re^{-0.5} \sim Ra^{-0.225}$ in the laminar regime (Shi et al. Reference Shi, Emran and Schumacher2012), a value similar to our observed scaling of $-$0.22. Thus, the authors suggest that, given the limitations of the velocity measurements in the current set-up, the observed scaling of $\delta _{\nu } \sim Ra^{-0.22}$ is consistent with a laminar BL.
3. Summary and conclusions
The present experimental study is dedicated to the investigation of the thermal BL in turbulent liquid metal RBC, within the  $Pr$ range of $0.026$ to $0.033$ and $Ra$ up to $2.9 \times 10^9$. For this purpose, we measure vertical temperature profiles at two positions directly below the top plate. One of the measuring positions is in the centre area of the plate, over which the LSC constantly flows so that a shear-dominated zone can be certainly assumed here. The second thermocouple is installed at a radial distance of $0.33D$ from the centre of the plate. It is well known that the horizontal velocity component of the LSC weakens with increasing distance from the plate centre. In the lateral areas, thermal plumes either form and detach (plume ejection) or impinge (plume impact) when they come from the opposite plate.
Our analysis reveals significant differences in temperature profiles, fluctuation statistics, and BL thickness scaling between the two considered measuring positions. In the shear-dominated region, temperature profiles resemble laminar BL profiles (the PBP profile), whereas in the region near the side wall, stronger fluctuations lead to deviations from the laminar behaviour. These discrepancies become more pronounced at higher  $Ra$ indicating an increasing influence of turbulent fluctuations with increasing $Ra$. In the present study, the viscous BL $\delta _{\nu }$, which, in low- $Pr$ fluids, is significantly smaller than the thermal BL $\delta _T$, could not be measured directly. However, a rough estimate confirms that the viscous BL can be regarded as laminar under the conditions considered here. The much thicker thermal BL, therefore, extends into the zone of turbulent flow and could therefore be directly affected by it. Our results also show this but do not provide evidence for a transition to a fully turbulent thermal BL.
The thermal BL width,  $\delta _T$, shows distinct scalings for the centre and side wall regions, $Ra^{-0.20}$ and $Ra^{-0.26}$, respectively. The difference in the BL thickness is most pronounced for small $Ra$, but the different scaling exponents result in almost the same BL thickness for $Ra \thickapprox 10^9$. The thermal displacement thickness $\delta _{T,{dis}}$ declines with an exponent of $-$0.26 in both regions which indicates a behaviour akin to a laminar BL. This appears to be contrasted by the deviations of our data from the characteristic value of the shape factor $S^*$ for a PBP profile even after the application of dynamic rescaling. However, only minor deviations occur in the shear-dominated zone, whereas significantly lower values were determined for the side wall region at high $Ra$. The thermal BL profiles deviate from the PBP profile in both regions, with larger discrepancies found in the side wall region where stronger turbulent fluctuations occur frequently. This suggests that a possible departure from the laminar state to a transitional or even turbulent BL is most likely to occur first in the side wall region. Growing turbulent fluctuations with increasing $Ra$ affect the laminar character of the thermal BL. However, according to the findings in this study, the BL does not yet become fully turbulent but shows a transitional behaviour in the area near the side wall at high $Ra$. The larger local BL width in the side-wall region corresponds to the formation and detachment of coarser plumes resulting in a less steep vertical temperature gradient in the side-wall region compared with the centre region (Pandey Reference Pandey2021) (see figure 3). It is interesting to note that our experimental findings agree very well with the numerical results of Pandey (Reference Pandey2021), although due to the volatile nature of the LSC, our measurements at the sidewall represent a time average over the BL behaviour in different areas (ejection, impact, laterally with respect to the LSC plane), whereas the analysis by Pandey (Reference Pandey2021) fits exactly in the LSC direction. We assume that measurements focusing explicitly on the ejection zone could reveal even more pronounced deviations from a laminar BL. Therefore, in further experiments, we plan to increase the number of temperature measurement points in the near-wall region and combine this with simultaneous velocity measurements to determine the instantaneous LSC direction and localise the ejection zone. The continuation of these experiments will provide valuable insights into the thermal BL dynamics in turbulent liquid metal convection, contributing to a better understanding of the heat transfer mechanism.
Acknowledgements
We thank the anonymous reviewers for their valuable comments and suggestions.
Funding
The authors acknowledge financial support from the Deutsche Forschungsgemeinschaft (DFG) with grants no. EC 217/5-1 and no. VO 2331/1-1.
Declaration of interests
The authors report no conflict of interest.


 Open access