


Statement of Research Significance
Research Question(s) or Topic(s): We examined patterns of errors and response strategies used by older adults from the Framingham Heart Study during cognitive tasks. We investigated whether these behaviors reflect underlying cognitive abilities, and the relationships between these abilities and demographics. We also examined whether these abilities identify persons that will develop dementia. Main Findings: We found that errors and response strategies reflected a general ability, but also seven underlying cognitive processes that were related to each of the cognitive tasks. This pattern was consistent across important demographics like age, sex, and education. Older, less educated participants produced fewer accurate and strategic responses, while differences between males and females were varied. Importantly, this approach was helpful in identifying participants that would develop dementia. Study Contributions: This study provides an expanded approach for researchers to use cognitive tests in studies of aging but also reinforces how clinicians typically understand test performance.
Introduction
Summary scores from neuropsychological (NP) assessments are widely used to infer underlying cognitive abilities (Au et al., Reference Au, Bose, Imam and Kolachalama2025; Casaletto & Heaton, Reference Casaletto and Heaton2017; Libon et al., Reference Libon, Swenson, Langford, Cosentino, Price, Lamar, Emrani, Au, Andersen, Chen, Ashendorf and Thompson2025; Salmon & Bondi, Reference Salmon and Bondi2009). However, a single score representing a specific cognitive domain often obscures the diverse cognitive strategies individuals may employ to complete any given NP test. Reliance on summary scores can obscure subtle cognitive changes, which is especially critical for early detection of cognitive disorders (Kaplan, Reference Kaplan1988; Libon et al., Reference Libon, Swenson, Lamar, Price, Baliga, Pascual-Leone, Au, Cosentino, Andersen and Loewenstein2022, Reference Libon, Swenson, Langford, Cosentino, Price, Lamar, Emrani, Au, Andersen, Chen, Ashendorf and Thompson2025). Furthermore, although NP tests are inherently multi-domain, many studies artificially simplify their structure by assigning each test to a single cognitive domain (Au & Devine, Reference Au and Devine2013). This “one test-one domain” approach can result in misinterpretation of normal performance variability as cognitive impairment (Au et al., Reference Au, Bose, Imam and Kolachalama2025; Jak et al., Reference Jak, Bondi, Delano-Wood, Wierenga, Corey-Bloom, Salmon and Delis2009; Loewenstein et al., Reference Loewenstein, Acevedo, Agron, Martinez and Duara2007).
The Boston Process Approach (BPA), created by Edith Kaplan (Kaplan, Reference Kaplan1988, Reference Kaplan1990; Libon et al., Reference Libon, Swenson, Lamar, Price, Baliga, Pascual-Leone, Au, Cosentino, Andersen and Loewenstein2022), provides a solution to the “one test-one domain” problem by analyzing and quantifying the types of cognitive resources utilized and errors made during the process of completing a neurocognitive operation. Similarly, while a summary score may indicate presence of impairment, using the BPA further elucidates specific brain–behavior relationships to better inform level of impairment and differential diagnosis, including early detection of subtle cognitive changes. Research using BPA has largely focused on differentiating between clinical groups (Bélanger & Belleville, Reference Bélanger and Belleville2009; Bettcher et al., Reference Bettcher, Giovannetti, MacMullen and Libon2008; Libon et al., Reference Libon, Lamar, Price, Jefferson, Swenson, Au, Smith and Farias2018) as well as early detection of MCI (Eppig et al., Reference Eppig, Wambach, Nieves, Price, Lamar, Delano-Wood, Giovannetti, Bettcher, Penney, Swenson, Lippa, Kabasakalian, Bondi and Libon2012; Libon et al., Reference Libon, Bondi, Price, Lamar, Eppig, Wambach, Nieves, Delano-Wood, Giovannetti, Lippa, Kabasakalian, Cosentino, Swenson and Penney2011). For example, early studies used the BPA to distinguish Alzheimer’s disease (AD) and vascular dementia (VaD), with the former group largely producing errors associated with amnestic and lexical impairments, whereas the latter group producing executive dysfunction errors across many cognitive domains (Lamar et al., Reference Lamar, Podell, Carew, Cloud, Resh, Kennedy, Goldberg, Kaplan and Libon1997, Reference Lamar, Price, Giovannetti, Swenson and Libon2010; Libon et al., Reference Libon, Lamar, Price, Jefferson, Swenson, Au, Smith and Farias2018).
The emerging landscape of approved anti-amyloid drugs for treatment of Alzheimer’s disease and related dementias (ADRD) has pushed for the development of new methodologies that can detect subtle cognitive changes associated with MCI and dementia when disease modifying therapies are most effective (Au et al., Reference Au, Bose, Imam and Kolachalama2025; Cummings et al., Reference Cummings, Zhou, Lee, Zhong, Fonseca and Cheng2024; Libon et al., Reference Libon, Swenson, Lamar, Price, Baliga, Pascual-Leone, Au, Cosentino, Andersen and Loewenstein2022, Reference Libon, Swenson, Langford, Cosentino, Price, Lamar, Emrani, Au, Andersen, Chen, Ashendorf and Thompson2025; Libon, Swenson, Price, et al., Reference Libon, Swenson, Price, Lamar, Cosentino, Bezdicek, Kling, Tobyne, Jannati, Banks and Pascual-Leone2024). There is emerging evidence that digital NP assessment, which is also rooted in BPA, validly captures drawn, written, and spoken output from NP tests in real time to identify markers of subtle cognitive impairment (Libon et al., Reference Libon, Swenson, Lamar, Price, Baliga, Pascual-Leone, Au, Cosentino, Andersen and Loewenstein2022, Reference Libon, Swenson, Langford, Cosentino, Price, Lamar, Emrani, Au, Andersen, Chen, Ashendorf and Thompson2025; Libon, Swenson, Price, et al., Reference Libon, Swenson, Price, Lamar, Cosentino, Bezdicek, Kling, Tobyne, Jannati, Banks and Pascual-Leone2024; Libon, Swenson, Tobyne, et al., Reference Libon, Swenson, Tobyne, Jannati, Schulman, Price, Lamar and Pascual-Leone2024). This includes research using the digital clock drawing test (dCDT) (Binaco et al., Reference Binaco, Calzaretto, Epifano, McGuire, Umer, Emrani, Wasserman, Libon and Polikar2020; Davoudi et al., Reference Davoudi, Dion, Amini, Tighe, Price, Libon and Rashidi2021; Dion et al., Reference Dion, Frank, Crowley, Hizel, Rodriguez, Tanner, Libon and Price2021; Frank et al., Reference Frank, Bandyopadhyay, Dion, Formanski, Matusz, Penney, Davis, O’Connor, Au, Amini, Rashidi, Tighe, Libon and Price2024; Müller et al., Reference Müller, Herde, Preische, Zeller, Heymann, Robens, Elbing and Laske2019; Zheng et al., Reference Zheng, Zhang, Wang, Li, Liu, Xu, Li, Zheng and Nie2021) and artificial intelligence (AI)–assisted models extracting linguistic and acoustic features from speech produced during NP testing (Amini et al., Reference Amini, Hao, Yang, Karjadi, Kolachalama, Au and Paschalidis2024; Ding et al., Reference Ding, Lister, Karjadi, Au, Lin, Bischoff and Hwang2024; Tavabi et al., Reference Tavabi, Stück, Signorini, Karjadi, Al Hanai, Sandoval, Lemke, Glass, Hardy, Lavallee, Wasserman, Ang, Nowak, Kainkaryam, Foschini and Au2022; Young et al., Reference Young, Smith, Karjadi, Grogan, Ang, Insel, Henderson, Sumner, Poston, Au and Mormino2024).
While digital NP assessment holds tremendous potential, this line of research is in nascent stages and its clinical utility and scalability, at least currently, is unknown (Au et al., Reference Au, Popp, Low, Hwang, De Anda-Duran, Li, Rahman, Ding, Igwe, Karjadi, Ang, Devine, Gurnani, Mez, Farrer, Sunderaraman, Lin and Kolachalama2023; Libon et al., Reference Libon, Swenson, Lamar, Price, Baliga, Pascual-Leone, Au, Cosentino, Andersen and Loewenstein2022, Reference Libon, Swenson, Langford, Cosentino, Price, Lamar, Emrani, Au, Andersen, Chen, Ashendorf and Thompson2025). On the other hand, BPA metrics derived from traditional NP tests are routinely utilized in clinical evaluation and relatively better understood, however, they are considered non-standardized and case-specific, subjective, or difficult to systematically quantify without expert review (Au & Devine, Reference Au and Devine2013). As such, use of BPA in research has been limited by adoption constraints, including time, labor, and intensive training.
The current study focuses on NP data from the Framingham Heart Study (FHS), a community-based cohort study established to examine cardiovascular disease, which has collected comprehensive BPA data since 2005 using an extensive scoring system and weekly meetings to maintain reliability. These data include distinct process variables related to errors, approaches, strategies, and “testing the limits” procedures. Several studies have examined FHS BPA data, especially using the clock drawing test, and demonstrated its clinical and diagnostic utility (Gupta et al., Reference Gupta, Preis, Beiser, Devine, Hankee, Seshadri, Wolf and Au2015; Hankee et al., Reference Hankee, Preis, Beiser, Devine, Liu, Seshadri, Wolf and Au2013; Libon et al., Reference Libon, Preis, Beiser, Devine, Seshadri, Wolf, DeCarli and Au2015; Nishtala et al., Reference Nishtala, Preis, Beiser, Devine, Hankee, Seshadri, Wolf and Au2014).
Despite the richness of BPA data, there remain methodological challenges. Most variables are zero-inflated counts, with each participant having a distinct pattern of errors and approaches. Any particular response type or error has a relatively low frequency but is often clinically meaningful. As a result, these data are inappropriate for traditional psychometric methods and analyses. Ferretti et al. (Reference Ferretti, Ding, Au, Liu, Devine, Auerbach, Mez, Gurnani, Liu, Santuccione and Ang2024) recently examined the ability of 23 BPA variables to predict conversion to dementia in an FHS sample, stratified by sex. They found associations between derived BPA composites and conversion, which varied by sex. However, there is a need to expand on this study with additional psychometric investigation (e.g., to empirically assess constituent BPA data, and to assess factor structure and measurement invariance (MI); see Measurement and Latent Factor section below).
Overall, given the richness and complexity of the BPA data collected at FHS, psychometric analyses are needed to (1) understand what these variables measure in isolation or aggregation for this sample of older adults and (2) aggregate the data and identify underlying latent cognitive structures. In this study, we conducted psychometric analyses of constituent BPA variables (i.e., individual variables that were derived from detailed scoring methods but not aggregated with any theoretically driven process). We employed a novel method appropriate for the sparsity and complexity of the data. This included examination of factor structure, MI between demographic groups, and the utility of our retained bifactor model to predict dementia. Using the best-fitting models, we examined the influence of demographic factors on latent cognitive components and assessed their predictive utility for future conversion to dementia. We contend this study will inform clinical understanding of long-used NP tests and display a methodological approach for future studies. This could serve as a foundation to further demonstrate the utility of BPA data in predicting outcomes related to aging and dementia.
Methods
Participants
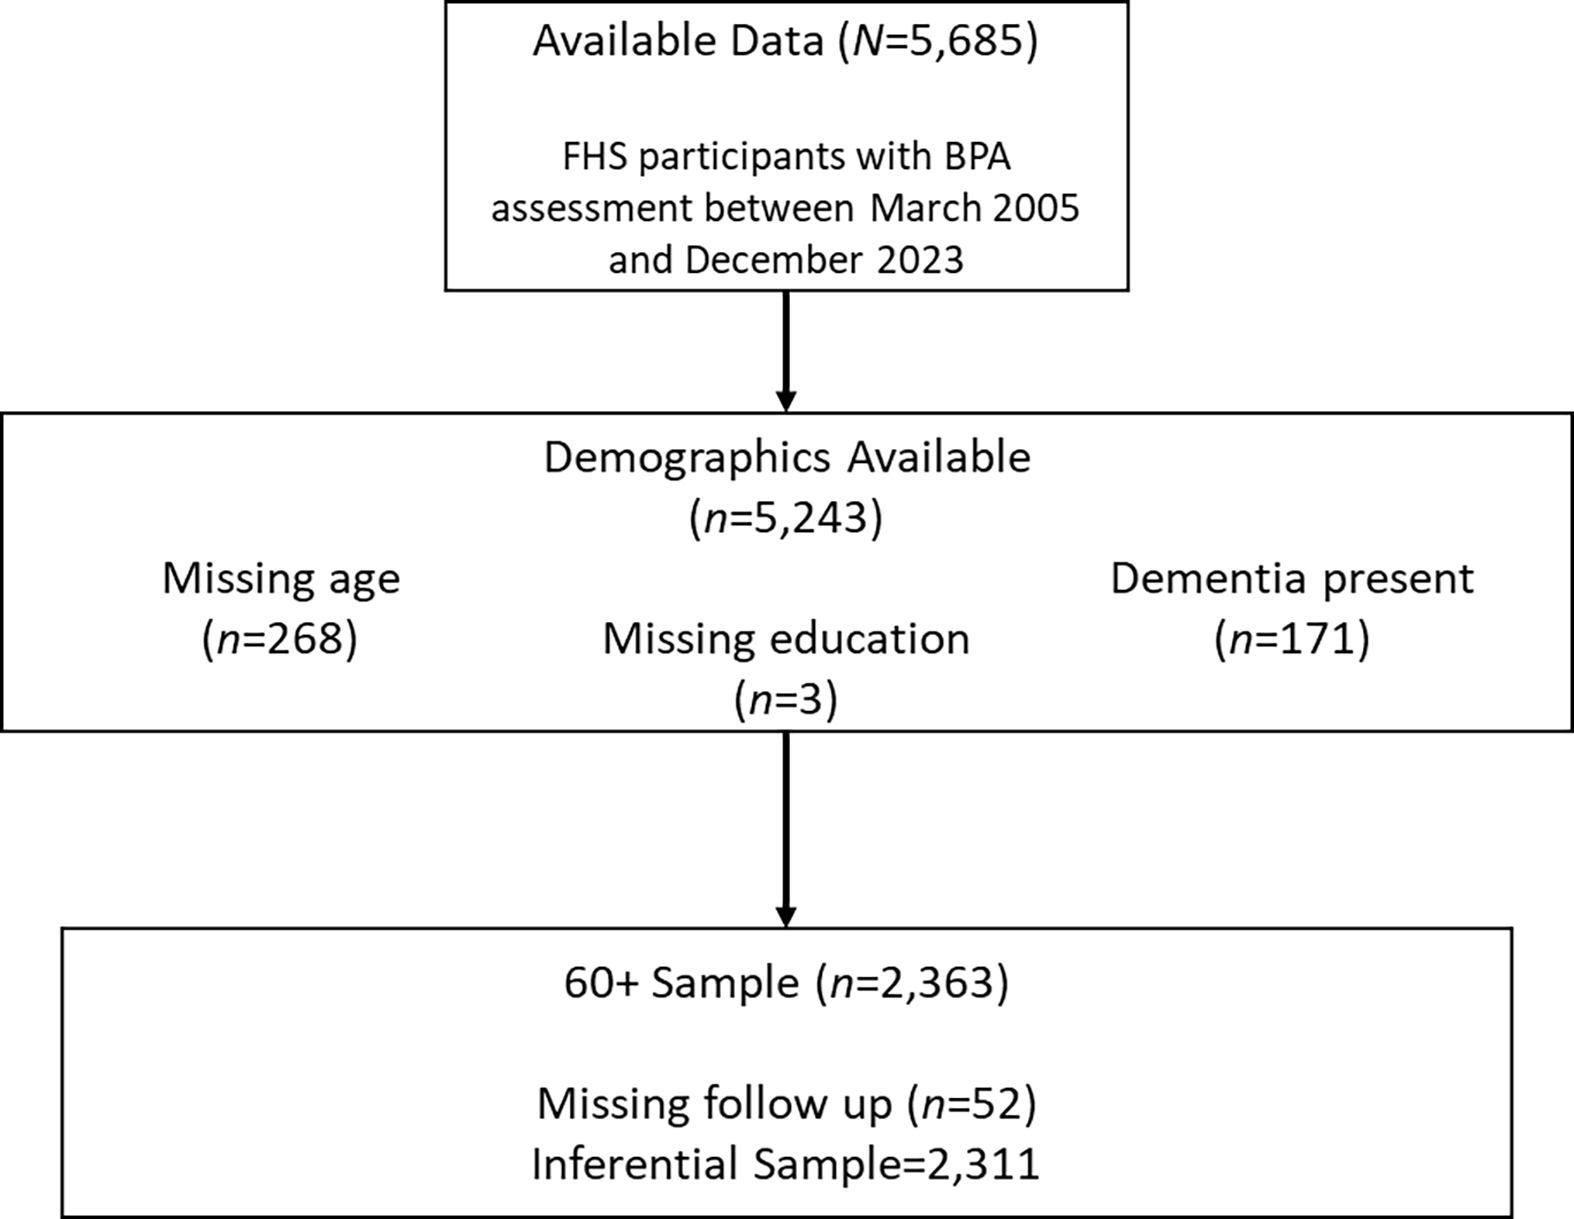
The FHS is a multi-generational longitudinal community study including Gen 1 (initiated in 1948), Gen 2 (1971), Gen 3 (2002), Omni 1 (1994), and Omni 2 (2003) cohorts. NP testing was first implemented in 1989; BPA scoring was initiated in 2005, resulting in a cross-sectional sample of 5685 participants with available BPA data (Au & Devine, Reference Au and Devine2013; Ferretti et al., Reference Ferretti, Ding, Au, Liu, Devine, Auerbach, Mez, Gurnani, Liu, Santuccione and Ang2024). Given our primary interest in aging and dementia, the analytical sample focused on adults ≥60 years (n = 2363). However, a Supplement presents a discussion and analyses of all participants with available data unrestricted by age. We also examined an alternate age cutoff for older adults with MI analyses (see Analytic Plan). Participants were excluded if there was missing information on target demographic variables, including age at BPA evaluation (n = 268) and education (n = 3). Following Ferretti et al. (Reference Ferretti, Ding, Au, Liu, Devine, Auerbach, Mez, Gurnani, Liu, Santuccione and Ang2024), 171 participants with diagnosed dementia at the first available BPA assessment were excluded, as these individuals tend to discontinue from tasks, resulting in a high degree of missing data. To maintain consistency with this prior study, we included 108 participants presenting for BPA assessment with non-dementia cognitive impairment (i.e., mild cognitive impairment; MCI). We report on these participants in the dementia prediction section below. Of note, even MCI patients with an underlying neurodegenerative disease would still be considered in early stages of the condition, and therefore relevant for efforts at early detection. In dementia prediction models, participants were excluded if they did not receive at least one longitudinal follow-up including NP evaluation after their initial baseline assessment (n = 52). This led to cohorts of 2363 for psychometric models and 2311 for the inferential model (see analytic plan). See Figure 1 for the Consort Flow diagram of the sample selection process. Involvement of human subjects was done in accord with the Helsinki Declaration of 1975. This study was approved by the institutional review board at Boston University. All participants provided written informed consent.
CONSORT flow diagram for sample selection process. Boston process approach (BPA); Framingham Heart Study (FHS).

Figure 1 Long description
The flowchart begins with 5,685 participants who had BPA assessments between March 2005 and December 2023. Of these, demographics were available for 5,243 participants. The flowchart notes missing age data for 268 participants, missing education data for 3 participants, and the presence of dementia in 171 participants. The next step filters the sample to those aged 60 and above, resulting in 2,363 participants. Finally, after excluding 52 participants due to missing follow-up data, the inferential sample consists of 2,311 participants.
Neuropsychological testing
The FHS NP battery has been described in detail (Au et al., Reference Au, Seshadri, Wolf, Elias, Elias, Sullivan, Beiser and D’Agostino2004). FHS participants are invited to complete comprehensive NP testing at least every 4–5 years. The battery includes the following tests: Wechsler Memory Scale-First Edition (WMS): Logical Memory (LM)–Passage A, Visual Reproduction (VR), and Paired Associate Learning (PAL) (Wechsler, Reference Wechsler1945), Wechsler Adult Intelligence Scale First Edition (WAIS): Digit Span and Similarities (Wechsler, Reference Wechsler1955), WAIS-IV Coding (Wechsler, Reference Wechsler2008); Boston Naming Test (BNT) (Kaplan et al., Reference Kaplan, Goodglass and Weintraub1983), Trail-Making Test Parts A and B (Trails A and B), Finger Tapping, Verbal Fluency (Spreen & Strauss, Reference Spreen and Strauss1991), Clock Drawing Test (Kaplan, Reference Kaplan1988, Reference Kaplan1990), and Hooper Visual Organization Test (Hooper, Reference Hooper1983). Of note, some of these tests use idiosyncratic instructions, such as the instruction to not lift the pen from the page on Trails A and B. Using the BPA, errors and extraneous responses were quantified from each test including but not limited to confabulations, interference, contaminations, and perseverations. The FHS battery and BPA scoring criteria permit quantification of 169 distinct variables from the various tests. Of these variables, only 35 variables were retained in the primary model (see factor analyses below). We describe each of the variables in the Supplement (see Supplemental Table 2a–c).
Diagnosis
Surveillance of incident dementia began in 1975. Dementia diagnoses were determined through FHS consensus adjudication, involving review by at least one neurologist and one neuropsychologist, based on neurological and NP assessments, medical records, FHS health examinations, and in some cases, family interviews. Details of the surveillance and diagnosis of dementia within FHS have been published previously (Kolo et al., Reference Kolo, Lu, Beiser, Francis, Melo van Lent, Gireud-Goss, Himali, Ghosh, Ting, Banerjee, Kowalczyk, Zucker, Heard-Costa, Wood, Maillard, Fletcher, DeCarli, Welling, Kujawa and Seshadri2025; Satizabal et al., Reference Satizabal, Beiser, Chouraki, Chêne, Dufouil and Seshadri2016). FHS diagnostic criteria for dementia follow the Diagnostic and Statistical Manual of Mental Disorders, fourth edition (DSM-IV).
Measurements and latent factors
Because of the high number of available BPA variables (n = 169), there is a need for data reduction to permit interpretable findings. However, simply combining counts of errors from within or between tests would not necessarily satisfy model assumptions because the latent structure and model fit would be unexamined (Borsboom, Reference Borsboom2006). While it is typical to aggregate BPA variables based on theory and/or past research, there remains a need for empirical studies of unaggregated measures. Factor analysis provides a means to explore empirical associations between items and measures. These findings can be used in structural models for inference. We assume that all performances on cognitive tests, and by extension BPA data, reflect a combination of latent cognitive abilities/processes and noise/error. Traditional analyses do not permit examination or differentiation of signal and error, which can bias results from models involving cognitive variables (Nichols et al., Reference Nichols, Aslanyan, Adrien, Andrews, Fardo, Gavett, Paterson, Turney, Young, Uanhoro and Gross2024).
While factor models provide an alternative, this methodology still faces the problem of factor score indeterminacy (Guttman, Reference Guttman1955; McDonald & Bolt, Reference McDonald and Bolt1998; Rigdon et al., Reference Rigdon, Becker and Sarstedt2019; Waller, Reference Waller2023), in which any factor solution could produce a multitude of factor scores, resulting in a source of error when these scores are used to create composites outside of the factor structure from which they were derived. The current study employed structural equation models (SEMs), which, while complex, provide an optimal means to examine the predictive value of latent variables (McNeish, Reference McNeish2023). In addition, MI analyses were incorporated to assess whether a particular scale or set of items measured a particular construct in the same way for different groups.
We empirically assessed variable inclusion, factor retention, and factor structure, as well as model fit. For factor solutions that demonstrated superior fit, we assessed relative improvement with a bifactor model (Holzinger & Swineford, Reference Holzinger and Swineford1937). The bifactor model is a traditional means to conceptualize cognitive test performance with a general factor influencing all performances and specific factors reflecting test-specific variance (i.e., unrelated to the general factor). Given the nature of BPA data, including zero-inflation and count distribution, we employed a novel application of Kemeny metric space with maximum likelihood decomposition, which constructs a non-parametric covariance matrix built upon a generalized linear rank framework. This approach is optimal for our data, given affine-linear invariance over monotone transformations, resulting in stable linear decomposition and analysis (Emond & Mason, Reference Emond and Mason2002).
We assessed MI in a SEM framework (Borsboom, Reference Borsboom2006; Millsap, Reference Millsap1997) using the traditional four hierarchical levels (i.e., constraining various parameters to be equal and then comparing free and constrained models). First, we assessed the equivalence of the structural model between groups (configural invariance), then the equivalence of factor loadings (weak or metric invariance), then item intercepts (strong or scalar invariance), and finally the residual or unexplained variance (strict invariance).
Analytic plan
Analyses were conducted with the “psyc” and “lavaan” packages in R (Revelle, Reference Revelle2024; Rosseel et al., Reference Rosseel, Oberski, Byrnes, Vanbrabant, Savalei, Merkle, Hallquist, Rhemtulla, Katsikatsou and Barendse2014). All BPA variables were missing at less than 12%, all but three were missing at less than 10%, and 74.8% were missing less than 5% (x̄missing = 3.4%; median = 3%). Missing values were imputed using multiple imputation via random forests (k = 5). Visual inspection of density plots indicated no substantial difference between the distributions of the original and imputed data. To determine the appropriate number of latent factors, we employed several factor retention methods, including parallel analysis (Horn, Reference Horn1965; Lim & Jahng, Reference Lim and Jahng2019), the Minimum Average Partial (MAP) criterion (Velicer, Reference Velicer1976), and Very Simple Structure (VSS; (Revelle & Rocklin, Reference Revelle and Rocklin1979). Each of these methods has limitations; for example, parallel analysis tends to provide overly complex solutions with larger samples as simulated factors have eigenvalues close to 1 (Tran & Formann, Reference Tran and Formann2009). Since these methods produced divergent results in our study, we estimated the interpretability of various exploratory factor solutions. Model fit was then assessed with confirmatory factor analysis (CFA) in the “lavaan” package. The cut-point for item loadings to be included in confirmatory models was set at 0.3 (Fabrigar et al., Reference Fabrigar, Wegener, MacCallum and Strahan1999). An oblimin rotation was used for all exploratory models because these solutions improved confirmatory fit. Model fit was primarily assessed with the comparative fit index (CFI), the root mean square error of approximation (RMSEA), and the standardized root-mean-square residual (SRMR) (Bentler, Reference Bentler1990; Browne & Cudeck, Reference Browne, Cudeck, Bollen and Long1993; Hu & Bentler, Reference Hu and Bentler1999), using the following standard thresholds: CFI > 0.95, RMSEA < 0.06, and SRMR < 0.08 (Hu & Bentler, Reference Hu and Bentler1999). For MI analyses, groups were constructed based on cutoffs for age at BPA assessment (cutoff at age 65; n <65 = 694, n ≥65 = 1669), sex (male or female; n male = 1,082, nfemale = 1281), and education (cutoff of a high school diploma; n ≤12yrs = 731, n>12yrs = 1632). We did not assess MI with ethnicity because most participants identified as non-Hispanic White. Of note, age groups were chosen to assess the validity of a more liberal cutoff for older adults (i.e., 60+), versus the more traditional cutoff of 65, which allowed us to maximize the sample included. Following (Putnick & Bornstein, Reference Putnick and Bornstein2016) and (Chen, Reference Chen2007), we assessed MI with χ 2 difference tests and change in fit indices including decline ≥0.010 in CFI (ΔCFI), along with increase ≥0.015 in RMSEA (ΔRMSEA) or increase ≥0.030 in SRMR (ΔSRMR). Given that the model demonstrated adequate MI for age, sex, and education, we assessed the extent to which these demographic factors predicted latent components of the model. In the subsample with follow-up after BPA assessment (n = 2311), we also assessed the extent to which latent components predicted future conversion to dementia. We assessed the predictive value of general and specific factors separately given the complexity of the models and interpretation of these factors. However, all other components of the SEMs were held constant, including exogenous predictors (age, sex, and education). Dementia conversion was assessed with probit regression, which allows only approximate conversion to an odds ratio (OR) (Amemiya, Reference Amemiya1981). Unless otherwise specified, standardized regression weights are reported. As a final exploratory analysis, we trained machine-learning models with a random forest classifier to predict future conversion to dementia. See Supplemental Methods for details on training, tuning, and model interpretation. Model performance was estimated using five-fold cross-validation and pooled across imputed datasets, yielding accuracy, area under the receiver operating characteristic curve (AUC), area under the precision–recall curve (PR AUC), sensitivity, and specificity (Breiman, Reference Breiman2001). Because dementia conversion was rare (9.4%), PR AUC was selected as the primary performance metric (Saito & Rehmsmeier, Reference Saito and Rehmsmeier2015). The initial model was trained on traditional NP summary scores. A second model included only BPA variables. Finally, we evaluated a third model with combined NP/BPA data to examine incremental benefit with expanded predictors. To quantify the contribution of each predictor in the combined NP/BPA models, we computed permutation importance values, defined as the reduction in model performance after randomly permuting each variable (Fisher et al., Reference Fisher, Rudin and Dominici2019).
Results
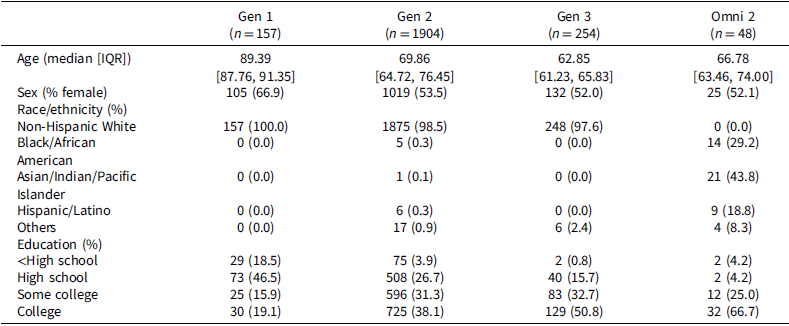
Demographic characteristics of the sample at baseline BPA assessment are presented in Table 1. The mean age was 71.5 ± 8.7 years old, and 54.2% of participants were female. The majority (95.5%, n = 2,255) had completed at least a high school education, and 38.8% held a college degree or higher (n = 916). Most participants identified as non-Hispanic White (96.5%, n = 2,280). Following the baseline BPA assessment, 9.6% of participants (n = 222) were diagnosed with all-cause dementia. Among those who converted, the median time to diagnosis was 5.22 years (interquartile range [IQR]: 2.93–8.54 years). Of the 108 participants who presented to BPA assessment with MCI, fewer than half later converted (46.3%; n = 50). Presence of MCI corresponded with a higher rate of conversion but still had poor sensitivity as a marker to correctly identify incipient dementia (only 22.5% of cases).
Demographic information by cohort at Boston process approach assessment

Table 1 Long description
The table presents demographic information across four cohorts at the Boston process approach assessment. It includes data on age, sex, race/ethnicity, and education levels. The table has four columns representing different cohorts (Gen 1, Gen 2, Gen 3, and Omni 2) and multiple rows detailing specific demographic variables. For example, the median age varies across cohorts, with Gen 1 having the highest median age of eighty-nine point three nine years and Gen 3 the lowest at sixty-two point eighty-five years. The percentage of females also differs, with Gen 1 having the highest percentage at sixty-six point nine percent and Omni 2 the lowest at fifty-two point one percent. The table also shows variations in race/ethnicity and education levels across the cohorts. For instance, Gen 1 is entirely non-Hispanic White, while Omni 2 has a significant percentage of Asian/Indian/Pacific Islanders at forty-three point eight percent. Education levels range from less than high school to college, with Gen 3 having the highest percentage of college-educated individuals at fifty point eight percent.
Note: Includes age at assessment, sex (male or female), race/ethnicity, and educational attainment.
Factor analyses
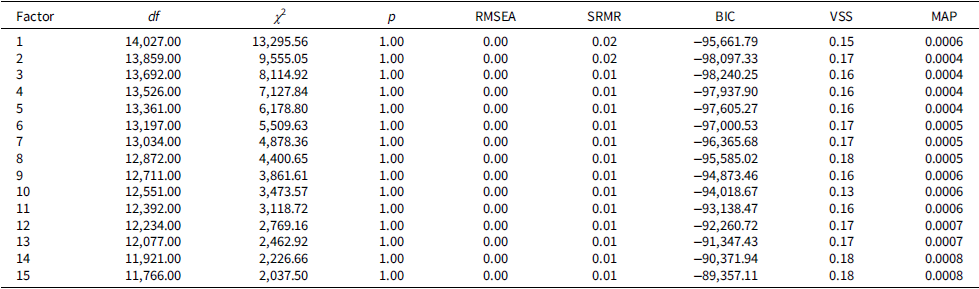
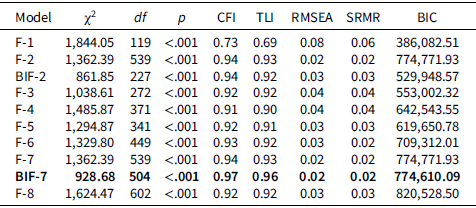
The Kaiser-Meyer-Olkin statistic evidenced sampling adequacy, KMO = 0.820 (Kaiser, Reference Kaiser1974). Bartlett’s test of sphericity (Bartlett, Reference Bartlett1951) indicated significant correlation between variables, χ2(14196) = 20659.08, p < 0.001. Parallel analysis resulted in retention of 7 factors. The MAP and VSS methods generated retention of 3 factors and 2 factors, respectively. Model fit improved with multi-dimensionality but without the same linearity. The best-fitting CFA models retained 2 and 7 factors. Of note, higher dimensional models did not converge and fit worsened (i.e., 8 factors and beyond). Bifactor solutions improved model fit for the best-fitting models. These two models retained 24 and 35 variables out of the 169 available BPA variables. The more complex model was chosen to capture more of the available BPA data, and, most importantly, because this was the only model with acceptable fit per a priori decided thresholds, χ 2(504) = 928.68, p < 0.001, CFI = 0.97, RMSEA = 0.02, SRMR = 0.02 (see Tables 2 and 3 and Figure 2).
Schematic Display of the Bifactor Model in the 60+ Sample (n = 2,363). Note: Individual items and loadings are omitted for visualization. See Supplemental Table 2a for a description of all items, Supplemental Table 5b for loadings, and Supplemental Table 6 for covariance between factors.

Figure 2 Long description
The diagram presents a schematic display of the bifactor model in a sample of 2,363 individuals aged 60 and above. It features a central general factor connected to seven specific factors, each influencing different cognitive tasks. The specific factors are labeled as Specific Factor 1 through Specific Factor 7, each leading to a corresponding cognitive task: Phonemic Fluency, Clock Drawing, Story Memory, Digit Span, Naming, and Paired Associates. Arrows indicate the directional influence of these factors on the general factor, illustrating how specific cognitive abilities contribute to overall cognitive performance. The diagram omits individual items and loadings for visualization purposes, with detailed descriptions and loadings available in supplemental tables.
Exploratory factor structure statistics (n = 2363)

Table 2 Long description
The table presents exploratory factor structure statistics for a sample size of 2363. It includes columns for Factor, degrees of freedom (df), chi-square (χ²), p-value (p), Root Mean Square Error of Approximation (RMSEA), Standardized Root Mean Square Residual (SRMR), Bayesian Information Criterion (BIC), Variance of the Scores (VSS), and Mean Absolute Percentage (MAP). The table has 15 rows, each representing a different factor. Notable trends include consistently high chi-square values and p-values of 1.00 across all factors, indicating a perfect fit. The RMSEA and SRMR values are consistently low, suggesting good model fit. The BIC values vary slightly across factors, with the lowest being -98,097.33 for Factor 2 and the highest being -89,357.11 for Factor 15. The VSS and MAP values also show minor variations across factors.
Note: Table displays number of factors retained, degrees of freedom (df), chi square (χ2), probability (p), root mean square error of approximation (RMSEA), standardized root mean square residual (SRMR), Bayes Information Criterion (BIC), Very Simple Structure (VSS) fit, and Velicer’s Minimum Average Partial (MAP) values.
Confirmatory fit statistics (n = 2,363)

Table 3 Long description
The table presents confirmatory fit statistics for eight models, labeled F-1 through F-8 and BIF-7. Each model includes values for chi-square, degrees of freedom, p-value, CFI, TLI, RMSEA, SRMR, and BIC. The chi-square values range from 1,844.54 to 92,868.50, with corresponding degrees of freedom ranging from 109 to 504. All p-values are less than 0.001, indicating significant results. The CFI values range from 0.73 to 0.97, and the TLI values range from 0.69 to 0.96. RMSEA values range from 0.08 to 0.02, and SRMR values range from 0.06 to 0.03. BIC values range from 386,082.51 to 820,528.50. Notable trends include improving model fit with increasing complexity, with the BIF-7 model showing the best fit according to predefined thresholds. The table highlights the trade-off between model complexity and fit, with higher-dimensional models not converging and fit worsening beyond seven factors.
Note: Table displays number of factors retained and model type (Factor[F] and Bifactor [BiF], respectively), chi square (χ2), degrees of freedom (df), probability (p), comparative fit index (CFI), Tucker–Lewis index (TLI), root mean square error of approximation (RMSEA), standardized root mean square residual (SRMR), and Bayes Information Criterion (BIC). Bold values indicate the model with best fit per a priori thresholds.
Measurement invariance
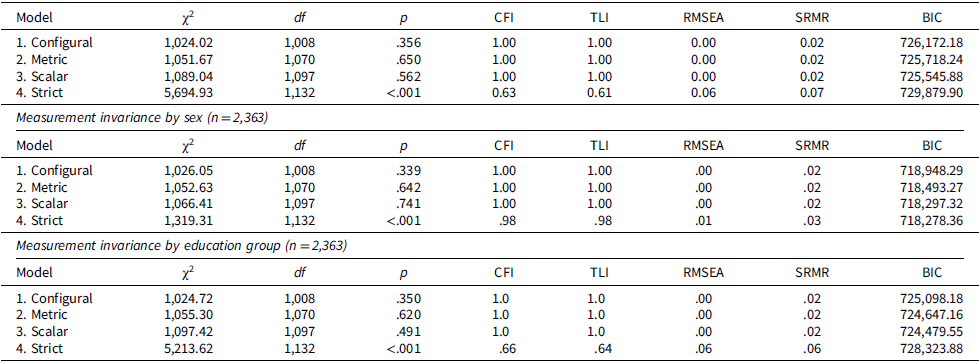
Overall, configural, metric, and scalar invariance held across age, sex, and education, but strict invariance did not fully hold for residuals. Regarding age, a multigroup CFA demonstrated configural invariance between age groups (respectively, n <65 = 694, n ≥65 = 1669; see Table 4). Constraining factor loadings demonstrated metric invariance, Δχ2(62) = 27.7, p > 0.999, ΔCFI = 0.001, ΔRMSEA = 0.000, ΔSRMR = 0.000. Constraining item intercepts demonstrated scalar invariance, Δχ2(27) = 37.4, p = 0.088, ΔCFI = 0.000, ΔRMSEA = 0.000, ΔSRMR = 0.002. However, constraining residuals did not demonstrate strict invariance between age groups, Δχ2(35) = 4605.9, p < 0.001, ΔCFI = 0.373, ΔRMSEA = 0.058, ΔSRMR = 0.047. Regarding sex (male or female), a multigroup CFA demonstrated configural invariance (respectively, n male = 1,082, nfemale = 1281; see Table 4). Constraining factor loadings demonstrated metric invariance, Δχ2(62) = 26.6, p = 1.000, ΔCFI = 0.001, ΔRMSEA = 0.000, ΔSRMR = 0.001, and constraining item intercepts demonstrated scalar invariance, Δχ2(27) = 13.8, p = 0.983, ΔCFI = 0.000, ΔRMSEA = 0.000, ΔSRMR = 0.000. However, constraining residuals demonstrated questionable strict invariance between males and females, Δχ2(35) = 252.9, p < 0.001, ΔCFI = 0.015, ΔRMSEA = 0.012, ΔSRMR = 0.004. Finally, regarding education (high school diploma or less versus some college or a college degree), a multigroup CFA demonstrated configural invariance (respectively, n ≤12yrs = 731, n>12yrs = 1632; see Table 4). Constraining factor loadings demonstrated metric invariance, Δχ2(62) = 30.6, p = 1.000, ΔCFI = 0.001, ΔRMSEA = 0.000, ΔSRMR = 0.001, and constraining item intercepts demonstrated adequate scalar invariance, Δχ2(27) = 42.1, p = 0.032, ΔCFI = 0.000, ΔRMSEA = 0.001, ΔSRMR = 0.001. However, constraining residuals did not demonstrate strict invariance between education groups, Δχ2(35) = 4116.2, p < 0.001, ΔCFI = 0.345, ΔRMSEA = 0.054, ΔSRMR = 0.040.
Model interpretation
General factor
The general factor reflected overall propensity to produce correct or strategic responses and avoid committing errors of various types. Of note, this is not the same as achievement or even general cognitive ability on testing, but rather a latent construct reflected in all retained BPA metrics, and which is unique from specific factors. Likewise, specific factors reflected instrumental aspects of the NP tests from which they were derived, and subtle aspects of cognitive performance indexed by these measures. See Supplemental Tables 2a, 5b for description of BPA variables and CFA factor loadings; Supplemental Table 2b provides a description of BPA variables not retained in the model.
Letter fluency
BPA variables from letter fluency created a specific factor that was reflected in correct responses produced across time intervals. Earlier time intervals (i.e., 0–15 s and 16–30 s) had a slightly higher loading gradient, particularly for the F and A trials. Earlier time intervals also loaded higher on the general factor for the first and second trial of the task, whereas the latter time intervals loaded higher on the general factor for the S trial. There was a very slight loading gradient across time intervals and trials (S > A > F).
Clock drawing
BPA variables from clock drawing (command, copy, and number placement) created a specific factor derived from components of anchoring, which is considered an effective organizational strategy (Lamar et al., Reference Lamar, Ajilore, Leow, Charlton, Cohen, GadElkarim, Yang, Zhang, Davis, Penney, Libon and Kumar2016). These variables all loaded positively on the general factor, with slightly higher loadings for the command condition and for anchor digits three and nine (across conditions). This may represent relative importance for initiating and sustaining anchoring, particularly on command.
Naming
BPA variables from naming created a specific factor that consisted of circumlocution and semantic paraphasia errors. The count of circumlocution errors loaded slightly higher on both the general and specific factor.
Digit span
BPA variables from digit span created a specific factor that appeared to separate attention (derived from digit span forward) from working memory (derived from digit span backward). Of note, the “testing the limits” variable (longest digit span with correct numbers regardless of sequence) was more reflective of this attentional component but not working memory or general ability. In addition, BPA variables related to working memory had a higher loading on the general factor.
Logical memory
BPA variables from story memory created two specific factors. The first included verbatim details that were produced during learning and recall. These counts demand a higher accuracy of recall than the traditional summary measure on the task, which allows paraphrased details. The second specific factor included conceptually related errors (i.e., new or altered details that change the meaning of target information). These errors can be considered “near misses” or “gist errors” since unlike paraphrased details, they are not acceptable for credit. Of note, the two specific factors were not significantly related, β = −0.02, 95% CI (−0.07, 0.04). As expected, verbatim recall loaded positively on the general factor; however, gist errors also had a small positive loading (suggesting even “near misses” on a memory task index some element of cognitive ability).
Paired associates
BPA variables from paired associates created a specific factor that consisted of errors while learning and recalling word pairs (i.e., interference from target words not paired with the stimulus word and “gist errors” on delay, incorrect words that were conceptually related to the stimulus word). Interference errors on the third learning trial and delay were most reflective of the specific ability/tendency. Also, these variables had a negative loading on the general factor, particularly interference errors on the third learning trial.
Covariance between specific factors
We examined the covariance structure among specific factors to explore whether distinct cognitive processes co-occurred across tasks. Participants who produced more words across time intervals during letter fluency also tended to anchor on clock drawing (φ = 0.11, 95% CI [0.05, 0.16]), learned and recalled more verbatim details from stories (φ = 0.22, 95% CI [0.16, 0.28]), and had more “near misses” on story memory (φ = 0.08, 95% CI [0.02, 0.14]). These participants also produced fewer errors on naming (φ = −0.19, 95% CI [−0.28, −0.10]), and while learning/recalling word pairs (φ = −0.12, 95% CI [−0.19, −0.05]). There were similar associations between anchoring on clock drawing and verbatim recall, naming errors, and errors while learning/recalling word pairs (see Supplemental Table 6). However, the specific factor derived from digit span, which largely reflected attention, was not significantly associated with other specific factors. Also, “near misses” on story memory was not associated with most other specific factors, aside from letter fluency across time intervals (as reported) and errors on naming, φ = 0.11, 95% CI (0.02, 0.20). These associations suggest possible executive functioning and semantic components were distributed across the specific factors, rather than centralized in particular measures. Due to the nature of the bifactor model, these associated factors were independent from general ability. We next examined whether these latent cognitive factors predicted incipient dementia.
Structural equation models
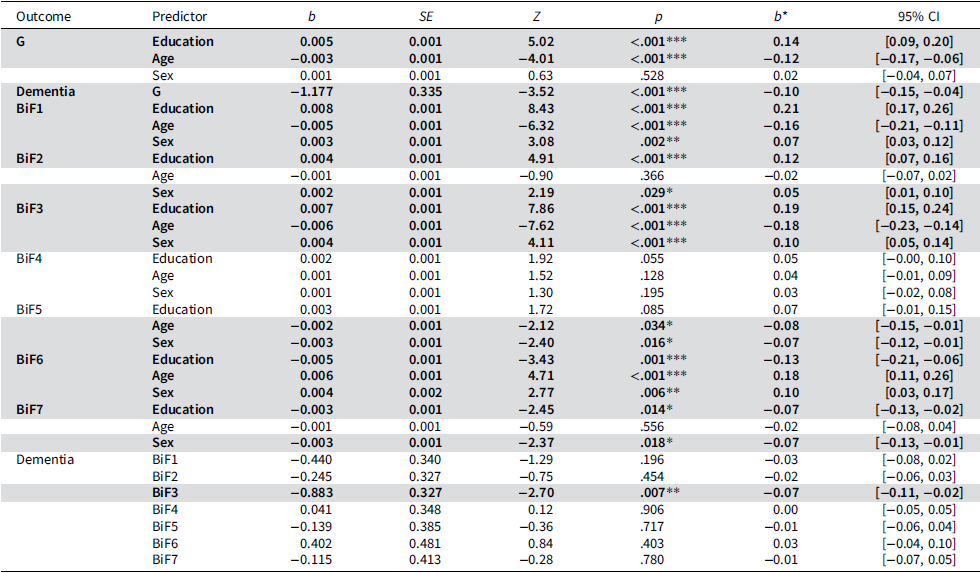
Participants that were higher on the general factor were significantly less likely to develop all-cause dementia, OR = 0.15 (95% CI 0.12–0.86). Likewise, higher verbatim recall of story details at BPA assessment was associated with reduced odds of developing all-cause dementia, OR = 0.24 (95% CI 0.230.90). Other specific factors were not significantly related to future conversion (see Table 5). In these same models, older age and lower education were broadly associated with lower general factor scores (β age = −0.12, 95% CI [−0.17, −0.06]; β edu = 0.14, 95% CI [0.09, 0.20]) and reduced verbatim recall (β age = −0.18, 95% CI [−0.23, −0.14]; β edu = 0.19, 95% CI [0.15, 0.24]). This pattern of association was generally consistent for most specific factors, in which older participants with lower educational attainment produced fewer correct or strategic responses and committed more errors of various types. Sex differences were more nuanced, with females outperforming males on several tests including recall (β = 0.10, 95% CI [0.05, 0.14]) and paired associates (β = −0.07, 95% CI [−0.13, −0.01]), but showing more errors on naming (β = 0.10, 95% CI [0.03, 0.17]) and worse performance on the attention factor (β = −0.07, 95% CI [−0.12, −0.01]). Biological sex was not significantly associated with gist errors on story memory (β = 0.03, 95% CI [−0.02, 0.08]). See Supplemental Figure 1 for visualization of demographic pathways. In sum, latent general ability and verbatim recall were the strongest predictors of incident dementia, reinforcing their potential as early cognitive markers. In addition, the association between demographic variables and latent factors in the model demonstrated better performance in general for younger participants with higher educational attainment.
Measurement invariance by age group (n = 2,363)

Table 4 Long description
The table presents data on measurement invariance by age group for a sample size of 2,363 participants. It compares four models: Configural, Metric, Scalar, and Strict. Each model includes values for chi-square, degrees of freedom, p-value, Comparative Fit Index (CFI), Tucker-Lewis Index (TLI), Root Mean Square Error of Approximation (RMSEA), Standardized Root Mean Square Residual (SRMR), and Bayesian Information Criterion (BIC). The Configural model shows a chi-square value of 1,024.02, degrees of freedom of 1,008, and a p-value of 0.356. The Metric model has a chi-square value of 1,051.67, degrees of freedom of 1,070, and a p-value of 0.650. The Scalar model presents a chi-square value of 1,089.04, degrees of freedom of 1,097, and a p-value of 0.562. The Strict model shows a chi-square value of 5,694.93, degrees of freedom of 1,132, and a p-value of less than 0.001. The table highlights the differences in fit indices across these models, with the Strict model showing the poorest fit.
Note: Table displays fit for multigroup confirmatory factor analysis and then weak, strong, and strict invariance (respectively). The 60+ sample employs a Bifactor-7 model. Age groups reflect a cut point of 65. Sex reflects male or female. Education groups reflect those with a high school diploma or less versus some college or a college degree. Chi square (χ 2), degrees of freedom (df), probability (p), comparative fit index (CFI), Tucker–Lewis index (TLI), root mean square error of approximation (RMSEA), standardized root mean square residual (SRMR), and Bayes Information Criterion (BIC).
Machine learning models
Models with only NP summary scores accurately predicted dementia conversion in 88.4% of participants (PR AUC = 0.96, AUC = 0.73; pooled across five imputations). Models with BPA data had 90.2% accuracy (PR AUC = 0.95, AUC = 0.74), whereas combined NP/BPA data altered classification performance to 90.1% accuracy (PR AUC = 0.96, AUC = 0.76). Most importantly, sensitivity increased to detect almost all cases of dementia conversion in models with BPA variables. Across imputations, 99.4% of converters were identified with BPA data and 99.1% with combined NP/BPA data, versus 95.9% without BPA data. There were also fewer false positives (87.6% specificity with NP data, 89.2% with BPA data, and 89.1% with combined NP/BPA data). In permutation-importance analyses, BPA variables accounted for 83.9% of total predictive contribution, representing 88.0% of the 25 most influential predictors and 80.0% of the top 50 (see Supplemental Figure 2). Among the most influential predictors were letter and semantic fluency subcomponents, instructional errors (e.g., violating instructions to not lift pen on trail-making), errors suggesting inability to complete recall tasks, perseveration errors, isolate errors, partially correct responses (similarities), circumlocution and phonemic paraphasia errors on naming, self-corrected errors on clock drawing (command), and story gist recall.
Discussion
Quantified BPA data highlight the richness of NP testing, capturing subtle aspects of cognitive performance that are often unexamined with traditional summary scores. Across multiple measures, these results suggest summary scores are not complete indicators of the abilities that determine process and achievement on a task. As a complement to these traditional scores, constituent BPA data provide important and nuanced information on process and achievement. The novel methodology employed in this study enabled data-driven model development, accommodating the complexity and heterogeneity of the data. Our results suggest that multi-dimensional bifactor models are appropriate, with a general factor that reflects both propensity for correct/strategic responses and avoidance of errors. In addition, distinct NP tests yielded one or more specific latent factors, likely capturing test-specific variance while also reflecting nuanced cognitive features based on differences in factor loadings, dimensionality, and covariance. In structural models, we found that demographics were associated with latent factors in expected patterns, and that these same factors predicted incipient dementia. Based on the dataset, exploratory machine learning (ML) models identified 220 to 221 of the 222 participants who were later diagnosed with all-cause dementia (99.3% across imputations).
These findings have both psychometric and clinical relevance in reinforcing and informing the clinical use of NP tests. Confirmatory fit reflected the distinct cognitive abilities indexed by tasks such as digit span forward and backward. Specific errors, such as gist errors on story memory or interference during paired-associate learning, loaded onto discrete factors, consistent with prior work demonstrating their distinctness and diagnostic relevance (Loewenstein et al., Reference Loewenstein, Acevedo, Luis, Crum, Barker and Duara2004). Model fit also captured aspects of task process and achievement reflected in BPA data. For example, the loadings for letter fluency were not identical across time intervals and trials. While the overall range was narrow (0.38–0.48), the observed gradients could reflect how trial segments relate to underlying ability, consistent with commonly described clinical observation of task initiation and persistence. Likewise, digit span sequence recall versus number recall differentially reflected attentional versus working memory demands that would be aggregated with traditional scoring. Although modest, these differences align with standard clinical interpretation of performance.
Another noteworthy exception to conventional scoring was gist errors on story memory (i.e., new or altered details that are conceptually related to target information, but which do not qualify for credit). These “errors” were weakly but positively associated with the general factor. This suggests that gist-based errors may reflect a subtle aspect of memory ability, which is not captured by a summary score. Understanding “near misses” as reflective of ability is consistent with the BPA, and with extensive research on gist memory in neurodegenerative disorders. For example, previous studies suggest gist memory may serve as a compensatory or backup memory system when verbatim recall fails, which is also compromised in patients with AD compared to healthy controls (see Budson et al., Reference Budson, Todman and Schacter2006; Deason et al., Reference Deason, Hussey, Budson and Ally2012; Gallo et al., Reference Gallo, Shahid, Olson, Solomon, Schacter and Budson2006).
It is also notable that in the partitioning of signal and noise, variables derived from tests associated with executive resources loaded the highest on the general factor (Marko et al., Reference Marko, Michalko, Dragašek, Vančová, Jarčušková and Riečanský2023; Roussel et al., Reference Roussel, Dujardin, Hénon and Godefroy2012; Waris et al., Reference Waris, Soveri, Ahti, Hoffing, Ventus, Jaeggi, Seitz and Laine2017), particularly Digit Span (Backward > Forward; Gignac & Weiss, Reference Gignac and Weiss2015). Importantly, however, almost all NP tests contributed to the general factor, and inter-factor associations suggested distributed executive and semantic processes that were influential across tests. Taken together, these findings challenge the one-test-one-domain framework, and highlight the BPA’s utility in capturing the full cognitive profile needed to inform diagnosis (Ashendorf et al., Reference Ashendorf, Swenson and Libon2013; Casaletto & Heaton, 2017; Harvey, Reference Harvey2019).
Our psychometric analyses suggested that BPA-derived factors had stable measurement properties across age, sex, and education groups in older adults. Thus, observed differences in latent variables reflect genuine performance variation rather than measurement artifacts (Borsboom, Reference Borsboom2006; Millsap, Reference Millsap1997). Most of the demographic effects followed expected patterns, in which older participants with lower educational attainment produced fewer correct or strategic responses and committed more errors. However, some variables such as anchoring during clock drawing, “near misses” on story memory, and errors while learning/recalling word pairs were robust to these demographic influences. Similarly, sex-based differences were mixed, with females outperforming males on some specific factors but not on general ability.
This study reveals the feasibility of using complex models with quantified BPA data to identify individuals at risk for future cognitive decline. While traditional NP summary scores contained considerable predictive value for incipient dementia, BPA data improved those models. ML methods were able to identify almost all cases of dementia conversion, and BPA variables were highly influential in their predictive contribution. We prioritized sensitivity in our interpretation because of the importance to early detection, and given relatively limited consequences for specificity (i.e., aside from possible unnecessary testing/monitoring). It is debatable whether the modest improvement in model performance supports BPA data collection. However, for individuals impacted, even a small improvement could have meaningful clinical value. In addition, as stated in the introduction, digital technologies will likely make such collection more feasible in clinical settings. These models could be used to generate individualized risk estimates for dementia, although external validation in multiple samples would be required before they could be considered reliable for clinical use.
Most importantly, the methods used in this study permit an interpretable structural model even with a small number of tests for each cognitive function. Based on the approximate odds ratios, a standard deviation reduction in the general factor was associated with over sixfold increased odds of converting to dementia at a later timepoint. Likewise, a standard deviation reduction in verbatim recall on story memory was associated with approximately fourfold greater odds of dementia conversion. Other variables were informative primarily through their contribution to general ability. In sum, BPA data are sensitive to subtle cognitive changes that predict incipient dementia. However, it is the combination of psychometric and ML methods used in this study that provides complementary support for the value of NP and BPA data. On their own, ML models do not clarify measurement properties or reveal what tests measure (e.g., underlying abilities translatable to daily life), and psychometric models do not prioritize predictive accuracy over other model objectives.
There are limitations to our study. While there are numerous advantages to the methodological approach, the structural models we employed do not permit survival analyses (i.e., prediction of time to dementia). Future studies could employ the models derived from this study in hierarchical time-to-event models (e.g., using similar methodology to Nichols et al., Reference Nichols, Aslanyan, Adrien, Andrews, Fardo, Gavett, Paterson, Turney, Young, Uanhoro and Gross2024), as well as alternate psychometric approaches including Multidimensional Item Response Theory and Multiple Correspondence Analysis (Greenacre, Reference Greenacre1988; Reckase, Reference Reckase1997). Based on restricted ethnic and cultural diversity in the sample, we were unable to assess MI for these groups or validly assess group differences on any of the latent factors. In the future, this should be possible given FHS efforts to increase diversity with Omni 1 and Omni 2 cohorts (Andersson et al., Reference Andersson, Johnson, Benjamin, Levy and Vasan2019). In addition, we examined prediction of all-cause dementia; future studies should employ similar approaches with specific neurodegenerative etiologies, as different BPA variables could be sensitive to decline in each of these groups.
Retained structural models do not include most available BPA variables. This is likely due to the zero-inflated nature for many of these counts. For some tests, this excluded specific types of errors or strategic responses; for other tests, models were unable to distinguish between erroneous responses and lack of response. This study is proposed as a foundational attempt to model this type of data in a community sample of older adults. Future studies using similar methods with specific clinical samples may find different combinations of BPA variables to be informative. In addition, we conducted exploratory ML analyses in an effort to examine the relative predictive value for all BPA variables as well as NP summary scores. As noted, we did not exclude participants presenting for BPA assessment with MCI. The sensitivity to incipient dementia with this level of impairment was poor, and most importantly, proper diagnosis of MCI requires expert clinical review, which differs from the statistical models reported here.
This study involved psychometric modeling and empirical evaluation of constituent BPA data rather than compiled measures based on BPA theory or past research (grouping errors based on type across measures, computing ratios, etc.). As discussed in Measurements and Latent Factors, there would be error in these groupings that could not be properly evaluated. Of note, our factor models contain equivalent information to some of these groupings/ratios, but with expanded information on factor configuration, processes across tests, and error. Nonetheless, it must be acknowledged that some variables excluded from models might have been retained with compiled measures. This was intended as a foundation study using only empirical, data-driven methods, intended to support future studies employing more traditional BPA theory to derive composites. Future studies should also expand on ensemble models with both BPA variables and NP summary scores. Exploratory ML analyses in this study suggest that BPA data may assist optimal dementia prediction. It may also be possible to construct a rule-list using classification and regression trees, which could reveal the particular patients for which BPA data add value (e.g., patients with similar summary scores profiles but distinct errors that predict future conversion to dementia). However, external validation will be essential to establish generalizability of these findings.
The psychometric approaches employed in this study are presented as opportunities for researchers to better understand NP data, rather than restrictions or rules to follow (Borsboom, Reference Borsboom2006). Study findings support the use of BPA data in studies of aging and help to bridge the gap between clinical interpretation of NP tests and research utilization of these same data.
Regression table for the 60+ sample (N = 2,363)

Table 5 Long description
The table presents a regression analysis for a sample of 2,363 individuals aged 60 and above. It includes non-standardized and standardized effects from the Bifactor-7 model for general (G) and specific factors (BiF1-7) derived from Boston Process Approach (BPA) variables. The latent factors are predicted by educational attainment, age at BPA assessment, and sex (male or female). Future conversion to dementia (Dementia) is also predicted by these latent factors. The table is divided into several sections, each focusing on different predictors and outcomes. Key predictors include Education, Age, and Sex, with their respective coefficients (b), standard errors (SE), Z-values, p-values, standardized effects (b*), and 95% confidence intervals (CI). Notable trends include significant effects of education and age on general and specific factors, as well as the prediction of dementia. The table highlights the complex relationships between these variables and their impact on cognitive factors and dementia risk.
Note: Table displays non-standardized and standardized effects from the Bifactor-7 model for general (G) and specific factors (BiF1-7) derived from Boston Process Approach (BPA) variables. Latent factors were predicted by educational attainment, age at BPA assessment, and sex (male or female). Future conversion to dementia (Dementia) is predicted by these same latent factors. Pathways involving the general and specific factors were assessed separately given the complexity of the model and interpretation of these factors.
Supplementary material
The supplementary material for this article can be found at https://doi.org/10.1017/S1355617726101921.
Acknowledgements
None.
Funding statement
This work was supported by the Framingham Heart Study of the National Heart Lung and Blood Institute of the National Institutes of Health and Boston University School of Medicine. This project has been funded in whole or in part with Federal funds from the National Heart, Lung, and Blood Institute, National Institutes of Health, Department of Health and Human Services, under Contract No. 75N92019D00031. This work was also supported or informed by U19 AG068753, R01-AG072654, R01-AG062109, R01AG083735, U01AG068221, K07-AG066813, and K01-AG057798 from the National Institute on Aging, U.S. Department of Veterans Affairs (VA) Merit Award (CX002400), and a VA Career Development Awards (CX002625). The authors acknowledge the Framingham Heart Study participants and researchers for their efforts over the years, without whom this study would not be possible.
Competing interests
RA is Scientific Advisor to Signant Health and NovoNordisk. The remaining authors have no conflicts to report.


 Open access