
1 Introduction
The purpose of this paper is to describe, and illustrate with numerical examples, the fundamentals of a branch of continuous optimization dedicated to problems in imaging science, in particular image reconstruction, inverse problems in imaging, and some simple classification tasks. Many of these problems can be modelled by means of an ‘energy’, ‘cost’ or ‘objective’ which represents how ‘good’ (or bad!) a solution is, and must be minimized.
These problems often share a few characteristic features. One is their size, which can be very large (typically involving at most around a billion variables, for problems such as three-dimensional image reconstruction, dense stereo matching, or video processing) but usually not ‘huge’ like some recent problems in learning or statistics. Another is the fact that for many problems, the data are structured in a two- or three-dimensional grid and interact locally. A final, frequent and fundamental feature is that many useful problems involve non-smooth (usually convex) terms, for reasons that are now well understood and concern the concepts of sparsity (DeVore Reference DeVore1998, Candès, Romberg and Tao Reference Candès, Romberg and Tao2006b, Donoho Reference Donoho2006, Aharon, Elad and Bruckstein Reference Aharon, Elad and Bruckstein2006) and robustness (Ben-Tal and Nemirovski Reference Ben-Tal and Nemirovski1998).
These features have strongly influenced the type of numerical algorithms used and further developed to solve these problems. Due to their size and lack of smoothness, higher-order methods such as Newton’s method, or methods relying on precise line-search techniques, are usually ruled out, although some authors have suggested and successfully implemented quasi-Newton methods for non-smooth problems of the kind considered here (Ito and Kunisch Reference Ito and Kunisch1990, Chan, Golub and Mulet Reference Chan, Golub and Mulet1999).
Hence these problems will usually be tackled with first-order descent methods, which are essentially extensions and variants of a plain gradient descent, appropriately adapted to deal with the lack of smoothness of the objective function. To tackle non-smoothness, one can either rely on controlled smoothing of the problem (Nesterov Reference Nesterov2005, Becker, Bobin and Candès Reference Becker, Bobin and Candès2011) and revert to smooth optimization techniques, or ‘split’ the problem into smaller subproblems which can be exactly (or almost) solved, and combine these resolutions in a way that ensures that the initial problem is eventually solved. This last idea is now commonly referred to as ‘proximal splitting’ and, although it relies on ideas from as far back as the 1950s or 1970s (Douglas and Rachford Reference Douglas and Rachford1956, Glowinski and Marroco Reference Glowinski and Marroco1975), it has been a very active topic in the past ten years in image and signal processing, as well as in statistical learning (Combettes and Pesquet Reference Combettes and Pesquet2011, Parikh and Boyd Reference Parikh and Boyd2014).
Hence, we will focus mainly on proximal splitting (descent) methods, and primarily for convex problems (or extensions, such as finding zeros of maximal-monotone operators). We will introduce several important problems in imaging and describe in detail simple first-order techniques to solve these problems practically, explaining how ‘best’ to implement these methods, and in particular, when available, how to use acceleration tricks and techniques to improve the convergence rates (which are generally very poor for such methods). This point of view is very similar to the approach in a recent tutorial of Burger, Sawatzky and Steidl (Reference Burger, Sawatzky and Steidl2014), though we will describe a larger class of problems and establish connections between the most commonly used first-order methods in this field.
Finally, we should mention that for many imaging problems, the grid structure of the data is well suited for massively parallel implementations on GPUs, and hence it is beneficial to develop algorithms that preserve this property.
The organization of this paper is as follows. We will first describe typical (simple) problems in imaging and explain how they can be reduced to the minimization of relatively simple functions, usually convex. Then, after a short introduction to the basic concepts of convexity in Section 3, we will describe in Sections 4 and 5 the classes of algorithms that are currently used to tackle these problems, illustrating each algorithm with applications to the problems introduced earlier. Each time, we will discuss the basic methods, convergence results and expected rates, and, when available, acceleration tricks which can sometimes turn a slow and inefficient method into a useful practical tool. We will focus mainly on two families of methods (whose usefulness depends on the structure of the problem): first-order descent methods and saddle-point methods. Both can be seen as either variants or extensions of the ‘proximal-point algorithm’ (Martinet Reference Martinet1970), and are essentially based on iterations of a  $1$-Lipschitz operator; therefore, in Appendix A we will very briefly recall the general theory for such iterative techniques. It does not apply to accelerated variants which are not usually contractive (or not known to be contractive), but rates of convergence can be estimated; see Appendices B and C.
In a final theoretical section (Section 6) we will briefly introduce some extensions of these techniques to non-convex problems.
Then, in Section 7, we will review a series of practical problems (e.g., first- and higher-order regularization of inverse problems, feature selection and dictionary learning, segmentation, basic inpainting, optical flow), each time explaining which methods can be used (and giving the implementations in detail), and how methods can be tuned to each problem. Of course, we do not claim that we will always give the ‘optimal’ method to solve a problem, and we will try to refer to the relevant literature where a more thorough study can be found.
Our review of first-order algorithms for imaging problems is partly inspired by our own work and that of many colleagues, but also by important textbooks in optimization (Polyak Reference Polyak1987, Bertsekas Reference Bertsekas2015, Ben-Tal and Nemirovski Reference Ben-Tal and Nemirovski2001, Nesterov Reference Nesterov2004, Boyd and Vandenberghe Reference Boyd and Vandenberghe2004, Nocedal and Wright Reference Nocedal and Wright2006, Bauschke and Combettes Reference Bauschke and Combettes2011). However, we have tried to keep the level of detail as simple as possible, so that most should be accessible to readers with very little knowledge of optimization theory. Naturally we refer the interested reader to these references for a deeper understanding of modern optimization.
Finally we should mention that we will overlook quite a few important problems and methods in imaging. First, we will not discuss combinatorial optimization techniques for regularization/segmentation, as we fear that this would require us to almost double the size of the paper. Such methods, based on graph cuts or network flows, are very efficient and have been extensively developed by the computer vision community to tackle most of the problems we address here with continuous optimization. As an example, the paper of Boykov, Veksler and Zabih (Reference Boykov, Veksler and Zabih2001), which shows how to minimize the ‘Potts’ model (7.25) using graph-cuts, attains almost 6000 citations in Google Scholar, while the maximal flow algorithm of Boykov and Kolmogorov (Reference Boykov and Kolmogorov2004) is cited more than  $3500$ times. We believe the two approaches complement one another nicely: they essentially tackle the same sort of problems, with similar structures, but from the perspective of implementation they are quite different. In particular, Hochbaum (Reference Hochbaum2001) presents an approach to solve exactly a particular case of Problem 2.6 in polynomial time; see also Darbon and Sigelle (Reference Darbon and Sigelle2006a, Reference Darbon and Sigelle2006b) (the variant in Chambolle and Darbon Reference Chambolle, Darbon, Lézoray and Grady2012 might be more accessible for the reader unfamiliar with combinatorial optimization). In general, graph-based methods are harder to parallelize, and can approximate fewer general energies than methods based on continuous optimization. However, they are almost always more efficient than non-parallel iterative continuous implementations for the same problem.
We will also ignore a few important issues and methods in image processing: we will not discuss many of the ‘non-local’ methods, which achieve state of the art for denoising (Dabov, Foi, Katkovnik and Egiazarian Reference Dabov, Foi, Katkovnik and Egiazarian2007, Buades, Coll and Morel Reference Buades, Coll and Morel2005, Buades, Coll and Morel Reference Buades, Coll and Morel2011). Although these approaches were not introduced as ‘variational’ methods, it is now known that they are closely related to methods based on structured sparsity (Danielyan, Katkovnik and Egiazarian Reference Danielyan, Katkovnik and Egiazarian2012) or (patch-based) Gaussian mixture models (Mallat and Yu Reference Mallat and Yu2010, Yu, Sapiro and Mallat Reference Yu, Sapiro and Mallat2012, Lebrun, Buades and Morel Reference Lebrun, Buades and Morel2013) and can be given a ‘variational’ form (Gilboa, Darbon, Osher and Chan Reference Gilboa, Darbon, Osher and Chan2006, Kindermann, Osher and Jones Reference Kindermann, Osher and Jones2005, Peyré, Bougleux and Cohen Reference Peyré, Bougleux and Cohen2008, Arias, Facciolo, Caselles and Sapiro Reference Arias, Facciolo, Caselles and Sapiro2011). The numerical algorithms to tackle these problems still need a lot of specific tuning to achieve good performance. We will address related issues in Section 7.12 (on ‘Lasso’-type problems) and present alternatives to non-local denoising.
Moreover, we will not mention the recent developments in computer vision and learning based on convolutional neural networks, or CNNs (LeCun et al. Reference LeCun, Boser, Denker, Henderson, Howard, Hubbard and Jackel1989, Krizhevsky, Sutskever and Hinton Reference Krizhevsky, Sutskever and Hinton2012), which usually achieve the best results in classification and image understanding. These models (also highly non-local) are quite different from those introduced here, although there is a strong connection with dictionary learning techniques (which could be seen as a basic ‘first step’ of CNN learning). Due to the complexity of the models, the optimization techniques for CNNs are very specific and usually rely on stochastic gradient descent schemes for smoothed problems, or stochastic subgradient descent (Krizhevsky et al. Reference Krizhevsky, Sutskever and Hinton2012, LeCun, Bottou, Orr and Muller Reference LeCun, Bottou, Orr, Muller, Orr and Muller1998b). The second author of this paper has recently proposed a framework which in some sense bridges the gap between descent methods or PDE approaches and CNN-based learning (Chen, Ranftl and Pock Reference Chen, Ranftl and Pock2014b).
More generally, we will largely ignore recent developments in stochastic first-order methods in optimization, which have been driven by big data applications and the need to optimize huge problems with often billions of variables (in learning and statistics, hence also with obvious applications to image analysis and classification). We will try to provide appropriate references when efficient stochastic variants of the methods described have recently been developed.
We now describe, in the next section, the key exemplary optimization problems which we are going to tackle throughout this paper.
2 Typical optimization problems in imaging
First let us give the reader a taste of typical optimization problems that arise from classical models in image processing, computer vision and machine learning. Another of our goals is to give a short overview of typical applications of variational models in imaging; more specific models will then be described in Section 7. Among the most important features in images are edges and texture. Hence, an important property of models in image processing is the ability to preserve sharp discontinuities in their solutions in order to keep precise identification of image edges. Another goal of most models is robustness (Ben-Tal and Nemirovski Reference Ben-Tal and Nemirovski1998, Ben-Tal, El Ghaoui and Nemirovski Reference Ben-Tal, El Ghaoui and Nemirovski2009), that is, the solution of a model should be stable in the presence of noise or outliers. In practice this implies that successful models should be non-smooth and hence non-differentiable. Indeed, a successful approach to these issues is known to be realized by the minimization of robust error functions based on norm functions. Classical optimization algorithms from non-linear optimization, such as gradient methods, Newton or quasi-Newton methods, cannot be used ‘out of the box’ since these algorithms require a certain smoothness of the objective function or cannot be applied to large-scale problems – hence the need for specialized algorithms that can exploit the structure of the problems and lead efficiently to good solutions.
2.1 Sparse representations
An important discovery in recent years (Candès et al. Reference Candès, Romberg and Tao2006b, Donoho Reference Donoho2006, Aharon et al. Reference Aharon, Elad and Bruckstein2006) is the observation that many real-world signals can be modelled via sparse representation in a suitable basis or ‘dictionary’. This property can be used to reconstruct a signal from far fewer measurements than required by the Shannon–Nyquist sampling theorem, for example, which states that the sampling frequency should be at least twice as high as the highest frequency in the signal. Furthermore, a sparse representation of a signal is desirable since it implies a certain robustness in the presence of noise. Given an input signal  $b\in \mathbb{R}^{m}$, a sparse representation in the dictionary
  $A=(a_{i,j})_{i,j}\in \mathbb{R}^{m\times n}$ of
  $n$ column vectors
  $(a_{i,j})_{i=1}^{m}$ can be found by solving the following optimization problem (Mallat and Zhang Reference Mallat and Zhang1993, Chen, Donoho and Saunders Reference Chen, Donoho and Saunders1998):
 $$\begin{eqnarray}\begin{array}{@{}l@{}}\displaystyle \displaystyle \min _{x}f(x)\\ \displaystyle \text{such that }Ax=b,\end{array}\end{eqnarray}$$
 where  $x\in \mathbb{R}^{n}$ is the unknown coefficient vector. This model is usually known by the name basis pursuit (Chen and Donoho Reference Chen and Donoho1994). Since each column of
  $A$ can be interpreted as a basis atom, the equality constraint
  $Ax=b$ describes the fact that the signal
  $b$ should be represented as a sparse linear combination of those atoms. The function
  $f(x)$ is a sparsity-inducing function, such as
  $f(x)=\Vert x\Vert _{1}:=\sum _{i}|x_{i}|$ in the most simple case.
If some further prior knowledge concerning a relevant group structure is available, one can encode such information in the sparsity-inducing function. This idea is known as group sparsity, and is widely used in data analysis. It consists in using  $\ell _{1,p}$-norms, with
  $p=2$ or
  $p=\infty$. The
  $p$-norm is taken within the groups and the
  $1$-norm is taken between the groups. This forces the solution to have only a few active groups, but within the active groups the coefficients can be dense.
For problems such as matrix factorization (Paatero and Tapper Reference Paatero and Tapper1994, Lee and Seung Reference Lee and Seung1999) or robust principal component analysis (Candès, Li, Ma and Wright Reference Candès, Li, Ma and Wright2011), where  $x$ is tensor-valued, the sparsity-inducing norm could also be a function promoting the sparsity of the singular values of
  $x$ and hence forcing
  $x$ to be of low rank. A popular choice to achieve this goal is the
  $1$-Schatten norm (or nuclear norm)
  $\Vert \cdot \Vert _{{\mathcal{S}}_{1}}$, which is given by the
  $1$-norm of the singular values of
  $x$, and is polar to the spectral/operator norm
  $\Vert \cdot \Vert _{{\mathcal{S}}_{\infty }}$.
A more general formulation that also allows for noise in the observed signal  $b$ is given by the following optimization problem, popularized by the name ‘Lasso’, least absolute shrinkage and selection operator (Tibshirani Reference Tibshirani1996):
 $$\begin{eqnarray}\displaystyle \min _{x}\Vert x\Vert _{1}+\displaystyle \frac{{\it\lambda}}{2}\Vert Ax-b\Vert _{2}^{2}, & & \displaystyle\end{eqnarray}$$
 where  ${\it\lambda}>0$ is a parameter that can be adapted to the noise level of
  $b$. The parameter
  ${\it\lambda}$ can also be interpreted as a Lagrange multiplier for the constraint
  ${\textstyle \frac{1}{2}}\Vert Ax-b\Vert _{2}^{2}\leq {\it\sigma}^{2}$, where
  ${\it\sigma}$ is an estimate of the noise level. This shows the close connection between (2.1) and (2.2).
The Lasso approach can also be interpreted as a model that tries to synthesize the given signal  $b$ using only a small number of basis atoms. A closely related problem is obtained by moving the linear operator
  $A$ from the data-fitting term to the regularization term, that is,
 $$\begin{eqnarray}\min _{x}\Vert Bx\Vert _{1}+\displaystyle \frac{{\it\lambda}}{2}\Vert x-b\Vert _{2}^{2},\end{eqnarray}$$
 where  $B$ is again a linear operator. If
  $A$ is invertible and
  $B=A^{-1}$, a simple change of variables shows that the two problems are equivalent. However, the more interesting cases are for non-invertible
  $B$, and the two problems can have very different properties. Here, the linear operator
  $B$ can be interpreted as an operator analysing the signal, and hence the model is known as the co-sparse analysis model (Nam, Davies, Elad and Gribonval Reference Nam, Davies, Elad and Gribonval2013). The basic idea behind this approach is that the scalar product of the signal with a given family of filters should vanish most of the time. The most influential model in imaging utilizing such sparse analysis regularizers is the total variation regularizer.
Here, we recall the ‘ROF’ (Rudin, Osher and Fatemi Reference Rudin, Osher and Fatemi1992, Chambolle and Lions Reference Chambolle and Lions1997) model for total variation based image denoising. We consider a scalar-valued digital image  $u\in \mathbb{R}^{m\times n}$ of size
  $m\times n$ pixels.Footnote 1 A simple and standard approach for defining the (discrete) total variation is to use a finite difference scheme acting on the image pixels. We introduce a discrete gradient operator
  $\text{D}:\mathbb{R}^{m\times n}\rightarrow \mathbb{R}^{m\times n\times 2}$, which is defined by
 $$\begin{eqnarray}\begin{array}{@{}l@{}}\displaystyle (\text{D}u)_{i,j,1}=\left\{\begin{array}{@{}ll@{}}u_{i+1,j}-u_{i,j}\quad & \text{if }1\leq i<m,\\ 0\quad & \text{else},\end{array}\right.\\ \displaystyle (\text{D}u)_{i,j,2}=\left\{\begin{array}{@{}ll@{}}u_{i,j+1}-u_{i,j}\quad & \text{if }1\leq j<n,\\ 0\quad & \text{else}.\end{array}\right.\end{array}\end{eqnarray}$$
 We will also frequently need the operator norm  $\Vert \text{D}\Vert$, which is estimated as
 $$\begin{eqnarray}\Vert \text{D}\Vert \leq \sqrt{8}\end{eqnarray}$$
(see Chambolle Reference Chambolle2004b). The discrete ROF model is then defined by
 $$\begin{eqnarray}\min _{u}{\it\lambda}\Vert \text{D}u\Vert _{p,1}+\displaystyle \frac{1}{2}\Vert u-u^{\diamond }\Vert _{2}^{2},\end{eqnarray}$$
 where  $u^{\diamond }\in \mathbb{R}^{m\times n}$ is the given noisy image, and the discrete total variation is defined by
 $$\begin{eqnarray}\Vert \text{D}u\Vert _{p,1}=\mathop{\sum }_{i=1,j=1}^{m,n}|(\text{D}u)_{i,j}|_{p}=\mathop{\sum }_{i=1,j=1}^{m,n}((\text{D}u)_{i,j,1}^{p}+(\text{D}u)_{i,j,2}^{p})^{1/p},\end{eqnarray}$$
 that is, the  $\ell _{1}$-norm of the
  $p$-norm of the pixelwise image gradients.Footnote 2 The parameter
  $p$ can be used, for example, to realize anisotropic (
 $p=1$) or isotropic (
 $p=2$) total variation. Some properties of the continuous model, such as the co-area formula, carry over to the discrete model only if
  $p=1$, but the isotropic total variation is often preferred in practice since it does not exhibit a grid bias.
From a sparsity point of view, the idea of the total variation denoising model is that the  $\ell _{1}$-norm induces sparsity in the gradients of the image, hence it favours piecewise constant images with sparse edges. On the other hand, this property – also known as the staircasing effect – might be considered a drawback for some applications. Some workarounds for this issue will be suggested in Example 4.7 and Section 7.2. The isotropic case (
 $p=2$) can also be interpreted as a very simple form of group sparsity, grouping together the image derivatives in each spatial dimension.
In many practical problems it is necessary to incorporate an additional linear operator in the data-fitting term. Such a model is usually of the form
 $$\begin{eqnarray}\min _{u}{\it\lambda}\Vert \text{D}u\Vert _{p,1}+\displaystyle \frac{1}{2}\Vert Au-u^{\diamond }\Vert _{2}^{2},\end{eqnarray}$$
 where  $A:\mathbb{R}^{m\times n}\rightarrow \mathbb{R}^{k\times l}$ is a linear operator,
  $u^{\diamond }\in \mathbb{R}^{k\times l}$ is the given data, and
  $k,l$ will depend on the particular application. Examples include image deblurring, where
  $A$ models the blur kernel, and magnetic resonance imaging (MRI), where the linear operator is usually a combination of a Fourier transform and the coil sensitivities; see Section 7.4 for details.
The quadratic data-fitting term of the ROF model is specialized for zero-mean Gaussian noise. In order to apply the model to other types of noise, different data-fitting terms have been proposed. When the noise is impulsive or contains gross outliers, a simple yet efficient modification is to replace the quadratic data-fitting term with an  $\ell _{1}$-data term. The resulting model, called the TV-
 $\ell _{1}$ model, is given by
 $$\begin{eqnarray}\min _{u}{\it\lambda}\Vert \text{D}u\Vert _{p,1}+\Vert u-u^{\diamond }\Vert _{1}.\end{eqnarray}$$
 This model has many nice properties such as noise robustness and contrast invariance (Nikolova Reference Nikolova2004, Chan and Esedoḡlu Reference Chan and Esedoḡlu2005). However, this does not come for free. While the ROF model still contains some regularity in the data term that can be exploited during optimization, the TV- $\ell _{1}$ model is completely non-smooth and hence significantly more difficult to minimize.
2.2 Three introductory examples for image restoration
We now will present three prototypical examples of image restoration, to which we will frequently refer in the algorithmic parts of the paper.
Example 2.1 (ROF model).
In the first example we consider standard image denoising using the ROF model (2.6) in the presence of Gaussian noise. Figure 2.1 shows the result of total variation based image denoising using this model. It is now well understood that efficient ways to solve this problem rely on convex duality (Chambolle and Lions Reference Chambolle and Lions1995, Chan et al. Reference Chan, Golub and Mulet1999, Chambolle Reference Chambolle2004b); for details on the particular algorithm used here, see Examples 4.8 and 5.6.
Total variation based image denoising. (a) Original input image, and (b) noisy image containing additive Gaussian noise with standard deviation  ${\it\sigma}=0.1$. (c) Denoised image obtained by minimizing the ROF model using
  ${\it\lambda}=0.1$.

Figure 2.1(a) shows the original input image of size  $360\times 270$ pixels and intensity values in the range
  $[0,1]$. Figure 2.1(b) shows its noisy variant, obtained by adding Gaussian noise of standard deviation
  ${\it\sigma}=0.1$. Figure 2.1(c) shows the result obtained by minimizing the ROF model using the FISTA algorithm (Algorithm 5). We used isotropic total variation
  $(p=2)$ and we set the regularization parameter
  ${\it\lambda}=0.1$. Observe that the ROF model successfully removes the noise from the image while preserving the main edges in the image. One can also observe that the ROF model is not very successful at reconstructing textured regions, as it favours piecewise constant images. State-of-the-art denoising methods will usually revert to non-local techniques that treat patches as a whole, allowing better representation of textures (Buades et al. Reference Buades, Coll and Morel2005, Buades et al. Reference Buades, Coll and Morel2011, Dabov et al. Reference Dabov, Foi, Katkovnik and Egiazarian2007). These approaches are not variational at first glance, but variants can be obtained by alternating minimization of non-local energies (Peyré et al. Reference Peyré, Bougleux and Cohen2008, Arias et al. Reference Arias, Facciolo, Caselles and Sapiro2011).
Example 2.2 (TV-deblurring).
An image deblurring problem. (a) Original image, and (b) blurry and noisy image (Gaussian noise with standard deviation  ${\it\sigma}=0.01$) together with the known blur kernel. (c, d) Image deblurring without (
 ${\it\lambda}=0$) and with (
 ${\it\lambda}=5\times 10^{-4}$) total variation regularization. Observe the noise amplification when there is no regularization.

In this second example we assume that the observed blurry image  $u^{\diamond }$ has been obtained by convolving the unknown image
  $u$ with a two-dimensional blur kernel
  $a$ of size
  $k\times l$ pixels. We can ‘deblur’ the given image by minimizing the model (2.7) with
  $Au=a\ast u$. If we choose
  ${\it\lambda}=0$ in (2.7), then unless the original image
  $u^{\diamond }$ has no noise at all, it is well known that the noise will be amplified by the deconvolution process and ruin the quality of the deconvolution.
Figure 2.2 shows an example of image deblurring with known blur kernel. Figure 2.2(a) shows the original image of size  $317\times 438$ pixels and intensity values in the range
  $[0,1]$. Figure 2.2(b) shows the blurry image together with the blur kernel of size
  $31\times 31$ pixels. The blurry image has been further degraded by adding zero-mean Gaussian noise with standard deviation
  $0.01$. Moreover, to get rid of unwanted boundary effects, we modified the input image by setting its intensity values to its average values at the image boundaries. This allows us to approximately assume periodic boundary conditions and hence to use a fast Fourier transform (FFT) to compute the convolution. Another way to deal with the boundary, which works better but is computationally more expensive, is suggested in Almeida and Figueiredo (Reference Almeida and Figueiredo2013).
Figure 2.2(c) shows the deblurred image using no regularization ( ${\it\lambda}=0$) and Figure 2.2(d) the deblurred image using the total variation regularized deblurring model. The regularization parameter was set to
  ${\it\lambda}=5\times 10^{-4}$. Observe that the regularization is essential to reduce the noise in the deblurred image. This particular example has been computed using the PDHG algorithm (Algorithm 6); see also Example 5.7 for details. Note that when the blur kernel is also unknown, the problem becomes non-convex and hence significantly more complex to solve (Levin, Weiss, Durand and Freeman Reference Levin, Weiss, Durand and Freeman2011).
Example 2.3 (TV- $\ell _{1}$ model).

Denoising an image containing salt-and-pepper noise. (a) Original image, and (b) noisy image that has been degraded by adding  $20\%$ salt-and-pepper noise. (c) Denoised image obtained from the TV-
 $\ell _{1}$ model, and (d) result obtained from the ROF model.

In this third example we consider image restoration in the presence of salt-and-pepper noise. For this we utilize the TV- $\ell _{1}$ model (2.8). Figure 2.3 shows an example where the TV-
 $\ell _{1}$ model can successfully denoise an image of size
  $375\times 500$ pixels that has been degraded by adding
  $20\%$ salt-and-pepper noise. The intensity values of the input image are again in the range
  $[0,1]$. For comparison we also show the results of the ROF model (2.6) for this example. For the TV-
 $\ell _{1}$ model the regularization parameter was set to
  ${\it\lambda}=0.6$; for ROF, the regularization parameter was set to
  ${\it\lambda}=0.25$. It can be seen that the results of the ROF model are significantly inferior, since the quadratic data term of the ROF model does not fit the distribution of the salt-and-pepper noise at all well. The example was computed again using the PDHG algorithm (Algorithm 6); see also Example 5.8 for details.
3 Notation and basic notions of convexity
We recall some basic notions of convexity, and introduce our notation. Throughout the paper, at least in the theoretical parts,  ${\mathcal{X}}$ (and
  ${\mathcal{Y}}$) is a Hilbert or Euclidean space endowed with a norm
  $\Vert \cdot \Vert =\langle \cdot ,\cdot \rangle ^{1/2}$. The results in this section and the next should usually be understood in finite dimensions, but most of them do not depend on the dimension, and often hold in a Hilbert space. If
  $M$ is a bounded positive definite symmetric operator, we define
  $\Vert x\Vert _{M}=\langle Mx,x\rangle ^{1/2}$, which in finite-dimensional space is a norm equivalent to
  $\Vert x\Vert$.
In two-dimensional image processing we usually consider norms acting on images  $u$ defined on a regular Cartesian grid of
  $m\times n$ pixels. When the pixels are scalar-valued, that is,
  $u_{i,j}\in \mathbb{R}$, the image can also be written in the form
  $u=(u_{1,1},\ldots ,u_{m,n})\in \mathbb{R}^{m\times n}$.
A  $p$-vector norm acting on the image is hence given by
 $$\begin{eqnarray}\Vert u\Vert _{p}=\biggl(\mathop{\sum }_{i=1}^{m}\mathop{\sum }_{j=1}^{n}|u_{i,j}|^{p}\biggr)^{1/p}.\end{eqnarray}$$
 When the pixels of an image  $\mathbf{u}$ of size
  $m\times n$ pixels are vector-valued, we will adopt the notation
  $\mathbf{u}=(\mathbf{u}_{1,1},\ldots ,\mathbf{u}_{m,n})\in \mathbb{R}^{m\times n\times r}$, with bold-font variables
  $\mathbf{u}_{i,j}\in \mathbb{R}^{r}$ referring to the vector-valued pixel. In such images we will consider mixed
  $p,q$-vector norms which are given by
 $$\begin{eqnarray}\Vert \mathbf{u}\Vert _{p,q}=\biggl(\mathop{\sum }_{i=1}^{m}\mathop{\sum }_{j=1}^{n}|\mathbf{u}_{i,j}|_{p}^{q}\biggr)^{1/q},\end{eqnarray}$$
 with  $|\mathbf{u}_{i,j}|_{p}=(\sum _{k=1}^{r}|u_{i,j,k}|^{p})^{1/p}$ denoting the
  $p$-vector norm acting on the single pixels. Similarly, if the pixels are matrix-valued (or tensor-valued), that is,
  $\mathbf{U}_{i,j}\in \mathbb{R}^{r\times s}$, we have
  $\mathbf{U}=(\mathbf{U}_{1,1},\ldots ,\mathbf{U}_{m,n})\in \mathbb{R}^{m\times n\times r\times s}$, and we will consider matrix norms, acting on the single pixels
  $\mathbf{U}_{i,j}$.
3.1 Convex functions
An extended real valued function  $f:{\mathcal{X}}\rightarrow [-\infty ,+\infty ]$ is said to be convex if and only if its epigraph
 $$\begin{eqnarray}\text{epi}\,f:=\{(x,{\it\lambda})\in {\mathcal{X}}\times \mathbb{R}:{\it\lambda}\geq f(x)\}\end{eqnarray}$$
 is a convex set, that is, if when  ${\it\lambda}\geq f(x)$,
  ${\it\mu}\geq f(y)$, and
  $t\in [0,1]$, we have
  $t{\it\lambda}+(1-t){\it\mu}\geq f(tx+(1-t)y)$.Footnote 3 It is proper if it is not identically
  $+\infty$ and nowhere
  $-\infty$: in this case, it is convex if and only if, for all
  $x,y\in {\mathcal{X}}$ and
  $t\in [0,1]$,
 $$\begin{eqnarray}f(tx+(1-t)y)\leq tf(x)+(1-t)f(y).\end{eqnarray}$$
 It is strictly convex if the above inequality is strict whenever  $x\neq y$ and
  $0<t<1$. It is lower semi-continuous (l.s.c.) if, for all
  $x\in {\mathcal{X}}$, if
  $x_{n}\rightarrow x$, then
 $$\begin{eqnarray}f(x)\leq \liminf _{n\rightarrow \infty }f(x_{n}).\end{eqnarray}$$
 A trivial but important example is the characteristic function or indicator function of a set  $C$:
$C$:
 $$\begin{eqnarray}{\it\delta}_{C}(x)=\left\{\begin{array}{@{}ll@{}}0\quad & \text{if }x\in C,\\ +\infty \quad & \text{else,}\end{array}\right.\end{eqnarray}$$
 which is convex, l.s.c., and proper when  $C$ is convex, closed and non-empty. The minimization of such functions will allow us to easily model convex constraints in our problems.
3.2 Subgradient
Given a convex, extended real valued, l.s.c. function  $f:{\mathcal{X}}\rightarrow [-\infty ,+\infty ]$, we recall that its subgradient at a point
  $x$ is defined as the set
 $$\begin{eqnarray}\partial f(x):=\{p\in {\mathcal{X}}:f(y)\geq f(x)+\langle p,y-x\rangle ~\text{for all}~y\in {\mathcal{X}}\}.\end{eqnarray}$$
 An obvious remark which stems from the definition is that this notion allows us to generalize Fermat’s stationary conditions ( ${\rm\nabla}f(x)=0$ if
  $x$ is a minimizer of
  $f$) to non-smooth convex functions: we indeed have
 $$\begin{eqnarray}x\in {\mathcal{X}}\text{is a global minimizer of }f\text{ if and only if }0\in \partial f(x).\end{eqnarray}$$
 The function is strongly convex or ‘ ${\it\mu}$-convex’ if in addition, for
  $x,y\in {\mathcal{X}}$ and
  $p\in \partial f(x)$, we have
 $$\begin{eqnarray}f(y)\geq f(x)+\langle p,y-x\rangle +\displaystyle \frac{{\it\mu}}{2}\Vert y-x\Vert ^{2}\end{eqnarray}$$
 or, equivalently, if  $x\mapsto f(x)-{\it\mu}\Vert x\Vert ^{2}/2$ is also convex. It is then, obviously, strictly convex as it satisfies
 $$\begin{eqnarray}f(tx+(1-t)y)\leq tf(x)+(1-t)f(y)-{\it\mu}\displaystyle \frac{t(1-t)}{2}\Vert y-x\Vert ^{2}\end{eqnarray}$$
 for any  $x,y$ and any
  $t\in [0,1]$. A trivial but important remark is that if
  $f$ is strongly convex and
  $x$ is a minimizer, then we have (since
  $0\in \partial f(x)$)
 $$\begin{eqnarray}f(y)\geq f(x)+\displaystyle \frac{{\it\mu}}{2}\Vert y-x\Vert ^{2}\end{eqnarray}$$
 for all  $y\in {\mathcal{X}}$.
The domain of  $f$ is the set
  $\text{dom}\,f=\{x\in {\mathcal{X}}:f(x)<+\infty \}$, while the domain of
  $\partial f$ is the set
  $\text{dom}\,\partial f=\{x\in {\mathcal{X}}:\partial f(x)\neq \emptyset \}$. Clearly
  $\text{dom}\,\partial f\subset \text{dom}\,f$; in fact if
  $f$ is convex, l.s.c. and proper, then
  $\text{dom}\,\partial f$ is dense in
  $\text{dom}\,f$ (Ekeland and Témam Reference Ekeland and Témam1999). In finite dimensions, one can show that for a proper convex function,
  $\text{dom}\,\partial f$ contains at least the relative interior of
  $\text{dom}\,f$ (that is, the interior in the vector subspace which is generated by
  $\text{dom}\,f$).
3.3 Legendre–Fenchel conjugate
To any function  $f:{\mathcal{X}}\rightarrow [-\infty ,+\infty ]$ one can associate the Legendre–Fenchel conjugate (or convex conjugate)
 $$\begin{eqnarray}f^{\ast }(y)=\sup _{x\in {\mathcal{X}}}\langle y,x\rangle -f(x)\end{eqnarray}$$
 which, as a supremum of linear and continuous functions, is obviously convex and lower semi-continuous. The biconjugate  $f^{\ast \ast }$ is then the largest convex l.s.c. function below
  $f$ (from the definition it is easy to see that
  $f^{\ast \ast }\leq f$); in particular, if
  $f$ is already convex and l.s.c., we have
  $f^{\ast \ast }=f$. This is a consequence of the convex separation theorem (a corollary of the Hahn–Banach theorem), which is a difficult result in general (see Brézis Reference Brézis1983 for an introduction to convex duality in infinite dimensions which includes a detailed proof of this result), but it is a trivial consequence of the projection onto closed convex sets in Euclidean or Hilbert spaces.
By definition, we see that  $x$ realizes the sup in (3.3) if and only if
  $y\in \partial f(x)$, and we have
  $f(x)+f^{\ast }(y)=\langle y,x\rangle$. In this case we easily deduce that
  $f^{\ast \ast }(x)=f(x)=\langle y,x\rangle -f^{\ast }(x)$, so that in particular,
  $y$ realizes the sup which defines
  $f^{\ast \ast }(x)$. Also, it follows that
  $x\in \partial f^{\ast }(y)$. We deduce the celebrated Legendre–Fenchel identity:
 $$\begin{eqnarray}y\in \partial f(x)\Leftrightarrow x\in \partial f^{\ast }(y)\Leftrightarrow f(x)+f^{\ast }(y)=\langle y,x\rangle .\end{eqnarray}$$
 In particular,  $\partial g$ and
  $\partial g^{\ast }$ are inverses. From the definition, it is clear that the subgradient of a convex function is a monotone operator, that is, it satisfies
 $$\begin{eqnarray}\langle p-q,x-y\rangle \geq 0\quad \text{for all}~(x,y)\in {\mathcal{X}}^{2},~p\in \partial f(x),~q\in \partial f(y),\end{eqnarray}$$
 while it is strongly monotone if  $f$ is strongly convex:
 $$\begin{eqnarray}\langle p-q,x-y\rangle \geq {\it\mu}\Vert x-y\Vert ^{2}\quad \text{for all}~(x,y)\in {\mathcal{X}}^{2},~p\in \partial f(x),~q\in \partial f(y).\end{eqnarray}$$
 An important remark is that a convex l.s.c. function  $f$ is
  ${\it\mu}$-strongly convex if and only if its conjugate
  $f^{\ast }$ is
  $C^{1}$ with
  $(1/{\it\mu})$-Lipschitz gradient. In fact,
  $f$ is
  ${\it\mu}$-strongly convex if and only if, for any
  $x\in {\mathcal{X}}$ and
  $p\in \partial f(x)$, the ‘parabola’
 $$\begin{eqnarray}y\mapsto f(x)+\langle p,y-x\rangle +\displaystyle \frac{{\it\mu}}{2}\Vert y-x\Vert ^{2}\end{eqnarray}$$
 touches the graph of  $f$ at
  $x$ from below. But then, fairly simple computations show that the graph of
  $f^{\ast }$ is touched from above at
  $p$ by the conjugate parabola
 $$\begin{eqnarray}q\mapsto \langle q,x\rangle +\displaystyle \frac{1}{2{\it\mu}}\Vert q-p\Vert ^{2}-f(x)=f^{\ast }(p)+\langle q-p,x\rangle +\displaystyle \frac{1}{2{\it\mu}}\Vert q-p\Vert ^{2},\end{eqnarray}$$
 which is equivalent to saying that  $x={\rm\nabla}f^{\ast }(p)$ and (if this holds at all
  $p$) that
  $p\mapsto x={\rm\nabla}f^{\ast }(p)$ is
  $(1/{\it\mu})$-Lipschitz. Observe that in this case, the strong monotonicity of
  $\partial f$ also reads
 $$\begin{eqnarray}\langle p-q,{\rm\nabla}f^{\ast }(p)-{\rm\nabla}f^{\ast }(q)\rangle \geq {\it\mu}\Vert {\rm\nabla}f^{\ast }(p)-{\rm\nabla}f^{\ast }(q)\Vert ^{2},\end{eqnarray}$$
 which expresses that  ${\rm\nabla}f^{\ast }$ is a
  ${\it\mu}$-co-coercive monotone operator: in general the gradient of a convex function with
  $L$-Lipschitz gradient is
  $(1/L)$-co-coercive.
We must mention here that subgradients of convex l.s.c. functions are only a particular class of maximal monotone operators, which are multivalued operators  $T:{\mathcal{X}}\rightarrow {\mathcal{P}}({\mathcal{X}})$ such that
 $$\begin{eqnarray}\langle p-q,x-y\rangle \geq 0\quad \text{for all}~(x,y)\in {\mathcal{X}}^{2},~p\in Tx,~q\in Ty\end{eqnarray}$$
 and whose graph  $\{(x,p):x\in Tp\}\subset {\mathcal{X}}\times {\mathcal{X}}$ is maximal (with respect to inclusion) in the class of graphs of operators which satisfy (3.5). Strongly monotone and co-coercive monotone operators are defined accordingly. It is also almost obvious from the definition that any maximal monotone operator
  $T$ has an inverse
  $T^{-1}$ defined by
  $x\in T^{-1}p\Leftrightarrow p\in Tx$, which is also maximal monotone. The operators
  $\partial f$ and
  $\partial f^{\ast }$ are inverse in this sense. Examples of maximal monotone operators which are not subgradients of a convex function are given by skew-symmetric operators. See, for instance, Brézis (Reference Brézis1973) for a general study of maximal monotone operators in Hilbert spaces.
3.4 Proximal map and resolvent
Another important role in optimization is played by the so-called proximal map or proximity operator of a convex function defined as follows. If  $f$ is convex, proper and l.s.c., then clearly, for any
  $x$, there is a unique minimizer
  ${\hat{y}}$ to the strongly convex problem
 $$\begin{eqnarray}\min _{y\in {\mathcal{X}}}f(y)+\displaystyle \frac{1}{2{\it\tau}}\Vert y-x\Vert ^{2},\end{eqnarray}$$
which also satisfies
 $$\begin{eqnarray}f(y)+\displaystyle \frac{1}{2{\it\tau}}\Vert y-x\Vert ^{2}\geq f({\hat{y}})+\displaystyle \frac{1}{2{\it\tau}}\Vert {\hat{y}}-x\Vert ^{2}+\displaystyle \frac{1}{2{\it\tau}}\Vert y-{\hat{y}}\Vert ^{2}\end{eqnarray}$$
 for any  $y$ (thanks to strong convexity). We let
  ${\hat{y}}:=\text{prox}_{{\it\tau}f}(x)$. It is easy to show that this defines a
  $1$-Lipschitz, monotone operator, which is itself the gradient of a convex function. Basic subdifferential calculus (Rockafellar Reference Rockafellar1997) shows that
 $$\begin{eqnarray}\partial f({\hat{y}})+\displaystyle \frac{{\hat{y}}-x}{{\it\tau}}\ni 0,\end{eqnarray}$$
 in other words  ${\hat{y}}=(I+{\it\tau}\partial f)^{-1}x$ is given by the resolvent of the maximal monotone operator
  ${\it\tau}\partial f$ at
  $x$. In general it is shown that
  $T$ is maximal monotone if and only if its resolvent
  $(I+T)^{-1}$ is well defined and single-valued; this is an important theorem due to Minty (Reference Minty1962). The resolvent is also a weak contraction, as well as a ‘firmly non-expansive operator’ (Bauschke, Moffat and Wang Reference Bauschke, Moffat and Wang2012), or equivalently a ‘
 $1/2$-averaged operator’; see Appendix A.
Playing with this expression and (3.4), we can easily deduce Moreau’s identity (Moreau Reference Moreau1965)
 $$\begin{eqnarray}x=(I+{\it\tau}\partial f)^{-1}(x)+{\it\tau}\biggl(I+\displaystyle \frac{1}{{\it\tau}}\partial f^{\ast }\biggr)^{-1}\biggl(\displaystyle \frac{x}{{\it\tau}}\biggr)=\text{prox}_{{\it\tau}f}(x)+{\it\tau}\text{prox}_{{\textstyle \frac{1}{{\it\tau}}}f^{\ast }}\biggl(\displaystyle \frac{x}{{\it\tau}}\biggr),\end{eqnarray}$$
 which in fact holds for any maximal monotone operators  $T,T^{-1}$. It shows in particular that if we know how to compute
  $\text{prox}_{{\it\tau}f}$, then we also know how to compute
  $\text{prox}_{f^{\ast }/{\it\tau}}$. Finally, we will sometimes let
  $\text{prox}_{{\it\tau}f}^{M}(x)$ denote the proximity operator computed in the metric
  $M$, that is, the solution of
 $$\begin{eqnarray}\min _{y\in {\mathcal{X}}}f(y)+\displaystyle \frac{1}{2{\it\tau}}\Vert y-x\Vert _{M}^{2}.\end{eqnarray}$$
3.5 Fenchel–Rockafellar duality
We now introduce an essential notion in convex programming, that is, convex duality. This notion allows us to transform convex problems into other problems which sometimes have a nicer structure and are easier to tackle. A fairly extensive and very enlightening recent survey on duality for imaging and inverse problems can be found in Borwein and Luke (Reference Borwein, Luke and Scherzer2015).
Consider the minimization problem
 $$\begin{eqnarray}\min _{x\in {\mathcal{X}}}f(Kx)+g(x),\end{eqnarray}$$
where
 $$\begin{eqnarray}f:{\mathcal{Y}}\rightarrow (-\infty ,+\infty ],\quad g:{\mathcal{X}}\rightarrow (-\infty ,+\infty ]\end{eqnarray}$$
 are convex l.s.c. functions and  $K:{\mathcal{X}}\rightarrow {\mathcal{Y}}$ is a bounded linear operator. Then, since
  $f=f^{\ast \ast }$, one can write
 $$\begin{eqnarray}\min _{x\in {\mathcal{X}}}f(Kx)+g(x)=\min _{x\in {\mathcal{X}}}\sup _{y\in {\mathcal{Y}}}\langle y,Kx\rangle -f^{\ast }(y)+g(x).\end{eqnarray}$$
 Under very mild conditions on  $f,g$ (such as
  $f(0)<\infty$ and
  $g$ continuous at
  $0$ (see e.g. Ekeland and Témam Reference Ekeland and Témam1999, (4.21)); in finite dimensions it is sufficient to have a point
  $x$ with both
  $Kx$ in the relative interior of
  $\text{dom}\,f$ and
  $x$ in the relative interior of
  $\text{dom}\,g$ (Rockafellar Reference Rockafellar1997, Corollary 31.2.1)), one can swap the min and sup in the relation above and write
 $$\begin{eqnarray}\displaystyle \min _{x}f(Kx)+g(x) & = & \displaystyle \min _{x}\sup _{y}\langle y,Kx\rangle -f^{\ast }(y)+g(x)\nonumber\\ \displaystyle & = & \displaystyle \max _{y}\inf _{x}\langle y,Kx\rangle -f^{\ast }(y)+g(x)\end{eqnarray}$$
 $$\begin{eqnarray}\displaystyle & = & \displaystyle \max _{y}-f^{\ast }(y)-g^{\ast }(-K^{\ast }y).\end{eqnarray}$$
 The last problem in this formula is the (Fenchel–Rockafellar) dual problem. Under the assumptions above, it has at least a solution  $y^{\ast }$. If
  $x^{\ast }$ is any solution of the initial primal problem, then
  $(x^{\ast },y^{\ast })$ is a saddle point of the primal–dual formulation: for any
  $(x,y)\in {\mathcal{X}}\times {\mathcal{Y}}$ we have
 $$\begin{eqnarray}{\mathcal{L}}(x^{\ast },y)\leq {\mathcal{L}}(x^{\ast },y^{\ast })\leq {\mathcal{L}}(x,y^{\ast })\end{eqnarray}$$
where
 $$\begin{eqnarray}{\mathcal{L}}(x,y):=\langle y,Kx\rangle -f^{\ast }(y)+g(x)\end{eqnarray}$$
denotes the Lagrangian. In particular, it satisfies
 $$\begin{eqnarray}\displaystyle & 0\in \partial g(x^{\ast })+K^{\ast }y^{\ast }, & \displaystyle\end{eqnarray}$$
 $$\begin{eqnarray}\displaystyle & 0\in \partial f^{\ast }(y^{\ast })-Kx^{\ast }. & \displaystyle\end{eqnarray}$$
Observe that the primal–dual gap
 $$\begin{eqnarray}{\mathcal{G}}(x,y):=f(Kx)+g(x)+f^{\ast }(y)+g^{\ast }(-K^{\ast }y)=\sup _{(x^{\prime },y^{\prime })\in {\mathcal{X}}\times {\mathcal{Y}}}{\mathcal{L}}(x,y^{\prime })-{\mathcal{L}}(x^{\prime },y),\end{eqnarray}$$
 which is always non-negative (even if the min and sup cannot be swapped), vanishes if and only if  $(x,y)$ is a saddle point.
Finally we remark that
 $$\begin{eqnarray}T\left(\begin{array}{@{}c@{}}x\\ y\end{array}\right):=\left(\begin{array}{@{}c@{}}\partial g(x)\\ \partial f^{\ast }(y)\end{array}\right)+\left(\begin{array}{@{}cc@{}}0 & K^{\ast }\\ -K & 0\end{array}\right)\left(\begin{array}{@{}c@{}}x\\ y\end{array}\right)\end{eqnarray}$$
 is a maximal monotone operator, being the sum of two maximal monotone operators, only one of which is a subgradient, and the conditions above can be written  $T\binom{x^{\ast }}{y^{\ast }}\ni 0$.
Example 3.1 (dual of the ROF model).
As an example, consider the minimization problem (2.6) above. This problem has the general form (3.9), with  $x=u$,
  $K=\text{D}$,
  $f={\it\lambda}\Vert \cdot \Vert _{p,1}$ and
  $g=\Vert \cdot -u^{\diamond }\Vert ^{2}/2$. Hence the dual problem (3.11) reads
 $$\begin{eqnarray}\displaystyle & & \displaystyle \max _{\mathbf{p}}-f^{\ast }(\mathbf{p})-\biggl(\displaystyle \frac{1}{2}\Vert \text{D}^{\ast }\mathbf{p}\Vert ^{2}-\langle \text{D}^{\ast }\mathbf{p},u^{\diamond }\rangle \biggr)\nonumber\\ \displaystyle & & \displaystyle \qquad =-\min _{\mathbf{p}}\biggl(f^{\ast }(\mathbf{p})+\displaystyle \frac{1}{2}\Vert \text{D}^{\ast }\mathbf{p}-u^{\diamond }\Vert ^{2}\biggr)+\displaystyle \frac{1}{2}\Vert u^{\diamond }\Vert ^{2},\nonumber\end{eqnarray}$$
 where  $\mathbf{p}\in \mathbb{R}^{m\times n\times 2}$ is the dual variable. Equation (3.13) shows that the solution
  $u$ of the primal problem is recovered from the solution
  $\mathbf{p}$ of the dual by letting
  $u=u^{\diamond }-\text{D}^{\ast }\mathbf{p}$. One interesting observation is that the dual ROF model has almost exactly the same structure as the Lasso problem (2.2).
In this example,  $f$ is a norm, so
  $f^{\ast }$ is the indicator function of the polar ball: in this case the dual variable has the structure
  $\mathbf{p}=(\mathbf{p}_{1,1},\ldots ,\mathbf{p}_{m,n})$, where
  $\mathbf{p}_{i,j}=(p_{i,j,1},p_{i,j,2})$ is the per pixel vector-valued dual variable, and therefore
 $$\begin{eqnarray}f^{\ast }(\mathbf{p})={\it\delta}_{\{\Vert \cdot \Vert _{q,\infty }\leq {\it\lambda}\}}(\mathbf{p})=\left\{\begin{array}{@{}ll@{}}0\quad & \text{if }|\mathbf{p}_{i,j}|_{q}\leq {\it\lambda}~\text{for all}~i,j,\\ +\infty \quad & \text{else,}\end{array}\right.\end{eqnarray}$$
 where  $q$ is the parameter of the polar norm ball which is defined via
  $1/p+1/q=1$. The most relevant cases are
  $p=1$ or
  $p=2$. In the first case we have
  $q=+\infty$, so the corresponding constraint reads
 $$\begin{eqnarray}|\mathbf{p}_{i,j}|_{\infty }=\max \{|p_{i,j,1}|,|p_{i,j,2}|\}\leq {\it\lambda}\quad \text{for all }i,j.\end{eqnarray}$$
 In the second case we have  $q=2$, and the corresponding constraint reads
 $$\begin{eqnarray}|\mathbf{p}_{i,j}|_{2}=\sqrt{p_{i,j,1}^{2}+p_{i,j,2}^{2}}\leq {\it\lambda}\quad \text{for all }i,j.\end{eqnarray}$$
 Of course, more complex norms can be used, such as the nuclear norm for colour images. In this case the per pixel dual variable  $\mathbf{p}_{i,j}$ will be matrix-valued (or tensor-valued) and should be constrained to have its spectral (operator) norm less than
  ${\it\lambda}$, for all
  $i,j$. See Section 7.3 for an example and further details.
In practice, we will (improperly) use ‘dual problem’ to denote the minimization problem
 $$\begin{eqnarray}\min \{\Vert \text{D}^{\ast }\mathbf{p}-u^{\diamond }\Vert ^{2}:|\mathbf{p}_{i,j}|_{q}\leq {\it\lambda}~\text{for all}~i,j\},\end{eqnarray}$$
which is essentially a projection problem. For this problem, it is interesting to observe that the primal–dual gap
 $$\begin{eqnarray}\displaystyle {\mathcal{G}}(u,\mathbf{p}) & = & \displaystyle f(\text{D}u)+\displaystyle \frac{1}{2}\Vert u-u^{\diamond }\Vert ^{2}+f^{\ast }(\mathbf{p})+\displaystyle \frac{1}{2}\Vert \text{D}^{\ast }\mathbf{p}\Vert ^{2}-\langle \text{D}^{\ast }\mathbf{p},u^{\diamond }\rangle \nonumber\\ \displaystyle & = & \displaystyle {\it\lambda}\Vert \text{D}u\Vert _{p,1}+{\it\delta}_{\{\Vert \cdot \Vert _{q,\infty }\leq {\it\lambda}\}}(\mathbf{p})-\langle \mathbf{p},\text{D}u\rangle +\displaystyle \frac{1}{2}\Vert u^{\diamond }-\text{D}^{\ast }\mathbf{p}-u\Vert ^{2}\end{eqnarray}$$
 gives a bound on the  $\ell _{2}$-error
  $\frac{1}{2}\Vert u-u^{\ast }\Vert ^{2}$, where
  $(u^{\ast },\mathbf{p}^{\ast })$ is a saddle point. More precisely, if we use both the strong convexity of the energy (with respect to
  $u$) and the strong convexity of the dual energy (with respect to
  $\text{D}^{\ast }\mathbf{p}$) and recall that
  $u^{\ast }=u^{\diamond }-\text{D}^{\ast }\mathbf{p}^{\ast }$ (so
  $\Vert \text{D}^{\ast }\mathbf{p}-\text{D}^{\ast }\mathbf{p}^{\ast }\Vert ^{2}=\Vert (u^{\diamond }-\text{D}^{\ast }\mathbf{p})-u^{\ast }\Vert ^{2}$), we find that
 $$\begin{eqnarray}{\mathcal{G}}(u,\mathbf{p})\geq \displaystyle \frac{1}{2}\Vert u-u^{\ast }\Vert ^{2}+\displaystyle \frac{1}{2}\Vert (u^{\diamond }-\text{D}^{\ast }\mathbf{p})-u^{\ast }\Vert ^{2}.\end{eqnarray}$$
We can even provide a slightly finer criterion, since if we introduce the middle value
 $$\begin{eqnarray}\tilde{u} :=\displaystyle \frac{u+(u^{\diamond }-\text{D}^{\ast }\mathbf{p})}{2},\end{eqnarray}$$
then it follows from (3.19) that
 $$\begin{eqnarray}{\mathcal{G}}(u,\mathbf{p})\geq \Vert \tilde{u} -u^{\ast }\Vert ^{2}+\displaystyle \frac{1}{4}\Vert u^{\diamond }-\text{D}^{\ast }\mathbf{p}-u\Vert ^{2}.\end{eqnarray}$$
Using (3.18) we obtain the error criterion
 $$\begin{eqnarray}{\it\lambda}\Vert \text{D}u\Vert _{p,1}+{\it\delta}_{\{\Vert \cdot \Vert _{q,\infty }\leq {\it\lambda}\}}(\mathbf{p})-\langle \mathbf{p},\text{D}u\rangle +\displaystyle \frac{1}{4}\Vert u^{\diamond }-\text{D}^{\ast }\mathbf{p}-u\Vert ^{2}\geq \Vert \tilde{u} -u^{\ast }\Vert ^{2}.\end{eqnarray}$$
 This can be used to test the convergence of algorithms for this problem, at least when a dual variable  $\mathbf{p}$ is correctly identified, since in that case, if
  $u$ is not provided by the algorithm, one can let
  $u=\tilde{u} =u^{\diamond }-\text{D}^{\ast }\mathbf{p}$. It also shows how to obtain, in a primal–dual method which provides both
  $u$ and
  $\mathbf{p}$ with
  $u\not =\tilde{u}$, a slightly better estimate of the primal
  $\ell _{2}$-error (and of the root-mean-square error
  $\Vert \tilde{u} -u^{\ast }\Vert /\sqrt{mn}$) than that given by the gap.
We will now describe, starting from the simplest, the first-order optimization methods that can be implemented to solve the problems described so far and a few others that will be introduced in Section 7.
4 Gradient methods
The first family of methods we are going to describe is that of first-order gradient descent methods. It might seem a bit strange to introduce such simple and classical tools, which might be considered outdated. However, as mentioned in the Introduction, the most efficient way to tackle many simple problems in imaging is via elaborate versions of plain gradient descent schemes. In fact, as observed in the 1950s, such methods can be considerably improved by adding inertial terms or performing simple over-relaxation steps (or less simple steps, such as Chebyshev iterations for matrix inversion: Varga Reference Varga1962), line-searches, or more elaborate combinations of these, such as conjugate gradient descent; see for instance Polyak (Reference Polyak1987, Section 3.2) or Bertsekas (Reference Bertsekas2015, Section 2.1). Also, if second-order information is available, Newton’s method or quasi-Newton variants such as the (l-)BFGS algorithm (Byrd, Lu, Nocedal and Zhu Reference Byrd, Lu, Nocedal and Zhu1995) can be used, and are known to converge very fast. However, for medium/large non-smooth problems such as those described above, such techniques are not always convenient. It is now acknowledged that, if not too complex to implement, then simpler iterations, which require fewer operations and can sometimes even be parallelized, will generally perform better for a wide class of large-dimensional problems, such as those considered in this paper.
In particular, first-order iterations can be accelerated by many simple tricks such as over-relaxation or variable metrics – for instance Newton’s method – but this framework can be transferred to fairly general schemes (Vũ Reference Vũ2013b, Combettes and Vũ Reference Combettes and Vũ2014), and since the seminal contribution of Nesterov (Reference Nesterov1983) it has been understood that some of the over-relaxation techniques developed for matrix inversion can be adapted to the non-linear setting, providing efficient first-order schemes for non-linear or non-smooth minimization problems. Let us start with the simplest approach and show how it can be improved.
4.1 Gradient descent
We therefore start by describing gradient descent methods, and we will see that these are sufficient to provide efficient methods for solving simple problems such as the Lasso (2.2) or dual ROF (3.17) problems.
Assume we need to find a minimizer of a convex function  $f$, that is, to solve
 $$\begin{eqnarray}\min _{x\in {\mathcal{X}}}f(x),\end{eqnarray}$$
 and let us first assume that  $f$ is differentiable. Then, the most straightforward approach to solving the problem is to implement a gradient descent scheme with fixed step size
  ${\it\tau}>0$: see Algorithm 1. The major issue is that this will typically not work if
  $f$ is not sufficiently smooth. The natural assumption is that
  ${\rm\nabla}f$ is Lipschitz with some constant
  $L$, and
  $0<{\it\tau}L<2$. If
  ${\it\tau}$ is too large, this method will oscillate: if for instance
  $f(x)=x^{2}/2$, then
  $x^{k+1}=(1-{\it\tau})x^{k}$, and it is obvious that this recursion converges if and only if
  ${\it\tau}<2$. On the other hand, a Taylor expansion shows that
 $$\begin{eqnarray}f(x-{\it\tau}{\rm\nabla}f(x))\leq f(x)-{\it\tau}\biggl(1-\displaystyle \frac{{\it\tau}L}{2}\biggr)\Vert {\rm\nabla}f(x)\Vert ^{2},\end{eqnarray}$$
 so that if  ${\it\tau}<2/L$, then we see both that
  $f(x^{k})$ is a strictly decreasing sequence (unless
  ${\rm\nabla}f(x^{k})=0$ at some point) and that
  $\sum _{k}\Vert {\rm\nabla}f(x^{k})\Vert ^{2}<+\infty$ if
  $f$ is bounded from below. If
  $f$ is, in addition, coercive (with bounded level sets), it easily follows in finite dimensions that
  $f(x^{k})$ converges to a critical value and that every converging subsequence of
  $(x^{k})_{k\geq 0}$ goes to a critical point. If
  $f$ is convex, then
  $x\mapsto x-{\it\tau}{\rm\nabla}f(x)$ is also a (weak) contraction, which shows that
  $\Vert x^{k}-x^{\ast }\Vert$ is also non-increasing, for any minimizerFootnote 4
 $x^{\ast }$ of
  $f$. In this case we can deduce the convergence of the whole sequence
  $(x^{k})_{k}$ to a solution, if
  $0<{\it\tau}<2/L$. In fact, this is a particular case of the fairly general theory of averaged operators, for which such iterations converge: see Theorem A.1 in the Appendix for details and references.
4.2 Implicit gradient descent and the proximal-point algorithm
The above analysis breaks down if  ${\rm\nabla}f$ is not Lipschitz, as clearly it will be much harder to understand how
  $f$ and its gradient behave at the new point given by (4.1). One typical workaround is to use varying steps that converge to zero (see Section 4.3), but this leads to very slow algorithms. Another one is to try to implement an implicit gradient descent where the iteration (4.1) is replaced with
 $$\begin{eqnarray}x^{k+1}=x^{k}-{\it\tau}{\rm\nabla}f(x^{k+1}).\end{eqnarray}$$
 Now the question is how to implement this iteration. We clearly see that if such an  $x^{k+1}$ exists, then it satisfies
 $$\begin{eqnarray}{\rm\nabla}f(x^{k+1})+\displaystyle \frac{x^{k+1}-x^{k}}{{\it\tau}}=0,\end{eqnarray}$$
so it is a critical point of the function
 $$\begin{eqnarray}x\mapsto f(x)+\displaystyle \frac{\Vert x-x^{k}\Vert }{2{\it\tau}}^{2}.\end{eqnarray}$$
 If, in addition,  $f$ is convex and l.s.c. (rather than
  $C^{1}$), then this critical point is the unique minimizer of (4.4), that is, the proximal map of
  ${\it\tau}f$ evaluated at
  $x^{k}$ (see Section 3.4). We will say that the convex function
  $f$ is simple if the proximal maps
  ${\it\tau}f$,
  ${\it\tau}>0$, can be easily evaluated. An important observation is that its definition does not require any smoothness of
  $f$. Now consider the function
 $$\begin{eqnarray}\bar{x}\mapsto f_{{\it\tau}}(\bar{x}):=\min _{x\in {\mathcal{X}}}f(x)+\displaystyle \frac{\Vert x-\bar{x}\Vert }{2{\it\tau}}^{2},\end{eqnarray}$$
 which is the Moreau–Yosida regularization of  $f$ with parameter
  ${\it\tau}>0$. It is a standard fact that
  ${\rm\nabla}f_{{\it\tau}}(\bar{x})$ is a
  $(1/{\it\tau})$-Lipschitz function whose gradient is given by
 $$\begin{eqnarray}{\rm\nabla}f_{{\it\tau}}(\bar{x})=\displaystyle \frac{\bar{x}-\text{prox}_{{\it\tau}f}(\bar{x})}{{\it\tau}}.\end{eqnarray}$$
 Indeed, for any  $x,y$, letting
  ${\it\xi}=\text{prox}_{{\it\tau}f}(x)$ and
  ${\it\eta}=\text{prox}_{{\it\tau}f}(y)$,
 $$\begin{eqnarray}\displaystyle f_{{\it\tau}}(y) & = & \displaystyle f({\it\eta})+\displaystyle \frac{\Vert {\it\eta}-y\Vert ^{2}}{2{\it\tau}}\nonumber\\ \displaystyle & = & \displaystyle f({\it\eta})+\displaystyle \frac{\Vert {\it\eta}-x\Vert ^{2}}{2{\it\tau}}+\langle \displaystyle \frac{x-{\it\eta}}{{\it\tau}},y-x\rangle +\displaystyle \frac{\Vert x-y\Vert ^{2}}{2{\it\tau}}\nonumber\\ \displaystyle & \geq & \displaystyle f({\it\xi})+\displaystyle \frac{\Vert {\it\xi}-x\Vert ^{2}}{2{\it\tau}}+\langle \displaystyle \frac{x-{\it\xi}}{{\it\tau}},y-x\rangle +\langle \displaystyle \frac{{\it\xi}-{\it\eta}}{{\it\tau}},y-x\rangle \nonumber\\ \displaystyle & & \displaystyle \qquad +\displaystyle \frac{\Vert {\it\eta}-{\it\xi}\Vert ^{2}}{2{\it\tau}}+\displaystyle \frac{\Vert x-y\Vert ^{2}}{2{\it\tau}}\nonumber\\ \displaystyle & = & \displaystyle f_{{\it\tau}}(x)+\langle \displaystyle \frac{x-{\it\xi}}{{\it\tau}},y-x\rangle +\displaystyle \frac{{\it\tau}}{2}\biggl\|\displaystyle \frac{y-{\it\eta}}{{\it\tau}}-\displaystyle \frac{x-{\it\xi}}{{\it\tau}}\biggr\|^{2},\nonumber\end{eqnarray}$$
 which actually shows that  $(x-{\it\xi})/{\it\tau}$ is a subgradient of
  $f_{{\it\tau}}$ at
  $x$. In the third line we have used the fact that
  ${\it\xi}$ is the minimizer of a
  $(1/{\it\tau})$-strongly convex problem. The last term in this equation expresses the fact that the map
  $\bar{x}\mapsto (\bar{x}-\text{prox}_{{\it\tau}f}(\bar{x}))/{\it\tau}$ is
  ${\it\tau}$-co-coercive, which implies that it is also
  $(1/{\it\tau})$-Lipschitz, as claimed.
Now we can rewrite (4.6) in the form
 $$\begin{eqnarray}\text{prox}_{{\it\tau}f}(\bar{x})=\bar{x}-{\it\tau}{\rm\nabla}f_{{\it\tau}}(\bar{x}),\end{eqnarray}$$
 which shows that an iteration of implicit gradient descent for  $f$, which in its general form reads
 $$\begin{eqnarray}x^{k+1}=\text{prox}_{{\it\tau}f}(x^{k})=(I+{\it\tau}\partial f)^{-1}(x^{k})=x^{k}-{\it\tau}{\rm\nabla}f_{{\it\tau}}(x^{k}),\end{eqnarray}$$
 is exactly the same as an iteration of explicit gradient descent for  $f_{{\it\tau}}$, with step
  ${\it\tau}$ (which is admissible since
  ${\rm\nabla}f_{{\it\tau}}$ is
  $(1/{\it\tau})$-Lipschitz). As it is obvious from its definition (4.5) that both
  $f$ and
  $f_{{\it\tau}}$ have the same set of minimizers, the convergence theory for the implicit algorithm is a simple corollary of the convergence theory for explicit gradient descent with fixed step. Moreover, as we know we can take slightly larger steps (we can let
  $x^{k+1}=x^{k}-{\it\sigma}{\rm\nabla}f_{{\it\tau}}(x^{k})$ for any choice of
  ${\it\sigma}<2{\it\tau}$), then we also deduce the convergence for the iterations:
 $$\begin{eqnarray}x^{k+1}=(1+{\it\theta})\text{prox}_{{\it\tau}f}(x^{k})-{\it\theta}x^{k},\end{eqnarray}$$
 for any  ${\it\theta}\in (-1,1)$. These elementary remarks are in fact at the heart of the rich theory of contraction semigroups in Hilbert and Banach spaces, when applied to more general monotone or accretive operators (indeed, (4.6) is exactly the Yosida regularization of the subgradient operator
  $\partial f$). See for instance Brézis (Reference Brézis1973).
In optimization theory, the extension of these remarks to a general monotone operator is known as the ‘proximal-point algorithm’ (PPA), introduced in Martinet (Reference Martinet1970). The general form of the PPA algorithm is the iteration
 $$\begin{eqnarray}x^{k+1}=(I+{\it\tau}_{k}T)^{-1}x^{k}\end{eqnarray}$$
 (with a possible relaxation as in (4.8)), which is shown to converge to a zero of  $T$ under certain conditions.Footnote 5 This method has been studied extensively since the 1970s (Martinet Reference Martinet1970, Rockafellar Reference Rockafellar1976), and in fact many of the methods we consider later on are special instances. Convergence proofs and rates of convergence can be found, for instance, in Brézis and Lions (Reference Brézis and Lions1978) (these require
  $\sum _{k}{\it\tau}_{k}^{2}=+\infty$, but
  $\sum _{k}{\it\tau}_{k}=+\infty$ is sufficient if
  $T=\partial f$); see also the work of Güler (Reference Güler1991) when
  $T=\partial f$. In fact some of the results mentioned in Section 4.7 below will apply to this method as a particular case, when
  $T=\partial f$, extending some of the results of Güler (Reference Güler1991).
Fairly general convergence rates for gradient methods are given in the rich book of Bertsekas (Reference Bertsekas2015, Propositions 5.1.4, 5.1.5), depending on the behaviour of  $f$ near the set of minimizers. In the simplest case of the descent (4.1) applied to a function
  $f$ with
  $L$-Lipschitz gradient, the convergence rate is found in many other textbooks (e.g. Nesterov Reference Nesterov2004) and reads as follows.
Theorem 4.1. Let  $x^{0}\in {\mathcal{X}}$ and
  $x^{k}$ be recursively defined by (4.1), with
  ${\it\tau}\leq 1/L$. Then not only does
  $(x^{k})_{k}$ converge to a minimizer, but the value
  $f(x^{k})$ decays with the rate
 $$\begin{eqnarray}f(x^{k})-f(x^{\ast })\leq \displaystyle \frac{1}{2{\it\tau}k}\Vert x^{\ast }-x^{0}\Vert ^{2},\end{eqnarray}$$
 where  $x^{\ast }$ is any minimizer of
  $f$. If in addition
  $f$ is strongly convex with parameter
  ${\it\mu}_{f}>0$, we have
 $$\begin{eqnarray}f(x^{k})-f(x^{\ast })+\displaystyle \frac{1}{2{\it\tau}}\Vert x^{k}-x^{\ast }\Vert ^{2}\leq {\it\omega}^{k}\displaystyle \frac{1}{2{\it\tau}}\Vert x^{0}-x^{\ast }\Vert ^{2},\end{eqnarray}$$
 where  ${\it\omega}=(1-{\it\tau}{\it\mu}_{f})<1$.
A short (standard) proof is given in Appendix B.
Remark 4.2. This form of the result is slightly suboptimal, allowing a very elementary proof in Appendix B. However, it can be checked that the first rate holds for larger steps  ${\it\tau}<2/L$, while the second can be improved by taking larger steps (
 ${\it\tau}=2/(L+{\it\mu}_{f})$), yielding linear convergence with a factor
  ${\it\omega}=(1-{\it\mu}_{f}/L)/(1+{\it\mu}_{f}/L)$; see for instance Nesterov (Reference Nesterov2004, Theorem 2.1.15). However, we will see very soon that this too can be improved.
Of course, the observations above show that similar rates will also hold for the implicit form (4.7): indeed, recalling that  $f_{{\it\tau}}(x^{\ast })=f(x^{\ast })$ for any
  ${\it\tau}>0$, we have that a bound on
  $f_{{\it\tau}}(x^{k})-f_{{\it\tau}}(x^{\ast })$ is, by definition, also a bound on
 $$\begin{eqnarray}f(x^{k+1})-f(x^{\ast })+\displaystyle \frac{\Vert x^{k+1}-x^{k}\Vert ^{2}}{2{\it\tau}}.\end{eqnarray}$$
 We remark that in this implicit case it would seem that we only have to choose the largest possible  ${\it\tau}$ to solve the minimization accurately. We will see further (Example 3.1) that in practice, we are not always free to choose the step or the metric which makes the algorithm actually implementable. In other situations the choice of the step might eventually result in a trade-off between the precision of the computation, the overall rate and the complexity of one single iteration (which should also depend on
  ${\it\tau}$).
4.3 Subgradient descent
Another way to implement a gradient scheme for a non-smooth convex objective is to perform a subgradient descent, that is, try to reduce the energy by following the direction of an arbitrarily chosen subgradient: see Algorithm 2. In general, this method performs poorly, as shown by Polyak (Reference Polyak1987) and Nesterov (Reference Nesterov2004) for example, since the typical rate for such a method (which is also optimal: Nesterov Reference Nesterov2004) is  $O(1/\sqrt{k})$ for the best objective found after the
  $k$th iteration. However, if
  $f$ is not ‘simple’ but
  $\partial f$ is easy to compute, this might be an option, but it is preferable to try to use a splitting strategy as described in Section 4.7 and the following. A condition for convergence is that
  $f$ should be
  $M$-Lipschitz (at least near the optimum), which is not too restrictive in finite dimensions since
  $f$ is always locally Lipschitz in the interior of its domain.

The study of convergence of this algorithm is based on the following simple chain of (in)equalities: given  $x^{\ast }$ a minimizer, we have
 $$\begin{eqnarray}\displaystyle \Vert x_{k+1}-x^{\ast }\Vert ^{2} & = & \displaystyle \biggl\|x_{k}-x^{\ast }-h_{k}\displaystyle \frac{g_{k}}{\Vert g_{k}\Vert }\biggr\|^{2}\nonumber\\ \displaystyle & = & \displaystyle \Vert x_{k}-x^{\ast }\Vert ^{2}-2\displaystyle \frac{h_{k}}{\Vert g_{k}\Vert }\langle x_{k}-x^{\ast },g_{k}\rangle +h_{k}^{2}\nonumber\\ \displaystyle & \leq & \displaystyle \Vert x_{k}-x^{\ast }\Vert ^{2}-2\displaystyle \frac{h_{k}}{\Vert g_{k}\Vert }(f(x_{k})-f(x^{\ast }))+h_{k}^{2}\nonumber\end{eqnarray}$$
 and hence (using  $\Vert g_{k}\Vert \leq M$ and letting
  $x_{k}^{o}=\arg \min _{x_{i},i\leq k}f(x_{i})$)
 $$\begin{eqnarray}f(x_{k}^{o})-f(x^{\ast })\leq M\displaystyle \frac{\mathop{\sum }_{i=0}^{k}h_{i}^{2}+\Vert x_{0}-x^{\ast }\Vert ^{2}}{2\mathop{\sum }_{i=0}^{k}h_{i}},\end{eqnarray}$$
 which goes to  $0$ as
  $k\rightarrow \infty$ by assumption. If we now choose
  $h_{i}=C/\sqrt{k+1}$ (Nesterov Reference Nesterov2004) for the first
  $k$ iterations, then at iteration
  $k$ we find
 $$\begin{eqnarray}f(x_{k}^{o})-f(x^{\ast })\leq M\displaystyle \frac{C+\Vert x_{0}-x^{\ast }\Vert ^{2}}{2C\sqrt{k+1}}.\end{eqnarray}$$
 Clearly, this is much slower than the rate of descent with fixed steps which can be reached when  ${\rm\nabla}f$ is Lipschitz.
A variant proposed by Polyak (Reference Polyak1987) consists in choosing  $h_{k}=c_{k}(f(x^{k})-f(x^{\ast }))/\Vert g_{k}\Vert ^{2}$, with
  $c_{k}\in ({\it\alpha},2-{\it\alpha})$ for some
  ${\it\alpha}>0$. However, this requires knowledge, or a good estimate, of the optimal value
  $f(x^{\ast })$. The rate for this approach is again
  $O(1/k)$.
Inexact variants, based on the notion of  ${\it\varepsilon}$-subgradients (Rockafellar Reference Rockafellar1997), have also been introduced (Bertsekas and Mitter Reference Bertsekas and Mitter1973, Polyak Reference Polyak1987). These have been studied recently by Benfenati and Ruggiero (Reference Benfenati and Ruggiero2013) to tackle non-linear inverse problems in imaging (see also Bonettini, Benfenati and Ruggiero Reference Bonettini, Benfenati and Ruggiero2014). They have also been used by Bonettini and Ruggiero (Reference Bonettini and Ruggiero2012) to reinterpret a primal–dual scheme of Zhu and Chan (Reference Zhu and Chan2008) (see Section 5.1) and prove its convergence.
4.4 Lower bounds for smooth convex optimization
An important question is what is the best possible rate of convergence of a first-order method applied to a convex optimization problem. Of course, the answer depends on the properties of the function to minimize. An answer in the form of lower bounds has been given by Nemirovski and Yudin (Reference Nemirovski and Yudin1983), and is also found in Nesterov (Reference Nesterov2004). The idea is to consider a fairly general class of first-order methods where the iterates  $x^{k}$ are restricted to the subspace spanned by the gradients of earlier iterates, that is, for
  $k\geq 0$,
 $$\begin{eqnarray}x^{k}\in x^{0}+\text{span}\{{\rm\nabla}f(x^{0}),{\rm\nabla}f(x^{1}),\ldots ,{\rm\nabla}f(x^{k-1})\},\end{eqnarray}$$
 where  $x^{0}$ is an arbitrary starting point. Then, for
  $x\in \mathbb{R}^{n}$, we consider
  $L>0$,
  ${\it\mu}\geq 0$,
  $1\leq p\leq n$, the minimization of functions of the form
 $$\begin{eqnarray}f(x)=\displaystyle \frac{L-{\it\mu}}{8}\biggl((x_{1}-1)^{2}+\mathop{\sum }_{i=2}^{p}(x_{i}-x_{i-1})^{2}\biggr)+\displaystyle \frac{{\it\mu}}{2}\Vert x\Vert ^{2}.\end{eqnarray}$$
 Starting from an initial point  $x^{0}=0$, any first-order method of the class considered can transmit the information of the data term only at the speed of one coordinate index per iteration. This makes such problems very hard to solve by any first-order methods in the class (4.11). Indeed, if we start from
  $x^{0}=0$ in the above problem (whose solution is given by
  $x_{k}^{\ast }=1$,
  $k=1,\ldots ,p$, and
  $0$ for
  $k>p$), then at the first iteration, only the first component
  $x_{1}^{1}$ will be updated (since
  $\partial f/\partial x_{i}(x^{0})=0$ for
  $i\geq 2$), and by induction we can check that
  $x_{l}^{k}=0$ for
  $l\geq k+1$.
For convenience we reproduce a variant of the results in Nesterov (Reference Nesterov2004) (where a slightly different function is used: see Theorems 2.1.7 and 2.1.13). If  ${\it\mu}=0$, using (possible translates of) the function (4.12), which is very ill conditioned (and degenerate if defined in dimension
  $n>p$), the following general lower bound for smooth convex optimization can be shown.
Theorem 4.3. For any  $x^{0}\in \mathbb{R}^{n}$,
  $L>0$, and
  $k<n$ there exists a convex, continuously differentiable function
  $f$ with
  $L$-Lipschitz-continuous gradient, such that for any first-order algorithm satisfying (4.11), we have
 $$\begin{eqnarray}f(x^{k})-f(x^{\ast })\geq \displaystyle \frac{L\Vert x^{0}-x^{\ast }\Vert ^{2}}{8(k+1)^{2}},\end{eqnarray}$$
 where  $x^{\ast }$ denotes a minimizer of
  $f$.
$f$.
This particular bound is reached by considering the function in (4.12) with  $p=k+1$, and an appropriate change of variable which moves the starting point to the origin. Observe that the above lower bound is valid only if the number of iterates
  $k$ is less than the problem size. We cannot improve this with a quadratic function, as the conjugate gradient method (which is a first-order method) is then known to find the global minimizer after at most
  $n$ steps. But the practical problems we encounter in imaging are often so large that we will never be able to perform as many iterations as the dimension of the problem.
If choosing  ${\it\mu}>0$ so that the function (4.12) becomes
  ${\it\mu}$-strongly convex, a lower bound for first-order methods is given in Theorem 2.1.13 of Nesterov (Reference Nesterov2004), which reads as follows.
Theorem 4.4. For any  $x^{0}\in \mathbb{R}^{\infty }\simeq \ell _{2}(\mathbb{N})$ and
  ${\it\mu},L>0$ there exists a
  ${\it\mu}$-strongly convex, continuously differentiable function
  $f$ with
  $L$-Lipschitz-continuous gradient, such that, for any algorithm in the class of first-order algorithms defined by (4.11), we have
 $$\begin{eqnarray}f(x^{k})-f(x^{\ast })\geq \displaystyle \frac{{\it\mu}}{2}\biggl(\displaystyle \frac{\sqrt{q}-1}{\sqrt{q}+1}\biggr)^{2k}\Vert x^{0}-x^{\ast }\Vert ^{2}\end{eqnarray}$$
 for all  $k$, where
  $q=L/{\it\mu}\geq 1$ is the condition number, and
  $x^{\ast }$ is the minimizer of
  $f$.
$f$.
In finite dimensions, one can adapt the proof of Nesterov (Reference Nesterov2004) to show the same result for sufficiently small  $k$, with respect to
  $n$. It is important to bear in mind that these lower bounds are inevitable for any first-order algorithm (assuming the functions are ‘no better’ than with
  $L$-Lipschitz gradient and
  ${\it\mu}$-strongly convex). Of course, one could ask if these lower bounds are not too pessimistic, and whether such hard problems will appear in practice. We will indeed see that these lower bounds are highly relevant to our algorithms, and are observed when minimizing relatively simple problems such as the ROF model. Let us mention that many other types of interesting lower bounds can be found in the literature for most of the algorithmic techniques described in this paper, and a few others; see in particular the recent and fairly exhaustive study by Davis and Yin (Reference Davis and Yin2014a).
4.5 Accelerated gradient descent
Let us return to standard gradient descent. It turns out that the rates in Theorem 4.1 are suboptimal, in the sense that smaller upper bounds can be obtained, which (almost) match the lower bounds presented in the previous section. Accelerated variants of the gradient method for non-linear problems were first proposed by Nesterov (Reference Nesterov1983); see also Güler (Reference Güler1992) for the implicit form and variants, including inexact forms, and Salzo and Villa (Reference Salzo and Villa2012) for a more general result. The method consists in simply performing a varying relaxation step at each iteration: see Algorithm 3.

Theorem 4.5. Let  $\{x^{k}\}$ be a sequence generated by the accelerated gradient descent (4.15). Then if
  $x^{\ast }$ is a minimizer, we have
 $$\begin{eqnarray}f(x^{k})-f(x^{\ast })\leq \displaystyle \frac{2}{{\it\tau}(k+1)^{2}}\Vert x^{0}-x^{\ast }\Vert ^{2}.\end{eqnarray}$$
 This rate is clearly better than the rate in Theorem 4.1, and, in fact, optimal when comparing to the lower bound in Theorem 4.3. We leave the case where  $f$ is strongly convex to Section 4.7 below, where we will present a more general result. Both are particular cases of Theorem B.1 in the Appendix.
Comparison of accelerated and non-accelerated gradient schemes. (a) Comparisons of the solutions  $x$ of GD and AGD after
  $10\,000$(!) iterations. (b) Rate of convergence for GD and AGD together with their theoretical worst-case rates, and the lower bound for smooth optimization. For comparison we also provide the rate of convergence for CG. Note that CG exactly touches the lower bound at
  $k=99$.

Example 4.6 (minimizing the worst-case function).
In this example we show the actual performance of gradient methods for the worst-case function presented in (4.12) using  $p=n=100$. Figure 4.1 compares the speed of convergence of gradient descent (GD), accelerated gradient descent (AGD), and conjugate gradient (CG), together with the lower bound for smooth optimization provided in (4.13). The results show that AGD is significantly faster than GD. For comparison we also applied CG, which is known to be an optimal method for quadratic optimization and provides convergence, in finitely many steps, to the true solution, in this case after at most
  $k=100$ iterations. Observe that CG exactly touches the lower bound at
  $k=99$ (black cross), which shows that the lower bound is sharp for this problem. Before and after
  $k=99$, however, the lower bound is fairly pessimistic.
4.6 Descent on the Moreau–Yosida regularization
Let us consider a certain class of problems in which the objective function is the sum of a simple convex function and a quadratic function. This is the case for the dual of the ROF problem or the Lasso problem. We want to solve
 $$\begin{eqnarray}\min _{x\in {\mathcal{X}}}f(x):=\displaystyle \frac{1}{2}\Vert Kx-x^{\diamond }\Vert ^{2}+g(x)\end{eqnarray}$$
 with  $g$ simple (e.g., a characteristic function of a polar ball or an
  $\ell _{1}$-norm). An important observation is that in this case the Moreau–Yosida regularization (4.5) of
  $f$ is actually computable, provided that we choose the metric carefully. Let
 $$\begin{eqnarray}M=\displaystyle \frac{1}{{\it\tau}}I-K^{\ast }K,\end{eqnarray}$$
 which is positiveFootnote 6 if  ${\it\tau}\Vert K\Vert ^{2}<1$. Then the Moreau–Yosida regularization of
  $f$ in the metric
  $M$ is given by
 $$\begin{eqnarray}f_{M}(\bar{x}):=\min _{x}\displaystyle \frac{1}{2}\Vert x-\bar{x}\Vert _{M}^{2}+\displaystyle \frac{1}{2}\Vert Kx-x^{\diamond }\Vert ^{2}+g(x)\end{eqnarray}$$
 and the point  $\hat{x}=\text{prox}_{f}^{M}(\bar{x})$ which solves this problem is given by
 $$\begin{eqnarray}\hat{x}=(I+{\it\tau}\partial g)^{-1}(\bar{x}-{\it\tau}K^{\ast }(K\bar{x}-x^{\diamond })).\end{eqnarray}$$
 In other words, we can perform an implicit gradient descent (4.7) of  $f$ in the metric
  $M$. For the Lasso problem, this iteration is known as the ‘iterative soft-thresholding’ algorithm (Donoho Reference Donoho1995, Chambolle, DeVore, Lee and Lucier Reference Chambolle, DeVore, Lee and Lucier1998, Daubechies, Defrise and De Mol Reference Daubechies, Defrise and De Mol2004, Bect, Blanc-Féraud, Aubert and Chambolle Reference Bect, Blanc-Féraud, Aubert, Chambolle, Pajdla and Matas2004), as the proximity operator of
  $g=\Vert \cdot \Vert _{1}$ consists of a ‘soft-thresholding’ of the values. From (4.6), we see that
  ${\rm\nabla}f_{M}(\bar{x})=\hat{x}-\bar{x}$ (where the gradient is computed also in the metric
  $M$), and is (still in this metric)
  $1$-Lipschitz. Therefore, we can solve the problem with a simple gradient descent (4.1) on the function
  $f_{M}$ (which is equivalent to (4.7) for
  $f$), or the accelerated descent described in Theorem 4.5.
It turns out that the operator in (4.17) can also be written (in the initial metric)
 $$\begin{eqnarray}\hat{x}=\text{prox}_{{\it\tau}g}\biggl(\bar{x}-{\it\tau}{\rm\nabla}\biggl(\displaystyle \frac{1}{2}\Vert K\cdot -x^{\diamond }\Vert ^{2}\biggr)(\bar{x})\biggr),\end{eqnarray}$$
 combining a step of implicit (‘backward’) gradient descent for  $g$ and a step of explicit (‘forward’) gradient descent for the smooth part
  ${\textstyle \frac{1}{2}}\Vert K\cdot -x^{\diamond }\Vert ^{2}$ of (4.16). This is a particular case of a more general gradient descent algorithm which mixes the two points of view explained so far, and which we describe in Section 4.7 below.
These first elementary convergence results can already be applied to quite important problems in imaging and statistics. We first consider plain gradient descent for the primal ROF problem and then show how we can use implicit descent to minimize the dual of the ROF problem (3.17), which has the same structure as the Lasso problem (2.2).
Example 4.7 (minimizing the primal ROF model).
In this example we consider gradient descent methods to minimize the primal ROF model, in (2.6), for  $p=2$. As mentioned above, this will work only if the gradient of our energy is Lipschitz-continuous, which is not the case for (2.6). Hence we consider a smoothed version of the total variation, which is obtained by replacing the norm
  $\Vert \text{D}u\Vert _{2,1}$, which is singular at
  $0$, with a smoothed approximation; this means in practice that we solve a different problem, but we could theoretically estimate how far the solution to this problem is from the solution to the initial problem. A classical choice is
 $$\begin{eqnarray}\mathop{\sum }_{i,j}\sqrt{{\it\varepsilon}^{2}+(Du)_{i,j,1}^{2}+(Du)_{i,j,2}^{2}},\end{eqnarray}$$
 where  ${\it\varepsilon}>0$ is a (usually small) parameter. While this approximation is
  $C^{\infty }$, it tends to promote large gradients near the discontinuities of the image. A good alternative is the ‘Huber regularizer’. Letting
 $$\begin{eqnarray}h_{{\it\varepsilon}}(t)=\left\{\begin{array}{@{}ll@{}}\displaystyle \displaystyle \frac{t^{2}}{2{\it\varepsilon}}\quad & \text{if }t\leq {\it\varepsilon},\\ \displaystyle |t|-\displaystyle \frac{{\it\varepsilon}}{2}\quad & \text{else},\end{array}\right.\end{eqnarray}$$
 which is merely  $C^{1}$ but smooths the absolute value function only locally around zero, we consider the following Huber-ROF problem:
 $$\begin{eqnarray}\min _{u}f(u)=H_{{\it\varepsilon}}(\text{D}u)+\displaystyle \frac{1}{2}\Vert u-u^{\diamond }\Vert ^{2},\end{eqnarray}$$
with
 $$\begin{eqnarray}H_{{\it\varepsilon}}(\text{D}u)={\it\lambda}\mathop{\sum }_{i=1,j=1}^{m,n}h_{{\it\varepsilon}}(\sqrt{(\text{D}u)_{i,j,1}^{2}+(\text{D}u)_{i,j,2}^{2}}).\end{eqnarray}$$
 Observe that (4.19) is strongly convex with parameter  ${\it\mu}=1$. Although we want to minimize the primal problem here, we remark that the dual of the Huber-ROF model is
 $$\begin{eqnarray}\max _{\mathbf{p}}-\displaystyle \frac{1}{2}\Vert \text{D}^{\ast }\mathbf{p}\Vert ^{2}+\langle \text{D}^{\ast }\mathbf{p},u^{\diamond }\rangle -H_{{\it\varepsilon}}^{\ast }(\mathbf{p}),\end{eqnarray}$$
with
 $$\begin{eqnarray}H_{{\it\varepsilon}}^{\ast }(\mathbf{p})=\displaystyle \frac{{\it\varepsilon}}{2{\it\lambda}}\Vert \mathbf{p}\Vert ^{2}+{\it\delta}_{\{\Vert \cdot \Vert _{2,\infty }\leq {\it\lambda}\}}(\mathbf{p}),\end{eqnarray}$$
 where  ${\it\delta}_{\{\Vert \cdot \Vert _{2,\infty }\leq {\it\lambda}\}}(\mathbf{p})$ denotes the characteristic function of the polar ball
  $\{\mathbf{p}:\Vert \mathbf{p}\Vert _{2,\infty }\leq {\it\lambda}\}$ as in (3.16): it is simply the dual (3.17) of ROF, to which a small ‘smoothing term’
  ${\it\varepsilon}/(2{\it\lambda})\Vert \mathbf{p}\Vert ^{2}$ has been added.
The gradient of (4.19) is computed as
 $$\begin{eqnarray}{\rm\nabla}f(u)=\text{D}^{\ast }\tilde{\mathbf{p}}+u-u^{\diamond },\end{eqnarray}$$
 where  $\tilde{\mathbf{p}}={\rm\nabla}H_{{\it\varepsilon}}(Du)$, and it can be written as
  $\tilde{\mathbf{p}}=(\tilde{\mathbf{p}}_{1,1},\ldots ,\tilde{\mathbf{p}}_{m,n})$, with
  $\tilde{\mathbf{p}}_{i,j}$ given by
 $$\begin{eqnarray}\tilde{\mathbf{p}}_{i,j}=\displaystyle \frac{{\it\lambda}(\text{D}u)_{i,j}}{\max \{{\it\varepsilon},|(\text{D}u)_{i,j}|_{2}\}}.\end{eqnarray}$$
 A simple computation shows that  ${\rm\nabla}f(u)$ is Lipschitz-continuous with parameter
  $L=1+(\Vert \text{D}\Vert ^{2}{\it\lambda})/{\it\varepsilon}$, where
  $\Vert \text{D}\Vert \leq \sqrt{8}$ is the operator norm of
  $\text{D}$; see (2.5).
It can be observed that the auxiliary variables  $\tilde{\mathbf{p}}$ are feasible (that is,
  ${\it\delta}_{\{\Vert \cdot \Vert _{2,\infty }\leq {\it\lambda}\}}(\tilde{\mathbf{p}})=0$) dual variables, as by definition they satisfy (3.14). Hence we can use these expressions to compute the primal–dual gap (3.18) (where the regularizer and its conjugate now need to be replaced with
  $H_{{\it\varepsilon}}(\text{D}u)$ and
  $H_{{\it\varepsilon}}^{\ast }(\mathbf{p})$):
 $$\begin{eqnarray}{\mathcal{G}}(u,\tilde{\mathbf{p}})=H_{{\it\varepsilon}}(\text{D}u)+\displaystyle \frac{{\it\varepsilon}}{2{\it\lambda}}\Vert \tilde{\mathbf{p}}\Vert ^{2}-\langle \tilde{\mathbf{p}},\text{D}u\rangle +\displaystyle \frac{1}{2}\Vert u^{\diamond }-\text{D}^{\ast }\tilde{\mathbf{p}}-u\Vert ^{2}.\end{eqnarray}$$
Using (3.20), we also obtain that
 $$\begin{eqnarray}H_{{\it\varepsilon}}(\text{D}u)+\displaystyle \frac{{\it\varepsilon}}{2{\it\lambda}}\Vert \tilde{\mathbf{p}}\Vert ^{2}-\langle \tilde{\mathbf{p}},\text{D}u\rangle +\displaystyle \frac{1}{4}\Vert u^{\diamond }-\text{D}^{\ast }\tilde{\mathbf{p}}-u\Vert ^{2}\geq \Vert \tilde{u} -u^{\ast }\Vert ^{2},\end{eqnarray}$$
 where  $u^{\ast }$ is the solution of (4.19) and
  $\tilde{u} =(u+u^{\diamond }-\text{D}^{\ast }\tilde{\mathbf{p}})/2$. We implement the gradient descent algorithm (4.1) using a constant step size
  ${\it\tau}=2/(L+{\it\mu})$ and apply the algorithm to Example 2.1. Figure 4.2 shows the convergence of the primal–dual gap using different values of
  ${\it\varepsilon}$. Since the objective function is smooth and strongly convex, the gradient descent converges linearly. However, for smaller values of
  ${\it\varepsilon}$, where the smoothed ROF model approaches the original ROF model, the convergence of the algorithm becomes very slow. The next example shows that it is actually a better idea to minimize the dual of the ROF model.
Minimizing the primal ROF model using smoothed (Huber) total variation applied to the image in Figure 2.1. The figure shows the convergence of the primal–dual gap using plain gradient descent for different settings of the smoothing parameter  ${\it\varepsilon}$.

Example 4.8 (minimizing the dual ROF model).
Let us turn to the problem of minimizing the dual ROF model using the explicit representation of the Moreau–Yosida envelope. We consider (4.16) with  $K=\text{D}$ and
  $g={\it\delta}_{\{\Vert \cdot \Vert _{2,\infty }\leq {\it\lambda}\}}$. The Moreau–Yosida regularization is given by
 $$\begin{eqnarray}f_{M}(\bar{\mathbf{p}}):=\min _{\mathbf{p}}\displaystyle \frac{1}{2}\Vert \mathbf{p}-\bar{\mathbf{p}}\Vert _{M}^{2}+\displaystyle \frac{1}{2}\Vert \text{D}^{\ast }\mathbf{p}-u^{\diamond }\Vert ^{2}+{\it\delta}_{\{\Vert \cdot \Vert _{2,\infty }\leq {\it\lambda}\}}(\mathbf{p}),\end{eqnarray}$$
 with  ${\it\tau}^{\prime }$ such that
  $M=(1/{\it\tau}^{\prime })\,I-\text{D}\text{D}^{\ast }>0$, and the minimum of the right-hand side is attained for
 $$\begin{eqnarray}\hat{\mathbf{p}}={\rm\Pi}_{\{\Vert \cdot \Vert _{2,\infty }\leq {\it\lambda}\}}(\bar{\mathbf{p}}-{\it\tau}^{\prime }\text{D}(\text{D}^{\ast }\bar{\mathbf{p}}-u^{\diamond })),\end{eqnarray}$$
 where  ${\rm\Pi}_{\{\Vert \cdot \Vert _{2,\infty }\leq {\it\lambda}\}}$ denotes the (pixelwise) orthogonal projection onto 2-balls with radius
  ${\it\lambda}$, that is, for each pixel
  $i,j$, the projection is computed by
 $$\begin{eqnarray}\hat{\mathbf{p}}={\rm\Pi}_{\{\Vert \cdot \Vert _{2,\infty }\leq {\it\lambda}\}}(\tilde{\mathbf{p}})\Leftrightarrow \hat{\mathbf{p}}_{i,j}=\displaystyle \frac{\tilde{\mathbf{p}}_{i,j}}{\max \{1,{\it\lambda}^{-1}|\tilde{\mathbf{p}}_{i,j}|_{2}\}}.\end{eqnarray}$$
 As shown before, the gradient in the  $M$-metric is given by
 $$\begin{eqnarray}{\rm\nabla}f_{M}(\bar{\mathbf{p}})=\bar{\mathbf{p}}-\hat{\mathbf{p}}.\end{eqnarray}$$
 The advantages of minimizing the dual ROF model, rather than the primal ROF model as in Example 4.7, are immediate. Thanks to the implicit smoothing of the Moreau–Yosida regularization, we do not need to artificially smooth the objective function and hence any gradient method will converge to the exact minimizer. Second, the step size of a gradient method will just depend on  $\Vert \text{D}\Vert$, whereas the step size of a gradient method applied to the primal ROF model is proportional to the smoothing parameter
  ${\it\varepsilon}$. We implement both a standard gradient descent (GD) with step size
  ${\it\tau}=1.9$ and the accelerated gradient descent (AGD) with step size
  ${\it\tau}=1$. The parameter
  ${\it\tau}^{\prime }$ in the
  $M$-metric is set to
  ${\it\tau}^{\prime }=0.99/\Vert \text{D}\Vert ^{2}$.
Comparison of different gradient-based methods applied to Moreau–Yosida regularization of the dual ROF model using the image in Figure 2.1. Accelerated gradient descent (AGD) and the quasi-Newton method (l-BFGS) are significantly faster than plain gradient descent (GD).

Since we are dealing with a smooth, unconstrained optimization in (4.22), we can also try to apply a black-box algorithm, which only needs information about the gradients and the function values. A very popular algorithm is the limited memory BFGS quasi-Newton method (Byrd et al. Reference Byrd, Lu, Nocedal and Zhu1995, Zhu, Byrd, Lu and Nocedal Reference Zhu, Byrd, Lu and Nocedal1997, Morales and Nocedal Reference Morales and Nocedal2011). We applied a  $1$-memory variant of the l-BFGS algorithmFootnote 7 to the Moreau–Yosida regularization of the dual ROF model and supplied the algorithm with function values (4.22) (using the correct values of
  $\hat{p}$) and gradients (4.24). The idea of using variable metric approaches to the Moreau–Yosida regularization of the operator has been investigated in many papers (Bonnans, Gilbert, Lemaréchal and Sagastizábal Reference Bonnans, Gilbert, Lemaréchal and Sagastizábal1995, Burke and Qian Reference Burke and Qian1999, Reference Burke and Qian2000) and can lead to very fast convergence under simple smoothness assumptions. However, it is not always suitable or easily implementable for many of the problems we address in this paper.
The plot in Figure 4.3 represents the decay of the primal–dual gap (which bounds the energy and the  $\ell _{2}$-error) obtained from gradient descent (GD), accelerated gradient descent (AGD) and the limited memory BFGS quasi-Newton method (l-BFGS). It appears that the energy actually decreases faster for the accelerated method and the quasi-Newton method, with no clear advantage of one over the other (the first being of course simpler to implement). Also observe that both AGD and l-BFGS are only slightly faster than the lower bound
  $O(1/k^{2})$ for smooth convex optimization. This shows that the dual ROF model is already quite a hard optimization problem. We should mention here that the idea of applying quasi-Newton methods to a regularized function as in this example has been recently extended to improve the convergence of some of the methods introduced later in this paper, namely the forward–backward and Douglas–Rachford splittings, with very interesting results: see Patrinos, Stella and Bemporad (Reference Patrinos, Stella and Bemporad2014) and Stella, Themelis and Patrinos (Reference Stella, Themelis and Patrinos2016).
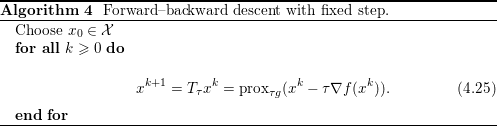
4.7 Forward–backward splitting
We can write problem (4.16) in the general form
 $$\begin{eqnarray}\min _{x\in {\mathcal{X}}}F(x):=f(x)+g(x),\end{eqnarray}$$
 where  $g$ is, as before, a ‘simple’ convex l.s.c. function and
  $f$ is a convex function with Lipschitz gradient. The basic idea of the forward–backward (FB) splitting scheme is to combine an explicit step of descent in the smooth part
  $f$ with a implicit step of descent in
  $g$. We thus introduce the operator
 $$\begin{eqnarray}\bar{x}\mapsto \hat{x}=T_{{\it\tau}}\bar{x}:=\text{prox}_{{\it\tau}g}(\bar{x}-{\it\tau}{\rm\nabla}f(\bar{x}))=(I+{\it\tau}\partial g)^{-1}(\bar{x}-{\it\tau}{\rm\nabla}f(\bar{x})).\end{eqnarray}$$
 Another name found in the literature (Nesterov Reference Nesterov2013) is ‘composite gradient’ descent, as one may see  $(\hat{x}-\bar{x})/{\it\tau}$ as a generalized gradient for
  $F$ at
  $\bar{x}$ (in particular, note the analogy with (4.6)). The essential reason justifying this is that a fixed point
  $\hat{x}=\bar{x}$ will clearly satisfy the stationary condition
 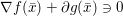 ${\rm\nabla}f(\bar{x})+\partial g(\bar{x})\ni 0$ of (4.26). Observe that in the particular case where
  $g={\it\delta}_{C}$ is the characteristic function of a closed, convex set
  $C$, then
  $\text{prox}_{{\it\tau}g}(x)$ reduces to
  ${\rm\Pi}_{C}(x)$ (the orthogonal projection onto
  $C$) and the mapping
  $T_{{\it\tau}}$ defines a projected gradient descent method (Goldstein Reference Goldstein1964). See Algorithm 4.
The theoretical convergence rate of plain FB splitting descent is not very good, as one can simply show the same as for gradient descent.
Theorem 4.9. Let  $x^{0}\in {\mathcal{X}}$ and
  $x^{k}$ be recursively defined by (4.25), with
  ${\it\tau}\leq 1/L$. Then not only does
  $x^{k}$ converge to a minimizer but we have the rates
 $$\begin{eqnarray}F(x^{k})-F(x^{\ast })\leq \displaystyle \frac{1}{2{\it\tau}k}\Vert x^{\ast }-x^{0}\Vert ^{2},\end{eqnarray}$$
 where  $x^{\ast }$ is any minimizer of
  $f$. If in addition
  $f$ or
  $g$ is strongly convex with parameters
  ${\it\mu}_{f},{\it\mu}_{g}$ (with
 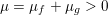 ${\it\mu}={\it\mu}_{f}+{\it\mu}_{g}>0$), we have
 $$\begin{eqnarray}F(x^{k})-F(x^{\ast })+\displaystyle \frac{1+{\it\tau}{\it\mu}_{g}}{2{\it\tau}}\Vert x^{k}-x^{\ast }\Vert ^{2}\leq {\it\omega}^{k}\displaystyle \frac{1+{\it\tau}{\it\mu}_{g}}{2{\it\tau}}\Vert x^{0}-x^{\ast }\Vert ^{2},\end{eqnarray}$$
 where  ${\it\omega}=(1-{\it\tau}{\it\mu}_{f})/(1+{\it\tau}{\it\mu}_{g})$.
However, its behaviour is improved if the objective is smoother than actually known. Moreover, it is fairly robust to perturbations and can be over-relaxed; see in particular Combettes and Wajs (Reference Combettes and Wajs2005).
An ‘optimal’ accelerated version, generalizing Theorem 4.5, is also available for this method. This is introduced in Nesterov (Reference Nesterov2004) (for projected gradient descent). In the case  ${\it\mu}={\it\mu}_{f}+{\it\mu}_{g}=0$, a more general algorithm, popularized under the name ‘FISTA’, is proposed in Beck and Teboulle (Reference Beck and Teboulle2009). The algorithm we present here unifies these approaches. The general iteration takes the form shown in Algorithm 5.

In (4.35), we can assume  $L>{\it\mu}_{f}$, and hence
  ${\it\tau}{\it\mu}_{f}<1$; otherwise
  $f$ is quadratic and the problem is trivial. We have the following result, which unifies Nesterov (Reference Nesterov2004) and Beck and Teboulle (Reference Beck and Teboulle2009). See also Nesterov (Reference Nesterov2005, Reference Nesterov2013) and Tseng (Reference Tseng2008) for more general variants that enjoy the same convergence rates.
Theorem 4.10. Assume  $t_{0}=0$ and let
  $x^{k}$ be generated by the algorithm, in either case
  ${\it\mu}=0$ or
  ${\it\mu}>0$. Then we have the decay rate
 $$\begin{eqnarray}F(x^{k})-F(x^{\ast })\leq \min \biggl\{(1+\sqrt{q})(1-\sqrt{q})^{k},\displaystyle \frac{4}{(k+1)^{2}}\biggr\}\displaystyle \frac{1+{\it\tau}{\it\mu}_{g}}{2{\it\tau}}\Vert x^{0}-x^{\ast }\Vert ^{2}.\end{eqnarray}$$
 It must be mentioned that for  ${\it\mu}=0$, a classical choice for
  $t_{k}$ is also
  $t_{k}=(k+1)/2$, which gives essentially the same rate. Variants of this choice which ensure, in addition, convergence of the iterates
  $(x_{k})_{k}$ to a solution, are discussed in Chambolle and Dossal (Reference Chambolle and Dossal2015). An important issue is the stability of these rates when the proximal operators can only be evaluated approximately: the situation here is worse than for the non-accelerated algorithm. Several papers address this issue and derive the corresponding rates, for example Schmidt, Roux and Bach (Reference Schmidt, Roux, Bach, Shawe-Taylor, Zemel, Bartlett, Pereira and Weinberger2011), Villa, Salzo, Baldassarre and Verri (Reference Villa, Salzo, Baldassarre and Verri2013) and Aujol and Dossal (Reference Aujol and Dossal2015); see also Güler (Reference Güler1992) and Salzo and Villa (Reference Salzo and Villa2012) for the backward step only, and d’Aspremont Reference d’Aspremont2008 in the smooth case. Naturally, a rate of convergence for the errors is required to obtain an improved global rate.
Proofs of both Theorems 4.9 and 4.10 are given in Appendix B, where more cases are discussed, including more possibilities for the choice of the parameters. They rely on the following essential but straightforward descent rule.Footnote 8 Let  $\hat{x}=T_{{\it\tau}}\bar{x}$. Then, for all
  $x\in {\mathcal{X}}$,
 $$\begin{eqnarray}\displaystyle & & \displaystyle F(x)+(1-{\it\tau}{\it\mu}_{f})\displaystyle \frac{\Vert x-\bar{x}\Vert ^{2}}{2{\it\tau}}\nonumber\\ \displaystyle & & \displaystyle \qquad \geq \displaystyle \frac{1-{\it\tau}L}{{\it\tau}}\displaystyle \frac{\Vert \hat{x}-\bar{x}\Vert ^{2}}{2}+F(\hat{x})+(1+{\it\tau}{\it\mu}_{g})\displaystyle \frac{\Vert x-\hat{x}\Vert ^{2}}{2{\it\tau}}.\end{eqnarray}$$
 In particular, if  ${\it\tau}L\leq 1$,
 $$\begin{eqnarray}F(x)+(1-{\it\tau}{\it\mu}_{f})\displaystyle \frac{\Vert x-\bar{x}\Vert ^{2}}{2{\it\tau}}\geq F(\hat{x})+(1+{\it\tau}{\it\mu}_{g})\displaystyle \frac{\Vert x-\hat{x}\Vert ^{2}}{2{\it\tau}}.\end{eqnarray}$$
 The proof is elementary, especially if we follow the lines of the presentation in Tseng (Reference Tseng2008), in a more general setting. By definition,  $\hat{x}$ is the minimizer of the
  $({\it\mu}_{g}+(1/{\it\tau}))$-strongly convex function
 $$\begin{eqnarray}x\mapsto g(x)+f(\bar{x})+\langle {\rm\nabla}f(\bar{x}),x-\bar{x}\rangle +\displaystyle \frac{\Vert x-\bar{x}\Vert ^{2}}{2{\it\tau}}.\end{eqnarray}$$
 It follows that for all  $x$ (see (3.7))
 $$\begin{eqnarray}\displaystyle F(x) & + & \displaystyle (1-{\it\tau}{\it\mu}_{f})\displaystyle \frac{\Vert x-\bar{x}\Vert ^{2}}{2{\it\tau}}\nonumber\\ \displaystyle & \geq & \displaystyle g(x)+f(\bar{x})+\langle {\rm\nabla}f(\bar{x}),x-\bar{x}\rangle +\displaystyle \frac{\Vert x-\bar{x}\Vert ^{2}}{2{\it\tau}}\nonumber\\ \displaystyle & \geq & \displaystyle g(\hat{x})+f(\bar{x})+\langle {\rm\nabla}f(\bar{x}),\hat{x}-\bar{x}\rangle +\displaystyle \frac{\Vert \hat{x}-\bar{x}\Vert ^{2}}{2{\it\tau}}+(1+{\it\tau}{\it\mu}_{g})\displaystyle \frac{\Vert x-\hat{x}\Vert ^{2}}{2{\it\tau}}.\nonumber\end{eqnarray}$$
 But since  ${\rm\nabla}f$ is
  $L$-Lipschitz,
  $f(\bar{x})+\langle {\rm\nabla}f(\bar{x}),\hat{x}-\bar{x}\rangle \geq f(\hat{x})-(L/2)\Vert \hat{x}-\bar{x}\Vert ^{2}$, so equation (4.36) follows.
Remark 4.11. One can more precisely deduce from this computation that
 $$\begin{eqnarray}\displaystyle & & \displaystyle F(x)+(1-{\it\tau}{\it\mu}_{f})\displaystyle \frac{\Vert x-\bar{x}\Vert ^{2}}{2{\it\tau}}\nonumber\\ \displaystyle & & \displaystyle \qquad \geq F(\hat{x})+(1+{\it\tau}{\it\mu}_{g})\displaystyle \frac{\Vert x-\hat{x}\Vert ^{2}}{2{\it\tau}}+\biggl(\displaystyle \frac{\Vert \hat{x}-\bar{x}\Vert ^{2}}{2{\it\tau}}-D_{f}(\hat{x},\bar{x})\biggr),\end{eqnarray}$$
 where  $D_{f}(x,y):=f(x)-f(y)-\langle {\rm\nabla}f(y),x-y\rangle \leq (L/2)\Vert x-y\Vert ^{2}$ is the ‘Bregman
  $f$-distance’ from
  $y$ to
  $x$ (Bregman Reference Bregman1967). In particular, (4.37) holds once
 $$\begin{eqnarray}D_{f}(\hat{x},\bar{x})\leq \displaystyle \frac{\Vert \hat{x}-\bar{x}\Vert ^{2}}{2{\it\tau}},\end{eqnarray}$$
 which is always true if  ${\it\tau}\leq 1/L$ but might also occur in other situations, and in particular, be tested ‘on the fly’ during the iterations. This allows us to implement efficient backtracking strategies of the type of Armijo (Reference Armijo1966) (see Nesterov Reference Nesterov1983, Nesterov Reference Nesterov2013, Beck and Teboulle Reference Beck and Teboulle2009) for the algorithms described in this section when the Lipschitz constant of
  $f$ is not a priori known.
Remark 4.12. Observe that if  $X\subset {\mathcal{X}}$ is a closed convex set containing the domain of
  $F$, and on which the projection
  ${\rm\Pi}_{X}$ can be computed, then the same inequality (4.37) holds if
  $\hat{x}=T_{{\it\tau}}{\rm\Pi}_{X}\bar{x}$ (requiring only that
  ${\rm\nabla}f$ is Lipschitz on
  $X$), provided
  $x\in X$; see Bonettini, Porta and Ruggiero (Reference Bonettini, Porta and Ruggiero2015). This means that the same rates are valid if we replace (4.30) with
 $$\begin{eqnarray}y^{k}={\rm\Pi}_{X}(x^{k}+{\it\beta}_{k}(x^{k}-x^{k-1})),\end{eqnarray}$$
 which is feasible if  $X$ is the domain of
  $F$.
$F$.
Discussion
The idea of forward–backward splitting is very natural, and appears in many papers in optimization for imaging: it would not be possible to mention all the related literature. Historically, it is a generalization of projected gradient descent, which dates back at least to Goldstein (Reference Goldstein1964) (see Passty Reference Passty1979, Lions and Mercier Reference Lions and Mercier1979, Fukushima and Mine Reference Fukushima and Mine1981). For minimization problems, it can be viewed as successive minimizations of a parabolic upper bound of the smooth part added to the non-smooth part. It has been generalized, and popularized in the imaging community by Combettes and Wajs (Reference Combettes and Wajs2005), yet a few particular forms were already well known, such as iterative soft-thresholding for the Lasso problem (Daubechies et al. Reference Daubechies, Defrise and De Mol2004). It is not always obvious how to choose parameters correctly when they are unknown. Several backtracking techniques will work, such as those of Nesterov (Reference Nesterov2013), for both the Lipschitz constants and strong convexity parameters; see also Nesterov (Reference Nesterov1983), Beck and Teboulle (Reference Beck and Teboulle2009) and Bonettini et al. (Reference Bonettini, Porta and Ruggiero2015) for estimates of the Lipschitz constant.
For simpler problems such as Lasso (2.2), convergence of the iterates (more precisely of  $Ax^{k}$) yields that after some time (generally unknown), the support
  $\{i:x_{i}^{\ast }=0\}$ of the solution
  $x^{\ast }$ should be detected by the algorithm (under ‘generic’ conditions). In that case, the objective which is solved becomes smoother than during the first iterations, and some authors have succeeded in exploiting this ‘partial smoothness’ to show better (linear) convergence of the FB descent (Bredies and Lorenz Reference Bredies and Lorenz2008, Grasmair, Haltmeier and Scherzer Reference Grasmair, Haltmeier and Scherzer2011, Liang, Fadili and Peyré Reference Liang, Fadili and Peyré2014, Tao, Boley and Zhang Reference Tao, Boley and Zhang2015). Liang, Fadili and Peyré (Reference Liang, Fadili and Peyré2015) have extended this approach to the abstract setting of Appendix A, so that this remark also holds for some of the saddle-point-type algorithms introduced in Section 5 below.
Another interesting and alternative approach to convergence rates is to use the ‘Kurdyka–Łojasiewicz’ (KL) inequality, which in practice will bound a function of the distance of a point to the critical set by the norm of the (sub)gradient. As shown by Bolte, Daniilidis and Lewis (Reference Bolte, Daniilidis and Lewis2006), such a property will hold for ‘most’ of the functions optimized in practice, including non-smooth functions, and this can lead to improved convergence rates for many algorithms (Attouch, Bolte and Svaiter Reference Attouch, Bolte and Svaiter2013). It is also possible to derive accelerated schemes for problems with different types of smoothness (such as Hölder-continuous gradients); see Nesterov (Reference Nesterov2015).
Finally, a heuristic technique which often works to improve the convergence rate, when the objective is smoother than actually known, consists simply in ‘restarting’ the method after a certain number of iterations: in Algorithm 5 (for  ${\it\mu}=0$), we start with a new sequence
  $(t_{k})_{k}$ letting
  $t_{\bar{k}}=1$ for some sufficiently large
  $\bar{k}$. Ideally, we should restart when we are sure that the distance of
  $x^{\bar{k}}$ to the optimum
  $x^{\ast }$ (unique if the objective is strongly convex) has shrunk by a given, sufficiently small factor (but the corresponding value
  $\bar{k}$ depends on the strong convexity parameter). There is a simple way to implement such a scheme while still keeping the global
  $O(1/k^{2})$ rate (it consists in adapting the idea of the ‘Monotone FISTA’ scheme: see Remark B.3). A rigorous justification of a restarting scheme is discussed in O’Donoghue and Candès (Reference O’Donoghue and Candès2015).
4.8 Extensions and variants
4.8.1 Mirror descent
A natural extension of the proximal descent methods consists in replacing the function  $(2{\it\tau})^{-1}\Vert y-x\Vert ^{2}$ in (3.6) with other distances between
  $y$ and
  $x$. There can be several good reasons for this.
∙ One may wish to use a (smooth) distance
$d(y,x)$ which blows up when $y$ reaches the boundary of certain constraints. This is the principle of barriers and penalty functions.∙ The proximity operator of a function is not easily computable with the squared Euclidean distance but it is simple in some non-linear metrics.
∙ The ambient space
${\mathcal{X}}$ is neither a Hilbert space nor a Euclidean space, and we need to optimize a function whose gradient is Lipschitz with respect to some non-Hilbert space norm.


The ‘mirror’ descent algorithm was introduced by Nemirovski and Yudin (Reference Nemirovski and Yudin1983) as a tool for optimization in Banach spaces. It requires the introduction of an auxiliary convex function  ${\it\psi}$ whose gradient will act as a map between the space
  ${\mathcal{X}}$ and its dual
  ${\mathcal{X}}^{\prime }$. In the Hilbert space case,
  ${\it\psi}(x)=\Vert x\Vert ^{2}/2$ is the most natural choice, but there might be reasons to use other choices (whereas in Banach spaces it is not natural at all). The basic idea is to replace the gradient descent iteration (4.1) with
 $$\begin{eqnarray}{\rm\nabla}{\it\psi}(x^{k+1})={\rm\nabla}{\it\psi}(x^{k})-{\it\tau}{\rm\nabla}f(x^{k}).\end{eqnarray}$$
 If we introduce the Bregman  ${\it\psi}$-distance
 $$\begin{eqnarray}D_{{\it\psi}}(x,y)={\it\psi}(x)-{\it\psi}(y)-\langle {\rm\nabla}{\it\psi}(y),x-y\rangle ,\end{eqnarray}$$
 we readily see that it is equivalent to defining  $x^{k+1}$ as a point which minimizes
 $$\begin{eqnarray}\min _{x}\displaystyle \frac{1}{{\it\tau}}D_{{\it\psi}}(x,x^{k})+f(x^{k})+\langle {\rm\nabla}f(x^{k}),x-x^{k}\rangle ,\end{eqnarray}$$
 that is, we find  $x^{k+1}$ by minimizing the linear approximation of
  $f$ at
  $x^{k}$ with some penalization of the distance between the two points. The natural ‘mirror prox’ alternative will consist in solving iteratively, if possible,
 $$\begin{eqnarray}\min _{x}\displaystyle \frac{1}{{\it\tau}}D_{{\it\psi}}(x,x^{k})+f(x)\end{eqnarray}$$
 and defining  $x^{k+1}$ to be the solution. In general it is required that
  ${\it\psi}$ be smooth and strongly convex with respect to the norm of the space
  ${\mathcal{X}}$, which is not necessarily Euclidean or Hilbertian. Convergence of these algorithms under various conditions on
  ${\it\psi}$ are studied in a few important papers; see in particular the papers of Eckstein (Reference Eckstein1993), Teboulle (Reference Teboulle1992), Chen and Teboulle (Reference Chen and Teboulle1993), Kiwiel (Reference Kiwiel1997), Beck and Teboulle (Reference Beck and Teboulle2003) and Auslender and Teboulle (Reference Auslender and Teboulle2004). The extensive monograph by Ben-Tal and Nemirovski (Reference Ben-Tal and Nemirovski2001)Footnote 9 presents many possible variants, with rates.
An important remark is that a non-linear variant of (4.37) is as easy to show in the non-linear case, since if  $\hat{x}$ is the minimizer of
 $$\begin{eqnarray}\min _{x}\displaystyle \frac{1}{{\it\tau}}D_{{\it\psi}}(x,\bar{x})+f(x)\end{eqnarray}$$
 for some  $f$ and admissible
  ${\it\psi}$, it satisfies
 $$\begin{eqnarray}{\rm\nabla}{\it\psi}(\hat{x})-{\rm\nabla}{\it\psi}(\bar{x})+\partial f(\hat{x})\ni 0,\end{eqnarray}$$
 from which we deduce from simple computations that for any  $x\in {\mathcal{X}}$,
 $$\begin{eqnarray}\displaystyle \frac{1}{{\it\tau}}D_{{\it\psi}}(x,\bar{x})+f(x)\geq \displaystyle \frac{1}{{\it\tau}}D_{{\it\psi}}(\hat{x},\bar{x})+f(\hat{x})+\displaystyle \frac{1}{{\it\tau}}D_{{\it\psi}}(x,\hat{x}).\end{eqnarray}$$
It is relatively easy to deduce basic rates of convergence for the mirror and mirror prox schemes from this inequality, in the same way as for the Hilbertian FB splitting.
Quite naturally, this can be generalized to the full forward–backward splitting, where now the problem is of the form (4.26), and the point  $\hat{x}$ is obtained from
  $\bar{x}$ by solving
 $$\begin{eqnarray}\min _{x\in {\mathcal{X}}}\displaystyle \frac{1}{{\it\tau}}D_{{\it\psi}}(x,\hat{x})+\langle {\rm\nabla}f(\bar{x}),x\rangle +g(x).\end{eqnarray}$$
 A non-linear analogue of (4.37) will easily follow from (4.41) and the Lipschitz property of  ${\rm\nabla}f$, which reads
 $$\begin{eqnarray}\Vert {\rm\nabla}f(x)-{\rm\nabla}f(y)\Vert _{\ast }\leq L\Vert x-y\Vert \quad \text{for all}~x,y\in {\mathcal{X}},\end{eqnarray}$$
 where  $\Vert \cdot \Vert _{\ast }$ is the norm in
  ${\mathcal{X}}^{\prime }$ induced by the norm
  $\Vert \cdot \Vert$ of
  ${\mathcal{X}}$, with respect to which
  ${\it\psi}$ is strongly convex. The simple FB descent method (using
  $\bar{x}=x^{k}$,
  $x^{k+1}=\hat{x}$) will then converge with essentially the same rate (but constants which depend on the new distance
  $D_{{\it\psi}}$); see Tseng (Reference Tseng2008) for details. More interesting is the fact that, again, Tseng (Reference Tseng2008) has also introduced accelerated variants which reach a convergence rate in
  $O(1/k^{2})$, as before (see also Allen-Zhu and Orecchia Reference Allen-Zhu and Orecchia2014). A different way to introduce barriers and non-linearities for solving (4.26) by smoothing is proposed in Nesterov (Reference Nesterov2005), where another
  $O(1/k^{2})$ algorithm is introduced.
The idea of considering non-linear proximity operator is not purely formal and can be useful. The most classical example is the case of optimization over the unit simplex
 $$\begin{eqnarray}\biggl\{x\in \mathbb{R}_{+}^{n}:\mathop{\sum }_{i=1}^{n}x_{i}=1\biggr\}.\end{eqnarray}$$
Then it is known (Teboulle Reference Teboulle1992, Beck and Teboulle Reference Beck and Teboulle2003) that the entropy
 $$\begin{eqnarray}{\it\psi}(x):=\mathop{\sum }_{i=1}^{n}x_{i}\ln x_{i}\quad (\text{and }{\rm\nabla}{\it\psi}(x)=(1+\ln x_{i})_{i=1}^{n})\end{eqnarray}$$
 is  $1$-strongly convex with respect to the
  $\ell _{1}$-normFootnote 10
 $$\begin{eqnarray}\Vert x\Vert _{1}=\mathop{\sum }_{i}|x_{i}|.\end{eqnarray}$$
In this case, the (constrained) mirror step takes the form
 $$\begin{eqnarray}\min _{\mathop{\sum }_{i}x_{i}=1}\langle p,x\rangle +\displaystyle \frac{1}{{\it\tau}}D_{{\it\psi}}(x,\bar{x})\end{eqnarray}$$
 and the solution  $\hat{x}$ satisfies
 $$\begin{eqnarray}\ln \hat{x}_{i}=\ln \bar{x}_{i}-{\it\tau}p_{i}+{\it\lambda},\end{eqnarray}$$
 where  ${\it\lambda}$ is a Lagrange multiplier for the constraint
  $\sum _{i}x_{i}=1$. We obtain that, for
  $i=1,\ldots ,n$,
 $$\begin{eqnarray}\hat{x}_{i}=\displaystyle \frac{\text{e}^{-{\it\tau}p_{i}}}{\mathop{\sum }_{j=1}^{n}\bar{x}_{j}\,\text{e}^{-{\it\tau}p_{j}}}\bar{x}_{i}.\end{eqnarray}$$
 There might be two advantages: one is that we do not have to project back onto the simplex (although this projection is very cheap), the other is that the parameters of the problem in the  $\ell _{1}$-norm (such as the Lipschitz constant of the smooth part of the objective) might allow us to take a larger time step or yield better constants in the estimates for the rates (Beck and Teboulle Reference Beck and Teboulle2003).
Non-linear smoothing or mirror descent is also useful for solving optimal transportation problems; for applications in imaging see Benamou et al. (Reference Benamou, Carlier, Cuturi, Nenna and Peyré2015) and Ferradans, Papadakis, Peyré and Aujol (Reference Ferradans, Papadakis, Peyré and Aujol2014).
4.8.2 Inertial and over-relaxed algorithms
The accelerated methods described in Theorems 4.5 and 4.10 are based on a particular example of ‘overshooting’, where the new point is obtained by applying an operator to the old point with a ‘momentum’ (here, a multiple of the difference between the two last iterates).
Gradient descent type methods can be accelerated in many similar ways. A very efficient method is the heavy ball (HB) method (Polyak Reference Polyak1987), which consists in iterating
 $$\begin{eqnarray}x^{k+1}=x^{k}+{\it\alpha}{\rm\nabla}f(x^{k})+{\it\beta}(x^{k}-x^{k-1}).\end{eqnarray}$$
 For strongly convex problems, that is, assuming  $\ell \,\text{Id}\leq {\rm\nabla}^{2}f\leq L\text{Id}$, this can be optimal: convergence is ensured for
  $0\leq {\it\beta}<1$ and
  $0<{\it\alpha}<2(1+{\it\beta})/L$, and the choices
  ${\it\beta}=q^{2}$, where
 $$\begin{eqnarray}q=\frac{1-\sqrt{\ell /L}}{1+\sqrt{\ell /L}},\quad {\it\alpha}=\frac{4}{(\sqrt{L}+\sqrt{\ell })^{2}}\end{eqnarray}$$
 yield the optimal rate  $\Vert x^{k+1}-x^{\ast }\Vert =O(q^{k})$ (Polyak Reference Polyak1987, Theorem 1).
The heavy ball method has been generalized to monotone operators by Alvarez and Attouch (Reference Alvarez and Attouch2001) (see also Alvarez Reference Alvarez2003, Moudafi and Oliny Reference Moudafi and Oliny2003), so there exist general convergence results that allow for non-smooth terms.
We should of course also mention the conjugate gradient descent method, which is of the same sort, except that the parameters  ${\it\alpha}$ and
  ${\it\beta}$ are updated dynamically at each iteration. Ideally we want to choose
  ${\it\alpha},{\it\beta}$ which solve
 $$\begin{eqnarray}\min _{{\it\alpha},{\it\beta}}f(x^{k}+{\it\alpha}{\rm\nabla}f(x^{k})+{\it\beta}(x^{k}-x^{k-1}))\end{eqnarray}$$
 (see Polyak Reference Polyak1987). For a quadratic function this problem is easily solved, and it is known that the descent method obtained minimizes the quadratic function exactly in  $\text{rank}A$ iterations, where
  $A={\rm\nabla}^{2}f$. It is the fastest method in this case (Polyak Reference Polyak1987); see the plot ‘CG’ in Figure 4.1. In practice, this method should be implemented on a sufficiently smooth problem when the cost of performing a line-search (which requires evaluations of the function) is not too large; as for non-quadratic problems, the optimal step cannot be computed in closed form.
A generalization of the HB algorithm to a strongly convex function given by the sum of a smooth, twice continuously differentiable function with Lipschitz-continuous gradient and a non-smooth function, with easily computed proximal map, was investigated for quadratic functions in Bioucas-Dias and Figueiredo (Reference Bioucas-Dias and Figueiredo2007) and for more general smooth functions in Ochs, Brox and Pock (Reference Ochs, Brox and Pock2015). It is of the form
 $$\begin{eqnarray}x^{k+1}=\text{prox}_{{\it\alpha}g}(x^{k}+{\it\alpha}{\rm\nabla}f(x^{k})+{\it\beta}(x^{k}-x^{k-1})).\end{eqnarray}$$
The proximal HB algorithm offers the same optimal convergence rate as the HB algorithm, but can be applied only if the smooth function is twice continuously differentiable. It is therefore very efficient; see Figure 4.4 below for a comparison of this method with other accelerated methods.
Another standard and simple way to speed up such algorithms consists in simply over-relaxing the iterates, that is, replacing  $x^{k+1}$ with the value
  $x^{k+1}+{\it\theta}(x^{k+1}-x^{k})$ such as in (4.8); this is not exactly the same as (4.30)–(4.31). Convergence is generally guaranteed as long as
  ${\it\theta}<1$; this has been studied in a very general setting by Combettes and Wajs (Reference Combettes and Wajs2005). The theoretical convergence rates are in general only slightly improved by such over-relaxations, but sometimes the empirical rates are much better. On the other hand, there do not seem to be many studies of over-relaxed accelerated algorithms, although a recent paper on the ‘FISTA’ method shows that it is actually possible and improves the convergence (Yamagishi and Yamada Reference Yamagishi and Yamada2011).
4.8.3 (Two) block(s) coordinate descent
It is obvious from the proof in Appendix B that any algorithm which ensures a descent rule such as (4.37) will enjoy the same convergence properties (Theorem 4.9) and can be accelerated by the same techniques as FB splitting. As a particular case, one can efficiently solve problems of the form
 $$\begin{eqnarray}\min _{x\in {\mathcal{X}}}f_{1}(x)+f_{2}(x)+\displaystyle \frac{1}{2}\Vert x-x_{0}\Vert ^{2}.\end{eqnarray}$$
Indeed, in its dual formulation, this problem can be written as
 $$\begin{eqnarray}\min _{y_{1},y_{2}}f_{1}^{\ast }(y_{1})+f_{2}^{\ast }(y_{2})+\displaystyle \frac{1}{2}\Vert y_{1}+y_{2}\Vert ^{2}-\langle y_{1}+y_{2},x_{0}\rangle ,\end{eqnarray}$$
 and if we minimize successively with respect to  $y_{1},y_{2}$, it turns out that we obtain a descent rule similar to (4.37).
Lemma 4.13. Given  $\bar{y}_{1},\bar{y}_{2}$, let
 $$\begin{eqnarray}\displaystyle & & \displaystyle {\hat{y}}_{2}=\arg \min _{y_{2}}f_{2}^{\ast }(y_{2})+\displaystyle \frac{1}{2}\Vert \bar{y}_{1}+y_{2}\Vert ^{2}-\langle \bar{y}_{1}+y_{2},x_{0}\rangle ,\nonumber\\ \displaystyle & & \displaystyle {\hat{y}}_{1}=\arg \min _{y_{1}}f_{1}^{\ast }(y_{1})+\displaystyle \frac{1}{2}\Vert y_{1}+{\hat{y}}_{2}\Vert ^{2}-\langle y_{1}+{\hat{y}}_{2},x_{0}\rangle .\nonumber\end{eqnarray}$$
 Then, for all  $(y_{1},y_{2})\in {\mathcal{X}}^{2}$, we have
 $$\begin{eqnarray}\displaystyle & & \displaystyle f_{1}^{\ast }(y_{1})+f_{2}^{\ast }(y_{2})+\displaystyle \frac{1}{2}\Vert y_{1}+y_{2}\Vert -\langle y_{1}+y_{2},x_{0}\rangle +\displaystyle \frac{1}{2}\Vert y_{1}-\bar{y}_{1}\Vert ^{2}\nonumber\\ \displaystyle & & \displaystyle \qquad \geq f_{1}^{\ast }({\hat{y}}_{1})+f_{2}^{\ast }({\hat{y}}_{2})+\displaystyle \frac{1}{2}\Vert {\hat{y}}_{1}+{\hat{y}}_{2}\Vert ^{2}-\langle {\hat{y}}_{1}+{\hat{y}}_{2},x_{0}\rangle +\displaystyle \frac{1}{2}\Vert y_{1}-{\hat{y}}_{1}\Vert ^{2}.\nonumber\end{eqnarray}$$
 This is even improved if either  $f_{1}^{\ast }$ or
  $f_{2}^{\ast }$ is strongly convex (equivalently, if at least one of the functions
  $f_{1}$ or
  $f_{2}$ has Lipschitz gradient). It clearly follows that the scheme of the proof of Theorem 4.10 will also work for this method: see Appendix B. The proof of the lemma is elementary. Moreover, we can observe that since
 $$\begin{eqnarray}\tilde{f}_{2}^{\ast }:y_{1}\mapsto \min _{y_{2}}f_{2}^{\ast }(y_{2})+\displaystyle \frac{1}{2}\Vert y_{1}+y_{2}\Vert ^{2}-\langle y_{1}+y_{2},x_{0}\rangle\end{eqnarray}$$
 is a convex function of  $y_{1}$ with
  $1$-Lipschitz gradient, the alternating minimization method is simply a forward–backward splitting applied to the problem
  $\min _{y_{1}}f_{1}^{\ast }(y_{1})+\tilde{f}_{2}^{\ast }(y_{1})$; see for instance Combettes and Pesquet (Reference Combettes and Pesquet2011, Example 10.11). Less elementary is the fact that this descent rule still holds if the exact minimizations are replaced with proximal (implicit descent) steps or if the quadratic part is linearized, which can be useful if it involves linear operators; see Chambolle and Pock (Reference Chambolle and Pock2015b) for details.
A particular case of this splitting is used in Section 7.8 to compute Figure 7.9; see the explanations there (Chambolle and Pock Reference Chambolle and Pock2015b, Kolmogorov, Pock and Rolinek Reference Kolmogorov, Pock and Rolinek2016). It can also be used to implement fast parallel solvers for the ROF problem (2.6): the idea is to split the dual variable into two groups, one ‘living’ on the ‘odd’ squares (or cubes in three dimensions), that is, the edges connecting the vertices  $(i,j)+\{0,1\}^{2}$,
  $i,j$ odd, and the other in the ‘even’ squares. Then one can use a dedicated solver to solve exactly or approximately the subproblem on each odd/even square, which are low-dimensional decoupled problems. This is particularly well adapted to implementation on GPUs; details can be found in Chambolle and Pock (Reference Chambolle and Pock2015b).
In general, block coordinate (or Gauss–Seidel) descent schemes can be implemented in many ways, and many generalizations involving non-smooth terms are proved to converge in the literature (Grippo and Sciandrone Reference Grippo and Sciandrone2000, Auslender Reference Auslender1976, Attouch et al. Reference Attouch, Bolte and Svaiter2013). As long as some energy decay is guaranteed,  $O(1/k)$ rates are easy to prove. In the context of this chapter, see in particular Beck and Tetruashvili (Reference Beck and Tetruashvili2013); see also Tseng (Reference Tseng2001), Tseng and Yun (Reference Tseng and Yun2009), Beck (Reference Beck2015), Chouzenoux, Pesquet and Repetti (Reference Chouzenoux, Pesquet and Repetti2016) and Nesterov (Reference Nesterov2012).
For more than two blocks, efficient methods can be developed in two different directions: sums of ‘simple’ objective can be dualized and their proximity operators then computed in parallel (Attouch, Briceño-Arias and Combettes Reference Attouch, Briceño-Arias and Combettes2009/10, Raguet, Fadili and Peyré Reference Raguet, Fadili and Peyré2013, Becker and Combettes Reference Becker and Combettes2014, Pustelnik, Chaux and Pesquet Reference Pustelnik, Chaux and Pesquet2011). Acceleration is then possible in this framework (Goldfarb and Ma Reference Goldfarb and Ma2012). On the other hand, randomized algorithms seem to be a very efficient alternative for tackling problems with a huge number of variables or blocks (Nesterov Reference Nesterov2012). In particular, whereas in the deterministic setting it is hard to implement acceleration techniques for problems involving more than two blocks, stochastic block descent methods will typically average out antisymmetric terms in the descent rules and lead to much nicer inequalities which can be exploited to derive very efficient methods (Lin, Lu and Xiao Reference Lin, Lu and Xiao2015). A few recent algorithms recover optimal rates (in particular when specialized to the one-block case) and allow for descent steps which are optimal for each block (Fercoq and Richtárik Reference Fercoq and Richtárik2015, Fercoq and Richtárik Reference Fercoq and Richtárik2013).
4.8.4 FBF splitting
In the context of maximal monotone operators, an important generalization of the FB splitting algorithm is due to Tseng (Reference Tseng2000). The standard FB splitting algorithm requires the forward operator to be co-coercive, for example the gradient of a smooth function. This clearly limits the applicability of the algorithm to more general problems. The following modification, called the forward–backward–forward (FBF) algorithm simply assumes that the forward monotone operator is single-valued and Lipschitz-continuous. It can therefore be applied, for example, if the forward operator is a skew-symmetric matrix. Let  $A$,
$A$,  $B$ be two maximal monotone operators with
  $A$ single-valued on
  $\text{dom}A\supset \text{dom}B$. The FBF algorithm is defined by the following scheme:
 $$\begin{eqnarray}\displaystyle x^{k+1/2} & = & \displaystyle (I+{\it\tau}_{k}B)^{-1}(I-{\it\tau}_{k}A)(x^{k}),\end{eqnarray}$$
 $$\begin{eqnarray}\displaystyle x^{k+1} & = & \displaystyle {\rm\Pi}_{{\mathcal{X}}}(x^{k+1/2}-{\it\tau}_{k}(A(x^{k+1/2})-A(x^{k}))),\end{eqnarray}$$
 where  ${\mathcal{X}}$ is a suitable non-empty set (e.g.
  $\mathbb{R}^{n}$) and
  ${\it\tau}_{k}$ is the largest number satisfying, for any
  ${\it\delta}\in (0,1)$,
 $$\begin{eqnarray}{\it\tau}_{k}\Vert A(x^{k+1/2})-A(x^{k})\Vert \leq {\it\delta}\Vert x^{k+1/2}-x^{k}\Vert ,\end{eqnarray}$$
which in practice can be determined by an Armijo-type backtracking procedure (Armijo Reference Armijo1966). An important application of this algorithm is to convex-concave saddle-point problems, which we will investigate in more detail in the next section.
4.9 Examples
We conclude this section by providing two examples. In the first example we consider minimizing the dual of the Huber-ROF problem, which is strongly convex and can therefore be minimized using accelerated proximal gradient descent for strongly convex problems. The second example uses the explicit representation of Moreau–Yosida regularization to transform the dual of an anisotropic variant of the ROF model into a form consisting of a smooth plus a non-smooth function, which can be tackled by accelerated forward–backward splitting.
Example 4.14 (minimizing the dual of Huber-ROF).
Let us revisit the dual of the Huber-ROF model introduced in (4.21):
 $$\begin{eqnarray}\min _{\mathbf{p}}\displaystyle \frac{1}{2}\Vert \text{D}^{\ast }\mathbf{p}-u^{\diamond }\Vert ^{2}+\displaystyle \frac{{\it\varepsilon}}{2{\it\lambda}}\Vert \mathbf{p}\Vert ^{2}+{\it\delta}_{\{\Vert \cdot \Vert _{2,\infty }\leq {\it\lambda}\}}(\mathbf{p}),\end{eqnarray}$$
 where  $u^{\diamond }$ is again the noisy image of size
  $m\times n$ from Example 2.1, and
  $\text{D}$ is the (two-dimensional) finite difference operator. This problem is the sum of a smooth function with Lipschitz-continuous gradient,
 $$\begin{eqnarray}f(\mathbf{p})=\displaystyle \frac{1}{2}\Vert \text{D}^{\ast }\mathbf{p}-u^{\diamond }\Vert ^{2},\end{eqnarray}$$
plus a non-smooth function with easily computed proximal map,
 $$\begin{eqnarray}g(\mathbf{p})=\displaystyle \frac{{\it\varepsilon}}{2{\it\lambda}}\Vert \mathbf{p}\Vert ^{2}+{\it\delta}_{\{\Vert \cdot \Vert _{2,\infty }\leq {\it\lambda}\}}(\mathbf{p}).\end{eqnarray}$$
The gradient of the smooth function is given by
 $$\begin{eqnarray}{\rm\nabla}f(\mathbf{p})=\text{D}(\text{D}^{\ast }\mathbf{p}-u^{\diamond }),\end{eqnarray}$$
 and its Lipschitz parameter is estimated again as  $L\leq 8$. The non-smooth function is strongly convex with parameter
  ${\it\mu}={\it\varepsilon}/{\it\lambda}$ and its pixelwise proximal map is given by
 $$\begin{eqnarray}\hat{\mathbf{p}}=\text{prox}_{{\it\tau}g}(\tilde{\mathbf{p}})\Leftrightarrow \hat{\mathbf{p}}_{i,j}=\displaystyle \frac{(1+{\it\tau}{\it\mu})^{-1}\,\tilde{\mathbf{p}}_{i,j}}{\max \{1,(1+{\it\tau}{\it\mu})^{-1}\,|\tilde{\mathbf{p}}_{i,j}|_{2}\}}\end{eqnarray}$$
 Let us now apply the Huber-ROF model to the image in Example 2.1 using the parameters  ${\it\lambda}=0.1$ and
  ${\it\varepsilon}=0.001$. We implemented the FISTA algorithm (Algorithm 5) using the extrapolation parameters corresponding to
  ${\it\mu}=0$ and the correct
  ${\it\mu}={\it\varepsilon}/{\it\lambda}$. For comparison, we also implemented the proximal heavy ball algorithm (4.43) and used the optimal parameter settings
 $$\begin{eqnarray}{\it\alpha}=\displaystyle \frac{4}{(\sqrt{{\it\mu}}+\sqrt{L+{\it\mu}})^{2}-4{\it\mu}},\quad {\it\beta}=\displaystyle \frac{(\sqrt{{\it\mu}}-\sqrt{L+{\it\mu}})^{2}}{(\sqrt{{\it\mu}}+\sqrt{L+{\it\mu}})^{2}-4{\it\mu}}.\end{eqnarray}$$
 Figure 4.4 shows that it is generally not a good idea to apply the classical FISTA algorithm using  ${\it\mu}=0$ to a strongly convex problem. On the other hand, applying the FISTA algorithm with the correct settings for the strong convexity, that is,
  ${\it\mu}={\it\varepsilon}/{\it\lambda}$, largely improves the convergence rate of the algorithm. Interestingly, it turns out that the proximal HB algorithm converges almost twice as fast as the FISTA algorithm (
 ${\it\omega}^{k}$ as opposed to
  ${\it\omega}^{2k}$ with
  $q=L/{\it\mu}_{g}$ and
  ${\it\omega}=(\sqrt{q}-1)/(\sqrt{q}+1)$). In fact the proximal HB algorithm seems to exactly obey the lower bound of first-order algorithms for the strongly convex problems presented in Theorem 4.14.
Convergence of accelerated proximal gradient descent methods for minimizing the dual Huber-ROF model using the image in Figure 2.1. Using the correct modulus of strong convexity ( ${\it\mu}={\it\varepsilon}/{\it\lambda}$), the FISTA algorithm performs much better than the FISTA algorithm, which does not take into account the correct value of
  ${\it\mu}$. Interestingly, a tuned proximal heavy ball (HB) algorithm that uses the correct value of
  ${\it\mu}$ clearly outperforms FISTA and seems to coincide with the lower bound of first-order methods.

Minimizing the dual ROF model applied to the image in Figure 2.1. This experiment shows that an accelerated proximal block descent algorithm (FISTA-chains) that exactly solves the ROF problem on horizontal and vertical chains significantly outperforms a standard accelerated proximal gradient descent (FISTA) implementation. (a) Comparison based on iterations, (b) comparison based on the CPU time.

Example 4.15 (total variation on chains).
We have already seen that when the smooth function is quadratic, the forward–backward algorithm is equivalent to a plain gradient method applied to Moreau–Yosida regularization. The aim of this example is to give a practical problem where such an equivalence does not hold. Consider again the dual of the ROF model:
 $$\begin{eqnarray}\min _{\mathbf{p}}\displaystyle \frac{1}{2}\Vert \text{D}^{\ast }\mathbf{p}-u^{\diamond }\Vert ^{2}+{\it\delta}_{\{\Vert \cdot \Vert _{\infty }\leq {\it\lambda}\}}(\mathbf{p}),\end{eqnarray}$$
 which differs slightly from our previous ROF problems by the choice of the norm constraining the dual variables. First, application of the adjoint of the finite difference operator to the dual variables  $\mathbf{p}=(p_{1},p_{2})$ can be decomposed via
 $$\begin{eqnarray}\text{D}^{\ast }\mathbf{p}=\mathop{\sum }_{d=1}^{2}\text{D}_{d}^{\ast }p_{d},\end{eqnarray}$$
 where  $\text{D}_{d}^{\ast }$ is the adjoint finite difference operator in the direction
  $d$. Second, by a change of variables
  $t_{d}=\text{D}_{d}^{\ast }p_{d}$ and using the property that the constraint on
  $\mathbf{p}$ is also decomposable, we can rewrite the problem in the equivalent form
 $$\begin{eqnarray}\min _{(t_{d})_{d=1}^{2}}\displaystyle \frac{1}{2}\Vert \mathop{\sum }_{d=1}^{2}t_{d}-u^{\diamond }\Vert ^{2}+\mathop{\sum }_{d=1}^{2}{\it\delta}_{C_{d}}(t_{d}),\end{eqnarray}$$
where
 $$\begin{eqnarray}C_{d}=\{t_{d}:t_{d}=\text{D}_{d}^{\ast }p_{d},\Vert p_{d}\Vert _{\infty }\leq {\it\lambda}\},\quad \text{for }d=1,2.\end{eqnarray}$$
 Hence, as shown in Section 4.8.3, this problem could be easily solved via accelerated alternating minimization in  $t_{d}$ if we were able to efficiently compute the proximal maps with respect to
  ${\it\delta}_{C_{d}}(t_{d})$. Moreover, we have shown that the (accelerated) alternating minimization corresponds to an (accelerated) forward–backward algorithm on the partial Moreau–Yosida regularization that is obtained by partially minimizing (4.47) with respect to one variable, hence corresponding to a non-trivial instance of the forward–backward algorithm. Observe that the characteristic functions of the sets
  $C_{d}$ are exactly the convex conjugates of the total variation in each dimension
  $d$, that is,
 $$\begin{eqnarray}{\it\delta}_{C_{d}}(t_{d})=\sup _{u}\langle u,t_{d}\rangle -{\it\lambda}\Vert \text{D}_{d}u\Vert _{1}.\end{eqnarray}$$
 In other words, if we were able to solve the proximal maps for one-dimensional total variation problems along chains, we could – thanks to Moreau’s identity – also efficiently solve the proximal maps for the functions  ${\it\delta}_{C_{d}}(t_{d})$.
As a matter of fact, there exist several direct algorithms that can solve one-dimensional ROF problems very efficiently, and hence the proximal maps for one-dimensional total variation. Some of the algorithms even work in linear time; see Davies and Kovac (Reference Davies and Kovac2001), Condat (Reference Condat2013a), Johnson (Reference Johnson2013) and Kolmogorov et al. (Reference Kolmogorov, Pock and Rolinek2016), and references therein.
Figure 4.5 presents a comparison between the convergence rates of accelerated block descent (FISTA-chains) applied to (4.47) and a standard implementation of FISTA applied to (4.46). To solve the one-dimensional total variation subproblems on chains we used the linear-time dynamic programming approach from Kolmogorov et al. (Reference Kolmogorov, Pock and Rolinek2016). Figure 4.5(a) shows that in terms of iterations, the accelerated block descent is about 10–20 times as fast. Clearly, one iteration of the accelerated block descent is computationally more expensive compared to one iteration of the standard implementation; in our C++ implementation, one iteration of standard FISTA was approximately three times as fast compared to the accelerated block descent. Yet overall the block splitting technique turns out to be more efficient for a given precision, as shown in Figure 4.5(b). Later, in Section 7.8, we will come back to a similar example and show how accelerated block descent can be used to solve large-scale stereo problems.
5 Saddle-point methods
In this section we will briefly describe the main optimization techniques for finding saddle points, which are commonly used for imaging problems. The goal of these approaches is, as before, to split a complex problem into simpler subproblems which are easy to solve – although depending on the structure and properties of the functions, one form might be more suitable than another. We will mostly concentrate on one type of algorithm known as the ‘primal–dual’ algorithm, ‘ADMM’, or ‘Douglas–Rachford splitting’ (see references below) in a Euclidean setting, although more complex splitting techniques can be useful (e.g. Tseng Reference Tseng2000), as well as descent with respect to non-linear metrics or in Banach spaces (Nemirovski Reference Nemirovski2004, Chambolle and Pock Reference Chambolle and Pock2015a). We will mention the simplest useful results. These have been generalized and improved in many ways; see in particular Davis (Reference Davis2015) and Davis and Yin (Reference Davis and Yin2014a,Reference Davis and Yinb) for an extensive study of convergence rates, Chen, Lan and Ouyang (Reference Chen, Lan and Ouyang2014a), Ouyang, Chen, Lan and Pasiliao (Reference Ouyang, Chen, Lan and Pasiliao2015) and Valkonen and Pock (Reference Valkonen and Pock2015) for optimal methods exploiting partial regularity of some objectives, and Fercoq and Bianchi (Reference Fercoq and Bianchi2015) for efficient stochastic approaches.
The natural order in which to present these algorithms should be to start with the Douglas–Rachford splitting (Douglas and Rachford Reference Douglas and Rachford1956; the modern form we will describe is found in Lions and Mercier Reference Lions and Mercier1979) and the ADMM, which have been used for a long time in non-smooth optimization. However, since the convergence results for primal–dual methods are in some sense much simpler and carry on to the other algorithms, we first start by describing these methods.
5.1 Primal–dual algorithms
The problems we consider here are in the ‘standard’ form (3.9)
 $$\begin{eqnarray}\min _{x\in {\mathcal{X}}}f(Kx)+g(x),\end{eqnarray}$$
 where  $f,g$ are convex, l.s.c. and ‘simple’, and
  $K:{\mathcal{X}}\rightarrow {\mathcal{Y}}$ is a bounded linear operator. When
  $f$ is smooth, FB splitting can be used efficiently for such a problem. In other situations we usually have to revert to Lagrangian techniques or primal–dual methods. This is the case for Examples 2.2 and 2.3 below, for example.
The idea is to write the problem as a saddle point as in (3.10):
 $$\begin{eqnarray}\max _{y}\inf _{x}\langle y,Kx\rangle -f^{\ast }(y)+g(x).\end{eqnarray}$$
 Then (this dates back to Arrow, Hurwicz and Uzawa Reference Arrow, Hurwicz and Uzawa1958), we alternate a (proximal) descent in the variable  $x$ and an ascent in the dual variable
  $y$:
$y$:
 $$\begin{eqnarray}\displaystyle & & \displaystyle x^{k+1}=\text{prox}_{{\it\tau}g}(x^{k}-{\it\tau}K^{\ast }y^{k}),\end{eqnarray}$$
 $$\begin{eqnarray}\displaystyle & & \displaystyle y^{k+1}=\text{prox}_{{\it\sigma}f^{\ast }}(y^{k}+{\it\sigma}Kx^{k+1}).\end{eqnarray}$$
 It is not clear that such iterations will converge. (We can easily convince ourselves that a totally explicit iteration, with  $x^{k+1}$ above replaced with
  $x^{k}$, will in general not converge.) However, this scheme was proposed in Zhu and Chan (Reference Zhu and Chan2008) for problem (2.6) and observed to be very efficient for this problem, especially when combined with an acceleration strategy consisting in decreasing
  ${\it\tau}$ and increasing
  ${\it\sigma}$ at each step (e.g., following the rules in Algorithm 8 below). Proofs of convergence for the Zhu–Chan method have been proposed by Esser, Zhang and Chan (Reference Esser, Zhang and Chan2010), Bonettini and Ruggiero (Reference Bonettini and Ruggiero2012) and He, You and Yuan (Reference He, You and Yuan2014). For a general problem there exist several strategies to modify these iterations into converging subsequences. Popov (Reference Popov1981) proposed incorporating a type of ‘extragradient’ strategy into these iterations, as introduced by Korpelevich (Reference Korpelevich1976, Reference Korpelevich1983): the idea is simply to replace
  $y^{k}$ with
 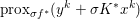 $\text{prox}_{{\it\sigma}f^{\ast }}(y^{k}+{\it\sigma}K^{\ast }x^{k})$ in (5.1). This makes the algorithm convergent; moreover, an
  $O(1/k)$ (ergodic) convergence rate is shown in Nemirovski (Reference Nemirovski2004) (for a class of schemes including this one, using also non-linear ‘mirror’ descent steps: see Section 4.8.1). A variant with similar properties, but not requiring us to compute an additional step at each iteration, was proposed at roughly the same time by Esser et al. (Reference Esser, Zhang and Chan2010) (who gave it the name ‘PDHG’Footnote 11), and Pock, Cremers, Bischof and Chambolle (Reference Pock, Cremers, Bischof and Chambolle2009). The iterations can be written as in Algorithm 6.

The over-relaxation step  $2x^{k+1}-x^{k}=x^{k+1}+(x^{k+1}-x^{k})$ can be interpreted as an approximate extragradient, and indeed it is possible to show convergence of this method with a rate which is the same as in Nemirovski (Reference Nemirovski2004) (see also Chambolle and Pock Reference Chambolle and Pock2011, Reference Chambolle and Pock2015a). On the other hand, this formula might recall similar relaxations present in other standard splitting algorithms such as the Douglas–Rachford splitting or the ADMM (see Sections 5.3 and 5.4 below), and indeed, we then see that this algorithm is merely a variant of these other methods, in a possibly degenerate metric. He et al. (Reference He, You and Yuan2014) observed that, letting
  $z=(x,y)$, the iterations above can be written as
 $$\begin{eqnarray}M(z^{k+1}-z^{k})+Tz^{k+1}\ni 0,\end{eqnarray}$$
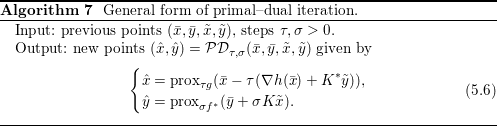
where  $T$ is the monotone operator in (3.15) and
  $M$ is the metric
 $$\begin{eqnarray}M=\left(\begin{array}{@{}cc@{}}{\textstyle \frac{1}{{\it\tau}}}I & -K^{\ast }\\ -K & {\textstyle \frac{1}{{\it\sigma}}}I\end{array}\right)\!,\end{eqnarray}$$
 which is positive definite if  ${\it\tau}{\it\sigma}\Vert K\Vert ^{2}<1$. Hence, in this form the primal–dual algorithm is simply a proximal-point algorithm applied to the monotone operator
  $T$, and standard convergence results or rates (Brézis and Lions Reference Brézis and Lions1978) can be deduced.
This can be extended to a slightly more general form. Assume that we want to minimize the problem
 $$\begin{eqnarray}\min _{x\in {\mathcal{X}}}f(Kx)+g(x)+h(x),\end{eqnarray}$$
 where  $f,g$ are convex, l.s.c. and ‘simple’,
  $K$ is a bounded linear operator and
  $h$ is convex with
  $L_{h}$-Lipschitz gradient term which we will treat explicitly. The primal–dual method for such a problem was suggested by Condat (Reference Condat2013b) and its convergence studied by Vũ (Reference Vũ2013a) and Boţ, Csetnek, Heinrich and Hendrich (Reference Boţ, Csetnek, Heinrich and Hendrich2015) (the latter papers dealing with more general monotone operators). Rates of convergence, including control of the primal–dual gap, are established in Chambolle and Pock (Reference Chambolle and Pock2015a) (a variant is studied in Drori, Sabach and Teboulle Reference Drori, Sabach and Teboulle2015), and a close (different) algorithm which mixes general monotone operators and subgradients and establishes similar rates is found in Davis and Yin (Reference Davis and Yin2015). The idea is simply to replace the descent step in
  $x$ with an FB splitting step, letting
 $$\begin{eqnarray}x^{k+1}=\text{prox}_{{\it\tau}g} (x^{k}-({\it\tau}K^{\ast }y^{k}+{\it\tau}{\rm\nabla}h(x^{k})).\end{eqnarray}$$
 Let us now write the algorithm in a general form, as in Algorithm 7. The first case (5.3)–(5.4) corresponds to iterations with fixed steps  ${\it\tau},{\it\sigma}$,
  $\bar{x}=x^{k}$,
  $\bar{y}={\tilde{y}}=y^{k}$,
  $\tilde{x}=2x^{k+1}-x^{k}$. In this case we have the following result, which also obviously applies to the PDHG method (5.3)–(5.4). Here we let
  $L=\Vert K\Vert$.
Theorem 5.1. Let  ${\it\tau},{\it\sigma}>0$ and
  $(x^{0},y^{0})\in {\mathcal{X}}\times {\mathcal{Y}}$ be given, and for
  $k\geq 0$ let
 $$\begin{eqnarray}(x^{k+1},y^{k+1})={\mathcal{P}}{\mathcal{D}}_{{\it\tau},{\it\sigma}}(x^{k},y^{k},2x^{k+1}-x^{k},y^{k}).\end{eqnarray}$$
Assume
 $$\begin{eqnarray}\biggl(\displaystyle \frac{1}{{\it\tau}}-L_{h}\biggr)\displaystyle \frac{1}{{\it\sigma}}\geq L^{2}.\end{eqnarray}$$
 Then, for any  $(x,y)\in {\mathcal{X}}\times {\mathcal{Y}}$, we have
 $$\begin{eqnarray}{\mathcal{L}}(X^{k},y)-{\mathcal{L}}(x,Y^{k})\leq \displaystyle \frac{{\textstyle \frac{1}{{\it\tau}}}\Vert x-x^{0}\Vert ^{2}+{\textstyle \frac{1}{{\it\sigma}}}\Vert y-y^{0}\Vert ^{2}}{k},\end{eqnarray}$$
whereFootnote 12
 $$\begin{eqnarray}X^{k}=\frac{1}{k}\mathop{\sum }_{i=1}^{k}x^{i},\quad Y^{k}=\frac{1}{k}\mathop{\sum }_{i=1}^{k}y^{i}.\end{eqnarray}$$
 Moreover, if the inequality is strict in (5.9), then  $(x^{k},y^{k})$ converge (weakly in infinite dimension) to a saddle point.
Proof. This is a particular case of Theorem 1, Remark 1 and Remark 3 in Chambolle and Pock (Reference Chambolle and Pock2015a). Under additional assumptions, one can derive a similar rate of convergence for the ‘true’ primal–dual gap  ${\mathcal{G}}(X^{k},Y^{k})$.◻
Note that this result says little, in general, about the ‘best’ choice of the parameters  ${\it\tau},{\it\sigma}$, and the empirical speed of convergence often depends a lot on this choice. Heuristic approaches have been proposed (which in general try to ensure that the primal and dual variables evolve at roughly the ‘same speed’); an efficient one, together with a backtracking strategy and convergence guarantees, is proposed in Goldstein et al. (Reference Goldstein, Li, Yuan, Esser and Baraniuk2015).
Acceleration
An interesting feature of these types of primal–dual iteration is the fact they can be ‘accelerated’, in cases when the objective function has more regularity. The first case is when  $g+h$ (or
  $f^{\ast }$) is strongly convex: see Algorithm 8. Observe that if
  $f^{\ast }$ is
  ${\it\mu}_{f}$-strongly convex, then
  $x\mapsto f(Kx)$ has
  $(L^{2}/{\it\mu}_{f})$-Lipschitz gradient, and it is natural to expect that one will be able to decrease the objective at rate
  $O(1/k^{2})$ as before. Similarly, we expect the same if
  $g$ or
  $h$ is strongly convex. This is the result we now state. We should assume here that
  $g$ is
  ${\it\mu}_{g}$-convex,
  $h$ is
  ${\it\mu}_{h}$-convex, and
  ${\it\mu}={\it\mu}_{g}+{\it\mu}_{h}>0$. However, in this case it is no different to assuming that
  $g$ is
  ${\it\mu}$-convex, as one can always replace
  $h$ with
  $h(x)-{\it\mu}_{h}\Vert x\Vert ^{2}/2$ (which is convex with
  $(L_{h}-{\it\mu}_{h})$-Lipschitz gradient
  ${\rm\nabla}h(x)-{\it\mu}_{h}x$), and
  $g$ with
  $g(x)+{\it\mu}_{h}\Vert x\Vert ^{2}/2$ (whose proximity operator is as easy to compute as
  $g$’s). For notational simplicity, we will thus restrict ourselves to this latter case – which is equivalent to the general case upon replacing
  ${\it\tau}$ with
 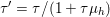 ${\it\tau}^{\prime }={\it\tau}/(1+{\it\tau}{\it\mu}_{h})$.
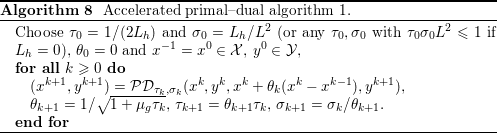
Theorem 5.2. Let  $(x^{k},y^{k})_{k\geq 0}$ be the iterations of Algorithm 8. For each
  $k\geq 1$, define
  $t_{k}={\it\sigma}_{k-1}/{\it\sigma}_{0}$,
  $T_{k}=\sum _{i=1}^{k}t_{i}$ and the averaged points
 $$\begin{eqnarray}(X^{k},Y^{k})=\displaystyle \frac{1}{T_{k}}\mathop{\sum }_{i=1}^{k}t_{i}(x^{i},y^{i}).\end{eqnarray}$$
 Then for any  $k\geq 1$ and any
  $(x,y)\in {\mathcal{X}}\times {\mathcal{Y}}$,
 $$\begin{eqnarray}T_{k}({\mathcal{L}}(X^{k},y)-{\mathcal{L}}(x,Y^{k}))+\displaystyle \frac{t_{k+1}^{2}}{2{\it\tau}_{0}}\Vert x^{k}-x\Vert ^{2}\leq \displaystyle \frac{1}{2{\it\tau}_{0}}\Vert x^{0}-x\Vert ^{2}+\displaystyle \frac{1}{2{\it\sigma}_{0}}\Vert y^{0}-y\Vert ^{2}.\end{eqnarray}$$
 One can then show that with this choice  $t_{k}\approx {\it\gamma}k/(4L_{f})$, so that also
  $1/T_{k}=O(1/k^{2})$ (see Chambolle and Pock Reference Chambolle and Pock2011). Under additional assumptions (for instance if
  $f$ has full domain, so that
  $f^{\ast }$ is superlinear), it follows a global
  $O(1/k^{2})$ estimate for the primal–dual gap
  ${\mathcal{G}}(X^{k},Y^{k})$, although with a constant which could be very large.
Proof. This is a particular case of Chambolle and Pock (Reference Chambolle and Pock2015a, Theorem 4).◻
Remark 5.3. We should mention here that the over-relaxation step above can also be performed in the  $y$ variable, therefore letting
 $$\begin{eqnarray}(x^{k+1},y^{k+1})={\mathcal{P}}{\mathcal{D}}_{{\it\tau}_{k},{\it\sigma}_{k}}(x^{k},y^{k},x^{k+1},y^{k}+{\it\theta}_{k}(y^{k}-y^{k-1})).\end{eqnarray}$$
The proof remains identical, but since it is not widely known we sketch it in Appendix C.2. It may seem to be quite a trivial remark, but in Section 5.3 we will see that it can be useful.
Now let us assume that  $f^{\ast }$ is also strongly convex with parameter
  ${\it\mu}_{f^{\ast }}=1/L_{f}$. Then an appropriate choice of the parameter
  ${\it\sigma},{\it\tau},{\it\theta}$ can yield a better (linear) convergence rate: see Algorithm 9. We give a particular choice of parameters for which such convergence occurs, but note that it is possible to show linear convergence with quite general over-relaxation parameters (but the global rate is strongly dependent on the parameter choice: for details see Chambolle and Pock Reference Chambolle and Pock2011 or Tan Reference Tan2016). Letting
 $$\begin{eqnarray}{\it\alpha}=\displaystyle \frac{{\it\mu}_{f^{\ast }}({\it\mu}_{g}+L_{h})}{2L^{2}}\biggl(\sqrt{1+4\displaystyle \frac{{\it\mu}_{g}L^{2}}{{\it\mu}_{f^{\ast }}({\it\mu}_{g}+L_{h})^{2}}}-1\biggr)\in (0,1),\end{eqnarray}$$
 a possible choice for  ${\it\tau},{\it\sigma},{\it\theta}$ is given by
 $$\begin{eqnarray}{\it\tau}=\displaystyle \frac{{\it\alpha}}{{\it\mu}_{g}(1-{\it\alpha})},\quad {\it\sigma}=\displaystyle \frac{{\it\alpha}}{{\it\mu}_{f^{\ast }}(1-{\it\alpha})},\quad {\it\theta}=1-{\it\alpha}\in (0,1).\end{eqnarray}$$
We can then show the following ergodic estimate.

Theorem 5.4. Let  $(x^{k},y^{k})_{k\geq 0}$ be the iterations of Algorithm 9. For each
  $k\geq 1$, define
  $t_{k}={\it\sigma}_{k-1}/{\it\sigma}_{0}$,
 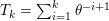 $T_{k}=\sum _{i=1}^{k}{\it\theta}^{-i+1}$ and the averaged points
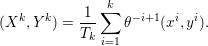 $$\begin{eqnarray}(X^{k},Y^{k})=\displaystyle \frac{1}{T_{k}}\mathop{\sum }_{i=1}^{k}{\it\theta}^{-i+1}(x^{i},y^{i}).\end{eqnarray}$$
 Then, for any  $k\geq 1$ and any
  $(x,y)\in {\mathcal{X}}\times {\mathcal{Y}}$,
 $$\begin{eqnarray}{\mathcal{L}}(X^{k},y)-{\mathcal{L}}(x,Y^{k})\leq \displaystyle \frac{1}{T_{k}}\biggl(\displaystyle \frac{1}{2{\it\tau}}\Vert x^{0}-x\Vert ^{2}+\displaystyle \frac{1}{2{\it\sigma}}\Vert y^{0}-y\Vert ^{2}\biggr).\end{eqnarray}$$
 Observe that  $1/T_{k}=O({\it\theta}^{k})$, so this is indeed a linear convergence rate.
Proof. See Chambolle and Pock (Reference Chambolle and Pock2015a, Theorem 5).◻
Preconditioning
As a quick remark, we mention here that it is not always obvious how to estimate the norm of the matrix  $L=\Vert K\Vert$ precisely and efficiently, without which we cannot choose parameters correctly. An interesting use of general preconditioners is suggested by Bredies and Sun (Reference Bredies and Sun2015a,Reference Bredies and Sunb) for the variants of the algorithm described in the next few sections. The main difficulty is that if the metric is changed,
  $f$ and
  $g$ might no longer be ‘simple’. A simpler approach is suggested in Pock and Chambolle (Reference Pock and Chambolle2011), for problems where a diagonal preconditioning does not alter the property that the proximal operators of
  $f$ and
  $g$ are easy to compute. Let us briefly describe a variant which is very simple and allows for a large choice of diagonal preconditioners. If we assume
  $h=0$, then the PDHG algorithm of Theorem 5.1 can be written equivalently as a proximal-point iteration such as (5.5) (He et al. Reference He, You and Yuan2014). Changing the metric means replacing
  $M$ in (5.7) with
 $$\begin{eqnarray}M^{\prime }=\left(\begin{array}{@{}cc@{}}T^{-1} & -K^{\ast }\\ -K & {\rm\Sigma}^{-1}\end{array}\right)\!,\end{eqnarray}$$
 where  $T$ and
  ${\rm\Sigma}$ are positive definite symmetric matrices. This means that the prox operators in iteration (5.6) must be computed in the new metrics
  $T^{-1}$ and
  ${\rm\Sigma}^{-1}$: in other words, the points
  $(\hat{x},{\hat{y}})$ are replaced with the solutions of
 $$\begin{eqnarray}\min _{x}\displaystyle \frac{1}{2}\Vert x-\bar{x}\Vert _{T^{-1}}^{2}+\langle {\tilde{y}},Kx\rangle +g(x),\quad \min _{y}\displaystyle \frac{1}{2}\Vert y-\bar{y}\Vert _{{\rm\Sigma}^{-1}}^{2}-\langle y,K\tilde{x}\rangle +f^{\ast }(y).\end{eqnarray}$$
 Using a diagonal preconditioning means that we also require  $T$ and
  ${\rm\Sigma}$ to be diagonal. The reason to impose this is that in many cases the proximity operators of
  $f$ and
  $g$ will remain simple in such metrics, and might become intractable in more general metrics. We should mention here that Becker and Fadili (Reference Becker and Fadili2012) have shown that, in problems with separable simple functions, one can in fact use preconditioners that are diagonal+rank one, without altering the simplicity of the functions. These authors use this remark to build quasi-Newton descent schemes, but it might also be interesting in a primal–dual framework.
A necessary condition for the algorithm to be well posed (which is then sufficient for convergence, as shown in Theorem 5.1), is that  $M^{\prime }$ is positive (semi-)definite. An elementary computation shows that it is equivalent to the requirement
 $$\begin{eqnarray}\Vert {\rm\Sigma}^{1/2}KT^{1/2}\Vert \leq 1.\end{eqnarray}$$
 The following strategy, which extends the choice in Pock and Chambolle (Reference Pock and Chambolle2011), allows us to design matrices  ${\rm\Sigma}$ and
  $T$ such that this holds. We assume here that
  ${\mathcal{X}}=\mathbb{R}^{n}$ and
  ${\mathcal{Y}}=\mathbb{R}^{m}$,
  $m,n\geq 1$, so
  $K$ is an
  $(m\times n)$-matrix.
Lemma 5.5. Let  $(\tilde{{\it\tau}}_{i})_{1\leq i\leq n}$ and
  $(\tilde{{\it\sigma}}_{j})_{1\leq j\leq m}$ be arbitrary positive numbers, and
  ${\it\alpha}\in [0,2]$. Then let
 $$\begin{eqnarray}T=\text{diag}(({\it\tau}_{i})_{i=1}^{n}),\quad {\rm\Sigma}=\text{diag}(({\it\sigma}_{j})_{j=1}^{m}),\end{eqnarray}$$
where
 $$\begin{eqnarray}{\it\tau}_{i}=\displaystyle \frac{\tilde{{\it\tau}}_{i}}{\mathop{\sum }_{j=1}^{m}\tilde{{\it\sigma}}_{j}|K_{j,i}|^{2-{\it\alpha}}},\quad {\it\sigma}_{j}=\displaystyle \frac{\tilde{{\it\sigma}}_{j}}{\mathop{\sum }_{i=1}^{n}\tilde{{\it\tau}}_{i}|K_{j,i}|^{{\it\alpha}}}.\end{eqnarray}$$
Then (5.13) holds.
Proof. The proof is as in Pock and Chambolle (Reference Pock and Chambolle2011): for any  $x\in X$, we just observe that
 $$\begin{eqnarray}\displaystyle & & \displaystyle \mathop{\sum }_{j=1}^{m}\biggl(\mathop{\sum }_{i=1}^{n}\sqrt{{\it\sigma}_{j}}K_{j,i}\sqrt{{\it\tau}_{i}}x_{i}\biggr)^{2}~\leq ~\mathop{\sum }_{j=1}^{m}{\it\sigma}_{j}\biggl(\mathop{\sum }_{i=1}^{n}|K_{j,i}|^{{\it\alpha}/2}\sqrt{\tilde{{\it\tau}}_{i}}\displaystyle \frac{|K_{j,i}|^{1-{\it\alpha}/2}}{\sqrt{\tilde{{\it\tau}}_{i}}}\sqrt{{\it\tau}_{i}}|x_{i}|\biggr)^{2}\nonumber\\ \displaystyle & & \displaystyle \qquad \leq ~\mathop{\sum }_{j=1}^{m}{\it\sigma}_{j}\biggl(\mathop{\sum }_{i=1}^{n}|K_{j,i}|^{{\it\alpha}}\tilde{{\it\tau}_{i}}\biggr)\biggl(\mathop{\sum }_{i=1}^{n}\displaystyle \frac{|K_{j,i}|^{2-{\it\alpha}}}{\tilde{{\it\tau}}_{i}}{\it\tau}_{i}x_{i}^{2}\biggr)\nonumber\\ \displaystyle & & \displaystyle \qquad =~\mathop{\sum }_{j=1}^{m}\tilde{{\it\sigma}}_{j}\biggl(\mathop{\sum }_{i=1}^{n}\displaystyle \frac{|K_{j,i}|^{2-{\it\alpha}}}{\mathop{\sum }_{l=1}^{m}\tilde{{\it\sigma}}_{l}|K_{l,i}|^{2-{\it\alpha}}}x_{i}^{2}\biggr)=\mathop{\sum }_{i=1}^{n}x_{i}^{2},\end{eqnarray}$$
which shows (5.13).◻
It means that with this choice the algorithm will converge. This can be extended to accelerated variants if, for instance,  $g$ is strongly convex, provided that
  $T$ is chosen in such a way that the strong convexity parameter in the new metric does not degenerate too much (in particular, such preconditioning should be useful if
  $g$ is strongly convex but with a very small parameter in some variables). The case
  ${\it\alpha}=0$ was suggested by Eckstein (Reference Eckstein1989) for primal–dual iterations, referred to as the ‘alternating step method for monotropic programming’. This is simply the PDHG algorithm applied to particular instances of (3.9), with a simpler structure.
We now show that the PDHG algorithm and its variants can be used to efficiently minimize our three introductory examples provided in Section 2.2.
Example 5.6 (ROF model using accelerated PDHG).
In this example, we show how to implement the PDHG algorithm to minimize the ROF model (2.6) used in Example 2.1, which we recall here for convenience:
 $$\begin{eqnarray}\min _{u}{\it\lambda}\Vert \text{D}u\Vert _{2,1}+\displaystyle \frac{1}{2}\Vert u-u^{\diamond }\Vert ^{2},\end{eqnarray}$$
 where  $u^{\diamond }$ is the noisy input image. First we need to transform the objective function to a form that can be tackled by the PDHG algorithm. Using duality, we obtain the saddle-point problem
 $$\begin{eqnarray}\min _{u}\max _{\mathbf{p}}\langle \text{D}u,\mathbf{p}\rangle +\displaystyle \frac{1}{2}\Vert u-u^{\diamond }\Vert ^{2}-{\it\delta}_{\{\Vert \cdot \Vert _{2,\infty }\leq {\it\lambda}\}}(\mathbf{p}).\end{eqnarray}$$
 It remains to detail the implementation of the proximity operators for the functions  $g(u)=\frac{1}{2}\Vert u-u^{\diamond }\Vert ^{2}$ and
  $f^{\ast }(\mathbf{p})={\it\delta}_{\{\Vert \cdot \Vert _{2,\infty }\leq {\it\lambda}\}}(\mathbf{p}).$ The proximal map for the function
  $g(u)$ is given by solving a simple quadratic problem for each pixel. For a given
  $\tilde{u}$, the proximal map is given by
 $$\begin{eqnarray}\hat{u} =\text{prox}_{{\it\tau}g}(\tilde{u} )\Leftrightarrow \hat{u} _{i,j}=\displaystyle \frac{\tilde{u} _{i,j}+{\it\tau}u_{i,j}^{\diamond }}{1+{\it\tau}}.\end{eqnarray}$$
 The proximal map for the function  $f^{\ast }(\mathbf{p})$ is given by the pixelwise orthogonal projection onto
  $\ell _{2}$-balls with radius
  ${\it\lambda}$. This projection can be easily computed using formula (4.23).
Minimizing the ROF model applied to the image in Figure 2.1. This experiment shows that the accelerated primal–dual method with optimal dynamic step sizes (aPDHG) is significantly faster than a primal–dual algorithm that uses fixed step sizes (PDGH). For comparison we also show the performance of accelerated proximal gradient descent (FISTA).

We implemented both the standard PDHG algorithm (Algorithm 6) and its accelerated variant (Algorithm 8) and applied it to the image from Example 2.1. For comparison we also ran the FISTA algorithm (Algorithm 5) on the dual ROF problem. For the plain PDHG we used a fixed setting of the step sizes  ${\it\tau}=0.1$,
  ${\it\sigma}=1/({\it\tau}L^{2})$, where
  $L=\Vert \text{D}\Vert \leq \sqrt{8}$. For the accelerated PDHG (aPDHG), we observe that the function
  $g(u)$ is
  $({\it\mu}_{g}=1)$-strongly convex, and we used the proposed settings for dynamically updating the step size parameters. The initial step size parameters were set to
  ${\it\tau}_{0}={\it\sigma}_{0}=1/L$.
Figure 5.1 shows the decay of the primal–dual gap for PDHG, aPDHG and FISTA. It can be observed that the dynamic choice of the step sizes greatly improves the performance of the algorithm. It can also be observed that the fixed choice of step sizes for the PDHG algorithm seems to be fairly optimal for a certain accuracy, but for higher accuracy the performance of the algorithm breaks down. We can also see that in terms of the primal–dual gap – which in turn bounds the  $\ell _{2}$-error to the true solution – the aPDHG algorithm seems to be superior to the FISTA algorithm.
Example 5.7 (TV-deblurring).
Here we show how to use the PDHG algorithm to minimize the image deblurring problem presented in Example 2.2. The TV-deblurring problem is given by
 $$\begin{eqnarray}\min _{u}{\it\lambda}\Vert \text{D}u\Vert _{2,1}+\displaystyle \frac{1}{2}\Vert a\ast u-u^{\diamond }\Vert ^{2},\end{eqnarray}$$
 where  $u^{\diamond }$ is the
  $m\times n$ image from Example 2.2,
  $a$ is a given blur kernel and
  $\ast$ denotes the two-dimensional convolution operation (using symmetric boundary conditions). For notational simplicity we will ignore the fact that the image
  $u^{\diamond }$ can be a colour image, as in Figure 2.2, and present the details about the algorithm only in the grey-scale case. The generalization to colour images is straightforward and is left to the reader. To simplify the notation further, we replace the convolution operator
  $a$ with an equivalent linear operator
  $A$ such that
  $Au=a\ast u$.
We will now describe two possible ways to minimize the TV-deblurring objective function using the PDHG algorithm. In the first method, called ‘PD-explicit’, we apply the convex conjugate to the total variation term (as in the ROF model), yielding the saddle-point problem
 $$\begin{eqnarray}\min _{u}\max _{\mathbf{p}}\langle \text{D}u,\mathbf{p}\rangle +\displaystyle \frac{1}{2}\Vert Au-u^{\diamond }\Vert ^{2}-{\it\delta}_{\{\Vert \cdot \Vert _{2,\infty }\leq {\it\lambda}\}}(\mathbf{p}).\end{eqnarray}$$
 The PDHG algorithm could in principle be applied to this formulation if there were an efficient algorithm to compute the proximal map for the function  $h(u)=\frac{1}{2}\Vert Au-u^{\diamond }\Vert ^{2}$. A natural idea would be to compute this proximal map using the FFT (as in Example 5.9 below). However, here we want to use only convolution operations in the image domain. Hence, we restrict ourselves to the variant (5.6) of the PDHG algorithm, which can also deal with explicit gradients. The gradient with respect to the data term is easily computed as
 $$\begin{eqnarray}{\rm\nabla}g(u)=A^{\ast }(Au-u^{\diamond }),\end{eqnarray}$$
 where the adjoint operator  $A^{\ast }$ can be realized by a convolution with the adjoint kernel
  $\bar{a}$, which is the convolution kernel
  $a$ rotated by 180 degrees. The Lipschitz constant of the gradient of
  $h(u)$ is computed as
  $L_{h}\leq \Vert A\Vert ^{2}\leq 1$. The proximal map with respect to the function
  $f^{\ast }(\mathbf{p})={\it\delta}_{\{\Vert \cdot \Vert _{2,\infty }\leq {\it\lambda}\}}(\mathbf{p})$ is again computed using the projection formula (4.23). With this information, the primal–dual algorithm is easily implemented. According to (5.9), we set the step sizes as
  ${\it\tau}=1/(L/c+L_{h})$, and
  ${\it\sigma}=1/(cL)$, for some
  $c>0$ which yields a feasible pair of primal and dual step sizes.
In the second method, called ‘PD-split’, we apply the convex conjugate not only to the total variation term but also to the data term. This yields the saddle-point problem
 $$\begin{eqnarray}\min _{u}\max _{\mathbf{p},q}\langle \text{D}u,\mathbf{p}\rangle -{\it\delta}_{\{\Vert \cdot \Vert _{2,\infty }\leq {\it\lambda}\}}(\mathbf{p})+\langle Au,q\rangle -\displaystyle \frac{1}{2}\Vert q+u^{\diamond }\Vert ^{2},\end{eqnarray}$$
 where, letting  $\mathbf{y}=(\mathbf{p},q)$,
  $K^{\ast }=(\text{D}^{\ast },A^{\ast })$,
  $f^{\ast }(\mathbf{y})=(f_{\mathbf{p}}^{\ast }(\mathbf{p}),f_{q}^{\ast }(q)),$ with
 $$\begin{eqnarray}f_{\mathbf{p}}^{\ast }(\mathbf{p})={\it\delta}_{\{\Vert \cdot \Vert _{2,\infty }\leq {\it\lambda}\}}(\mathbf{p}),\quad f_{q}^{\ast }(q)=\displaystyle \frac{1}{2}\Vert q+u^{\diamond }\Vert ^{2},\end{eqnarray}$$
we obtain the saddle-point problem
 $$\begin{eqnarray}\min _{u}\max _{\mathbf{y}}\langle Ku,\mathbf{y}\rangle -f^{\ast }(\mathbf{y}),\end{eqnarray}$$
 which exactly fits the class of problems that can be optimized by the PDHG algorithm. To implement the algorithm, we just need to know how to compute the proximal maps with respect to  $f^{\ast }$. Since
  $f^{\ast }$ is separable in
  $\mathbf{p},q$, we can compute the proximal maps independently for both variables. The formula to compute the proximal map for
  $f_{\mathbf{p}}^{\ast }$ is again given by the projection formula (4.23). The proximal map for
  $f_{q}^{\ast }$ requires us to solve pixelwise quadratic optimization problems. For a given
  $\tilde{q}$, its solution is given by
 $$\begin{eqnarray}\hat{q}=\text{prox}_{{\it\sigma}f_{q}^{\ast }}(\tilde{q})\Leftrightarrow \hat{q}_{i,j}=\displaystyle \frac{\tilde{q}_{i,j}-{\it\sigma}u_{i,j}^{\diamond }}{1+{\it\sigma}}.\end{eqnarray}$$
 We found it beneficial to apply a simple form of 2-block diagonal preconditioning by observing that the linear operator  $K$ is compiled from the two distinct but regular blocks
  $\text{D}$ and
  $A$. According to Lemma 5.5, we can perform the following feasible choice of the step sizes:
  ${\it\tau}=c/(L+\sqrt{L_{h}})$,
  ${\it\sigma}_{\mathbf{p}}=1/(cL)$, and
  ${\it\sigma}_{q}=1/(c\sqrt{L_{h}})$, for some
  $c>0$ where
  ${\it\sigma}_{\mathbf{p}}$ is used to update the
  $\mathbf{p}$ variable and
  ${\it\sigma}_{q}$ is used to update the
  $q$ variable.
Minimizing the TV-deblurring problem applied to the image in Figure 2.2. We compare the performance of a primal–dual algorithm with explicit gradient steps (PD-explicit) and a primal–dual algorithm that uses a full splitting of the objective function (PD-split). PD-explicit seems to perform slightly better at the beginning, but PD-split performs better for higher accuracy.

Note that we cannot rely on the accelerated form of the PDHG algorithm because the objective function lacks strong convexity in  $u$. However, the objective function is strongly convex in the variable
  $Au$, which can be used to achieve partial acceleration in the
  $q$ variable (Valkonen and Pock Reference Valkonen and Pock2015).
Figure 5.2 shows a comparison between the two different variants of the PDHG algorithm for minimizing the TV-deblurring problem from Example 2.2. In both variants we used  $c=10$. The true primal objective function has been computed by running the ‘PD-split’ algorithm for a large number of iterations. One can see that the ‘PD-split’ variant is significantly faster for higher accuracy. The reason is that the choice of the primal step size in ‘PD-explicit’ is more restrictive (
 ${\it\tau}<L_{h}$). On the other hand, ‘PD-explicit’ seems to perform well at the beginning and also has a smaller memory footprint.
Example 5.8 (minimizing the TV-$\ell _{1}$ model).

In the next example we will show how to minimize the TV- $\ell _{1}$ model used in Example 2.3 for salt-and-pepper denoising. Let us recall the TV-
 $\ell _{1}$ model for image denoising. It is given by the following non-smooth objective function:
 $$\begin{eqnarray}\min _{u}{\it\lambda}\Vert \text{D}u\Vert _{2,1}+\Vert u-u^{\diamond }\Vert _{1},\end{eqnarray}$$
 where  $u^{\diamond }$ is a given, noisy image of size
  $m\times n$ pixels. Using duality as in (3.10), we obtain the saddle-point problem
 $$\begin{eqnarray}\min _{u}\max _{\mathbf{p}}\langle \text{D}u,\mathbf{p}\rangle +\Vert u-u^{\diamond }\Vert _{1}-{\it\delta}_{\{\Vert \cdot \Vert _{2,\infty }\leq {\it\lambda}\}}(\mathbf{p}).\end{eqnarray}$$
 In order to implement the PDHG algorithm (or related proximal algorithms), we need to compute the proximal maps with respect to both the indicator function of the dual ball  $f^{\ast }(\mathbf{p})={\it\delta}_{\{\Vert \cdot \Vert _{2,\infty }\leq {\it\lambda}\}}(\mathbf{p})$ and the
  $\ell _{1}$-norm in the data-fitting term
 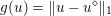 $g(u)=\Vert u-u^{\diamond }\Vert _{1}$. The proximal map with respect to
  $f^{\ast }(\mathbf{p})$ is given (as in earlier examples) by the orthogonal projection onto independent 2-balls with radius
  ${\it\lambda}$ (see (4.23)).
Minimizing the TV- $\ell _{1}$ model applied to the image in Figure 2.3. The plot shows a comparison of the convergence of the primal gap between the primal–dual (PDHG) algorithm and the forward–backward–forward (FBF) algorithm. PDHG and FBF perform almost equally well, but FBF requires twice as many evaluations of the linear operator. We also show the performance of a plain subgradient method (SGM) in order to demonstrate the clear advantage of PDHG and FBF exploiting the structure of the problem.

The proximal map with respect to  $g$ is given by the classical soft shrinkage operator. For a given
  $\tilde{u}$ and step size
  ${\it\tau}>0$, the proximal map
  $\hat{u} =\text{prox}_{{\it\tau}g}(\tilde{u} )$ is given by
 $$\begin{eqnarray}\hat{u} _{i,j}=u_{i,j}^{\diamond }+\max \{0,|\tilde{u} _{i,j}-u_{i,j}^{\diamond }|-{\it\tau}\}\cdot \text{sgn}(\tilde{u} _{i,j}-u_{i,j}^{\diamond }).\end{eqnarray}$$
 Having detailed the computation of the proximal maps for the TV- $\ell _{1}$ model, the implementation of the PDHG algorithm (Algorithm 6) is straightforward. The step size parameters were set to
  ${\it\tau}={\it\sigma}=\Vert \text{D}\Vert ^{-1}$. For comparison, we also implemented the FBF algorithm (Tseng Reference Tseng2000) applied to the primal–dual system (5.5), which for the TV-
 $\ell _{1}$ model and fixed step size is given by
 $$\begin{eqnarray}\displaystyle u^{k+1/2} & = & \displaystyle \text{prox}_{{\it\tau}g}(u^{k}-{\it\tau}\text{D}^{\ast }\mathbf{p}^{k}),\nonumber\\ \displaystyle \mathbf{p}^{k+1/2} & = & \displaystyle \text{prox}_{{\it\tau}f^{\ast }}(\mathbf{p}^{k}+{\it\tau}\text{D}u^{k}),\nonumber\\ \displaystyle u^{k+1} & = & \displaystyle u^{k+1/2}-{\it\tau}\text{D}^{\ast }(\mathbf{p}^{k+1/2}-\mathbf{p}^{k}),\nonumber\\ \displaystyle \mathbf{p}^{k+1} & = & \displaystyle \mathbf{p}^{k+1/2}+{\it\tau}\text{D}(u^{k+1/2}-u^{k}).\nonumber\end{eqnarray}$$
 Observe that the FBF method requires twice as many matrix–vector multiplications as the PDHG algorithm. For simplicity, we used a fixed step size  ${\it\tau}=\Vert \text{D}\Vert ^{-1}$. We also tested the FBF method with an Armijo-type line-search procedure, but it did not improve the results in this example.
Moreover, as a baseline, we also implemented a plain subgradient method (SGM), as presented in (4.10). In order to compute a subgradient of the total variation we used a Huber-type smoothing, but we set the smoothing parameter to a very small value,  ${\it\varepsilon}=10^{-30}$. For the subgradient of the data term, we just took the sign of the argument of the
  $\ell _{1}$-norm. We used a diminishing step size of the form
  $c/\sqrt{k}$ for some
  $c>0$ since it gave the best results in our experiments.
Figure 5.3 shows the convergence of the primal gap, where we computed the ‘true’ value of the primal objective function by running the PDHG algorithm for a large number of iterations. It can be observed that both proximal algorithms (PDHG and FBF) converge significantly faster than plain SGM. This shows that in non-smooth optimization it is essential to exploit the structure of the problem. Observe that PDHG and FBF are faster than their theoretical worst-case rate  $O(1/k)$ and PDHG seems to be slightly faster than FBF. Moreover, PDHG requires us to compute only half of the matrix–vector products of FBF.
5.2 Extensions
Convergence of more general algorithms of the same form are found in many papers in the literature: the subgradient can be replaced with general monotone operators (Vũ Reference Vũ2013a, Boţ et al. Reference Boţ, Csetnek, Heinrich and Hendrich2015, Davis and Yin Reference Davis and Yin2015). In particular, some acceleration techniques carry on to this setting, as observed in Boţ et al. (Reference Boţ, Csetnek, Heinrich and Hendrich2015). Davis and Yin (Reference Davis and Yin2015) discuss a slightly different method with similar convergence properties and rates which mix the cases of subgradients and monotone operators.
As for the case of forward–backward descent methods, this primal–dual method (being a variant of a proximal-point method) can be over-relaxed in some cases, or implemented with inertial terms, yielding better convergence rates (Chambolle and Pock Reference Chambolle and Pock2015a).
Another important extension involves the Banach/non-linear setting. The proximity operators in (5.6) can be computed with non-linear metrics such as in the mirror prox algorithm (4.40). It dates back at least to Nemirovski (Reference Nemirovski2004) in an extragradient form. For the form (5.6), it can be found in Hohage and Homann (Reference Hohage and Homann2014) and is also implemented in Yanez and Bach (Reference Yanez and Bach2014) to solve a matrix factorization problem. For a detailed convergence analysis see Chambolle and Pock (Reference Chambolle and Pock2015a).
Finally we should mention important developments towards optimal rates: Valkonen and Pock (Reference Valkonen and Pock2015) show how to exploit partial strong convexity (with respect to some of the variables) to gain acceleration, and obtain a rate which is optimal in both smooth and non-smooth situations; see also Chen et al. (Reference Chen, Lan and Ouyang2014a).
A few extensions to non-convex problems have recently been proposed (Valkonen Reference Valkonen2014, Möllenhoff, Strekalovskiy, Moeller and Cremers Reference Möllenhoff, Strekalovskiy, Moeller and Cremers2015); see Section 6 for details.
5.3 Augmented Lagrangian type techniques
Perhaps one of the ‘oldest’ and most discussed approaches to solving non-smooth convex problems of the form (3.9), and beyond, is the ‘alternating directions method of multipliers’, or ‘ADMM’, proposed by Glowinski and Marroco (Reference Glowinski and Marroco1975), studied by Gabay and Mercier (Reference Gabay and Mercier1976), and revisited many times; see for instance Boyd et al. (Reference Boyd, Parikh, Chu, Peleato and Eckstein2011) for a review. It is also closely related to the ‘split-Bregman’ algorithm (Goldstein and Osher Reference Goldstein and Osher2009, Zhang, Burger, Bresson and Osher Reference Zhang, Burger, Bresson and Osher2010), which is inspired by Bregman iterations (Bregman Reference Bregman1967) and whose implementation boils down to an instance of the ADMM (though with interesting interpretations). A fairly general description of the relationships between the ADMM and similar splitting methods can be found in Esser (Reference Esser2009).
In its standard form, the ADMM aims at tackling constrained problems of the form
 $$\begin{eqnarray}\min _{Ax+By=b}f(x)+g(y),\end{eqnarray}$$
 which become (3.9) if  $b=0$,
  $A=\text{Id}$ and
  $B=-K$. The idea is to introduce a Lagrange multiplier
  $z$ for the constraint, and write the global problem as a saddle-point optimization for an ‘augmented Lagrangian’ (Hestenes Reference Hestenes1969, Powell Reference Powell1969, Fortin and Glowinski Reference Fortin and Glowinski1982):
 $$\begin{eqnarray}\min _{x,y}\sup _{z}f(x)+g(y)+\langle z,b-Ax-By\rangle +\displaystyle \frac{{\it\gamma}}{2}\Vert b-Ax-By\Vert ^{2},\end{eqnarray}$$
 where  ${\it\gamma}>0$ is a parameter. While it is obvious that the addition of the last quadratic term will not modify the optimality conditions or the value of the saddle-point, it greatly helps to stabilize the iterations by usually making the minimization problems in
  $x,y$ (for fixed
  $z$) coercive, and hopefully solvable.
In practice, the most straightforward way to tackle this saddle-point problem should be to perform Uzawa’s iterations, or an Arrow–Hurwicz-type method as in Section 5.1. Uzawa’s algorithm would require us to minimize a problem in  $(x,y)$, for fixed
  $z$, which might be as difficult as the initial problem. When this is possible, the iteration
  $z^{k+1}=z^{k}+{\it\gamma}(b-Ax^{k+1}-By^{k+1})$ is then precisely an ascent method for the dual energy, whose gradient is
  $(1/{\it\gamma})$-Lipschitz. But in general we need a different strategy. The idea which was proposed and analysed in Glowinski and Marroco (Reference Glowinski and Marroco1975) and Gabay and Mercier (Reference Gabay and Mercier1976) simply consists in alternating the descent steps in
  $x$ and
  $y$ before updating
  $z$, as summarized in Algorithm 10. A related method called ‘AMA’ (Tseng Reference Tseng1991) drops the quadratic term in the first minimization. This can be interesting when
  $f$ has strong convexity properties, but we will not discuss this variant. Many studies of the ADMM approach are to be found in the literature, from the thesis of Eckstein (Reference Eckstein1989) to more recent convergence analyses (with rates) such as that of Nishihara et al. (Reference Nishihara, Lessard, Recht, Packard and Jordan2015) (Shefi and Teboulle Reference Shefi and Teboulle2014, He and Yuan Reference He and Yuan2015b,Reference He and Yuanc, Goldstein, O’Donoghue, Setzer and Baraniuk Reference Goldstein, O’Donoghue, Setzer and Baraniuk2014). Some of these studies (Shefi and Teboulle Reference Shefi and Teboulle2014, Davis and Yin Reference Davis and Yin2014b) relate the algorithm, and linearized variants, to the primal–dual approach discussed in Section 5.1; we will see indeed that these methods belong to the same class.
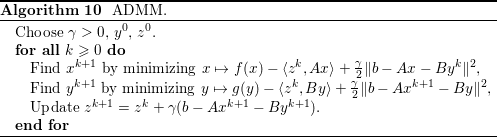
We now show briefly how this relationship is established, explaining the reason why convergence for the ADMM is ensured and the rates of convergence that one can expect from this algorithm without further tuning. Of course, this provides only a rough understanding of the method. A first remark is as follows. If we let
 $$\begin{eqnarray}\tilde{f}({\it\xi}):=\min _{\{x\,:\,Ax={\it\xi}\}}f(x),\quad \tilde{g}({\it\eta}):=\min _{\{y\,:\,By={\it\eta}\}}g(y),\end{eqnarray}$$
 and set these to  $+\infty$ when the set of constraints is empty, then these functions are convex, l.s.c., proper and the convex conjugates of
  $f^{\ast }(A^{\ast }\cdot )$ and
  $g^{\ast }(B^{\ast }\cdot )$, respectively; see Rockafellar (Reference Rockafellar1997, Corollary 31.2.1).Footnote 13 Then one can rewrite the iterations of Algorithm 10, letting
  ${\it\xi}^{k}=Ax^{k}$ and
  ${\it\eta}^{k}=Ay^{k}$, in the form
 $$\begin{eqnarray}\begin{array}{@{}rcl@{}}{\it\xi}^{k+1} & = & \text{prox}_{\tilde{f}/{\it\gamma}}\biggl(b+\displaystyle \frac{z^{k}}{{\it\gamma}}-{\it\eta}^{k}\biggr),\\ {\it\eta}^{k+1} & = & \text{prox}_{\tilde{g}/{\it\gamma}}\biggl(b+\displaystyle \frac{z^{k}}{{\it\gamma}}-{\it\xi}^{k+1}\biggr),\\ z^{k+1} & = & z^{k}+{\it\gamma}(b-{\it\xi}^{k+1}-{\it\eta}^{k+1}).\end{array}\end{eqnarray}$$
 In fact it is generally impossible to express the functions  $\tilde{f}$ and
  $\tilde{g}$ explicitly, but the fact that the algorithm is computable implicitly assumes that the operators
  $\text{prox}_{{\it\tau}\tilde{f}},\text{prox}_{{\it\tau}\tilde{g}}$ are computable. Observe that from the last two steps, thanks to Moreau’s identity (3.8), we have
 $$\begin{eqnarray}\displaystyle \frac{z^{k+1}}{{\it\gamma}}=b+\displaystyle \frac{z^{k}}{{\it\gamma}}-{\it\xi}^{k+1}-\text{prox}_{\tilde{g}/{\it\gamma}}\biggl(b+\displaystyle \frac{z^{k}}{{\it\gamma}}-{\it\xi}^{k+1}\biggr)=\displaystyle \frac{1}{{\it\gamma}}\text{prox}_{{\it\gamma}\tilde{g}^{\ast }}(z^{k}+{\it\gamma}(b-{\it\xi}^{k+1})).\end{eqnarray}$$
 Hence, letting  ${\it\tau}={\it\gamma}$,
  ${\it\sigma}=1/{\it\gamma}$,
  $\bar{z}^{k}=z^{k}+{\it\gamma}(b-{\it\xi}^{k}-{\it\eta}^{k})$, we see that the iterations (5.16) can be rewritten as
 $$\begin{eqnarray}\displaystyle \begin{array}{@{}rcl@{}}{\it\xi}^{k+1} & = & \text{prox}_{{\it\sigma}\tilde{f}}({\it\xi}^{k}+{\it\sigma}\bar{z}^{k}),\\ z^{k+1} & = & \text{prox}_{{\it\tau}\tilde{g}^{\ast }}(z^{k}-{\it\tau}({\it\xi}^{k+1}-b)),\\ \bar{z}^{k+1} & = & 2z^{k+1}-z^{k},\end{array} & & \displaystyle\end{eqnarray}$$
which is exactly the primal–dual iterations (5.3)–(5.4) for the saddle-point problem
 $$\begin{eqnarray}\min _{{\it\xi}}\max _{z}\tilde{f}({\it\xi})-\tilde{g}^{\ast }(z)+\langle z,{\it\xi}-b\rangle .\end{eqnarray}$$
A consequence is that Theorem 5.1 applies, and allows us to derive a convergence rate of the form
 $$\begin{eqnarray}\displaystyle & & \displaystyle \tilde{f}({\rm\Xi}^{k})-\tilde{g}^{\ast }(z)+\langle z,{\rm\Xi}^{k}-b\rangle -(\tilde{f}({\it\xi})-\tilde{g}^{\ast }(Z^{k})+\langle Z^{k},{\it\xi}-b\rangle )\nonumber\\ \displaystyle & & \displaystyle \hspace{136.57323pt}\leq \displaystyle \frac{1}{k}\biggl({\it\gamma}\Vert {\it\xi}-{\it\xi}^{0}\Vert ^{2}+\displaystyle \frac{1}{{\it\gamma}}\Vert z-z^{0}\Vert \biggr),\nonumber\end{eqnarray}$$
 where  $({\rm\Xi}^{k},Z^{k})$ are appropriate averages of the quantities
  $({\it\xi}^{i+1},z^{i})$,
  $i=1,\ldots ,k$. In practice, of course, we will have
  ${\rm\Xi}^{k}=AX^{k}$, where
  $X^{k}$ is the average of the points
  $(x^{i})_{i=1}^{k}$. In addition, since each
  ${\it\xi}^{i}=Ax^{i}$ is obtained by a minimization of
  $f(x)+$(terms which depend only on
  $Ax$), we have
  $f(x^{i})=\tilde{f}({\it\xi}^{i})$. Finally, the bound obtained in Theorem 5.1 is, in fact, at the step before being a bound on
  $\tilde{f}({\rm\Xi}^{k})$, a bound on the quantity
 $$\begin{eqnarray}\displaystyle \frac{1}{k}\mathop{\sum }_{i=1}^{k}\tilde{f}({\it\xi}^{i})=\displaystyle \frac{1}{k}\mathop{\sum }_{i=1}^{k}f(x^{i})\geq f(X^{k}).\end{eqnarray}$$
 Hence the estimate above can be slightly improved and written in the following form, which involves the original functions  $f,g$ (we also use
  $\tilde{g}^{\ast }(z)=g^{\ast }(B^{\ast }z)$):
 $$\begin{eqnarray}\displaystyle & f(X^{k})-g^{\ast }(B^{\ast }z)+\langle z,AX^{k}-b\rangle -(f(x)-g^{\ast }(B^{\ast }Z^{k})+\langle Z^{k},Ax-b\rangle ) & \displaystyle \nonumber\\ \displaystyle & \hspace{136.57323pt}\leq \displaystyle \frac{1}{k}\biggl({\it\gamma}\Vert Ax-Ax^{0}\Vert ^{2}+\displaystyle \frac{1}{{\it\gamma}}\Vert z-z^{0}\Vert \biggr). & \displaystyle \nonumber\end{eqnarray}$$
 Whether this can be turned into an effective bound for the energy of the initial problem depends on the particular functions  $f,g$: one can obtain something useful only if an a priori bound on the
  $z$ or
  ${\it\xi}$ which reaches the supremum is known. For instance, if
  $\tilde{g}^{\ast }(z)=g^{\ast }(B^{\ast }z)$ has a globally bounded domain (equivalently, if
  $\tilde{g}$ has linear growth), one can take the sup over
  $z$ in the estimate and get
 $$\begin{eqnarray}f(X^{k})+\tilde{g}(AX^{k}-b)-\big(f(x^{\ast })+\tilde{g}(Ax^{\ast }-b)\big)\leq O\biggl(\displaystyle \frac{1}{k}\biggr),\end{eqnarray}$$
 where  $x^{\ast }$ is a minimizer for the problem. Similarly, if we can show a bound for the
  $x$ which realizes the sup of the left-hand side, then we obtain a bound on the dual objective. Choosing a solution
  $z=z^{\ast }$, it follows that
 $$\begin{eqnarray}f^{\ast }(A^{\ast }Z^{k})+g^{\ast }(B^{\ast }Z^{k})+\langle Z^{k},b\rangle -(f^{\ast }(A^{\ast }z^{\ast })+g^{\ast }(B^{\ast }z^{\ast })+\langle z^{\ast },b\rangle )\leq O\biggl(\displaystyle \frac{1}{k}\biggr).\end{eqnarray}$$
These are ergodic rates, (slower) convergence rates in the non-ergodic sense are discussed in Davis and Yin (Reference Davis and Yin2014a); see also He and Yuan (Reference He and Yuan2015b). This form of the ADMM has been generalized to problems involving more than two blocks (with some structural conditions) (He and Yuan Reference He and Yuan2015a, Fu, He, Wang and Yuan Reference Fu, He, Wang and Yuan2014) and/or to non-convex problems (see the references in Section 6.3).
Accelerated ADMM
The relationship that exists between the two previous method also allows us to derive accelerated variants of the ADMM method if either the function  $\tilde{g}^{\ast }(z)=g^{\ast }(B^{\ast }z)$ or the function
  $\tilde{f}$ is strongly convex. The first case will occur when
  $g$ has
  $L_{g}$-Lipschitz gradient and
  $B^{\ast }$ is injective; then it will follow that
  $\tilde{g}^{\ast }$ is
  $1/(L_{g}\Vert (BB^{\ast })^{-1}\Vert )$-strongly convex. This should not cover too many interesting cases, except perhaps the cases where
  $B=\text{Id}$ and
  $g$ is smooth so that the problem reduces to
 $$\begin{eqnarray}\min _{x}f(x)+g(b-Ax),\end{eqnarray}$$
 which could then be tackled by a more standard accelerated descent method as in Section 4.7.Footnote 14 The second case corresponds to the case where  $f$ is itself
  ${\it\mu}_{f}$-strongly convex:Footnote 15 here,
  $\tilde{f}^{\ast }=f^{\ast }(A^{\ast }\cdot )$ will have an
  $(\Vert A\Vert ^{2}/{\it\mu}_{f})$-Lipschitz gradient so that
  $\tilde{f}$ is itself
  $({\it\mu}_{f}/\Vert A\Vert ^{2})$-strongly convex. This is the case for problem (2.6), for example.
When  ${\rm\nabla}g$ is
  $L_{g}$-Lipschitz and
  $B=\text{Id}$ (so that
  $\tilde{g}^{\ast }=g^{\ast }$ is
  $(1/L_{g})$-convex), the accelerated variant of (5.17), according to Algorithm 8, would be
 $$\begin{eqnarray}\displaystyle {\it\xi}^{k+1} & = & \displaystyle \text{prox}_{{\it\sigma}\tilde{f}}({\it\xi}^{k}+{\it\sigma}_{k}\bar{z}^{k}),\nonumber\\ \displaystyle z^{k+1} & = & \displaystyle \text{prox}_{{\it\tau}\tilde{g}^{\ast }}(z^{k}-{\it\tau}_{k}({\it\xi}^{k+1}-b)),\nonumber\\ \displaystyle {\it\theta}_{k} & = & \displaystyle 1/\sqrt{1+\displaystyle \frac{{\it\tau}_{k}}{L_{g}}},\quad {\it\tau}_{k+1}={\it\theta}_{k}{\it\tau}_{k},\quad {\it\sigma}_{k+1}=1/{\it\tau}_{k+1},\nonumber\\ \displaystyle \bar{z}^{k+1} & = & \displaystyle z^{k+1}+{\it\theta}_{k}(z^{k+1}-z^{k}).\nonumber\end{eqnarray}$$
 This, in turn, can be rewritten in the following ‘ADMM’-like form, letting  ${\it\xi}^{k}=Ax^{k}$,
  ${\it\eta}^{k}=y^{k}$, and
  ${\it\tau}_{k}={\it\gamma}_{k}$:
 $$\begin{eqnarray}\begin{array}{@{}rcl@{}}x^{k+1} & = & \arg \displaystyle \min _{x}f(x)-\langle z^{k},Ax\rangle +\displaystyle \frac{{\it\gamma}_{k}}{2}\Vert b-Ax-y^{k}\Vert ^{2},\\ y^{k+1} & = & \arg \displaystyle \min _{y}g(y)-\langle z^{k},y\rangle +\displaystyle \frac{{\it\gamma}_{k}}{2}\Vert b-Ax^{k+1}-y\Vert ^{2},\\ z^{k+1} & = & z^{k}+{\it\gamma}_{k}(b-Ax^{k+1}-y^{k+1}),\\ {\it\gamma}_{k+1} & = & {\it\gamma}_{k}/\sqrt{1+\displaystyle \frac{{\it\gamma}_{k}}{L_{g}}}.\end{array}\end{eqnarray}$$
 On the other hand, if  $f$ is
  ${\it\mu}_{f}$-strongly convex, so that
  $\tilde{f}$ is
  $({\it\mu}:={\it\mu}_{f}/\Vert A\Vert ^{2})$-strongly convex (indeed,
  $\tilde{f}^{\ast }(z)=f^{\ast }(A^{\ast }z)$ will have an
  $(\Vert A\Vert ^{2}/{\it\mu}_{f})$-Lipschitz gradient), we must revert to the formulation of the algorithm described in Appendix C.2. We start from the primal–dual formulation
 $$\begin{eqnarray}\begin{array}{@{}rcl@{}}{\it\xi}^{k+1} & = & \text{prox}_{{\it\tau}_{k}\tilde{f}}({\it\xi}^{k}+{\it\tau}_{k}\bar{z}^{k}),\\ z^{k+1} & = & \text{prox}_{{\it\sigma}_{k}\tilde{g}^{\ast }}(z^{k}-{\it\sigma}_{k}({\it\xi}^{k+1}-b)),\\ \bar{z}^{k+1} & = & z^{k+1}+{\it\theta}_{k+1}(z^{k+1}-z^{k}),\end{array}\end{eqnarray}$$
 where  ${\it\tau}_{k},{\it\sigma}_{k},{\it\theta}_{k}$ need to satisfy (C.4)–(C.5) (with
  ${\it\mu}_{g}$ replaced by
  ${\it\mu}$) and (C.6), which reads asFootnote 16
 ${\it\theta}_{k}^{2}{\it\sigma}_{k}{\it\tau}_{k}\leq 1$; see Appendix C.2. Then, this is in turn converted into an ADMM formulation, as before: letting
 $$\begin{eqnarray}{\it\eta}^{k+1}=\arg \min _{{\it\eta}}\tilde{g}({\it\eta})+\displaystyle \frac{{\it\sigma}_{k}}{2}\Vert {\it\eta}+{\it\xi}^{k+1}-b\Vert ^{2}-\langle z^{k},{\it\eta}\rangle ,\end{eqnarray}$$
we have, thanks again to Moreau’s identity,
 $$\begin{eqnarray}z^{k+1}=z^{k}-{\it\sigma}_{k}({\it\xi}^{k+1}+{\it\eta}^{k+1}-b),\end{eqnarray}$$
 so that  $\bar{z}^{k+1}=z^{k+1}-{\it\theta}_{k+1}{\it\sigma}_{k}({\it\xi}^{k+1}+{\it\eta}^{k+1}-b)$. In particular, the argument in the prox defining
  ${\it\xi}^{k+1}$ turns out to be
  ${\it\xi}^{k}+{\it\tau}z^{k}-{\it\tau}_{k}{\it\theta}_{k}{\it\sigma}_{k-1}({\it\xi}^{k}+{\it\eta}^{k}-b)$ and we can obtain an ADMM formulation again provided that
  ${\it\theta}_{k}{\it\tau}_{k}{\it\sigma}_{k-1}=1$ for all
  $k$, which in particular implies, using (C.5), that
  ${\it\theta}_{k}^{2}{\it\tau}_{k}{\it\sigma}_{k}=1$, which shows (C.6). A possible choice is to consider equality in (C.4): together with (C.5) we deduce after a few calculations that, for each
  $k$, we should choose
 $$\begin{eqnarray}{\it\sigma}_{k}=\displaystyle \frac{{\it\mu}+\sqrt{{\it\mu}^{2}+4{\it\sigma}_{k-1}^{2}}}{2},\end{eqnarray}$$
 after having chosen an initial  ${\it\sigma}_{0}>{\it\mu}$. (We also have
  ${\it\theta}_{k}=\sqrt{1-{\it\mu}/{\it\sigma}_{k}}$,
  ${\it\tau}_{0}=1/({\it\sigma}_{0}-{\it\mu})$,
  ${\it\tau}_{k}=1/({\it\theta}_{k}^{2}{\it\sigma}_{k})=1/({\it\sigma}_{k}-{\it\mu})$, but these are not really needed in the final expressions.) We obtain the following ADMM algorithm:
 $$\begin{eqnarray}\displaystyle x^{k+1} & = & \displaystyle \arg \min _{x}f(x)-\langle z^{k},Ax\rangle +\displaystyle \frac{{\it\sigma}_{k}-{\it\mu}}{2}\Vert b-Ax-By^{k}\Vert ^{2},\end{eqnarray}$$
 $$\begin{eqnarray}\displaystyle y^{k+1} & = & \displaystyle \arg \min _{y}g(x)-\langle z^{k},By\rangle +\displaystyle \frac{{\it\sigma}_{k}}{2}\Vert b-Ax^{k+1}-By\Vert ^{2},\end{eqnarray}$$
 $$\begin{eqnarray}\displaystyle z^{k+1} & = & \displaystyle z^{k}+{\it\sigma}_{k}(b-Ax^{k+1}-By^{k+1}).\end{eqnarray}$$
 Clearly from (5.19),  ${\it\sigma}_{k}\geq {\it\sigma}_{0}+k{\it\mu}/2$, so that (see (C.7)) we have
 $$\begin{eqnarray}T_{k}\geq k+\displaystyle \frac{{\it\mu}}{4{\it\sigma}_{0}}k(k-1).\end{eqnarray}$$
 Interpreting (C.10) correctly, we obtain a control with a rate  $O(1/k^{2})$ on a gap which, depending on the particular problem, can be turned into a control on the energy. One issue with this kind of algorithm is the choice of the initial parameter
  ${\it\sigma}_{0}$, which can have a lot of influence on the effective convergence (Nishihara et al. Reference Nishihara, Lessard, Recht, Packard and Jordan2015). Knowledge of the order of magnitude of
  $\Vert x_{0}-x^{\ast }\Vert ,\Vert z_{0}-z^{\ast }\Vert$ and precise knowledge of
  ${\it\mu}$ might help to improve this choice.
In Figure 5.4 we compare the convergence of the primal–dual gap of ADMM and accelerated ADMM (aADMM) for the ROF model (2.6) applied to the image in Example 2.1. It can be observed that the advantage of the accelerated ADMM takes effect especially for higher accuracy. For comparison, we also plot the convergence of the accelerated primal–dual algorithm (aPDHG). One can observe that the ADMM algorithms are fast, especially at the beginning. Note, however, that one iteration of ADMM is computationally much more expensive than one iteration of aPDHG.
Comparison of ADMM and accelerated ADMM (aADMM) for solving the ROF model applied to the image in Figure 2.1. For comparison we also plot the convergence of the accelerated primal–dual algorithm (aPDHG). The ADMM methods are fast, especially at the beginning.

A few accelerated ADMM implementations have been proposed in the recent literature. A first important contribution is by Goldstein et al. (Reference Goldstein, O’Donoghue, Setzer and Baraniuk2014), who discuss various cases, and in the case considered here propose a heuristic approach which might be more efficient in practice. Powerful extensions of the techniques described in this section (and the next), leading to optimal mixed rates (depending on the structure of each function), are detailed in the recent contribution by Ouyang et al. (Reference Ouyang, Chen, Lan and Pasiliao2015), where it seems the kind of acceleration described in this section first appeared.
Linearized ADMM
An important remark of Chambolle and Pock (Reference Chambolle and Pock2011), successfully exploited by Shefi and Teboulle (Reference Shefi and Teboulle2014) to derive new convergence rates, is that the ‘PDHG’ primal–dual algorithm (5.3)–(5.4), is exactly the same as a linearized variant of the ADMM for  $B=\text{Id}$, with the first minimization step replaced by a proximal descent step (following a general approach introduced in Chen and Teboulle Reference Chen and Teboulle1994),
 $$\begin{eqnarray}x^{k+1}=\arg \min _{x}f(x)-\langle z^{k},Ax\rangle +\displaystyle \frac{{\it\gamma}}{2}\Vert b-Ax-y^{k}\Vert ^{2}+\displaystyle \frac{{\it\gamma}}{2}\Vert x-x^{k}\Vert _{M}^{2},\end{eqnarray}$$
 for  $M$ the preconditioning matrix
 $$\begin{eqnarray}M=\displaystyle \frac{1}{{\it\lambda}}\text{Id}-A^{\ast }A\end{eqnarray}$$
 which is positive semidefinite when  ${\it\lambda}\Vert A\Vert ^{2}\leq 1$. Indeed, we obtain
 $$\begin{eqnarray}x^{k+1}=\text{prox}_{{\textstyle \frac{{\it\lambda}}{{\it\gamma}}}f}\biggl(x^{k}+\displaystyle \frac{{\it\lambda}}{{\it\gamma}}A^{\ast }z^{k}-{\it\lambda}A^{\ast }(Ax^{k}+y^{k}-b)\biggr).\end{eqnarray}$$
 However, since  $z^{k}=z^{k-1}+{\it\gamma}(b-Ax^{k}-y^{k})$, letting
  ${\it\sigma}={\it\lambda}/{\it\gamma}$, this equation becomes
 $$\begin{eqnarray}x^{k+1}=\text{prox}_{{\it\sigma}f}(x^{k}+{\it\sigma}A^{\ast }(2z^{k}-z^{k-1})),\end{eqnarray}$$
 while the second equation from (5.17) reads, using  $\tilde{g}=g$,
 $$\begin{eqnarray}z^{k+1}=\text{prox}_{{\it\tau}g^{\ast }}(z^{k}-{\it\tau}(Ax^{k+1}-b)).\end{eqnarray}$$
 We recover precisely the PDHG algorithm of Theorem 5.1. Observe in particular that the condition  ${\it\sigma}{\it\tau}\Vert A\Vert ^{2}={\it\lambda}\Vert A\Vert ^{2}<1$ is precisely the condition that makes
  $M$ positive definite.
The natural extension of this remark consists in observing that if one can solve problem (5.23) for a preconditioning matrix  $M$ with
  $M+A^{\ast }A\geq 0$, then everything works the same, the only difference being that the proximity operator in (5.24) is now computed in the metric
  $M+A^{\ast }A$. This is particularly useful if
  $g$ itself is quadratic (that is,
  $g(x)=\Vert Bx-x_{0}\Vert ^{2}/2$), as it implies that one can replace the exact minimization of the problem in
  $x$ with a few iterations of a linear solver, and in many cases the output will be equivalent to exactly (5.23) in some (not necessarily known) metric
  $M$ with
  $M+A^{\ast }A+(1/{\it\gamma})K^{\ast }K\geq 0$. (For example, this occurs in the ‘split Bregman’ algorithm (Goldstein and Osher Reference Goldstein and Osher2009), for which it has been observed, and proved by Zhang, Burger and Osher (Reference Zhang, Burger and Osher2011), that one can do only one inner iteration of a linear solver; see also Yin and Osher (Reference Yin and Osher2013), who study inexact implementations.) For a precise statement we refer to Bredies and Sun (Reference Bredies and Sun2015b, Section 2.3). It is shown there and in Bredies and Sun (Reference Bredies and Sun2015a,Reference Bredies and Sunc) that careful choice of a linear preconditioner can lead to very fast convergence. A generalization of the ADMM in the same flavour is considered in Deng and Yin (Reference Deng and Yin2016), and several convergence rates are derived in smooth cases.
5.4 Douglas–Rachford splitting
Last but not least, we must mention another splitting method that is of the same class as the ADMM and PDHG algorithms. Observe that if we apply the PDHG algorithm to a problem with form (3.9), where  $K=\text{Id}$, then the iterations reduce to
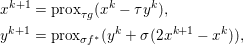 $$\begin{eqnarray}\displaystyle & & \displaystyle x^{k+1}=\text{prox}_{{\it\tau}g}(x^{k}-{\it\tau}y^{k}),\nonumber\\ \displaystyle & & \displaystyle y^{k+1}=\text{prox}_{{\it\sigma}f^{\ast }}(y^{k}+{\it\sigma}(2x^{k+1}-x^{k})),\nonumber\end{eqnarray}$$
 with the condition  ${\it\tau}{\it\sigma}\leq 1$. We now assume
  ${\it\sigma}=1/{\it\tau}$. Thanks to Moreau’s identity (3.8),
 $$\begin{eqnarray}2x^{k+1}-x^{k}+{\it\tau}y^{k}={\it\tau}y^{k+1}+\text{prox}_{{\it\tau}f}(2x^{k+1}-x^{k}+{\it\tau}y^{k}).\end{eqnarray}$$
 Letting  $v^{k}=x^{k}-{\it\tau}y^{k}$ for each
  $k$, we find that the iterations can be equivalently written as
 $$\begin{eqnarray}\displaystyle & & \displaystyle x^{k+1}=\text{prox}_{{\it\tau}g}v^{k},\end{eqnarray}$$
 $$\begin{eqnarray}\displaystyle & & \displaystyle v^{k+1}=v^{k}-x^{k+1}+\text{prox}_{{\it\tau}f}(2x^{k+1}-v^{k}).\end{eqnarray}$$
 This is precisely the ‘Douglas–Rachford’ (DR) splitting algorithm (Douglas and Rachford Reference Douglas and Rachford1956), in the form given in Lions and Mercier (Reference Lions and Mercier1979, Algorithm II). Convergence is established in that paper, in the case where  $\partial f$ and
  $\partial g$ are replaced with general maximal-monotone operators
  $A$ and
  $B$. It can be seen as a particular way of writing the PDHG algorithm of Section 5.1, as for the ADMM. In fact, it is well known from Gabay (Reference Gabay, Fortin and Glowinski1983) and Glowinski and Le Tallec (Reference Glowinski and Le Tallec1989) that the ADMM is the same as the Douglas–Rachford splitting implemented on the dual formulation of the problem; see also Setzer (Reference Setzer2011) and Esser (Reference Esser2009) for other connections to similar algorithms. This method has been studied by many authors. An important observation is the fact that it can be written as a proximal-point algorithm: Eckstein and Bertsekas (Reference Eckstein and Bertsekas1992) have shown and used this equivalence in particular to generalize the algorithm to inexact minimizations. This follows quite easily from the analysis in this paper, since it is derived from the PDHG, which is an instance of the proximal-point algorithm when written in the form (5.5).
The fact that the convergence rate is improved when some of the functions or operators are smooth was mentioned by Lions and Mercier (Reference Lions and Mercier1979); see Davis and Yin (Reference Davis and Yin2014b) for a detailed study which includes all the splitting described in this work. However, better rates can be achieved by appropriate accelerated schemes: in fact the same remarks which apply to the ADMM obviously apply here. Another obvious consequence is the fact that the acceleration techniques derived for the primal–dual algorithm can also be transferred to this splitting at the expense of some easy calculations – and this also holds for general monotone operators (Boţ et al. Reference Boţ, Csetnek, Heinrich and Hendrich2015). It might be simpler in practice, though, to write the iterations in the ADMM or primal–dual form before implementing acceleration tricks.
In a different direction, Briceno-Arias and Combettes (Reference Briceno-Arias and Combettes2011) have suggested applying this splitting to the saddle-point formulation (3.15) of problem (3.9), solving the inclusion  $0\in Az+Bz$ (
 $z=(x,y)^{T}$) with
  $A:(x,y)\mapsto (\partial g(x),\partial f^{\ast }(y))^{T}$ and
  $B:(x,y)\mapsto (K^{\ast }y,-Kx)^{T}$. This seems to produce excellent results at a reasonable cost; see in particular the applications to deconvolution in O’Connor and Vandenberghe (Reference O’Connor and Vandenberghe2014). A fairly general analysis of this approach is found in Bredies and Sun (Reference Bredies and Sun2015b), with applications to problems (2.6) and (7.4) in Bredies and Sun (Reference Bredies and Sun2015c).Footnote 17
Example 5.9 (TV-deblurring via ADMM or DR splitting).
Let us turn back to the image deblurring problem from Example 2.2. For notational simplicity, we will again describe the problem for a grey-scale image  $u$. One possible way to implement the TV-regularized deblurring problem (2.7) is to write the minimization problem as follows (letting
  $Au:=a\ast u$):
 $$\begin{eqnarray}\min _{u}{\it\lambda}\Vert \text{D}u\Vert _{2,1}+\displaystyle \frac{1}{2}\Vert Au-u^{\diamond }\Vert ^{2}=\min _{\boldsymbol{ p}}{\it\lambda}\Vert \mathbf{p}\Vert _{2,1}+G(\mathbf{p}),\end{eqnarray}$$
 where  $\mathbf{p}=(p_{1},p_{2})$ and
 $$\begin{eqnarray}G(\mathbf{p}):=\min _{u:\text{D}u=\mathbf{p}}\displaystyle \frac{1}{2}\Vert Au-u^{\diamond }\Vert ^{2}\end{eqnarray}$$
 (and  $+\infty$ if
  $\mathbf{p}$ is not a discrete gradient). Observe that the prox of
  $G$ can be computed as
  $\hat{\mathbf{p}}=\text{prox}_{{\it\tau}G}(\tilde{\mathbf{p}})$ if and only if
  $\hat{\mathbf{p}}=\text{D}u$, where
  $u$ solves
 $$\begin{eqnarray}\min _{u}\displaystyle \frac{1}{2{\it\tau}}\Vert \text{D}u-\tilde{\mathbf{p}}\Vert ^{2}+\displaystyle \frac{1}{2}\Vert Au-u^{\diamond }\Vert ^{2}.\end{eqnarray}$$
 It follows that  $\hat{\mathbf{p}}$ must be given by
 $$\begin{eqnarray}\hat{\mathbf{p}}=\text{D}(\text{D}^{\ast }\text{D}+{\it\tau}A^{\ast }A)^{-1}(\text{D}^{\ast }\tilde{\mathbf{p}}+{\it\tau}A^{\ast }u^{\diamond }).\end{eqnarray}$$
 When  $A$ corresponds to a convolution operator, then this computation can be efficiently implemented using an FFT. Since this approach implicitly assumes that the image is periodic, we have pre-processed the original image by bringing its intensity values to the average values at the image boundaries (see Example 2.2). Another natural and clever approach to deal with this boundary issue, suggested by Almeida and Figueiredo (Reference Almeida and Figueiredo2013), is to replace the data term with
  $\frac{1}{2}\Vert M(a\ast u-u^{\diamond })\Vert ^{2}$, where
  $M$ is a diagonal mask which is zero in a strip, of width the size of the support of
  $a$, along the boundaries, and
  $1$ in the middle rectangle (or in other words, we now use
  $Au:=Ma\ast u$ where
  $u$ is defined on a larger grid than
  $u^{\diamond }$, and can now be assumed to be periodic). This modification improves the results, but observe that it then requires about twice as many FFTs per iteration.
Solving the image deblurring problem from Example 2.2. (a) Problem (2.7) after 150 iterations of Douglas–Rachford (DR) splitting. (b) Huber variant after 150 iterations with accelerated DR splitting. The figure shows that after the same number of iterations, the accelerated algorithm yields a higher PSNR value.

The proximity operator is defined by
 $$\begin{eqnarray}\hat{\mathbf{p}}=\arg \min _{\mathbf{p}}{\it\lambda}\Vert \mathbf{p}\Vert _{2,1}+\displaystyle \frac{1}{2{\it\tau}}\Vert \mathbf{p}-\tilde{\mathbf{p}}\Vert ^{2},\end{eqnarray}$$
 and since  $\mathbf{p}=(\mathbf{p}_{1,1},\ldots ,\mathbf{p}_{m,n})$, its solution is given by a pixelwise shrinkage operation,
 $$\begin{eqnarray}\hat{\mathbf{p}}_{i,j}=\biggl(1-\displaystyle \frac{1}{\max \{1,{\textstyle \frac{1}{{\it\tau}{\it\lambda}}}|\tilde{\mathbf{p}}_{i,j}|_{2}\}}\biggr)\tilde{\mathbf{p}}_{i,j}.\end{eqnarray}$$
 As the prox of both  ${\it\lambda}\Vert \mathbf{p}\Vert _{2,1}$ and
  $G(\mathbf{p})$ are solvable, one can implement a DR splitting for this problem. Of course, the reader expert in these approaches will see right away that it leads to exactly the same computations as those we would perform for an ADMM implementation (Esser Reference Esser2009, Zhang et al. Reference Zhang, Burger and Osher2011, Reference Zhang, Burger, Bresson and Osher2010, Getreuer Reference Getreuer2012). In practice, we alternate (5.25) and (5.26) with
  $g$ replaced with
  $\Vert \boldsymbol{\cdot }\Vert _{2,1}$ and
  $f$ with
  $G$ defined above.
As already observed, the total variation regularizer often produces unwanted staircasing (flat regions) in the reconstructed image, as it promotes sparse gradients. Hence, for such a problem, the ‘Huber’ regularizer (4.18) will usually produce equivalent if not better results. The idea is to replace the function  $\Vert \mathbf{p}\Vert _{2,1}$ with its Huber variant
  $H_{{\it\varepsilon}}(\mathbf{p})$, for
  ${\it\varepsilon}>0$, where
  $h_{{\it\varepsilon}}$ is given in (4.20). An important advantage is that the new function now has a
  $1/{\it\varepsilon}$-Lipschitz gradient, so acceleration is possible (Algorithm 8). We obtain essentially the same results as before with far fewer iterations (or better results with the same number of iterations): see Figure 5.5 (the PSNR values are computed only in a central area, where the image is not smoothed before deblurring).
6 Non-convex optimization
In this very incomplete section, we mention some extensions of the methods described so far to non-convex problems. Of course, many interesting optimization problems in imaging are not convex. If  $f$ is a smooth non-convex function, many of the optimization methods designed for smooth convex functions will work and find a critical point of the function. For instance, a simple gradient method (4.1) always guarantees that, denoting
  $g^{k}={\rm\nabla}f(x^{k})$,
 $$\begin{eqnarray}\displaystyle f(x^{k+1}) & =f(x^{k}-{\it\tau}g^{k}) & \displaystyle \nonumber\\ \displaystyle & =f(x^{k})-{\it\tau}\langle {\rm\nabla}f(x^{k}),g^{k}\rangle +\int _{0}^{{\it\tau}}({\it\tau}-t)\langle D^{2}f(x^{k}-tg^{k})g^{k},g^{k}\rangle \text{d}t & \displaystyle \nonumber\\ \displaystyle & \leq f(x^{k})-{\it\tau}\biggl(1-\displaystyle \frac{{\it\tau}L}{2}\biggr)\Vert g^{k}\Vert ^{2} & \displaystyle \nonumber\end{eqnarray}$$
 as long as  $D^{2}f\leq L\text{Id}$, whether positive or not. Hence, if
  $0<{\it\tau}<2/L$, then
  $f(x^{k})$ will still be decreasing. If
  $f$ is coercive and bounded from below, we deduce that subsequences of
  $(x^{k})_{k}$ converge to some critical point. Likewise, inertial methods can be used and are generally convergent (Zavriev and Kostyuk Reference Zavriev and Kostyuk1991) if
  ${\rm\nabla}f$ is
  $L$-Lipschitz and with suitable assumptions which ensure the boundedness of the trajectories.
6.1 Non-convex proximal descent methods
Now, what about non-smooth problems? A common way to extend accelerated methods of this kind to more general problems is to consider problems of the form (4.26) with  $f$ still being smooth but not necessarily convex. Then one will generally look for a critical point (hoping of course that it might be optimal!) by trying to find
  $x^{\ast }$ such that
 $$\begin{eqnarray}{\rm\nabla}f(x^{\ast })+\partial g(x^{\ast })\ni 0.\end{eqnarray}$$
 There is a vast literature on optimization techniques for such problems, which have been tackled in this form at least since Mine and Fukushima (Reference Mine and Fukushima1981) and Fukushima and Mine (Reference Fukushima and Mine1981). These authors study and prove the convergence of a proximal FB descent (combined with an approximate line-search in the direction of the new point) for non-convex  $f$. Recent contributions in this direction, in particular for imaging problems, include those of Grasmair (Reference Grasmair2010), Chouzenoux, Pesquet and Repetti (Reference Chouzenoux, Pesquet and Repetti2014), Bredies, Lorenz and Reiterer (Reference Bredies, Lorenz and Reiterer2015a) and Nesterov (Reference Nesterov2013). We will describe the inertial version of Ochs, Chen, Brox and Pock (Reference Ochs, Chen, Brox and Pock2014), which is of the same type but seems empirically faster, which is natural to expect as it reduces to the standard heavy ball method (Section 4.8.2) in the smooth case. Let us describe the simplest version, with constant steps: see Algorithm 11. Here again,
  $L$ is the Lipschitz constant of
  ${\rm\nabla}f$.
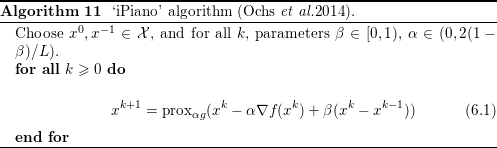
Further, subsequences of  $(x^{k})_{k}$ will still converge to critical points of the energy; see Ochs et al. (Reference Ochs, Chen, Brox and Pock2014, Theorem 4.8). This paper also contains many interesting variants (with varying steps, monotonous algorithms, etc.), as well as convergence rates for the residual of the method.
6.2 Block coordinate descent
We must mention another particular form of problem (4.26) that is interesting for applications in the non-convex case, for instance for matrix factorization problems, or problems where the product of two variables appears in a (smooth) term of the objective. This takes the form
 $$\begin{eqnarray}\min _{x,y}f(x,y)+g_{1}(x)+g_{2}(y),\end{eqnarray}$$
 where  $f$ is again smooth but not necessarily convex, while
  $g_{1}$,
  $g_{2}$ are non-smooth and simple functions, possibly non-convex.
The convergence of alternating minimizations or proximal (implicit) descent steps in this setting (which is not necessarily covered by the general approach of Tseng Reference Tseng2001) has been studied by Attouch et al. (Reference Attouch, Bolte and Svaiter2013), Attouch, Bolte, Redont and Soubeyran (Reference Attouch, Bolte, Redont and Soubeyran2010) and Beck and Tetruashvili (Reference Beck and Tetruashvili2013). However, Bolte, Sabach and Teboulle (Reference Bolte, Sabach and Teboulle2014) have observed that, in general, these alternating steps will not be computable. These authors propose instead to alternate linearized proximal descent steps, as shown in Algorithm 12.
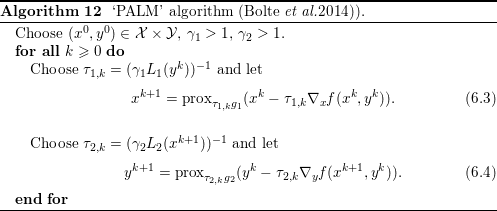
Here,  $L_{1}(y)$ is the Lipschitz constant of
  ${\rm\nabla}_{x}f(\cdot ,y)$, while
  $L_{2}(x)$ is the Lipschitz constant of
  ${\rm\nabla}_{y}f(x,\cdot )$. These are assumed to be bounded from belowFootnote 18 and above (in the original paper the assumptions are slightly weaker). Also, for convergence one must require that a minimizer exists; in particular, the function must be coercive.
Then it is proved by Bolte et al. (Reference Bolte, Sabach and Teboulle2014, Lemma 5) that the distance of the iterates to the set of critical points of (6.2) goes to zero. Additional convergence results are shown if, in addition, the objective function has a very generic ‘KL’ property. We have presented a simplified version of the PALM algorithm: in fact, there can be more than two blocks, and the simple functions  $g_{i}$ need not even be convex: as long as they are bounded from below, l.s.c., and their proximity operator (which is possibly multivalued, but still well defined by (3.6)) can be computed, then the algorithm will converge. We use an inertial variant of PALM (Pock and Sabach Reference Pock and Sabach2016) in Section 7.12 to learn a dictionary of patches.
6.3 Saddle-point-type methods
In the same way, primal–dual first-order methods, including the ADMM, can easily be extended to non-convex optimization and one could mention an infinite number of papers where this has been suggested; see for instance the references in Hong, Luo and Razaviyayn (Reference Hong, Luo and Razaviyayn2015). Some structural conditions which guarantee convergence to a critical point (of the Lagrangian) are given in a few recent papers (Chartrand and Wohlberg Reference Chartrand and Wohlberg2013, Magnússon, Chathuranga Weeraddana, Rabbat and Fischione Reference Magnússon, Chathuranga Weeraddana, Rabbat and Fischione2014, Hong et al. Reference Hong, Luo and Razaviyayn2015, Wang, Yin and Zeng Reference Wang, Yin and Zeng2015), sometimes involving more than two blocks. For instance, with such an algorithm one can easily tackle the non-convex variant of (2.6),
 $$\begin{eqnarray}\min _{u}{\it\lambda}{\it\varphi}(\text{D}u)+\displaystyle \frac{1}{2}\Vert u-u^{\diamond }\Vert ^{2},\end{eqnarray}$$
 with  ${\it\varphi}(\cdot )=\Vert \cdot \Vert _{p,q}$ for
  $q\in [0,1)$ and either
  $p=2$ or
  $p=q$, or another similar non-convex function with sublinear growth. This formulation dates back at least to Geman and Geman (Reference Geman and Geman1984), Geman and Reynolds (Reference Geman and Reynolds1992) and Blake and Zisserman (Reference Blake and Zisserman1987) (which motivated Mumford and Shah Reference Mumford and Shah1989). However, it is often considered that the benefit of using such a formulation is not obvious with respect to the computationally simpler model (2.6). The deblurring model (2.7) can be extended in the same way.
It is clear that the ADMM or PDHG algorithms are still possible to implement for this problem, once we know how to compute the proximity operator
 $$\begin{eqnarray}\bar{\mathbf{p}}\mapsto \arg \min _{\mathbf{p}}{\it\varphi}(\mathbf{p})+\displaystyle \frac{1}{2{\it\tau}}\Vert \mathbf{p}-\bar{\mathbf{p}}\Vert ^{2},\end{eqnarray}$$
 at least for sufficiently large  ${\it\tau}$. Here, an interesting remark is that if the Hessian of
  ${\it\varphi}$ is bounded from below (
 ${\it\varphi}$ is ‘semiconvex’), then this problem is strongly convex for sufficiently small
  ${\it\tau}$ and has a unique solution. This is the case considered in Magnússon et al. (Reference Magnússon, Chathuranga Weeraddana, Rabbat and Fischione2014) or Möllenhoff et al. (Reference Möllenhoff, Strekalovskiy, Moeller and Cremers2015), for example. However, the method should also converge if this is not satisfied in a bounded set, which is the case for
  $q$-norms with
  $q<1$ (Wang et al. Reference Wang, Yin and Zeng2015): in this case we should select one solution of the proximity operator, which is now possibly multivalued (yet still a monotone operator). In general this operator is not explicitly computable (except for
  $p=0$ – hard thresholding – or
  $p=1/2$), but its solution can be approximated by simple methods (e.g. Newton).
Another interesting non-convex extension of saddle-point methods is Valkonen’s generalization of the PDHG method (Valkonen Reference Valkonen2014), in which the linear operator  $K$ is replaced with a non-linear operator; this is particularly useful for applications to diffusion tensor imaging in MRI.
Example 6.1 (solving non-convex TV-deblurring).
Here we extend Example 5.9 by replacing the total variation regularizer with a non-convex variant. We consider the problem
 $$\begin{eqnarray}\min _{u}{\it\lambda}{\it\varphi}(\text{D}u)+\displaystyle \frac{1}{2}\Vert Au-u^{\diamond }\Vert ^{2}.\end{eqnarray}$$
 The non-convex regularizer  ${\it\varphi}(\mathbf{p})$ with
  $\mathbf{p}=(\mathbf{p}_{1,1},\ldots ,\mathbf{p}_{m,n})$ is given by
 $$\begin{eqnarray}{\it\varphi}(\mathbf{p})=\displaystyle \frac{1}{2}\mathop{\sum }_{i,j}\ln \biggl(1+\displaystyle \frac{|\mathbf{p}_{i,j}|_{2}^{2}}{{\it\mu}^{2}}\biggr),\end{eqnarray}$$
 where  ${\it\mu}>0$ is a parameter.
Image deblurring using a non-convex variant of the total variation. The plot shows the convergence of the primal energy for the non-convex TV model using ADMM and iPiano. In order to improve the presentation in the plot, we have subtracted a strict lower bound from the primal energy. ADMM is faster at the beginning but iPiano finds a slightly lower energy.

In what follows, we consider two different approaches to minimizing the non-convex image deblurring problem. In our first approach we consider a non-convex extension of the ADMM algorithm, and hence we restrict ourselves to exactly the same setting as in Example 5.9. Observe that the proximity operator of  ${\it\tau}{\it\lambda}{\it\varphi}$ is the (unique, if
  ${\it\tau}$ is sufficiently small) solution of
 $$\begin{eqnarray}\displaystyle \frac{{\it\tau}{\it\lambda}}{{\it\mu}^{2}}\displaystyle \frac{\mathbf{p}_{i,j}}{1+{\textstyle \frac{|\mathbf{p}_{i,j}|_{2}^{2}}{{\it\mu}^{2}}}}+\mathbf{p}_{i,j}=\bar{\mathbf{p}}_{i,j}\end{eqnarray}$$
 (for all pixels  $i,j$), which we can compute here using a fixed point (Newton) iteration, or by solving a third-order polynomial.
Image deblurring using non-convex functions after  $150$ iterations. (a, b) Results of the non-convex TV-deblurring energy obtained from ADMM and iPiano. (c) Result obtained from the non-convex learned energy, and (d) convolution filters
  $D_{k}$ sorted by their corresponding
  ${\it\lambda}_{k}$ value (in descending order) used in the non-convex learned model. Observe that the learned non-convex model leads to a significantly better PSNR value.

The second approach is based on directly minimizing the primal objective using the iPiano algorithm (Algorithm 11). We perform a forward–backward splitting by taking explicit steps with respect to the (differentiable) regularizer 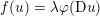 $f(u)={\it\lambda}{\it\varphi}(\text{D}u)$, and perform a backward step with respect to the data term
  $g(u)={\textstyle \frac{1}{2}}\Vert Au-u^{\diamond }\Vert ^{2}$. The gradient with respect to the regularization term is given by
 $$\begin{eqnarray}{\rm\nabla}f(u)=\displaystyle \frac{{\it\lambda}}{{\it\mu}^{2}}\text{D}^{\ast }\tilde{\mathbf{p}},\end{eqnarray}$$
 where  $\tilde{\mathbf{p}}$ is of the form
  $\tilde{\mathbf{p}}=(\tilde{\mathbf{p}}_{1,1},\ldots ,\tilde{\mathbf{p}}_{m,n})$, and
 $$\begin{eqnarray}\tilde{\mathbf{p}}_{i,j}=\displaystyle \frac{(\text{D}u)_{i,j}}{1+{\textstyle \frac{|(\text{D}u)_{i,j}|_{2}^{2}}{{\it\mu}^{2}}}}.\end{eqnarray}$$
The gradient is Lipschitz-continuous with Lipschitz constant
 $$\begin{eqnarray}L\leq \displaystyle \frac{{\it\lambda}}{{\it\mu}^{2}}\Vert \text{D}\Vert ^{2}\leq \displaystyle \frac{8{\it\lambda}}{{\it\mu}^{2}}.\end{eqnarray}$$
 The proximal map with respect to the data term  $g(u)$ can be easily implemented using the FFT. We used the following parameter settings for the iPiano algorithm:
  ${\it\beta}=0.7$ and
  ${\it\alpha}=2(1-{\it\beta})/L$.
Moreover, we implemented a variant of (6.5), where we have replaced the non-convex TV regularizer with a learned regularizer of the form
 $$\begin{eqnarray}\mathop{\sum }_{k=1}^{K}{\it\lambda}_{k}{\it\varphi}(D_{k}u),\end{eqnarray}$$
 where the parameters  ${\it\lambda}_{k}>0$, and the linear operators
  $D_{k}$ (convolution filters, in fact) are learned from natural images using bilevel optimization. We used the 48 filters of size
  $7\times 7$ obtained by Chen et al. (Reference Chen, Ranftl and Pock2014b); see also Figure 6.2. We again minimize the resulting non-convex objective function using the iPiano algorithm.
Figure 6.1 compares the performance of the ADMM algorithm with that of the iPiano algorithm, using the image from Example 2.2. We used the parameter settings  ${\it\lambda}=1/5000$ and
  ${\it\mu}=0.1$. One can observe that ADMM converges faster but iPiano is able to find a slightly lower energy. This is explained by the ability of the iPiano algorithm to overcome spurious stationary points by making use of an inertial force. Figure 6.2 shows the results obtained from the non-convex learned regularizer. The PSNR values show that the learned regularizer leads to significantly better results, of course at a higher computational cost.
7 Applications
In the rest of the paper we will show how the algorithms presented so far can be used to solve a number of interesting problems in image processing, computer vision and learning. We start by providing some theoretical background on the total variation and some extensions.
7.1 Total variation
In the continuous setting, the idea of the ROF model is to minimize the following energy in the space of functions with bounded variation:
 $$\begin{eqnarray}\displaystyle \min _{u}{\it\lambda}\int _{{\rm\Omega}}|Du|+\displaystyle \frac{1}{2}\int _{{\rm\Omega}}(u(x)-u^{\diamond }(x))^{2}\text{d}x, & & \displaystyle\end{eqnarray}$$
 where  ${\rm\Omega}$ is the image domain,
  $u^{\diamond }$ is a given (noisy) image and
  ${\it\lambda}>0$ is a regularization parameter. The term
  $\int _{{\rm\Omega}}|Du|$ in the energy is the total variation (TV) of the image
  $u$ and the gradient operator
  $D$ is understood in its distributional sense. A standard way to define the total variation is by duality, as follows, assuming
  ${\rm\Omega}\subset \mathbb{R}^{d}$ is a
  $d$-dimensional open set:
 $$\begin{eqnarray}\displaystyle & & \displaystyle \int _{{\rm\Omega}}|Du|\nonumber\\ \displaystyle & & \displaystyle \qquad :=\sup \biggl\{-\int _{{\rm\Omega}}u(x)\,\text{div}\,{\it\varphi}(x)\text{d}x:{\it\varphi}\in C_{c}^{\infty }({\rm\Omega};\mathbb{R}^{d}),\,|{\it\varphi}(x)|\leq 1,\,\forall x\in {\rm\Omega}\biggr\}\end{eqnarray}$$
 and we say that  $u$ has bounded variation if and only if this quantity is finite. The space
 $$\begin{eqnarray}\text{BV}({\rm\Omega})=\biggl\{u\in L^{1}({\rm\Omega}):\int _{{\rm\Omega}}|Du|<+\infty \biggr\},\end{eqnarray}$$
 of functions with bounded variation, equipped with the norm  $\Vert u\Vert _{\text{BV}}=\Vert u\Vert _{L^{1}}+\int _{{\rm\Omega}}|Du|$, is a Banach space; see Giusti (Reference Giusti1984), Ambrosio, Fusco and Pallara (Reference Ambrosio, Fusco and Pallara2000) or Evans and Gariepy (Reference Evans and Gariepy1992) for details. The function
  $|\cdot |$ could in fact be any norm, in which case the constraint on
  ${\it\varphi}(x)$ in (7.2) should use the polar norm
 $$\begin{eqnarray}|{\it\xi}|^{\circ }:=\sup _{|x|\leq 1}\langle {\it\xi},x\rangle\end{eqnarray}$$
 and read  $|{\it\varphi}(x)|^{\circ }\leq 1$ for all
  $x$. The most common choices (at least for grey-scale images) are (possibly weighted) 2- and 1-norms. The main advantage of the total variation is that it allows for sharp jumps across hypersurfaces, for example edges or boundaries in the image, while being a convex functional, in contrast to other Sobolev norms. For smooth images
  $u$ we easily check from (7.2) (integrating by parts) that it reduces to the
  $L^{1}$-norm of the image gradient, but it is also well defined for non-smooth functions. For characteristic functions of sets it measures the length or surface of the boundary of the set inside
  ${\rm\Omega}$ (this again is easy to derive, at least for smooth sets, from (7.2) and Green’s formula). This also makes the total variation interesting for geometric problems such as image segmentation.
Concerning the data-fitting term, numerous variations of (7.1) have been proposed in the literature. A simple modification of the ROF model is to replace the squared data term with an  $L^{1}$-norm (Nikolova Reference Nikolova2004, Chan and Esedoḡlu Reference Chan and Esedoḡlu2005):
 $$\begin{eqnarray}\min _{u}{\it\lambda}\int _{{\rm\Omega}}|Du|+\int _{{\rm\Omega}}|u(x)-u^{\diamond }(x)|\text{d}x.\end{eqnarray}$$
 The resulting model, called the ‘TV- $\ell _{1}$ model’, turns out to have interesting new properties. It is purely geometric in the sense that the energy decomposes on the level set of the image. Hence, it can be used to remove structures of an image of a certain scale, and the regularization parameter
  ${\it\lambda}$ can be used for scale selection. The TV-
 $\ell _{1}$ model is also effective in removing impulsive (outlier) noise from images.
In the presence of Poisson noise, a popular data-fitting term (justified by a Bayesian approach) is given by the generalized Kullback–Leibler divergence, which is the Bregman distance of the Boltzmann–Shannon entropy (Steidl and Teuber Reference Steidl and Teuber2010, Dupé, Fadili and Starck Reference Dupé, Fadili and Starck2012). This yields the following TV-entropy model:
 $$\begin{eqnarray}\min _{u(x)>0}{\it\lambda}\int _{{\rm\Omega}}|Du|+\int _{{\rm\Omega}}u(x)-u^{\diamond }(x)\log u(x)\text{d}x.\end{eqnarray}$$
This model has applications in synthetic aperture radar (SAR) imaging, for example.
Contrast invariance of the TV- $\ell _{1}$ model. (a–d) Result of the TV-
 $\ell _{1}$ model for varying values of the regularization parameter
  ${\it\lambda}$. (e–h) Result of the ROF model for varying values of
  ${\it\lambda}$. Observe the morphological property of the TV-
 $\ell _{1}$ model. Structures are removed only with respect to their size, but independent of their contrast.
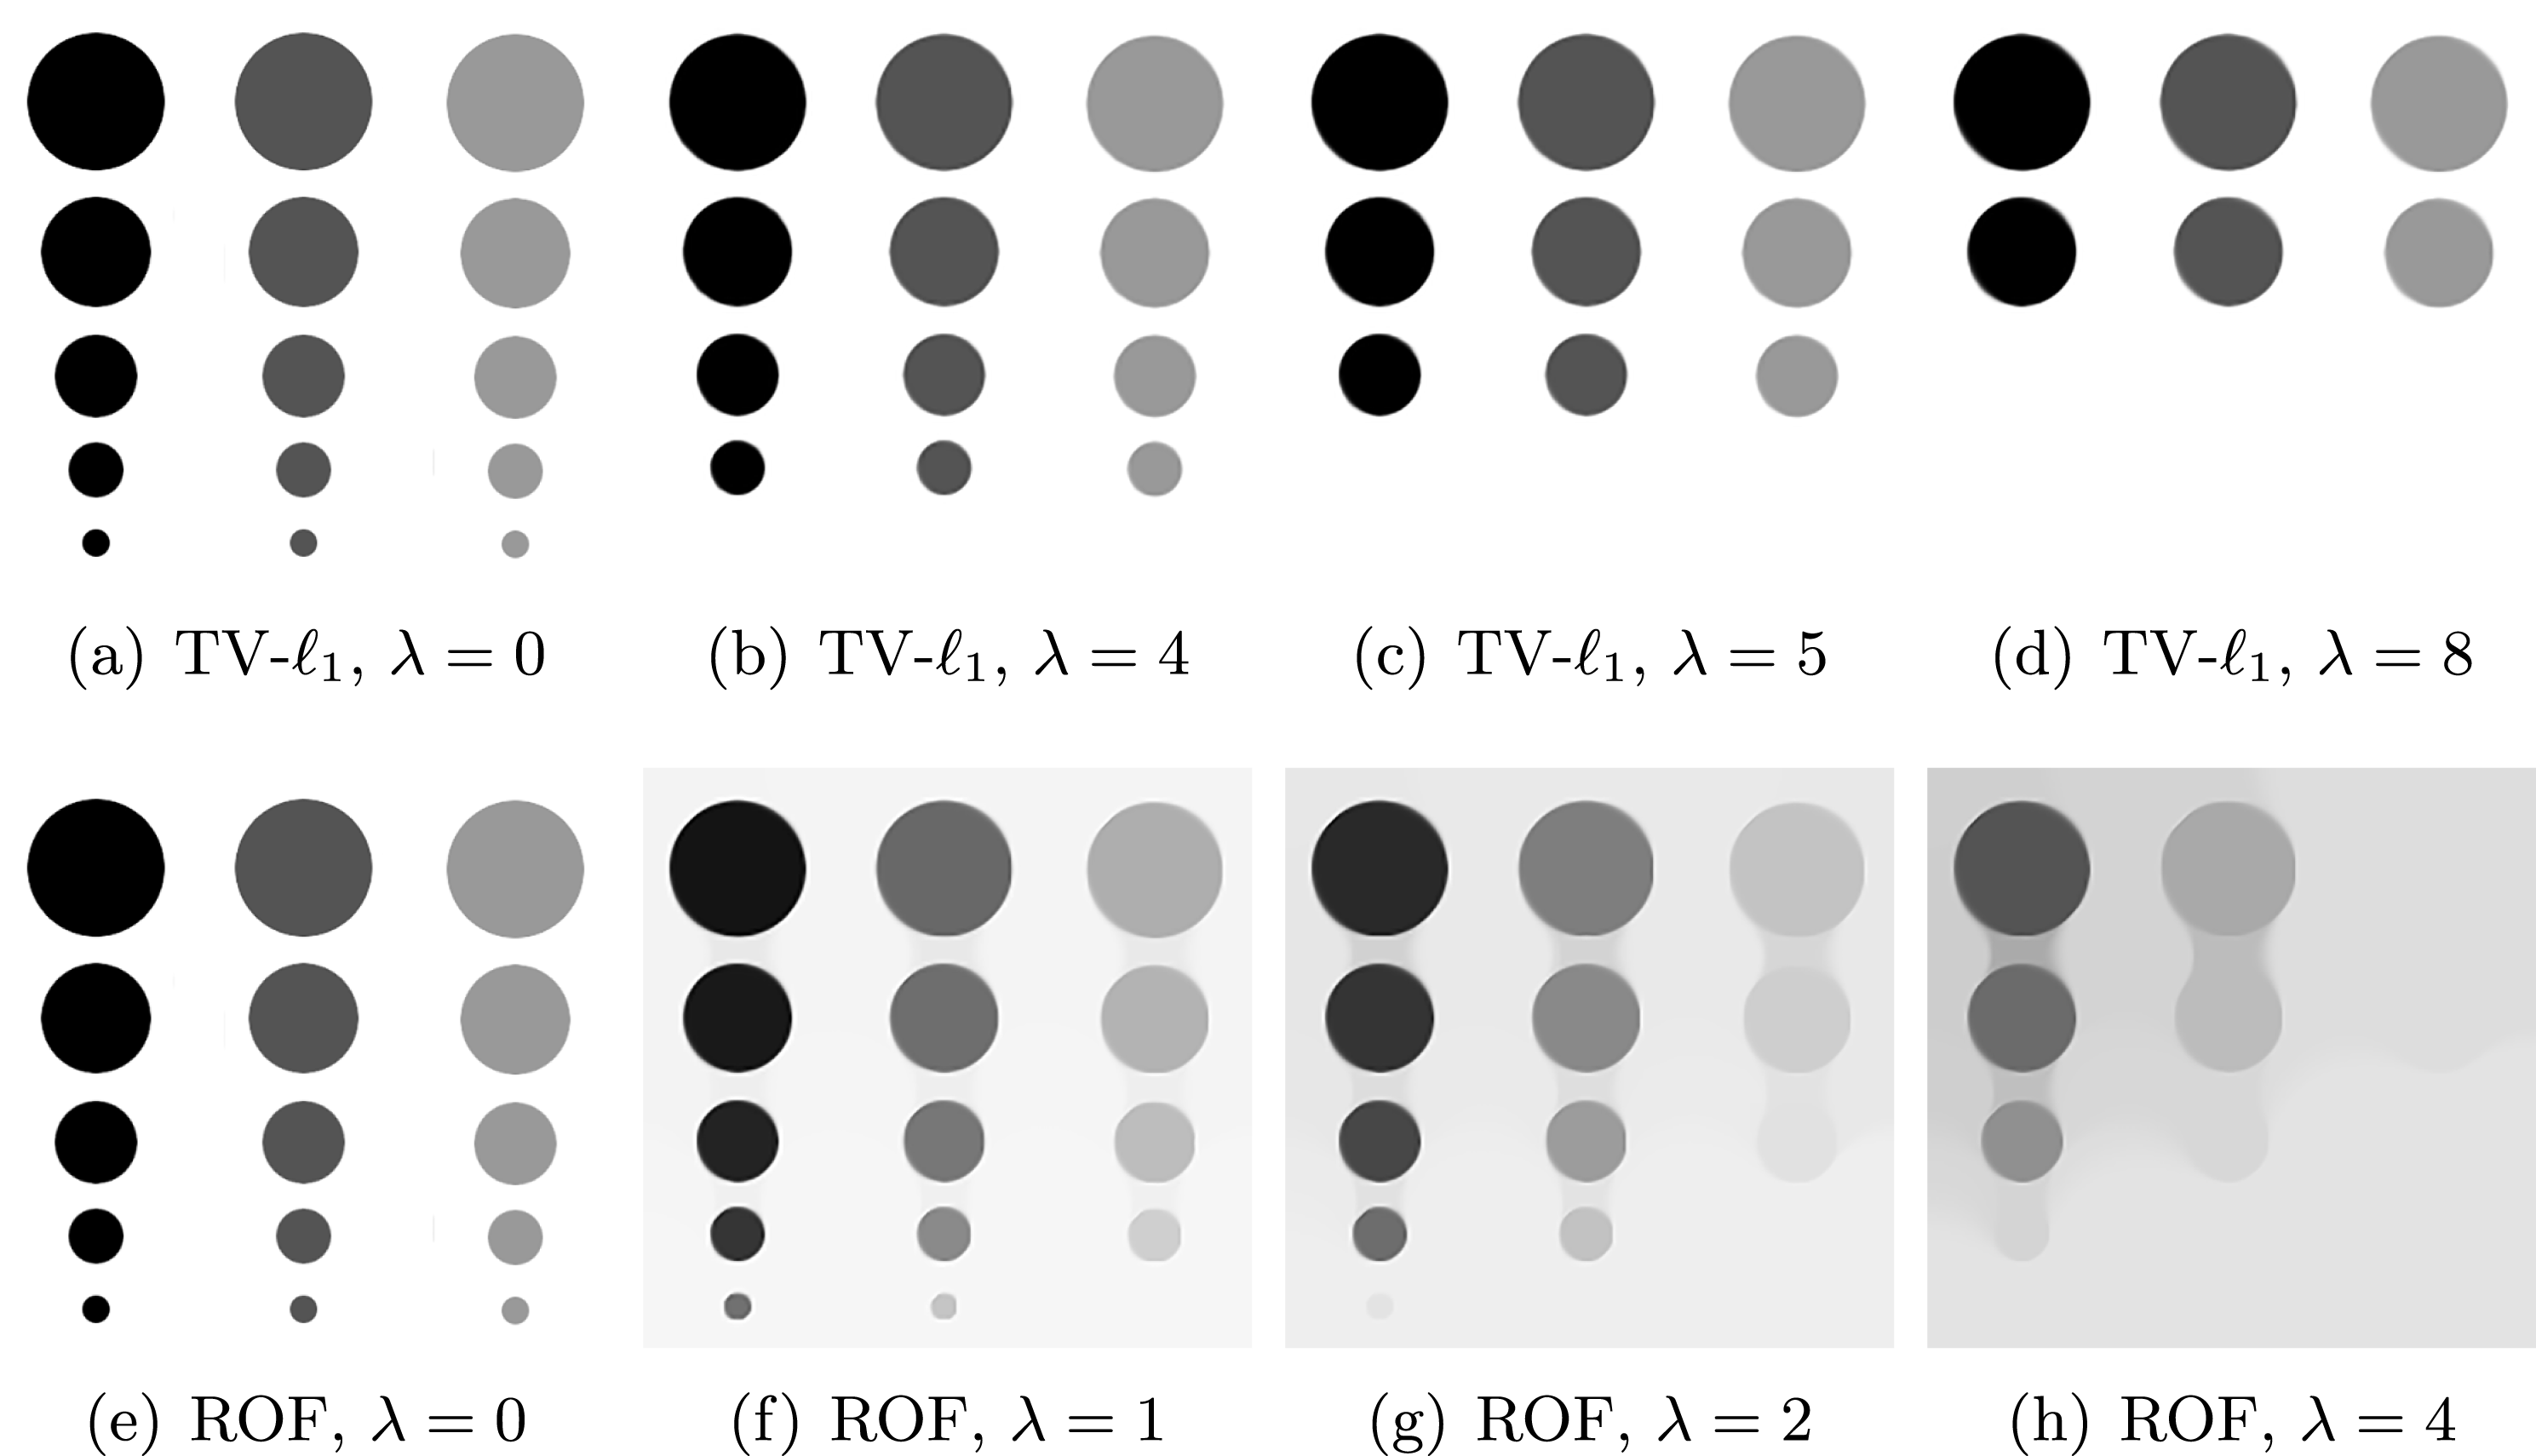
We have already detailed the discretization of TV models in (2.6) and we have shown that an efficient algorithm to minimize total variation models is the PDHG algorithm (Algorithm 6 and its variants). A saddle point formulation of discrete total variation models that summarizes the different aforementioned data-fitting terms is as follows:
 $$\begin{eqnarray}\min _{u}\max _{\mathbf{p}}\langle \text{D}u,\mathbf{p}\rangle +g(u)-{\it\delta}_{\{\Vert \cdot \Vert _{2,\infty }\leq {\it\lambda}\}}(\mathbf{p}),\end{eqnarray}$$
 where  $\text{D}:\mathbb{R}^{m\times n}\rightarrow \mathbb{R}^{m\times n\times 2}$ is the finite difference approximation of the gradient operator defined in (2.4), and
  $\mathbf{p}=(p_{1},p_{2})\in \mathbb{R}^{m\times n\times 2}$ is the dual variable. Let
  $u^{\diamond }\in \mathbb{R}^{m\times n}$ be a given noisy image, then for
  $g(u)={\textstyle \frac{1}{2}}\Vert u-u^{\diamond }\Vert ^{2}$ we obtain the ROF model, for
  $g(u)=\Vert u-u^{\diamond }\Vert _{1}$ we obtain the TV-
 $\ell _{1}$ model and for
  $g(u)=\sum _{i,j}u_{i,j}-u_{i,j}^{\diamond }\log u_{i,j}+{\it\delta}_{(0,\infty )}(u)$ we obtain the TV-entropy model. The implementation of the models using the PDHG algorithm only differs in the implementation of the proximal operators
  $\hat{u} =\text{prox}_{{\it\tau}g}(\tilde{u} )$. For all
  $1\leq i\leq m$,
  $1\leq j\leq n$ the respective proximal operators are given by
 $$\begin{eqnarray}\displaystyle \begin{array}{@{}lr@{}}\hat{u} _{i,j}=\displaystyle \frac{\tilde{u} _{i,j}+{\it\tau}u_{i,j}^{\diamond }}{1+{\it\tau}} & (\text{ROF}),\\ \hat{u} _{i,j}=u_{i,j}^{\diamond }+\max \{0,|\tilde{u} _{i,j}-u_{i,j}^{\diamond }|-{\it\tau}\}\cdot \text{sgn}(\tilde{u} _{i,j}-u_{i,j}^{\diamond }) & (\text{TV}-\ell _{1}),\\ \hat{u} _{i,j}=\max \left\{0,\displaystyle \frac{\tilde{u} _{i,j}-{\it\tau}+\sqrt{(\tilde{u} _{i,j}-{\it\tau})^{2}+4{\it\tau}u_{i,j}^{\diamond }}}{2}\right\} & (\text{TV-entropy}).\end{array} & & \displaystyle \nonumber\end{eqnarray}$$
 Figure 7.1 demonstrates the contrast invariance of the TV- $\ell _{1}$ model and compares it to the ROF model. Both models were minimized using Algorithm 6 (PDHG) or Algorithm 8. Gradually increasing the regularization parameter
  ${\it\lambda}$ in the TV-
 $\ell _{1}$ model has the effect that increasingly larger structures are removed from the image. Observe that the structures are removed only with respect to their size and not with respect to their contrast. In the ROF model, however, scale and contrast are mixed such that gradually increasing the regularization parameter results in removing structures with increased size and contrast.
Total variation based image denoising in the presence of Poisson noise. (a) Aerial view of Graz, Austria, (b) noisy image degraded by Poisson noise. (c) Result using the ROF model, and (d) result using the TV-entropy model. One can see that the TV-entropy model leads to improved results, especially in dark regions, and exhibits better contrast.
Figure 7.2 compares the ROF model with the TV-entropy model for image denoising in the presence of Poisson noise. The noisy image of size  $480\times 640$ pixels has been generated by degrading an aerial image of Graz, Austria, with Poisson noise with parameter the image values scaled between
  $0$ and
  $50$. Both models have been minimized using the PDHG algorithm. It can be observed that the TV-entropy model adapts better to the noise properties of the Poisson noise and hence leads to better preservation of dark structures and exhibits better contrast.
7.2 Total generalized variation
There have been attempts to generalize the total variation to higher-order smoothness, for example using the notion of infimal convolution Chambolle and Lions (Reference Chambolle and Lions1995, Reference Chambolle and Lions1997). One generalization is the so-called total generalized variation (TGV) proposed in Bredies, Kunisch and Pock (Reference Bredies, Kunisch and Pock2010). An image denoising model based on second-order total generalized variation (TGV $^{2}$) is given by
 $$\begin{eqnarray}\min _{u}\inf _{v}{\it\lambda}_{1}\int _{{\rm\Omega}}|Du-v|+{\it\lambda}_{0}\int _{{\rm\Omega}}|Dv|+\displaystyle \frac{1}{2}\int _{{\rm\Omega}}(u(x)-u^{\diamond }(x))^{2}\text{d}x,\end{eqnarray}$$
 where  $u\in \text{BV}({\rm\Omega})$,
  $v\in \text{BV}({\rm\Omega};\mathbb{R}^{2})$, and
  ${\it\lambda}_{0,1}>0$ are tuning parameters. The idea of TGV
 $^{2}$ is to force the gradient
  $Du$ of the image to deviate only on a sparse set from a vector field
  $v$ which itself has sparse gradient. This will get rid of the staircasing effect on affine parts of the image, while still preserving the possibility of having sharp edges. The discrete counterpart of (7.4) can be obtained by applying the same standard discretization techniques as in the case of the ROF model.
We introduce the discrete scalar images  $u,u^{\diamond }\in \mathbb{R}^{m\times n}$ and vectorial image
  $\boldsymbol{v}=(v_{1},v_{2})\in \mathbb{R}^{m\times n\times 2}$. The discrete version of the TGV
 $^{2}$ model is hence given by
 $$\begin{eqnarray}\min _{u,\boldsymbol{v}}{\it\lambda}_{1}\Vert \text{D}u-\boldsymbol{v}\Vert _{2,1}+{\it\lambda}_{0}\Vert \mathbf{D}\boldsymbol{v}\Vert _{2,1}+\displaystyle \frac{1}{2}\Vert u-u^{\diamond }\Vert ^{2},\end{eqnarray}$$
 where  $\mathbf{D}:\mathbb{R}^{m\times n\times 2}\rightarrow \mathbb{R}^{m\times n\times 4}$ is again a finite difference operator that computes the Jacobian (matrix) of the vectorial image
  $\boldsymbol{v}$, which we treat as a vector here. It can be decomposed into
  $\mathbf{D}\boldsymbol{v}=(\text{D}v_{1},\text{D}v_{2})$, where
  $\text{D}$ is again the standard finite difference operator introduced in (2.4). The discrete versions of the total first- and second-order variations are given by
 $$\begin{eqnarray}\displaystyle \Vert \text{D}u-\boldsymbol{v}\Vert _{2,1} & = & \displaystyle \mathop{\sum }_{i=1,j=1}^{m,n}\sqrt{((\text{D}u)_{i,j,1}-v_{i,j,1})^{2}+((\text{D}u)_{i,j,2}-v_{i,j,2})^{2}},\nonumber\\ \displaystyle \Vert \mathbf{D}\boldsymbol{v}\Vert _{2,1} & = & \displaystyle \mathop{\sum }_{i=1,j=1}^{m,n}\sqrt{(\text{D}v_{1})_{i,j,1}^{2}+(\text{D}v_{1})_{i,j,2}^{2}+(\text{D}v_{2})_{i,j,1}^{2}+(\text{D}v_{2})_{i,j,2}^{2}}.\nonumber\end{eqnarray}$$
 In order to minimize the discrete TGV $^{2}$ model, we rewrite it as the saddle-point problem
 $$\begin{eqnarray}\displaystyle & & \displaystyle \min _{u,\boldsymbol{v}}\max _{\mathbf{p},\mathbf{q}}\,\langle \text{D}u-\boldsymbol{v},\mathbf{p}\rangle +\langle \mathbf{D}\boldsymbol{v},\mathbf{q}\rangle +\displaystyle \frac{1}{2}\Vert u-u^{\diamond }\Vert ^{2}\nonumber\\ \displaystyle & & \displaystyle \qquad -{\it\delta}_{\{\Vert \cdot \Vert _{2,\infty }\leq {\it\lambda}_{1}\}}(\mathbf{p})-{\it\delta}_{\{\Vert \cdot \Vert _{2,\infty }\leq {\it\lambda}_{0}\}}(\mathbf{q}),\nonumber\end{eqnarray}$$
 where  $\mathbf{p}=(p_{1},p_{2})\in \mathbb{R}^{m\times n\times 2}$ and
  $\mathbf{q}=(q_{1},q_{2},q_{3},q_{4})\in \mathbb{R}^{m\times n\times 4}$ are the dual variables. Combining
  $(u,\boldsymbol{v})$, and
  $(\mathbf{p},\mathbf{q})$ into the primal and dual vectors, we can see that the above saddle-point problem is exactly of the form (3.10), with
 $$\begin{eqnarray}\displaystyle & \displaystyle K=\left(\begin{array}{@{}cc@{}}\text{D} & -I\\ 0 & \boldsymbol{ D}\end{array}\right)\!,\quad g(u)=\displaystyle \frac{1}{2}\Vert u-u^{\diamond }\Vert ^{2}, & \displaystyle \nonumber\\ \displaystyle & \displaystyle f^{\ast }(\mathbf{p},\mathbf{q})={\it\delta}_{\{\Vert \cdot \Vert _{2,\infty }\leq {\it\lambda}_{1}\}}(\mathbf{p})+{\it\delta}_{\{\Vert \cdot \Vert _{2,\infty }\leq {\it\lambda}_{0}\}}(\mathbf{q}). & \displaystyle \nonumber\end{eqnarray}$$
 The proximal map with respect to the data term  $g(u)$ is the same as the proximal map of the ROF model. The proximal map with respect to
  $f^{\ast }(\mathbf{p},\mathbf{q})$ reduces to projections onto the respective polar balls, as shown in (4.23). The Lipschitz constant
  $L$ of the operator
  $K$ can be estimated as
  $L=\Vert K\Vert \leq \sqrt{12}$. With this information, the PDHG algorithm can be easily implemented.
Comparison of TV and TGV $^{2}$ denoising. (a) Original input image, and (b) noisy image, where we have added Gaussian noise with standard deviation
  ${\it\sigma}=0.1$. (c) Result obtained from the ROF model, and (d) result obtained by minimizing the TGV
 $^{2}$ model. The main advantage of the TGV
 $^{2}$ model over the ROF model is that it is better at reconstructing smooth regions while still preserving sharp discontinuities.

Figure 7.3 shows a qualitative comparison between TV and TGV $^{2}$ regularization using an image of size
  $399\times 600$. One can see that TGV
 $^{2}$ regularization leads to better reconstruction of the smooth region in the background while still preserving the sharp discontinuities of the bird. TVregularization, on the other hand, suffers from the typical staircasing effect in the background region.
7.3 Vectorial total variation
Since the seminal paper ‘Color TV’ (Blomgren and Chan Reference Blomgren and Chan1998), different extensions of the total variation to vector-valued images have been proposed. The most straightforward approach would be to apply the scalar total variation to each colour channel individually, but this clearly ignores the coupling between the colour channels. Assume we are given a vector-valued image  $u=(u_{1},\ldots ,u_{k})$ with
  $k$ channels. A proper generalization of the total variation to vector-valued images is now to define a suitable matrix norm that acts on the distributional Jacobian
  $Du$. Assume that our image domain
  ${\rm\Omega}$ is a subset of
  $\mathbb{R}^{d}$, where
  $d$ is the dimension of the image, and also assume for the moment that the image function
  $u$ is sufficiently smooth that the Jacobian
  $J(x)={\rm\nabla}u(x)$ exists. An interesting class of matrix norms is given by
  $p$-Schatten norms, which are defined as
 $$\begin{eqnarray}\displaystyle |J(x)|_{{\mathcal{S}}_{p}} & = & \displaystyle \biggl(\mathop{\sum }_{n=1}^{\min \{d,k\}}{\it\sigma}_{n}^{p}(J(x))\biggr)^{1/p},\quad \text{for all}~p\in [1,\infty ),\nonumber\\ \displaystyle |J(x)|_{{\mathcal{S}}_{\infty }} & = & \displaystyle \max _{n\in \{1,\ldots ,\min \{d,k\}\}}{\it\sigma}_{n}(J(x)),\nonumber\end{eqnarray}$$
 where the  ${\it\sigma}_{n}(J(x))$ denote the singular values of the Jacobian
  $J(x)$ (i.e., the square roots of the eigenvalues of
  $J(x)J(x)^{\ast }$ or
  $J(x)^{\ast }J(x)$).
If  $p=2$, the resulting norm is equivalent to the Frobenius norm, which corresponds to one of the most classical choices (Bresson and Chan Reference Bresson and Chan2008), though other choices might also be interesting (Sapiro and Ringach Reference Sapiro and Ringach1996, Chambolle Reference Chambolle1994). For
  $p=1$ (Duran, Möller, Sbert and Cremers Reference Duran, Möller, Sbert and Cremers2016b, Duran, Moeller, Sbert and Cremers Reference Duran, Moeller, Sbert and Cremers2016a), the norm is equivalent to the nuclear norm and hence forces the Jacobian to be of low rank. The comparisons in Duran et al. (Reference Duran, Moeller, Sbert and Cremers2016a) confirm the superior performance of this choice. If
  $p=\infty$, the resulting norm is the operator norm of the Jacobian, penalizing its largest singular value, which turns out to produce more spurious colours than the previous choice (Goldluecke, Strekalovskiy and Cremers Reference Goldluecke, Strekalovskiy and Cremers2012).
Using the dual formulation of the total variation (7.2), we can readily define a vectorial version of the total variation based on  $p$-Schatten norms which is now valid also for images in the space of functions with bounded variation:
 $$\begin{eqnarray}\displaystyle & & \displaystyle \int _{{\rm\Omega}}|Du|_{{\mathcal{S}}_{p}}=\nonumber\\ \displaystyle & & \displaystyle \quad \sup \bigg\{-\int _{{\rm\Omega}}u(x)\cdot \text{div}\,{\it\varphi}(x)\text{d}x:{\it\varphi}\in C^{\infty }({\rm\Omega};\mathbb{R}^{d\times k}),\,|{\it\varphi}(x)|_{{\mathcal{S}}_{q}}\leq 1,\,\forall x\in {\rm\Omega}\bigg\},\end{eqnarray}$$
 where  $q$ is the parameter of the polar norm associated with the parameter
  $p$ of the Schatten norm and is given by
  $1/p+1/q=1$. Based on that we can define a vectorial ROF model as
 $$\begin{eqnarray}\min _{u}{\it\lambda}\int _{{\rm\Omega}}|Du|_{{\mathcal{S}}_{p}}+\displaystyle \frac{1}{2}\int _{{\rm\Omega}}|u(x)-u^{\diamond }(x)|_{2}^{2}\text{d}x.\end{eqnarray}$$
Denoising a colour image using the vectorial ROF model. (a) Original RGB colour image, and (b) its noisy variant, where Gaussian noise with standard deviation  ${\it\sigma}=0.1$ has been added. (c) Solution of the vectorial ROF model using the Frobenius norm, and (d) solution using the nuclear norm. In smooth regions the two variants lead to similar results, while in textured regions the nuclear norm leads to significantly better preservation of small details (see the close-up views).

The discretization of the vectorial ROF model is similar to the discretization of the standard ROF model. We consider a discrete colour image  $\mathbf{u}=(u_{r},u_{g},u_{b})\in \mathbb{R}^{m\times n\times 3}$, where
  $u_{r},u_{g},u_{b}\in \mathbb{R}^{m\times n}$ denote the red, green, and blue colour channels, respectively. We also consider a finite difference operator
  $\mathbf{D}:\mathbb{R}^{m\times n\times 3}\rightarrow \mathbb{R}^{m\times n\times 2\times 3}$ given by
  $\mathbf{D}\mathbf{u}=(\text{D}u_{r},\text{D}u_{g},\text{D}u_{b})$, where
  $\text{D}$ is again the finite difference operator defined in (2.4). The discrete colour ROF model based on the
  $1$-Schatten norm is given by
 $$\begin{eqnarray}\min _{\mathbf{u}}{\it\lambda}\Vert \mathbf{D}\mathbf{u}\Vert _{{\mathcal{S}}_{1},1}+\displaystyle \frac{1}{2}\Vert \mathbf{u}-\mathbf{u}^{\diamond }\Vert ^{2}.\end{eqnarray}$$
The vectorial ROF model can be minimized either by applying Algorithm 5 to its dual formulation or by applying Algorithm 8 to its saddle-point formulation. Let us consider the saddle-point formulation:
 $$\begin{eqnarray}\min _{\mathbf{u}}\max _{\mathbf{P}}\langle \mathbf{D}\mathbf{u},\mathbf{P}\rangle +\displaystyle \frac{1}{2}\Vert \mathbf{u}-\mathbf{u}^{\diamond }\Vert ^{2}+{\it\delta}_{\{\Vert \cdot \Vert _{{\mathcal{S}}_{\infty },\infty }\leq {\it\lambda}\}}(\mathbf{P}),\end{eqnarray}$$
 where  $\mathbf{P}\in \mathbb{R}^{m\times n\times 2\times 3}$ is the tensor-valued dual variable, hence the dual variable can also be written as
  $\mathbf{P}=(\mathbf{P}_{1,1},\ldots ,\mathbf{P}_{m,n})$, where
  $\mathbf{P}_{i,j}\in \mathbb{R}^{2\times 3}$ is a
  $2\times 3$ matrix. Hence, the polar norm ball
  $\{\Vert \mathbf{P}\Vert _{{\mathcal{S}}_{\infty },\infty }\leq {\it\lambda}\}$ is also given by
 $$\begin{eqnarray}\{\mathbf{P}=(\mathbf{P}_{1,1},\ldots ,\mathbf{P}_{m,n}):|\mathbf{P}_{i,j}|_{{\mathcal{S}}_{\infty }}\leq {\it\lambda},~\text{for all}~i,j\},\end{eqnarray}$$
 hence the set of variables  $\mathbf{P}$, whose tensor-valued components
  $\mathbf{P}_{i,j}$ have an operator norm less than or equal to
  ${\it\lambda}$. To compute the projection to the polar norm ball we can use the singular value decomposition (SVD) of the matrices. Let
  $U,S,V$ with
  $U\in \mathbb{R}^{2\times 2}$, let
  $S\in \mathbb{R}^{2\times 3}$ with
  $S=\text{diag}(s_{1},s_{2})$, and let
  $V\in \mathbb{R}^{3\times 3}$ be an SVD of
  $\tilde{\mathbf{P}}_{i,j}$, that is,
  $\tilde{\mathbf{P}}_{i,j}=USV^{T}$. As shown by Cai, Candès and Shen (Reference Cai, Candès and Shen2010), the orthogonal projection of
  $\tilde{\mathbf{P}}_{i,j}$ to the polar norm ball
  $\{\Vert \mathbf{P}\Vert _{{\mathcal{S}}_{\infty },\infty }\leq {\it\lambda}\}$ is
 $$\begin{eqnarray}{\rm\Pi}_{\{\Vert \cdot \Vert _{{\mathcal{S}}_{\infty },\infty }\leq {\it\lambda}\}}(\tilde{\mathbf{P}}_{i,j})=US_{{\it\lambda}}V^{T},\quad S_{{\it\lambda}}=\text{diag}(\min \{s_{1},{\it\lambda}\},\min \{s_{2},{\it\lambda}\}).\end{eqnarray}$$
 Figure 7.4 shows an example of denoising a colour image of size  $384\times 512$ with colour values in the range
  $[0,1]^{3}$. It can be seen that the nuclear norm indeed leads to better results as it forces the colour gradients to be of low rank, promoting better correlation of the colour channels. This can be best observed in textured regions, where the nuclear norm is much better at preserving small details.
7.4 Total variation regularized linear inverse problems
The total variation and its generalizations (e.g. TGV) have also become a popular regularizer for general linear inverse problems such as image deconvolution and image reconstruction in computer tomography (CT) (Sidky, Kao and Pan Reference Sidky, Kao and Pan2006) or magnetic resonance imaging (MRI) (Knoll, Bredies, Pock and Stollberger Reference Knoll, Bredies, Pock and Stollberger2011). The main idea for speeding up MRI reconstructions is via compressed sensing by sparsely sampling the data in the Fourier space. Using direct reconstruction from such undersampled data would clearly lead to strong artifacts. Therefore, a better idea is to consider a total variation regularized problem of the form
 $$\begin{eqnarray}\min _{u}{\it\lambda}\int _{{\rm\Omega}}|Du|+\mathop{\sum }_{c=1}^{C}\displaystyle \frac{1}{2}\Vert {\mathcal{F}}({\it\sigma}_{c}u)-g_{c}\Vert _{2}^{2},\end{eqnarray}$$
 where  ${\mathcal{F}}$ denotes the Fourier transform,
  $g_{c}$,
  $c=1,\ldots ,C$ are multiple channel data obtained from the coils, and
  ${\it\sigma}_{c}$ are the corresponding complex-valued sensitivity estimates. Discretization of the model is straightforward. We consider a complex valued image
  $u\in \mathbb{C}^{m\times n}$ of size
  $m\times n$ pixels and also the usual finite difference approximation
  $\text{D}$ of the gradient operator, as defined in (2.4). We also assume that we are given
  $c=1,\ldots ,C$ discrete versions of the sensitivities
  ${\it\sigma}_{c}\in \mathbb{C}^{m\times n}$ and data
  $g_{c}\in \mathbb{C}^{m\times n}$. The discrete model is given by
 $$\begin{eqnarray}\min _{u}{\it\lambda}\Vert \text{D}u\Vert _{2,1}+\mathop{\sum }_{c=1}^{C}\displaystyle \frac{1}{2}\Vert \text{F}({\it\sigma}_{c}\circ u)-g_{c}\Vert ^{2},\end{eqnarray}$$
 where  $\text{F}:\mathbb{C}^{m\times n}\rightarrow \mathbb{C}^{m\times n}$ denotes the (discrete) fast Fourier transform, and
  $\circ$ denotes the Hadamard product (the element-wise product of the two matrices). In order to minimize the TV-MRI objective function, we first transform the problem into a saddle-point problem:
 $$\begin{eqnarray}\min _{u}\max _{\mathbf{p}}\langle \text{D}u,\mathbf{p}\rangle +\mathop{\sum }_{c=1}^{C}\displaystyle \frac{1}{2}\Vert \text{F}({\it\sigma}_{c}\circ u)-g_{c}\Vert ^{2}-{\it\delta}_{\{\Vert \cdot \Vert _{2,\infty }\leq {\it\lambda}\}}(\mathbf{p}),\end{eqnarray}$$
 where  $\mathbf{p}\in \mathbb{C}^{m\times n\times 2}$ is the dual variable. Observe that we have just dualized the total variation term but kept the data-fitting term
 $$\begin{eqnarray}h(u)=\mathop{\sum }_{c=1}^{C}\displaystyle \frac{1}{2}\Vert \text{F}({\it\sigma}_{c}\circ u)-g_{c}\Vert ^{2}\end{eqnarray}$$
explicitly. The gradient of this fitting term is given by
 $$\begin{eqnarray}{\rm\nabla}h(u)=\overline{{\it\sigma}_{c}}\circ \text{F}^{\ast }(\text{F}({\it\sigma}_{c}\circ u)-g_{c}),\end{eqnarray}$$
 where  $\text{F}^{\ast }$ denotes the adjoint of the Fourier transform and
  $\overline{{\it\sigma}_{c}}$ denotes the complex conjugate of
  ${\it\sigma}_{c}$. Assuming that
  $\text{F}$ is orthonormal and assuming that
  $\Vert {\it\sigma}_{c}\Vert _{\infty }\leq 1$ for all
  $c=1,\ldots ,C$, the Lipschitz constant of
  ${\rm\nabla}h(u)$ is bounded by
  $L_{h}\leq 1$. Following Example 5.7 we can use the ‘Condat–Vũ’ variant (5.6) of the PDHG algorithm that can include explicit gradient steps.
TV regularized reconstruction of one slice of an MRI of a knee from partial Fourier data. (a) Least-squares reconstruction without using total variation regularization, and (b) reconstruction obtained from the total variation regularized reconstruction model.
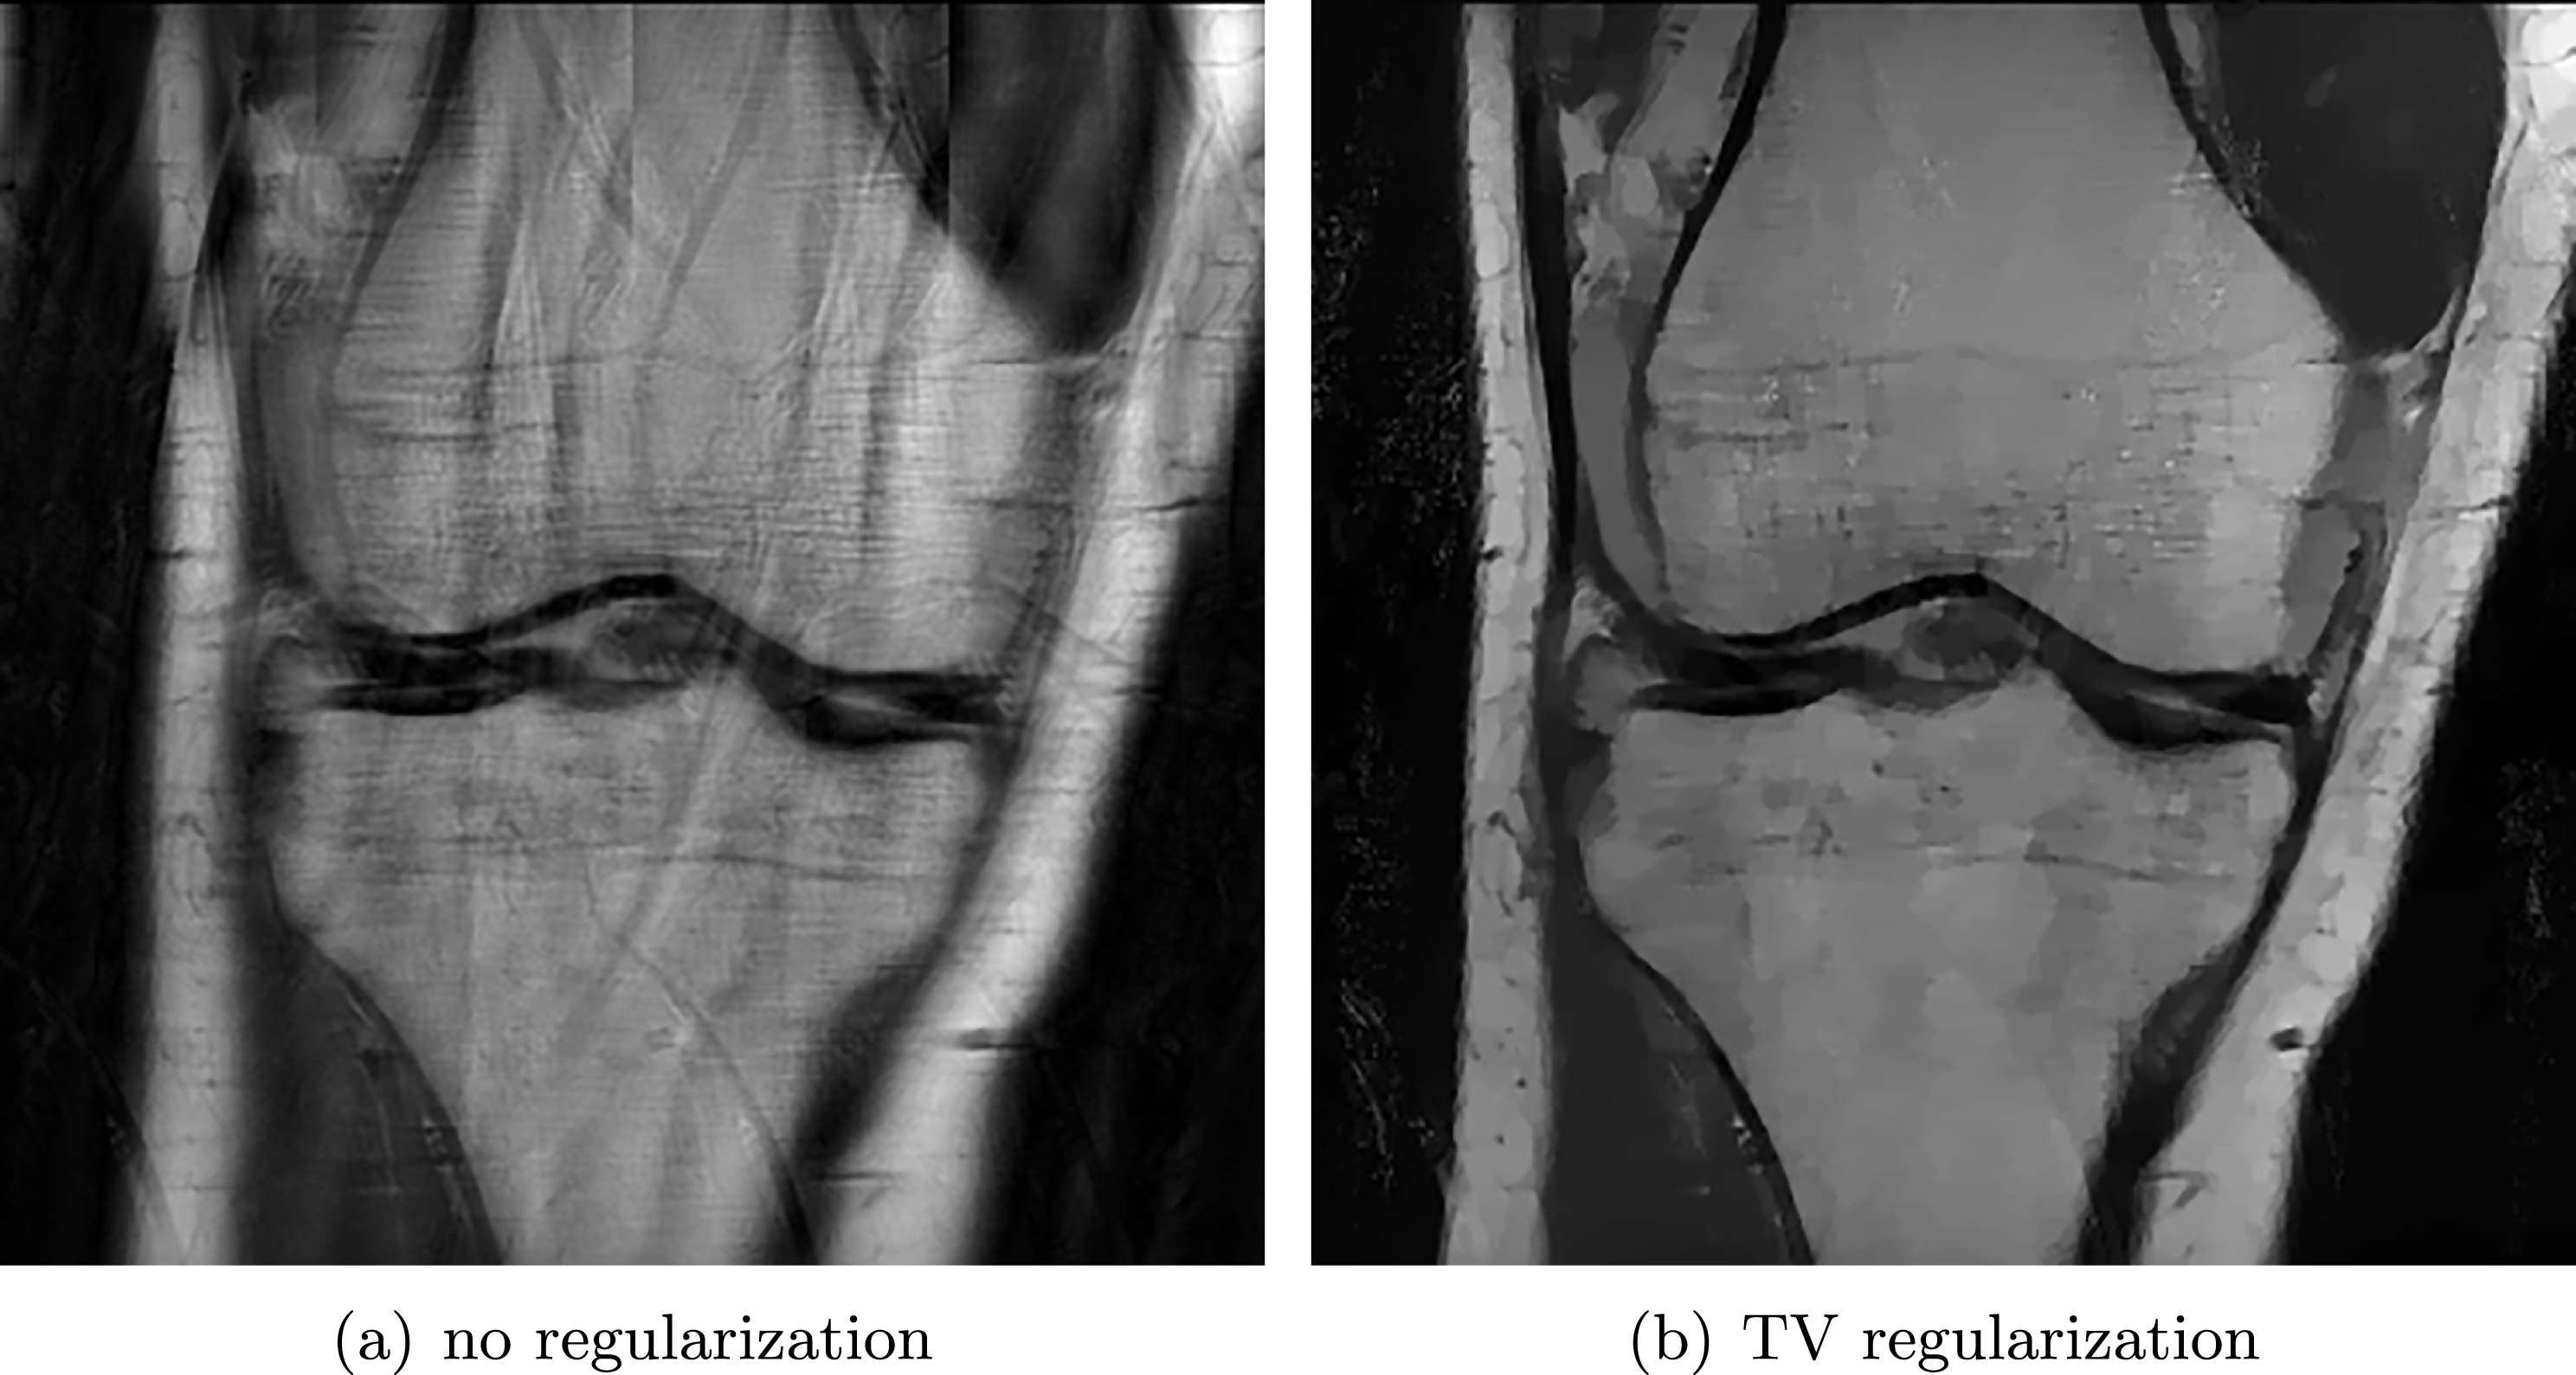
Figure 7.5 shows the TV-MRI model for the reconstruction of a slice of an MRI image of a knee.Footnote 19 Figure 7.5(a) shows the reconstruction of the slice without using total variation regularization and Figure 7.5(b) shows the result based on total variation regularization. Observe that the total variation regularized reconstruction model successfully removes the artifacts introduced by the missing Fourier data.
7.5 Optical flow
In computer vision, total variation regularization has become a very popular choice for optical flow computation. Optical flow is the apparent motion of intensity patterns (caused by objects, structures, surfaces) in a scene. The main underlying assumption of optical flow is the brightness constancy assumption, which states that the intensities of visual structures stay constant over time. Let  $I(x,t)$ be a spatio-temporal intensity function (e.g. a video), defined on
  ${\rm\Omega}\times [0,T]$, where
  ${\rm\Omega}$ is a subset of
  $\mathbb{R}^{d}$ and
  $[0,T]$ with
  $T>0$ is the time domain. The brightness constancy assumption states that
 $$\begin{eqnarray}I(x,t)=I(x+{\rm\Delta}_{x},t+{\rm\Delta}_{t}),\end{eqnarray}$$
 for sufficiently small spatial displacements  ${\rm\Delta}_{x}$ and time differences
  ${\rm\Delta}_{t}$. Assuming the spatio-temporal intensity function is sufficiently smooth, a first-order Taylor expansion can be used to derive a linearized brightness constancy assumption, also known as the optical flow constraint (Lucas and Kanade Reference Lucas and Kanade1981, Horn and Schunck Reference Horn and Schunck1981):
 $$\begin{eqnarray}{\rm\nabla}I(x,t)^{T}\cdot (v(x),1)=0,\quad \text{for all}~x,t\in {\rm\Omega}\times [0,T],\end{eqnarray}$$
 where  $v=(v_{1},v_{2})$ is the velocity field. Direct solution of this equation for
  $v$ is heavily ill-posed. Indeed, the velocity can only be estimated in the direction of spatial image gradients (aperture problem), and homogeneous regions do not provide any information. If the brightness constancy assumption does not hold in practice, it can also be replaced with a gradient constancy or more sophisticated photo consistency metrics. It turns out that the total variation and its generalizations are effective regularizers for optical flow estimation since they force the flow field to be piecewise constant or piecewise smooth. A total variation based optical flow model is given by
 $$\begin{eqnarray}\min _{v}{\it\lambda}\int _{{\rm\Omega}}|Dv|_{p,1}+\displaystyle \frac{1}{q}\int _{{\rm\Omega}}|{\rm\nabla}I(x,t)^{T}\cdot (v(x),1)|^{q}\text{d}x,\end{eqnarray}$$
 where different norms can be considered for both the total variation and the data-fitting term. The most common choice is  $p=2$, and
  $q=1$ (Brox, Bruhn, Papenberg and Weickert Reference Brox, Bruhn, Papenberg, Weickert, Pajdla and Matas2004, Zach, Pock and Bischof Reference Zach, Pock and Bischof2007, Chambolle and Pock Reference Chambolle and Pock2011). For numerical solution we discretize the TV-
 $\ell _{1}$ optical flow model in the same spirit as we did with the previous TV models. We consider a discrete velocity field
  $\boldsymbol{v}=(v_{1},v_{2})\in \mathbb{R}^{m\times n\times 2}$, where
  $v_{1}$ corresponds to the horizontal velocity and
  $v_{2}$ corresponds to the vertical velocity. It can also be written in the form of
  $\boldsymbol{v}=(\boldsymbol{v}_{1,1},\ldots ,\boldsymbol{v}_{m,n})$, where
  $\boldsymbol{v}_{i,j}=(v_{i,j,1},v_{i,j,2})$ is the local velocity vector. To discretize the total variation, we again consider a finite difference approximation of the vectorial gradient
  $\mathbf{D}:\mathbb{R}^{m\times n\times 2}\rightarrow \mathbb{R}^{m\times n\times 4}$, defined by
 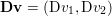 $\mathbf{D}\boldsymbol{v}=(\text{D}v_{1},\text{D}v_{2})$, where
  $\text{D}$ is defined in (2.4). In order to discretize the data term, we consider a certain point in time for which we have computed finite difference approximations for the space-time gradient of
  $I(x,t)$. It is necessary to have at least two images in time in order to compute the finite differences in time. We denote the finite difference approximation to the space-time gradient by
  $\mathbf{r}=(r_{1},r_{2},r_{3})\in \mathbb{R}^{m\times n\times 3}$; it also has the structure
  $\mathbf{r}=(\mathbf{r}_{1,1},\ldots ,\mathbf{r}_{m,n})$, where
  $\mathbf{r}_{i,j}=(r_{i,j,1},r_{i,j,2},r_{i,j,3})$ is the space-time gradient at pixel
  $i,j$. The discrete model is then given by
 $$\begin{eqnarray}\min _{\boldsymbol{v}}{\it\lambda}\Vert \mathbf{D}\boldsymbol{v}\Vert _{2,1}+\mathop{\sum }_{i=1,j=1}^{m,n}|\mathbf{r}_{i,j}\cdot (\boldsymbol{\boldsymbol{v}}_{i,j},1)|,\end{eqnarray}$$
where
 $$\begin{eqnarray}\mathbf{r}_{i,j}\cdot (\boldsymbol{v}_{i,j},1)=r_{i,j,1}v_{i,j,1}+r_{i,j,2}v_{i,j,2}+r_{i,j,3}.\end{eqnarray}$$
For the vectorial total variation we consider the standard 2-vector norm, that is,
 $$\begin{eqnarray}\Vert \mathbf{D}\boldsymbol{v}\Vert _{2,1}=\mathop{\sum }_{i=1,j=1}\sqrt{(\text{D}v_{1})_{i,j,1}^{2}+(\text{D}v_{1})_{i,j,2}^{2}+(\text{D}v_{2})_{i,j,1}^{2}+(\text{D}v_{2})_{i,j,2}^{2}}.\end{eqnarray}$$
Optical flow estimation using total variation. (a) A blending of the two input images. (b) A colour coding of the computed velocity field. The colour coding of the velocity field is shown in the upper left corner of the image.

The TV- $\ell _{1}$ model is non-smooth, and hence we introduce dual variables
  $\mathbf{p}\in \mathbb{R}^{m\times n\times 4}$ and consider its saddle-point formulation
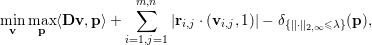 $$\begin{eqnarray}\min _{\boldsymbol{v}}\max _{\mathbf{p}}\langle \mathbf{D}\boldsymbol{v},\mathbf{p}\rangle +\mathop{\sum }_{i=1,j=1}^{m,n}|\mathbf{r}_{i,j}\cdot (\boldsymbol{v}_{i,j},1)|-{\it\delta}_{\{\Vert \cdot \Vert _{2,\infty }\leq {\it\lambda}\}}(\mathbf{p}),\end{eqnarray}$$
which can be solved using Algorithm 6 (PDHG). It remains to detail the solution of the proximal map with respect to the function
 $$\begin{eqnarray}g(\boldsymbol{v})=\mathop{\sum }_{i=1,j=1}^{m,n}|\mathbf{r}_{i,j}\cdot (\boldsymbol{v}_{i,j},1)|.\end{eqnarray}$$
A simple computation (Zach et al. Reference Zach, Pock and Bischof2007) shows that the proximal map is given by
 $$\begin{eqnarray}\displaystyle \hat{\boldsymbol{v}} & = & \displaystyle \text{prox}_{{\it\tau}g}(\tilde{\boldsymbol{v}})\Leftrightarrow \nonumber\\ \displaystyle \hat{\boldsymbol{v}}_{i,j} & = & \displaystyle \tilde{\boldsymbol{v}}_{i,j}+\left\{\begin{array}{@{}ll@{}}{\it\tau}\mathbf{r}_{i,j}\quad & \text{if }\mathbf{r}_{i,j}\cdot (\tilde{\boldsymbol{v}}_{i,j},1)<-{\it\tau}|\mathbf{r}_{i,j}|^{2},\\ -{\it\tau}\mathbf{r}_{i,j}\quad & \text{if }\mathbf{r}_{i,j}\cdot (\tilde{\boldsymbol{v}}_{i,j},1)>\;\;\;{\it\tau}|\mathbf{r}_{i,j}|^{2},\\ -(\mathbf{r}_{i,j}\cdot (\tilde{\boldsymbol{v}}_{i,j},1)/|\mathbf{r}_{i,j}|^{2})\,\mathbf{r}_{i,j}\quad & \text{else}.\end{array}\right.\nonumber\end{eqnarray}$$
 With this information, the PDHG algorithm can be easily implemented. Since the optical flow constraint is valid only for small spatial displacements, the minimization of the TV- $\ell _{1}$ optical flow model is usually embedded within a coarse-to-fine warping framework based on image pyramids (Brox et al. Reference Brox, Bruhn, Papenberg, Weickert, Pajdla and Matas2004). Figure 7.6 shows an example of computing the optical flow in a typical car driving scene.Footnote 20 It can be observed that the motion field has been recovered nicely, but we can also see a typical problem in optical flow computation: the car on the right-hand side (which itself has a weak texture) is driving through the shadow of a tree. This creates a texture pattern that does not move along with the car, and hence the recovered velocity is the velocity of the street rather than the velocity of the car. In driver assistance systems and autonomous driving, the result of the optical flow computation represents an important cue, for example in crash avoidance.
7.6 Analysis operators
There have also been research directions that replace the gradient operator of the total variation with a more general analysis operator, usually in a discrete setting. Popular operators include wavelet-like transforms such as curvelets (Candès, Demanet, Donoho and Ying Reference Candès, Demanet, Donoho and Ying2006a, Starck, Murtagh and Fadili Reference Starck, Murtagh and Fadili2010) or shearlets (Guo, Kutyniok and Labate Reference Guo, Kutyniok and Labate2006). There have also been many attempts to learn optimal analysis operators from data; see for example Protter, Yavneh and Elad (Reference Protter, Yavneh and Elad2010), Peyré, Fadili and Starck (Reference Peyré, Fadili and Starck2010), Chen et al. (Reference Chen, Ranftl and Pock2014b) and Hawe, Kleinsteuber and Diepold (Reference Hawe, Kleinsteuber and Diepold2013).
Let
 $$\begin{eqnarray}{\rm\Phi}:\mathbb{R}^{m\times n}\rightarrow \mathbb{C}^{k_{1}\times \cdots \times k_{K}}\end{eqnarray}$$
 be a linear transform that maps an image of size  $m\times n$ pixels to a complex space of dimension
  $k_{1}\times \cdots \times k_{K}$, where the dimensions
  $k_{i}$,
  $i=1,\ldots ,K$ usually depend on the number of filters, orientations, and scales used in the transform. When using the operator
  ${\rm\Phi}$ within a regularization term, the part of the transform that computes the approximation (coarse) coefficients is usually skipped since these coefficients are generally not sparse. Hence we cannot assume that
  ${\rm\Phi}$ is invertible. A straightforward extension of the discrete ROF model (2.6) is given by
 $$\begin{eqnarray}\min _{u}{\it\lambda}\Vert {\rm\Phi}u\Vert _{1}+\displaystyle \frac{1}{2}\Vert u-u^{\diamond }\Vert _{2}^{2}.\end{eqnarray}$$
Image inpainting using shearlet regularization. (a) Original image, and (b) input image with a randomly chosen fraction of  $10\%$ of the image pixels. (c) Reconstruction using TV regularization, and (d) reconstruction using the shearlet model. Observe that the shearlet-based model leads to significantly better reconstruction of small-scale and elongated structures.

Sometimes it is also useful to give different weights to different scales or orientations of the transform  ${\rm\Phi}$, but for the sake of simplicity we will just assume a single regularization parameter. Let us show an example using the discrete shearlet transform, since it has been shown to provide optimal sparse approximations for cartoon-like images (Guo and Labate Reference Guo and Labate2007, Easley, Labate and Lim Reference Easley, Labate and Lim2008, Kutyniok and Lim Reference Kutyniok and Lim2011), for image inpainting. For this we consider the following formulation:
 $$\begin{eqnarray}\min _{u}\Vert {\rm\Phi}u\Vert _{1}+\mathop{\sum }_{(i,j)\in {\mathcal{I}}}{\it\delta}_{\{u_{i,j}^{\diamond }\}}(u_{i,j}),\end{eqnarray}$$
where
 $$\begin{eqnarray}{\mathcal{D}}=\{(i,j):1\leq i\leq m,\,1\leq j\leq n\}\end{eqnarray}$$
 is the set of pixel indices of a discrete image of size  $m\times n$, and
  ${\mathcal{I}}\subset {\mathcal{D}}$ is the subset of known pixels of the image
  $u^{\diamond }$. After transforming to a saddle-point problem, the solution of the inpainting problem can be computed using the PDHG algorithm. It just remains to give the proximal map with respect to the data term
 $$\begin{eqnarray}g(u)=\mathop{\sum }_{(i,j)\in {\mathcal{I}}}{\it\delta}_{\{u_{i,j}^{\diamond }\}}(u_{i,j}).\end{eqnarray}$$
Obviously, the solution of the proximal map is given by
 $$\begin{eqnarray}\hat{u} =\text{prox}_{{\it\tau}g}(\tilde{u} )\Leftrightarrow \hat{u} _{i,j}=\left\{\begin{array}{@{}ll@{}}u_{i,j}^{\diamond }\quad & \text{if }(i,j)\in {\mathcal{I}},\\ \tilde{u} _{i,j}\quad & \text{else}.\end{array}\right.\end{eqnarray}$$
 Figure 7.7 shows the application of the inpainting model to recover an image from only  $10\%$ known image pixels. For comparison we also show the result with TV regularization, which can be realized by replacing
  ${\rm\Phi}$ with the discrete gradient operator
  $\text{D}$. This result shows that penalizing the
  $\ell _{1}$-norm of the shearlet transform produces a significantly better approximation compared to the TV model. In particular, elongated structures are reconstructed with far more detail.
7.7 The Mumford–Shah model
The next functional we mention here is the celebrated Mumford–Shah functional (Mumford and Shah Reference Mumford and Shah1989). The minimization problem reads
 $$\begin{eqnarray}\min _{u}\int _{{\rm\Omega}\setminus S_{u}}|{\rm\nabla}u(x)|^{2}\text{d}x+{\it\nu}{\mathcal{H}}^{d-1}(S_{u})+{\it\lambda}\int _{{\rm\Omega}}(u-u^{\diamond })^{2}\text{d}x,\end{eqnarray}$$
 where the image domain  ${\rm\Omega}$ is a subset of
  $\mathbb{R}^{d}$,
  $u^{\diamond }$ is a given image, and
  $u\in \text{SBV}({\rm\Omega})$ is the smooth approximation image. The space
  $\text{SBV}({\rm\Omega})$ refers to the so-called space of special functions of bounded variations (Ambrosio et al. Reference Ambrosio, Fusco and Pallara2000, Attouch, Buttazzo and Michaille Reference Attouch, Buttazzo and Michaille2014). It is a subspace of the space
  $\text{BV}({\rm\Omega})$ introduced in Section 7.1, and contains functions whose distributional derivatives consist only of a jump (discontinuity) part and an absolutely continuous gradient. The parameters
  ${\it\nu}>0$ and
  ${\it\lambda}>0$ are tuning parameters, used to balance between the different terms.
  $S_{u}\subset {\rm\Omega}$ refers to the so-called jump set, that is, the set of points where the function
  $u$ is allowed to jump and
  ${\mathcal{H}}^{d-1}$ is the
  $(d-1)$-dimensional Hausdorff measure (Ambrosio et al. Reference Ambrosio, Fusco and Pallara2000, Attouch et al. Reference Attouch, Buttazzo and Michaille2014, Evans and Gariepy Reference Evans and Gariepy1992), which is, for
  $d=2$, the length of the jump set
  $S_{u}$ and hence the total length of edges in
  $u$. The main difference between the ROF functional and the MS functional is as follows. While the ROF functional penalizes discontinuities proportional to their jump height, the MS functional penalizes discontinuities independently of their jump height and hence allows for better discrimination between smooth and discontinuous parts of the image. We must stress that the MS functional is very hard to minimize. The reason is that the jump set
  $S_{u}$ is not known beforehand and hence the problem becomes a non-convex optimization problem. Different numerical approaches have been proposed to find approximate solutions to the Mumford–Shah problem (Ambrosio and Tortorelli Reference Ambrosio and Tortorelli1992, Chambolle Reference Chambolle1999, Chan and Vese Reference Chan and Vese2002, Pock et al. Reference Pock, Cremers, Bischof and Chambolle2009).
Here we focus on the work by Alberti, Bouchitté and Dal Maso (Reference Alberti, Bouchitté and Dal Maso2003), who proposed a method called the calibration method to characterize global minimizers of the MS functional. The approach is based on a convex representation of the MS functional in a three-dimensional space  ${\rm\Omega}\times \mathbb{R}$, where the third dimension is given by the value
  $t=u(x)$. The idea of the calibration method is to consider the maximum flux of a vector field
  ${\it\varphi}=({\it\varphi}^{x},{\it\varphi}^{t})\in C_{0}({\rm\Omega}\times \mathbb{R};\mathbb{R}^{d+1})$ through the interface of the subgraph
 $$\begin{eqnarray}\mathbf{1}_{u}(x,t)=\left\{\begin{array}{@{}ll@{}}1\quad & \text{if }t<u(x),\\ 0\quad & \text{else},\end{array}\right.\end{eqnarray}$$
 which allows us to distinguish between smooth and discontinuous areas in the function  $u$ in an elegant way. It turns out that we can find convex constraints
  $K$ on the vector field such that the supremum of the flux of the vector field through the interface is identical to the value of the Mumford–Shah functional in (7.10). Formally, this energy is written as a minimal surface energy of the form
 $$\begin{eqnarray}\text{MS}(u)=\sup _{{\it\varphi}\in K}\int _{{\rm\Omega}\times \mathbb{R}}{\it\varphi}D\mathbf{1}_{u},\end{eqnarray}$$
 where the convex set  $K$ is given by
 $$\begin{eqnarray}\displaystyle K & = & \displaystyle \bigg\{{\it\varphi}\in C_{0}({\rm\Omega}\times \mathbb{R};\mathbb{R}^{d+1}):\nonumber\\ \displaystyle & & \displaystyle \qquad {\it\varphi}^{t}(x,t)\geq \displaystyle \frac{{\it\varphi}^{x}(x,t)^{2}}{4}-{\it\lambda}(t-u^{\diamond }(x))^{2},\biggl|\int _{t_{1}}^{t_{2}}{\it\varphi}^{x}(x,s)\text{d}s\biggr|\leq {\it\nu}\bigg\},\end{eqnarray}$$
 where the inequalities in the definition of  $K$ hold for all
  $x\in {\rm\Omega}$ and for all
  $t,t_{1},t_{2}\in \mathbb{R}$. Observe that the set
  $K$ includes non-local constraints, which is challenging from a computational point of view.
In particular, if the supremum is attained by a divergence-free vector field, the divergence theorem provides a sufficient condition of optimality for  $u$. Such a vector field is then said to be a calibration.
Although (7.12) looks almost like a convex optimization problem, we must take into account the constraint that  $\mathbf{1}_{u}$ is a binary function. The standard approach is to relax this constraint by replacing
  $\mathbf{1}_{u}$ with a function
  $v\in \text{BV}({\rm\Omega}\times \mathbb{R};[0,1])$ which satisfies
 $$\begin{eqnarray}\lim _{t\rightarrow -\infty }v(x,t)=1,\quad \lim _{t\rightarrow +\infty }v(x,t)=0,\end{eqnarray}$$
such that (7.12) becomes the convex problem
 $$\begin{eqnarray}\min _{v}\sup _{{\it\varphi}\in K}\int _{{\rm\Omega}\times \mathbb{R}}{\it\varphi}Dv.\end{eqnarray}$$
 Clearly, being a relaxation of the original problem, the question remains whether a minimizer of (7.15) translates to a global minimizer of the Mumford–Shah problem. In particular, this would be true if a minimizer  $v^{\ast }$ of the above optimization problem were binary, which would imply that the supremum is attained by a divergence-free vector field and hence a calibration is found. For some particular cases such as edges and triple junction, it is known that such a calibration exists (Alberti et al. Reference Alberti, Bouchitté and Dal Maso2003, Dal Maso, Mora and Morini Reference Dal Maso, Mora and Morini2000, Mora and Morini Reference Mora and Morini2001). For other cases such as ‘crack-tip’, the proof of the existence of a calibration remains an unsolved problem (Bonnet and David Reference Bonnet and David2001), and perhaps one might not expect to obtain a binary
  $v^{\ast }$ in this situation.
Let us quickly develop a discrete version of the calibration method. We consider a spatially discrete function  $v\in \mathbb{R}^{m\times n\times r}$ on a three-dimensional regular grid of
  $m\times n\times r$ voxels. We also associate discrete values
  $t_{k}$,
  $k=1,\ldots ,r$ of the range of the given function
  $u^{\diamond }\in \mathbb{R}^{m\times n}$ with the discrete function
  $v$. Usually the range of
  $u^{\diamond }$ is in
  $[0,1]$ so that
  $t_{k}=(k-1)/(r-1)$ is a natural choice.
We approximate the three-dimensional gradient operator, again using a simple finite difference operator  $\text{D}:\mathbb{R}^{m\times n\times r}\rightarrow \mathbb{R}^{m\times n\times r\times 3}$, which is implemented as usual, using finite differences. The operator is the extension of (2.4) to three dimensions, and is defined by
 $$\begin{eqnarray}\begin{array}{@{}rcl@{}}(\text{D}v)_{i,j,k,1} & = & \left\{\begin{array}{@{}ll@{}}v_{i+1,j,k}-v_{i,j,k}\quad & \text{if }1\leq i<m,\\ 0\quad & \text{else},\end{array}\right.\\ (\text{D}v)_{i,j,k,2} & = & \left\{\begin{array}{@{}ll@{}}v_{i,j+1,k}-v_{i,j,k}\quad & \text{if }1\leq j<n,\\ 0\quad & \text{else},\end{array}\right.\\ (\text{D}v)_{i,j,k,3} & = & \left\{\begin{array}{@{}ll@{}}v_{i,j,k+1}-v_{i,j,k}\quad & \text{if }1\leq k<r,\\ 0\quad & \text{else}.\end{array}\right.\end{array}\end{eqnarray}$$
 We also introduce a discrete field variable  $\mathbf{p}=(p_{1},p_{2},p_{3})\in \mathbb{R}^{m\times n\times r\times 3}$, which can also be written in the form
  $\mathbf{p}=(\mathbf{p}_{1,1,1},\ldots ,\mathbf{p}_{m,n,r})$, where
  $\mathbf{p}_{i,j,k}=(p_{i,j,k,1},p_{i,j,k,2},p_{i,j,k,3})\in \mathbb{R}^{3}$ is the per voxel field variable. Furthermore, we need a discrete version of the convex set
  $K$ defined in (7.13):
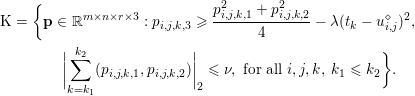 $$\begin{eqnarray}\displaystyle \text{K} & = & \displaystyle \text{}\bigg\{\text{}\mathbf{p}\in \mathbb{R}^{m\times n\times r\times 3}:p_{i,j,k,3}\geq \displaystyle \frac{p_{i,j,k,1}^{2}+p_{i,j,k,2}^{2}}{4}-{\it\lambda}(t_{k}-u_{i,j}^{\diamond })^{2},\nonumber\\ \displaystyle & & \displaystyle \qquad \biggl|\mathop{\sum }_{k=k_{1}}^{k_{2}}(p_{i,j,k,1},p_{i,j,k,2})\biggr|_{2}\leq {\it\nu},~\text{for all}~i,j,k,\;k_{1}\leq k_{2}\text{}\bigg\}\text{}.\end{eqnarray}$$
Piecewise smooth approximation using the Mumford–Shah functional. (a) Original image  $u^{\diamond }$, and (b) piecewise smooth approximation
  $u$ extracted from the convex relaxation. (c) Three-dimensional rendering of the subgraph of the relaxed function
  $v$ which approximates the subgraph
  $\mathbf{1}_{u}$ of the image
  $u$. Note the tendency of the Mumford–Shah functional to produce smooth regions terminated by sharp discontinuities.

Finally, we define a convex set  $\text{C}$ that constrains the variable
  $v$ to belong to a set of relaxed binary functions that satisfy the required boundary conditions:
 $$\begin{eqnarray}\text{C}=\{v\in \mathbb{R}^{m\times n\times r}:v_{i,j,k}\in [0,1],\;v_{i,j,1}=0,\;v_{i,j,r}=1,~\text{for all}~i,j,k\}\end{eqnarray}$$
With this, the discrete version of (7.15) is given by the saddle-point problem
 $$\begin{eqnarray}\min _{v}\max _{\mathbf{p}}\langle \text{D}v,\mathbf{p}\rangle +{\it\delta}_{\text{C}}(v)-{\it\delta}_{\text{K}}(\mathbf{p}),\end{eqnarray}$$
 which can be solved using Algorithm 6. The critical part of the implementation of the algorithm is the solution of the projection of  $\mathbf{p}$ onto
  $\text{K}$:
 $$\begin{eqnarray}\hat{\mathbf{p}}={\rm\Pi}_{\text{K}}(\tilde{\mathbf{p}})=\arg \min _{\mathbf{p}\in \text{K}}\displaystyle \frac{\Vert \mathbf{p}-\tilde{\mathbf{p}}\Vert ^{2}}{2},\end{eqnarray}$$
 which is non-trivial since the set  $\text{K}$ contains a quadratic number (in fact
  $r(r+1)/2$) of coupled constraints. In order to solve the projection problem, we may adopt Dykstra’s algorithm for computing the projection on the intersection of convex sets (Dykstra Reference Dykstra1983). The algorithm performs a coordinate descent on the dual of the projection problem, which is defined in the product space of the constraints. In principle, the algorithm proceeds by sequentially projecting onto the single constraints. The projections onto the 2-ball constraints can be computed using projection formula (4.23). The projection to the parabola constraint can be computed by solving a cubic polynomial or by adopting Newton’s method. Once a solution
  $v$ is computed from the saddle-point problem, an approximate minimizer
  $u$ can be computed for example by extracting the
  ${\textstyle \frac{1}{2}}$-level set of
  $v$.
$v$.
Figure 7.8 shows the result of the Mumford–Shah functional obtained from the convex representation. The solution  $u$ is composed of smooth regions terminated by sharp discontinuities. We also show a three-dimensional rendering of the relaxed function
  $v$ which, if binary, is exactly the subgraph of the function
  $u$.
$u$.
7.8 Convex regularization with non-convex data terms
Pock et al. (Reference Pock, Schoenemann, Graber, Bischof and Cremers2008), Pock, Cremers, Bischof and Chambolle (Reference Pock, Cremers, Bischof and Chambolle2010) have shown that the calibration method can also be used to compute exact solutions of a certain class of optimization problems that have important applications in imaging. The class of problems is given by
 $$\begin{eqnarray}\min _{u}\int _{{\rm\Omega}}f(x,u(x),Du),\end{eqnarray}$$
 where the function  $f(x,t,p)$ can be non-convex in
  $t$ but has to be convex in
  $p$. It turns out that a global minimizer of this problem can be computed by solving (7.15) with the following convex set of constraints:
 $$\begin{eqnarray}\displaystyle K=\{{\it\varphi}\in C_{0}({\rm\Omega}\times \mathbb{R};\mathbb{R}^{d+1}):{\it\varphi}^{t}(x,t)\geq f^{\ast }(x,t,{\it\varphi}^{x}(x,t)),\;\forall x,t\in {\rm\Omega}\times \mathbb{R}\}, & & \displaystyle\end{eqnarray}$$
 where  $f^{\ast }$ denotes the convex conjugate of
  $f(x,t,p)$ with respect to
  $p$. Observe that, in contrast to the convex set associated with the convex representation of the Mumford–Shah functional, this convex set is local in
  ${\rm\Omega}\times \mathbb{R}$ and hence much more amenable to numerical optimization. The discretization of the problem is very similar to the discretization of the Mumford–Shah functional and hence we omit it.
Computing a globally optimal solution of a large-scale stereo problem using the calibration method. (a) Left input image showing the region around the Freiheitsplatz in the city of Graz. (b) Computed disparity map, where the intensity is proportional to the height above the ground. Black pixels indicate occluded pixels that have been determined by a left–right consistency check.

A particularly interesting class of optimization problems is given by total variation regularization plus a quite arbitrary non-convex data term, for example given by the matching costs of a stereo problem. In this case, the convex set (7.20) completely decomposes into a set of simple and pointwise constraints. Equivalently, the problem can be solved by solving a ROF problem in three dimensions, and extracting the  $0$-level set of the solution, as explained later on in Section 7.9. This has the advantage that we can implement an accelerated block-coordinate descent as explained in Example 4.15. The resulting algorithm is quite efficient. It usually needs only a very small number of iterations (20–30) to give a good approximate solution. See Chambolle and Pock (Reference Chambolle and Pock2015b) for more information.
Figure 7.9 shows an example of computing the globally optimal solution of a total variation regularized stereo model using accelerated block descent. The non-convex data term is computed from the stereo matching costs using the census transform (Zabih and Woodfill Reference Zabih and Woodfill1994). Figure 7.9(a) shows one input image of an aerial stereo image pair showing the neighbourhood of Freiheitsplatz in the city of Graz.Footnote 21 Figure 7.9(b) shows the computed disparity image obtained by solving the convexification of the non-convex stereo problem. After interchanging the left and right images we repeated the experiment. This allowed us to perform a left–right consistency check and in turn to identify occluded regions. Those pixels are shown in black.
Although the calibration method is able to compute the globally optimal solution, it is important to point out that this does not come for free. The associated optimization problem is huge because the range space of the solution also has to be discretized. In our stereo example, the disparity image is of size  $1835\times 3637$ pixels and the number of disparities was
  $100$. This amounts to solving an optimization problem of
  $0.7$ billion unknowns – in practice we solve the dual ROF problem, which in fact triples the number of unknowns! However, using the combination of accelerated block descent and efficient dynamic programming to solve the one-dimensional ROF problems involved allows us to solve such a huge optimization problem in ‘only’
  $10$ minutes on a 20-core machine.
Various groups have proposed extensions of these techniques to ever more difficult problems such as vector-valued data or manifold-valued data; see Lellmann and Schnörr (Reference Lellmann and Schnörr2011), Cremers and Strekalovskiy (Reference Cremers and Strekalovskiy2013), Goldluecke, Strekalovskiy and Cremers (Reference Goldluecke, Strekalovskiy and Cremers2013) and Strekalovskiy, Chambolle and Cremers (Reference Strekalovskiy, Chambolle and Cremers2014).
7.9 Image segmentation
Image segmentation is a central problem in imaging. Let us first discuss figure-ground segmentation, whose general idea is to partition an image into two regions, one corresponding to the figure and the other to the background. A simple model consists of an energy functional that minimizes the boundary length of the segmentation plus a certain region-based segmentation criterion, for example the colour distance to given mean values of the regions. In the continuous setting, this problem can be written in the following form:
 $$\begin{eqnarray}\displaystyle \min _{S\subseteq {\rm\Omega}}\text{Per}(S;{\rm\Omega})+\int _{S}w_{1}(x)\text{d}x+\int _{{\rm\Omega}\setminus S}w_{2}(x)\text{d}x, & & \displaystyle\end{eqnarray}$$
 where  ${\rm\Omega}$ is the image domain,
  $\text{Per}(S;{\rm\Omega})$ denotes the perimeter of the set
  $S$ in
  ${\rm\Omega}$, and
  $w_{1,2}:{\rm\Omega}\rightarrow \mathbb{R}^{+}$ are given non-negative potential functions. This problem belongs to a general class of minimal surface problems that have been studied for a long time (see for instance the monograph by Giusti Reference Giusti1984).
The discrete version of this energy is commonly known as the ‘Ising’ model, which represents the interactions between spins in an atomic lattice and exhibits phase transitions. In computer science, the same kind of energy has been used to model many segmentation and classification tasks, and has received a lot of attention since it was understood that it could be efficiently minimized if represented as a minimum  $s-t$ cut problem (Picard and Ratliff Reference Picard and Ratliff1975) in an oriented graph
  $({\mathcal{V}},{\mathcal{E}})$. Here,
  ${\mathcal{V}}$ denotes a set of vertices and
  ${\mathcal{E}}$ denotes the set of edges connecting some of these vertices. Given two particular vertices, the ‘source’
  $s$ and the ‘sink’
  $t$, the
  $s-t$ minimum cut problem consists in finding two disjoint sets
  $S\ni s$ and
  $T\ni t$ with
  $S\cup T={\mathcal{V}}$ and the cost of the ‘cut’
  $C(S,T)=\{(u,v)\in {\mathcal{E}}:u\in S,v\in T\}$ is minimized. The cost of the cut can be determined by simply counting the number of edges, or by summing a certain weight
  $w_{uv}$ associated with each edge
  $(u,v)\in {\mathcal{E}}$. By the Ford–Fulkerson min-cut/max-flow duality theorem (see Ahuja, Magnanti and Orlin Reference Ahuja, Magnanti and Orlin1993 for a fairly complete textbook on these topics), this minimal
  $s-t$ cut can be computed by finding a maximal flow through the oriented graph, which can be solved by a polynomial-time algorithm. In fact, there is a ‘hidden’ convexity in the problem. We will describe this briefly in the continuous setting; for discrete approaches to image segmentation we refer to Boykov and Kolmogorov (Reference Boykov and Kolmogorov2004), and the vast subsequent literature. The min-cut/max-flow duality in the continuous setting and the analogy with minimal surfaces type problems were first investigated by Strang (Reference Strang1983) (see also Strang Reference Strang2010).
We mentioned in the previous section that the total variation (7.2) is also well defined for characteristic functions of sets, and measures the length of the boundary (in the domain). This is, in fact, the ‘correct’ way to define the perimeter of a measurable set, introduced by R. Caccioppoli in the early 1950s. Ignoring constants, we can replace (7.21) with the following equivalent variational problem:
 $$\begin{eqnarray}\displaystyle \min _{S\subseteq {\rm\Omega}}\int _{{\rm\Omega}}|D\mathbf{1}_{S}|+\int _{{\rm\Omega}}\mathbf{1}_{S}(x)w(x)\text{d}x, & & \displaystyle\end{eqnarray}$$
 where for notational simplicity we have set  $w=w_{1}-w_{2}$, and
  $\mathbf{1}_{S}$ is the characteristic function associated with the set
  $S$, that is,
 $$\begin{eqnarray}\mathbf{1}_{S}(x)=\left\{\begin{array}{@{}ll@{}}1\quad & \text{if }x\in S,\\ 0\quad & \text{else}.\end{array}\right.\end{eqnarray}$$
 The idea is now to replace the binary function  $\mathbf{1}_{S}:{\rm\Omega}\rightarrow \{0,1\}$ with a continuous function
  $u:{\rm\Omega}\rightarrow [0,1]$ such that the problem becomes convex:
 $$\begin{eqnarray}\displaystyle \min _{u}\,\int _{{\rm\Omega}}|Du|+\int _{{\rm\Omega}}u(x)w(x)\text{d}x,\quad \text{such that }u(x)\in [0,1]\;\text{a.e. in }\,{\rm\Omega}, & & \displaystyle\end{eqnarray}$$
 It turns out that the relaxed formulation is exact in the sense that any thresholded solution  $v=\mathbf{1}_{\{u\geq s\}}$ of the relaxed problem for any
  $s\in (0,1]$ is also a global minimizer of the binary problem (Chan, Esedoḡlu and Nikolova Reference Chan, Esedoḡlu and Nikolova2006, Chambolle Reference Chambolle2005, Chambolle and Darbon Reference Chambolle and Darbon2009). This is a consequence of the co-area formula (Federer Reference Federer1969, Giusti Reference Giusti1984, Ambrosio et al. Reference Ambrosio, Fusco and Pallara2000), which shows that minimizing the total variation of
  $u$ decomposes into independent problems on all level sets of the function
  $u$.
$u$.
Interestingly, there is also a close relationship between the segmentation model (7.23) and the ROF model (7.1). In fact a minimizer of (7.23) is obtained by minimizing (7.1), with  $u^{\diamond }=w$ being the input image, and then thresholding the solution
  $u$ at the 0 level (Chambolle Reference Chambolle2004a, Reference Chambolle2005). Conversely, this relationship has also been successfully used to derive efficient combinatorial algorithms, based on parametric maximal flow approaches (Gallo, Grigoriadis and Tarjan Reference Gallo, Grigoriadis and Tarjan1989), to solve the fully discrete ROF model exactly in polynomial time (Hochbaum Reference Hochbaum2001, Darbon and Sigelle Reference Darbon and Sigelle2004, Reference Darbon and Sigelle2006a,Reference Darbon and Sigelleb, Chambolle and Darbon Reference Chambolle, Darbon, Lézoray and Grady2012), where the total variation is approximated by sum of pairwise interactions
  $|u_{i}-u_{j}|$.
Exploiting the relation between the ROF model and the two-label segmentation model, we can easily solve the segmentation problem by considering a discrete version of the ROF model. In our setting here, we consider a discrete image  $u\in \mathbb{R}^{m\times n}$ and a discrete weighting function
  $w\in \mathbb{R}^{m\times n}$. The discrete model we need to solve is
 $$\begin{eqnarray}\min _{u}\Vert \text{D}u\Vert _{2,1}+\displaystyle \frac{1}{2}\Vert u-w\Vert ^{2}.\end{eqnarray}$$
 It can be solved by using either Algorithm 8 or Algorithm 5 (applied to the dual problem). Let  $u^{\ast }$ denote the minimizer of the ROF problem. The final discrete and binary segmentation
  $\mathbf{1}_{{\mathcal{S}}}$ is given by thresholding
  $u^{\ast }$ at zero:
 $$\begin{eqnarray}(\mathbf{1}_{{\mathcal{S}}})_{i,j}=\left\{\begin{array}{@{}ll@{}}0\quad & \text{if }u_{i,j}^{\ast }<0,\\ 1\quad & \text{else.}\end{array}\right.\end{eqnarray}$$
Interactive image segmentation using the continuous two-label image segmentation model. (a) Input image overlaid with the initial segmentation provided by the user. (b) The weighting function  $w$, computed using the negative
  $\log$-ratio of two Gaussian mixture models fitted to the initial segments. (c) Binary solution of the segmentation problem, and (d) the result of performing background removal.

Figure 7.10 shows an example of foreground–background segmentation using this approach. The weighting function  $w$ was computed using the negative
  $\log$-ratio of two Gaussian mixture models (GMMs) that were fitted to the desired foreground and background regions provided by the input of a user. Let
 $$\begin{eqnarray}{\mathcal{N}}(\mathbf{x},\boldsymbol{{\it\mu}},\boldsymbol{{\rm\Sigma}})=\displaystyle \frac{\exp (-{\textstyle \frac{1}{2}}(\mathbf{x}-\boldsymbol{{\it\mu}})^{T}\boldsymbol{{\rm\Sigma}}^{-1}(\mathbf{x}-\boldsymbol{{\it\mu}}))}{\sqrt{(2{\it\pi})^{d}\text{det}\boldsymbol{{\rm\Sigma}}}}\end{eqnarray}$$
 be the ( $d$-dimensional) normal distribution with expectation
  $\boldsymbol{{\it\mu}}\in \mathbb{R}^{d}$ and covariance matrix
  $\boldsymbol{{\rm\Sigma}}\in \mathbb{R}^{d\times d}$. We let
 $$\begin{eqnarray}G(\mathbf{x};\boldsymbol{{\it\mu}},\boldsymbol{{\rm\Sigma}},\boldsymbol{{\it\alpha}})=\mathop{\sum }_{l=1}^{L}{\it\alpha}_{l}{\mathcal{N}}(\mathbf{x},\boldsymbol{{\it\mu}}_{l},\boldsymbol{{\rm\Sigma}}_{l})\end{eqnarray}$$
 denote a GMM with  $L$ components, where
 $$\begin{eqnarray}\boldsymbol{{\it\alpha}}=({\it\alpha}_{l})_{l=1}^{L}\in [0,1]^{L},\quad \mathop{\sum }_{l=1}^{L}{\it\alpha}_{l}=1\end{eqnarray}$$
 are the mixture coefficients,  $\boldsymbol{{\it\mu}}=(\boldsymbol{{\it\mu}}_{l})_{l=1}^{L}$ are the means, and
  $\boldsymbol{{\rm\Sigma}}=(\boldsymbol{{\rm\Sigma}}_{l})_{l=1}^{L}$ are the covariances of the Gaussian probability densities. Further, we let
  $G^{f}(\cdot ;\boldsymbol{{\it\mu}}^{f},\boldsymbol{{\rm\Sigma}}^{f},\boldsymbol{{\it\alpha}}^{f})$ denote the Gaussian mixture model of the figure and
  $G^{b}(\cdot ;\boldsymbol{{\it\mu}}^{b},\boldsymbol{{\rm\Sigma}}^{b},\boldsymbol{{\it\alpha}}^{b})$ the mixture model of the background.
Following the well-known GrabCut algorithm (Rother, Kolmogorov and Blake Reference Rother, Kolmogorov and Blake2004), the weighting function  $w$ is given by the negative
  $\log$-ratio
 $$\begin{eqnarray}w_{i,j}=-\log \biggl(\displaystyle \frac{G^{f}(\mathbf{u}_{i,j}^{\diamond };\boldsymbol{{\it\mu}}^{f},\boldsymbol{{\rm\Sigma}}^{f},\boldsymbol{{\it\alpha}}^{f})}{G^{b}(\mathbf{u}_{i,j}^{\diamond };\boldsymbol{{\it\mu}}^{b},\boldsymbol{{\rm\Sigma}}^{b},\boldsymbol{{\it\alpha}}^{b})}\biggr),\end{eqnarray}$$
 where  $\mathbf{u}^{\diamond }\in \mathbb{R}^{m\times n\times 3}$ is a given colour image. The weighting function is larger than zero if the pixel
  $\mathbf{u}_{i,j}^{\diamond }$ is more likely to be a background pixel, and smaller than zero if a pixel is more likely to be a foreground pixel. In our experiment we used Gaussian mixture models with
  $10$ components. The Gaussian mixture models can be computed using the classical EM (expectation–maximization) algorithm. In practice, it consists in alternating the following steps, until convergence.
∙ Compute at each pixel of the (current) foreground/background the membership probabilities for each Gaussian,
for$$\begin{eqnarray}{\it\pi}_{i,j,l}^{f}=\displaystyle \frac{{\it\alpha}_{l}^{f}{\mathcal{N}}(\mathbf{u}_{i,j}^{\diamond },\boldsymbol{{\it\mu}}_{l}^{f},\boldsymbol{{\rm\Sigma}}_{l}^{f})}{\mathop{\sum }_{l^{\prime }=1}^{k}{\it\alpha}_{l}^{f}{\mathcal{N}}(\mathbf{u}_{i,j}^{\diamond },\boldsymbol{{\it\mu}}_{l^{\prime }}^{f},\boldsymbol{{\rm\Sigma}}_{l^{\prime }}^{f})}\end{eqnarray}$$$l=1,\ldots ,L$ and each foreground pixel $(i,j)\in \mathtt{fg}$, and similarly for $({\it\pi}^{b})_{i,j,l}$, $(i,j)\in \mathtt{bg}$ (here $\mathtt{fg},\mathtt{bg}\subset \{1,\ldots ,n\}\times \{1,\ldots ,m\}$ denote the set of foreground and background pixels, respectively).∙ Update the parameters:
and similarly for the background.$$\begin{eqnarray}\displaystyle {\it\alpha}_{l}^{f} & = & \displaystyle \displaystyle \frac{1}{\#\mathtt{fg}}\mathop{\sum }_{(i,j)\in \mathtt{fg}}{\it\pi}_{i,j,l}^{f},\quad \boldsymbol{{\it\mu}}_{l}^{f}=\displaystyle \frac{\mathop{\sum }_{i,j\in \mathtt{fg}}\mathbf{u}_{i,j}^{\diamond }{\it\pi}_{i,j,l}^{f}}{\mathop{\sum }_{i,j\in \mathtt{fg}}{\it\pi}_{i,j,l}^{f}},\nonumber\\ \displaystyle \boldsymbol{{\rm\Sigma}}_{l}^{f} & = & \displaystyle \displaystyle \frac{\mathop{\sum }_{i,j\in \mathtt{fg}}(\mathbf{u}_{i,j}^{\diamond }-\boldsymbol{{\it\mu}}_{l}^{f})(\mathbf{u}_{i,j}^{\diamond }-\boldsymbol{{\it\mu}}_{l}^{f})^{T}{\it\pi}_{i,j,l}^{f}}{\mathop{\sum }_{i,j\in \mathtt{fg}}{\it\pi}_{i,j,l}^{f}},\nonumber\end{eqnarray}$$


After solving the segmentation problem, the Gaussian mixture models can be re-computed and the segmentation can be refined.
7.10 Extension to multilabel segmentation
We now describe an extension of the two-region segmentation model to multiple regions. Here the idea is to partition the image domain into a set of  $K$ disjoint image segments
  ${\rm\Omega}_{k}$,
  $k=1,\ldots ,K$. In the continuous setting such a model is given by
 $$\begin{eqnarray}\displaystyle & & \displaystyle \displaystyle \min _{({\rm\Omega}_{k})_{k=1}^{K}}\,\displaystyle \frac{1}{2}\mathop{\sum }_{k=1}^{K}\text{Per}({\rm\Omega}_{k})+\int _{{\rm\Omega}_{k}}w_{k}(x)\text{d}x,\end{eqnarray}$$
 $$\begin{eqnarray}\displaystyle & & \displaystyle \text{such that }{\rm\Omega}=\mathop{\bigcup }_{k=1}^{K}{\rm\Omega}_{k},\;{\rm\Omega}_{k}\cap {\rm\Omega}_{l}=\emptyset ,\quad \text{for all}~k\not =l.\end{eqnarray}$$
This model can be interpreted as the continuous version of the ‘Potts’ model that has also been proposed in statistical mechanics to model the interactions of spins on a crystalline lattice. It is also widely used as a smoothness term in graphical models for computer vision, and can be minimized (approximately) by specialized combinatorial optimization algorithms such as those proposed by Boykov et al. (Reference Boykov, Veksler and Zabih2001).
The continuous Potts model (7.25) is also closely related to the seminal Mumford–Shah model (Mumford and Shah Reference Mumford and Shah1989), where the smooth approximation of the image is restricted to piecewise constant regions. See Chan and Vese (Reference Chan and Vese2001), for example, where the problem is approached using a level set method.
In the discrete setting it is known that the Potts model is NP-hard, so we cannot hope to solve this problem exactly in the continuous setting either. The most standard approach to this problem is to consider a convex relaxation similar to (7.23) by introducing a vectorial function  $u=(u_{1},\ldots ,u_{K}):{\rm\Omega}\rightarrow [0,1]^{K}$ with the constraint that
  $\sum _{k=1}^{K}u_{k}(x)=1$ a.e. in
  ${\rm\Omega}$, and consider some vectorial version of the total variation, which coincides with half of the sum of the perimeters of the sets
  ${\rm\Omega}_{k}$ if the function
  $u$ is binary. A convex relaxation of (7.25) is now given by
 $$\begin{eqnarray}\displaystyle & & \displaystyle \min _{u}\int _{{\rm\Omega}}|Du|_{{\mathcal{P}}}+\mathop{\sum }_{k=1}^{K}\int _{{\rm\Omega}}u_{k}(x)w_{k}(x)\text{d}x,\end{eqnarray}$$
 $$\begin{eqnarray}\displaystyle & & \displaystyle \text{such that }u(x)\in {\mathcal{S}}_{K-1}\;\text{for a.e.}\;x\in {\rm\Omega},\end{eqnarray}$$
where
 $$\begin{eqnarray}{\mathcal{S}}_{K-1}=\biggl\{x\in \mathbb{R}_{+}^{K}:\mathop{\sum }_{i=1}^{K}x_{i}=1\biggr\}\end{eqnarray}$$
 denotes the  $(K-1)$-dimensional unit simplex, and the vectorial total variation is given by
 $$\begin{eqnarray}\displaystyle \int _{{\rm\Omega}}|Du|_{{\mathcal{P}}} & = & \displaystyle \sup \bigg\{-\int _{{\rm\Omega}}u(x)\cdot \text{div}\,{\it\varphi}(x)\text{d}x:\nonumber\\ \displaystyle & & \displaystyle \quad {\it\varphi}\in C^{\infty }({\rm\Omega};\mathbb{R}^{d\times K}),\,{\it\varphi}(x)\in C_{{\mathcal{P}}},\text{for all}~x\in {\rm\Omega}\bigg\},\nonumber\end{eqnarray}$$
 where  $C_{{\mathcal{P}}}$ is a convex set, for which various choices can be made. If the convex set is given by
 $$\begin{eqnarray}C_{{\mathcal{P}}_{1}}=\biggl\{{\it\xi}=({\it\xi}_{1},\ldots ,{\it\xi}_{K})\in \mathbb{R}^{d\times K}:|{\it\xi}_{k}|_{2}\leq \displaystyle \frac{1}{2},~\text{for all}~k\biggr\},\end{eqnarray}$$
the vectorial total variation is simply the sum of the total variations of the single channels (Zach, Gallup, Frahm and Niethammer Reference Zach, Gallup, Frahm, Niethammer, Deussen, Keim and Saupe2008). Chambolle, Cremers and Pock (Reference Chambolle, Cremers and Pock2012) have shown that a strictly larger convex function is obtained by means of the so-called paired calibration (Lawlor and Morgan Reference Lawlor and Morgan1994, Brakke Reference Brakke1995). In this case, the convex set is given by
 $$\begin{eqnarray}C_{{\mathcal{P}}_{2}}=\{{\it\xi}=({\it\xi}_{1},\ldots ,{\it\xi}_{K})\in \mathbb{R}^{d\times K}:|{\it\xi}_{k}-{\it\xi}_{l}|_{2}\leq 1,~\text{for all}~k\not =l\},\end{eqnarray}$$
 which has a more complicated structure than  $C_{{\mathcal{P}}_{1}}$ but improves the convex relaxation. See Figure 7.11 for a comparison. Note that unlike in the two-phase case, the relaxation is not exact. Thresholding or rounding a minimizer of the relaxed problem will only provide an approximate solution to the problem (Lellmann, Lenzen and Schnörr Reference Lellmann, Lenzen and Schnörr2013).
Demonstration of the quality using different relaxations. (a) Input image, where the task is to compute a partition of the grey zone in the middle of the image using the three colours as boundary constraints. (b) Colour-coded solution using the simple relaxation  $C_{{\mathcal{P}}_{1}}$, and (c) result using the stronger relaxation
  $C_{{\mathcal{P}}_{2}}$. Observe that the stronger relaxation exactly recovers the true solution, which is a triple junction.

For the numerical implementation we consider a straightforward discretization similar to the previous models. We consider a discrete labelling function  $\mathbf{u}=(u_{1},\ldots ,u_{K})\in \mathbb{R}^{m\times n\times K}$, and we consider the usual finite difference approximation of the gradient operator
  $\mathbf{D}:\mathbb{R}^{m\times n\times K}\rightarrow \mathbb{R}^{m\times n\times K\times 2}$, where
  $\mathbf{D}\mathbf{u}=(\text{D}u_{1},\ldots ,\text{D}u_{K})$ and
  $\text{D}$ is defined in (2.4). Furthermore, we are given a discrete weight function
  $\mathbf{w}=(w_{1},\ldots ,w_{K})\in \mathbb{R}^{m\times n\times K}$. Therefore the discrete pendant of the Potts model is given by
 $$\begin{eqnarray}\min _{\mathbf{u}}\Vert \mathbf{D}\mathbf{u}\Vert _{2,{\mathcal{P}}}+\mathop{\sum }_{k=1}^{K}\langle u_{k},w_{k}\rangle ,\quad \text{such that }\mathbf{u}_{i,j}\in {\mathcal{S}}_{K-1},\end{eqnarray}$$
and the vectorial total variation that is intended to measure half the length of the total boundaries is given by
 $$\begin{eqnarray}\Vert \mathbf{D}\mathbf{u}\Vert _{2,{\mathcal{P}}}=\sup _{\mathbf{P}}\langle \mathbf{D}\mathbf{u},\mathbf{P}\rangle ,\quad \text{such that }\mathbf{P}_{i,j}\in C_{{\mathcal{P}}}~\text{for all}~i,j,\end{eqnarray}$$
 where  $\mathbf{P}\in \mathbb{R}^{m\times n\times 2\times K}$ is the tensor-valued dual variable. Combining the two last equations already leads to a saddle-point problem that can be solved using Algorithm 6 (PDHG). It remains to detail the pixelwise projections onto the simplex constraints
  $\mathbf{u}_{i,j}\in {\mathcal{S}}_{K-1}$ and the constraints
  $\mathbf{P}_{i,j}\in C_{{\mathcal{P}}}$ on the dual variables. The projection on the
  $(K-1)$-dimensional simplex
  ${\mathcal{S}}_{K-1}$ can be done for each pixel independently in
  $K\log K$ time or even in expected linear time; see for example Duchi, Shalev-Shwartz, Singer and Chandra (Reference Duchi, Shalev-Shwartz, Singer and Chandra2008). The complexity of the projection onto
  $C_{{\mathcal{P}}}$ depends on the particular choice of the set. If we choose the weaker set
  $C_{{\mathcal{P}}_{1}}$ the projection reduces to
  $K$ independent projections onto the
  $2$-ball with radius
  $1/2$. If we choose the stronger relaxation
  $C_{{\mathcal{P}}_{2}}$, no closed-form solution is available to compute the projection. A natural approach is to implement Dykstra’s iterative projection method (Dykstra Reference Dykstra1983), as
  $C_{{\mathcal{P}}_{2}}$ is the intersection of simple convex sets on which a projection is straightforward. Another efficient possibility would be to introduce Lagrange multipliers for the constraints defining this set, but in a progressive way as they get violated. Indeed, in practice, it turns out that few of these constraints are actually active, in general no more than two or three, and only in a neighbourhood of the boundary of the segmentation.
Interactive image segmentation using the multilabel Potts model. (a) Input image overlaid with the initial segmentation provided by the user. (b) Final segmentation, where the colour values correspond to the average colours of the segments. (c–f) The corresponding phases  $u_{k}$. Observe that the phases are close to binary and hence the algorithm was able to find an almost optimal solution.

Figure 7.12 shows the application of interactive multilabel image segmentation using four phases. We again use the user input to specify the desired regions, and we fit Gaussian mixture models (7.24)  $G^{k}(\cdot ;\boldsymbol{{\it\mu}}^{k},\boldsymbol{{\rm\Sigma}}^{k},\boldsymbol{{\it\alpha}}^{k}))$,
  $k=1,\ldots ,K$ with
  $10$ components to those initial regions. The weight functions
  $w_{k}$ are computed using the negative log probability of the respective mixture models, that is,
 $$\begin{eqnarray}w_{i,j,k}=-\log G^{k}(\mathbf{u}_{i,j}^{\diamond };\boldsymbol{{\it\mu}}^{k},\boldsymbol{{\rm\Sigma}}^{k},\boldsymbol{{\it\alpha}}^{k}),\quad k=1,\ldots ,K.\end{eqnarray}$$
 It can be observed that the computed phases  $u_{k}$ are almost binary, which indicates that the computed solution is close to a globally optimal solution.
7.11 Curvature
Using curvature information in imaging is mainly motivated by findings in psychology that so-called subjective (missing) object boundaries that are seen by humans are linear or curvilinear (Kanizsa Reference Kanizsa1979). Hence such boundaries can be well recovered by minimizing the ‘elastica functional’
 $$\begin{eqnarray}\int _{{\it\gamma}}({\it\alpha}+{\it\beta}{\it\kappa}^{2})\text{d}{\it\gamma},\end{eqnarray}$$
 where  ${\it\alpha}>0$,
  ${\it\beta}>0$ are weighting parameters,
  ${\it\gamma}$ is a smooth curve, and
  ${\it\kappa}$ is its curvature. Psychological experiments also suggest that such a process must take place at a very early stage in the human visual system, as it is so strong that it cannot be resolved even if the structures seen become absurd to the human observer. It is therefore natural that curvature information provides a very strong prior for recovering missing parts of an image (Masnou and Morel Reference Masnou and Morel2006) or to resolve occluded objects (Nitzberg, Mumford and Shiota Reference Nitzberg, Mumford and Shiota1993).
In order to construct a regularization term for images, the most natural idea (Masnou and Morel Reference Masnou and Morel2006, Ambrosio and Masnou Reference Ambrosio and Masnou2003) is to apply the elastica energy to the level lines of a sufficiently smooth (twice-differentiable) image:
 $$\begin{eqnarray}\int _{{\rm\Omega}}|{\rm\nabla}u|\biggl({\it\alpha}+{\it\beta}\biggl(\text{div}\displaystyle \frac{{\rm\nabla}u}{|{\rm\nabla}u|}\biggr)^{2}\biggr)\text{d}x.\end{eqnarray}$$
 Here,  $\text{div}({\rm\nabla}u/|{\rm\nabla}u|)={\it\kappa}_{\{u=u(x)\}}(x)$ represents the curvature of the level line/surface of
  $u$ passing through
  $x$, and thanks to the co-area formula this expression can (or should) also be written as
 $$\begin{eqnarray}\int _{-\infty }^{+\infty }\int _{{\rm\Omega}\cap \partial \{u>s\}}({\it\alpha}+{\it\beta}{\it\kappa}_{\{u>s\}}^{2})\text{d}{\mathcal{H}}^{d-1}(x)\text{d}s.\end{eqnarray}$$
Masnou and Morel (Reference Masnou and Morel2006) propose an algorithm based on dynamic programming that can find globally optimal solutions to this highly non-convex optimization problem. The authors apply the elastica model to the problem of recovering missing parts of an image. Although the model is simple, it yields faithful reconstructions.
However, curvature is notoriously difficult to minimize and hence its utilization as a regularization term in imaging is still limited. In Bredies, Pock and Wirth (Reference Bredies, Pock and Wirth2013), a convex relaxation approach was proposed to find a convex representation of curvature-dependent regularization functionals. The idea is based on work by Citti and Sarti (Reference Citti and Sarti2006), who proposed representing images in the so-called roto-translation space in order to perform amodal completion. The basic idea is to lift the gradient of a two-dimensional image to a three-dimensional space, where the third dimension is given by the orientation of the image gradient. The lifting of the image gradient is defined via the non-negative measure  ${\it\mu}={\it\mu}(Du)$ given by
 $$\begin{eqnarray}\int _{{\rm\Omega}}{\it\varphi}\text{d}{\it\mu}=\int _{{\rm\Omega}}{\it\varphi}(x,-{\it\sigma}(x)^{\bot })\text{d}|Du|,\end{eqnarray}$$
 for all test functions that are continuous and compactly supported on the image domain  ${\rm\Omega}$. Here
  ${\it\sigma}(x)$ denotes the local orientation of the image gradient (e.g.
  $Du={\it\sigma}|Du|$), and
  $\bot$ denotes an anticlockwise rotation by 90 degrees, and hence
  $-{\it\sigma}(x)^{\bot }$ is such that the image function
  $u$ is increasing on its left-hand side. An appealing property of this representation is that the image gradient can be recovered from the lifted representation via a linear constraint:
 $$\begin{eqnarray}\int _{{\rm\Omega}}{\it\varphi}\cdot \text{d}Du=\int _{{\rm\Omega}\times \mathbb{S}^{1}}{\it\varphi}(x)\cdot {\it\vartheta}^{\bot }\text{d}{\it\mu}(x,{\it\vartheta}).\end{eqnarray}$$
In the lifted space a new regularization term can be defined that penalizes curvature information. Such a regularizer – called total vertex regularization (TVX) – is given by
 $$\begin{eqnarray}\sup _{{\it\psi}(x,\cdot )\in B_{{\it\rho}}}\int _{{\rm\Omega}\times \mathbb{S}^{1}}D_{x}{\it\psi}(x,{\it\vartheta})\cdot {\it\vartheta}\text{d}{\it\mu}(x,{\it\vartheta}),\end{eqnarray}$$
 where  $D_{x}{\it\psi}(x,{\it\vartheta})\cdot {\it\vartheta}$ is the directional derivative in the direction of
  ${\it\theta}$, and
  $B_{{\it\rho}}$ defines the pre-dual ball for any metric
  ${\it\rho}$ on
  $\mathbb{S}^{1}$:
 $$\begin{eqnarray}\displaystyle B_{{\it\rho}}=\{{\it\varphi}\in C(\mathbb{S}^{1}):{\it\varphi}({\it\eta}_{1})-{\it\varphi}({\it\eta}_{2})\leq {\it\rho}({\it\eta}_{1},{\it\eta}_{2})\quad \text{for all}~({\it\eta}_{1},{\it\eta}_{2})\in \mathbb{S}^{1}\times \mathbb{S}^{1}\} & & \displaystyle\end{eqnarray}$$
 Several metrics  ${\it\rho}$ can be considered: One choice is the
  $\ell _{0}$-metric or Potts metric, which counts the number of ‘corners’. In this case,
  ${\it\rho}({\it\eta}_{1},{\it\eta}_{2})=1$ for
  ${\it\eta}_{1}\neq {\it\eta}_{2}$, and the pre-dual ball is simply given by
 $$\begin{eqnarray}B_{0}=\mathbf{1}\cdot \mathbb{R}+\biggl\{\Vert {\it\varphi}\Vert _{\infty }\leq \displaystyle \frac{1}{2}\biggr\},\end{eqnarray}$$
 which is the set of all constant functions plus the  $\infty$-ball of radius
  $1/2$. In what follows, we call the corresponding model the TVX
 $^{0}$ model.
Another natural choice is the  $\ell _{1}$-metric, which is equivalent to the total absolute curvature on smooth parts and penalizes the unsigned external angle between two joining line segments: hence
  ${\it\rho}({\it\eta}_{1},{\it\eta}_{2})=\text{dist}({\it\eta}_{1},{\it\eta}_{2})$. This model is referred to as the TVX
 $^{1}$ model. The corresponding pre-dual ball
  $B_{1}$ is given by
 $$\begin{eqnarray}B_{1}=\{{\it\varphi}\in C(\mathbb{S}^{1}):\Vert D{\it\varphi}\Vert _{\infty }\leq 1\},\end{eqnarray}$$
that is, the set of 1-Lipschitz continuous functions.
An extension to non-metrics on  $\mathbb{S}^{1}$ (e.g. the squared curvature) requires lifting to the space of pairs of orientations; see for example Bredies, Pock and Wirth (Reference Bredies, Pock and Wirth2015b), Schoenemann and Cremers (Reference Schoenemann and Cremers2007) and Schoenemann, Masnou and Cremers (Reference Schoenemann, Masnou and Cremers2011).
Interestingly, the total variation in the lifted space is equivalent to the norm  $\Vert {\it\mu}\Vert _{{\mathcal{M}}}$, which is the total variation or mass of the measure
  ${\it\mu}$, defined in the classical sense by
 $$\begin{eqnarray}\Vert {\it\mu}\Vert _{{\mathcal{M}}}:=\sup \biggl\{\mathop{\sum }_{i}|{\it\mu}(E_{i})|:E_{i}\text{ disjoint sets}\biggr\},\end{eqnarray}$$
 and which generalizes the  $L^{1}$-norm to measures (Evans and Gariepy Reference Evans and Gariepy1992). This enforces sparsity of the lifted measure
  ${\it\mu}$. In practice, it turns out that a combination of total variation regularization and total vertex regularization performs best. An image restoration model combining both total variation and total vertex regularization is given by
 $$\begin{eqnarray}\displaystyle & & \displaystyle \!\min _{(u,{\it\mu})}{\it\alpha}\sup _{{\it\psi}(x,\cdot )\in B_{{\it\rho}}}\int _{{\rm\Omega}\times \mathbb{S}^{1}}D_{x}{\it\psi}(x,{\it\vartheta})\cdot {\it\vartheta}\text{d}{\it\mu}(x,{\it\vartheta})+{\it\beta}\Vert {\it\mu}\Vert _{{\mathcal{M}}}+\frac{1}{2}\Vert u-u^{\diamond }\Vert ^{2},\nonumber\\ \displaystyle & & \displaystyle \text{such that }(u,{\it\mu})\in L_{Du}^{{\it\mu}}=\{(u,{\it\mu})\mid {\it\mu}\text{ is the lifting of }Du\},\end{eqnarray}$$
 where  ${\it\alpha}$ and
  ${\it\beta}$ are tuning parameters. Clearly, the constraint that
  ${\it\mu}$ is a lifting of
  $Du$ represents a non-convex constraint. A convex relaxation of this constraint is obtained by replacing
  $L_{Du}^{{\it\mu}}$ with the following convex constraint:
 $$\begin{eqnarray}L_{Du}^{{\it\mu}}=\biggl\{(u,{\it\mu})\mid {\it\mu}\geq 0,\;\int _{{\rm\Omega}}{\it\varphi}\cdot \text{d}Du=\int _{{\rm\Omega}\times \mathbb{S}^{1}}{\it\varphi}(x)\cdot {\it\vartheta}^{\bot }\text{d}{\it\mu}(x,{\it\vartheta})\biggr\},\end{eqnarray}$$
 for all smooth test functions  ${\it\varphi}$ that are compactly supported on
  ${\rm\Omega}$. With this, the problem becomes convex and can be solved. However, it remains unclear how close minimizers of the relaxed problem are to minimizers of the original problem.
It turns out that the total vertex regularization functional works best for inpainting tasks, since it tries to connect level lines in the image with curves with a small number of corners or small curvature. Tackling the TVX models numerically is not an easy task because the lifted measure is expected to concentrate on line-like structures in the roto-translational space. Let us assume our image is defined on a rectangular domain  ${\rm\Omega}=[0,n)\times [0,m)$. On this domain we consider a collection of square pixels
  $\{{\rm\Omega}_{i,j}\}_{i=1,j=1}^{m,n}$ with
  ${\rm\Omega}_{i,j}=[j-1,j)\times [i-1,i)$, such that
  ${\rm\Omega}=\bigcup _{i=1,j=1}^{m,n}{\rm\Omega}_{i,j}.$ Furthermore, we consider a collection of grid points
  $\{x_{i,j}\}_{i=1,j=1}^{m,n}$ with
  $x_{i,j}=(j,i)$ such that the grid points
  $x_{i,j}$ are located on the lower right corners of the corresponding image pixels
  ${\rm\Omega}_{i,j}$. Using the collection of image pixels, we consider a piecewise constant image
 $$\begin{eqnarray}u=\{u:{\rm\Omega}\rightarrow \mathbb{R}:u(x)=U_{i,j},\;\text{for all}~x\in {\rm\Omega}_{i,j}\},\end{eqnarray}$$
 where  $U\in \mathbb{R}^{m\times n}$ is the discrete version of the continuous image
  $u$.
$u$.
Following Bredies et al. (Reference Bredies, Pock and Wirth2015b), we use a neighbourhood system based on a set of  $o$ distinct displacement vectors
  ${\it\delta}_{k}=({\it\delta}_{k}^{1},{\it\delta}_{k}^{2})\in \mathbb{Z}^{2}$. On a regular grid, it is natural to define a system consisting of
  $4,8,16,32$, etc. neighbours.
A  $16$-neighbourhood system on the grid. The black dots refer to the grid points
  $x_{i,j}$, the shaded squares represent the image pixels
  ${\rm\Omega}_{i,j}$, and the line segments
  $l_{i,j,k}$ connecting the grid points are depicted by thick lines.

Figure 7.13 depicts an example based on a neighbourhood system of  $16$ neighbours. The displacement vectors naturally imply orientations
  ${\it\vartheta}_{k}\in \mathbb{S}^{1}$, defined by
  ${\it\vartheta}_{k}={\it\delta}_{k}/|{\it\delta}_{k}|_{2}$. We shall assume that the displacement vectors
  ${\it\delta}_{k}$ are ordered such that the corresponding orientations
  ${\it\vartheta}_{k}$ are ordered on
  $\mathbb{S}^{1}$.
Next, we consider a collection of line segments  $\{l_{i,j,k}\}_{i=1,j=1,k=1}^{m,n,o}$, where the line segments
  $l_{i,j,k}=[x_{i,j},x_{i,j}+{\it\delta}_{k}]$ connect the grid points
  $x_{i,j}$ to a collection of neighbouring grid points
  $x_{\hat{\imath },\hat{\jmath }}$, as defined by the neighbourhood system. The measure
  ${\it\mu}$ is discretized on these line segments: we assume it is given by
 $$\begin{eqnarray}{\it\mu}=\mathop{\sum }_{i,j,k}V_{i,j,k}{\mathcal{H}}^{1}|_{l_{i,j,k}}\otimes {\it\delta}_{{\it\theta}_{k}}.\end{eqnarray}$$
 It means that  ${\it\mu}$ is the finite-dimensional combination of small ‘line measures’ (here
  ${\mathcal{H}}^{1}$ is the Hausdorff one-dimensional measure) supported by the segment
  $l_{i,j,k}$ for
  ${\it\theta}={\it\theta}_{k}$. The coordinates
  $V\in \mathbb{R}^{m\times n\times o}$ can be recovered from
  ${\it\mu}$ by computing the averages along the line segment
  $l_{i,j,k}$ for all
  $i,j,k$:
 $$\begin{eqnarray}V_{i,j,k}=\frac{1}{|{\it\delta}_{k}|_{2}}\int _{l_{i,j,k}}\text{d}{\it\mu}(x,{\it\vartheta}_{k}).\end{eqnarray}$$
 In order to approximate the compatibility constraint in (7.36), we introduce a family of test functions  ${\it\varphi}_{i,j}(x):{\rm\Omega}\rightarrow \mathbb{R}^{2}$ which are given by
 $$\begin{eqnarray}{\it\varphi}_{i,j}(x)=\left(\begin{array}{@{}c@{}}\max \{0,1-|x_{1}-j|\}\mathbf{1}_{[i-1,i]}(x_{2})\\ \mathbf{1}_{[j-1,j]}(x_{1})\max \{0,1-|x_{2}-i|\}\end{array}\right)\!.\end{eqnarray}$$
 Observe that the test functions are given by the product of a triangular and a rectangular interpolation kernel, which can be interpreted as performing a linear interpolation in one direction and a nearest-neighbour interpolation in the other direction. Using these test functions in (7.36), and thanks to the fact that the image  $u$ is piecewise constant, we obtain the collection of discrete constraints
 $$\begin{eqnarray}\displaystyle \left(\begin{array}{@{}c@{}}U_{i,j+1}-U_{i,j}\\ U_{i+1,j}-U_{i,j}\end{array}\right) & = & \displaystyle \int _{[j-1,j+1]\times [i-1,i+1]\times \mathbb{S}^{1}}{\it\phi}_{i,j}(x)\cdot {\it\vartheta}^{\bot }\text{d}{\it\mu}(x,{\it\theta})\nonumber\\ \displaystyle & = & \displaystyle \mathop{\sum }_{\hat{\imath },\hat{\jmath }}\mathop{\sum }_{k=1}^{o}V_{\hat{\imath },\hat{\jmath },k}\,\int _{l_{\hat{\imath },\hat{\jmath },k}}{\it\vartheta}_{k}^{\bot }\cdot {\it\varphi}_{i,j}(x)\text{d}x\quad \Longleftrightarrow \quad \text{D}U=\text{C}V.\nonumber\end{eqnarray}$$
 The operator  $\text{D}:\mathbb{R}^{m\times n}\rightarrow \mathbb{R}^{m\times n\times 2}$ is the usual finite differences operator, as introduced in (2.4), and the operator
  $\text{C}:\mathbb{R}^{m\times n\times o}\rightarrow \mathbb{R}^{m\times n\times 2}$ holds the coefficients given by the value of the line integrals. Note that
  $\text{C}$ will be very sparse since for each grid point
  $x_{i,j}$ only a small number of line segments will intersect with the non-zero part of the test function
  ${\it\varphi}_{i,j}$. Observe that the integrals over the line segments can be computed in closed form since the test functions
  ${\it\varphi}_{i,j}$ are piecewise affine functions.
In the lifted space, we will need to compute the directional derivatives  $D_{x}{\it\psi}(x,{\it\vartheta})\cdot {\it\vartheta}$. We assume that
  ${\it\psi}$ is continuous and linear on the line segments, and hence we only need to store
  ${\it\psi}$ on the end-points of the line segments
  $l_{i,j,k}$. For this we use a discrete test function
  $P\in \mathbb{R}^{m\times n\times o}$, which holds the values of
  ${\it\psi}$ on the end-points of the corresponding line segments. In turn, the directional derivatives can be computed by simple finite differences along the line segments. We therefore introduce a linear operator
  $\text{A}:\mathbb{R}^{m\times n\times o}\rightarrow \mathbb{R}^{m\times n\times o}$, which is defined by
 $$\begin{eqnarray}(\text{A}P)_{i,j,k}=\frac{P_{i^{+},j^{+},k}-P_{i,j,k}}{|{\it\delta}_{k}|_{2}},\end{eqnarray}$$
 where  $i^{+}=\max \{1,\min \{m,i+{\it\delta}_{k}^{2}\}\}$, and
  $j^{+}=\max \{1,\min \{n,j+{\it\delta}_{k}^{1}\}\}$.
In order to implement the TVX $^{1}$ model, we further introduce a linear operator
  $\text{B}:\mathbb{R}^{m\times n\times o}\rightarrow \mathbb{R}^{m\times n\times o}$, which computes the angular derivative of the test function
  ${\it\psi}$. Assuming again that
  ${\it\psi}$ is linear in the angular direction between the grid points
  $x_{i,j}$, its angular derivative can again be computed by a finite differences operator:
 $$\begin{eqnarray}(\text{B}P)_{i,j,k}=\left\{\begin{array}{@{}ll@{}}\displaystyle \frac{P_{i,j,k+1}-P_{i,j,k}}{{\it\alpha}_{k}}\quad & \text{if }k<o,\\ \displaystyle \frac{P_{i,j,1}-P_{i,j,k}}{{\it\alpha}_{k}}\quad & \text{if }k=o,\end{array}\right.\end{eqnarray}$$
 where the factors  ${\it\alpha}_{k}$ are given by angular differences between the two corresponding line segments.
As mentioned above, the total variation in the lifted space is given by the norm  $\Vert {\it\mu}\Vert _{{\mathcal{M}}}$. The discrete variant using the discrete measure
  $V$ reads
 $$\begin{eqnarray}\mathop{\sum }_{i,j,k}|{\it\delta}_{k}|_{2}V_{i,j,k},\end{eqnarray}$$
 where  $|{\it\delta}_{k}|_{2}$ is the length of the corresponding line segment.
Comparison of TVX $^{0}$ (b–e) and TVX
 $^{1}$ (f–i) regularization for shape denoising. One can see that TVX
 $^{0}$ leads to a gradually simplified polygonal approximation of the shape in
  $F$ whereas TVX
 $^{1}$ leads to an approximation by piecewise smooth shapes.
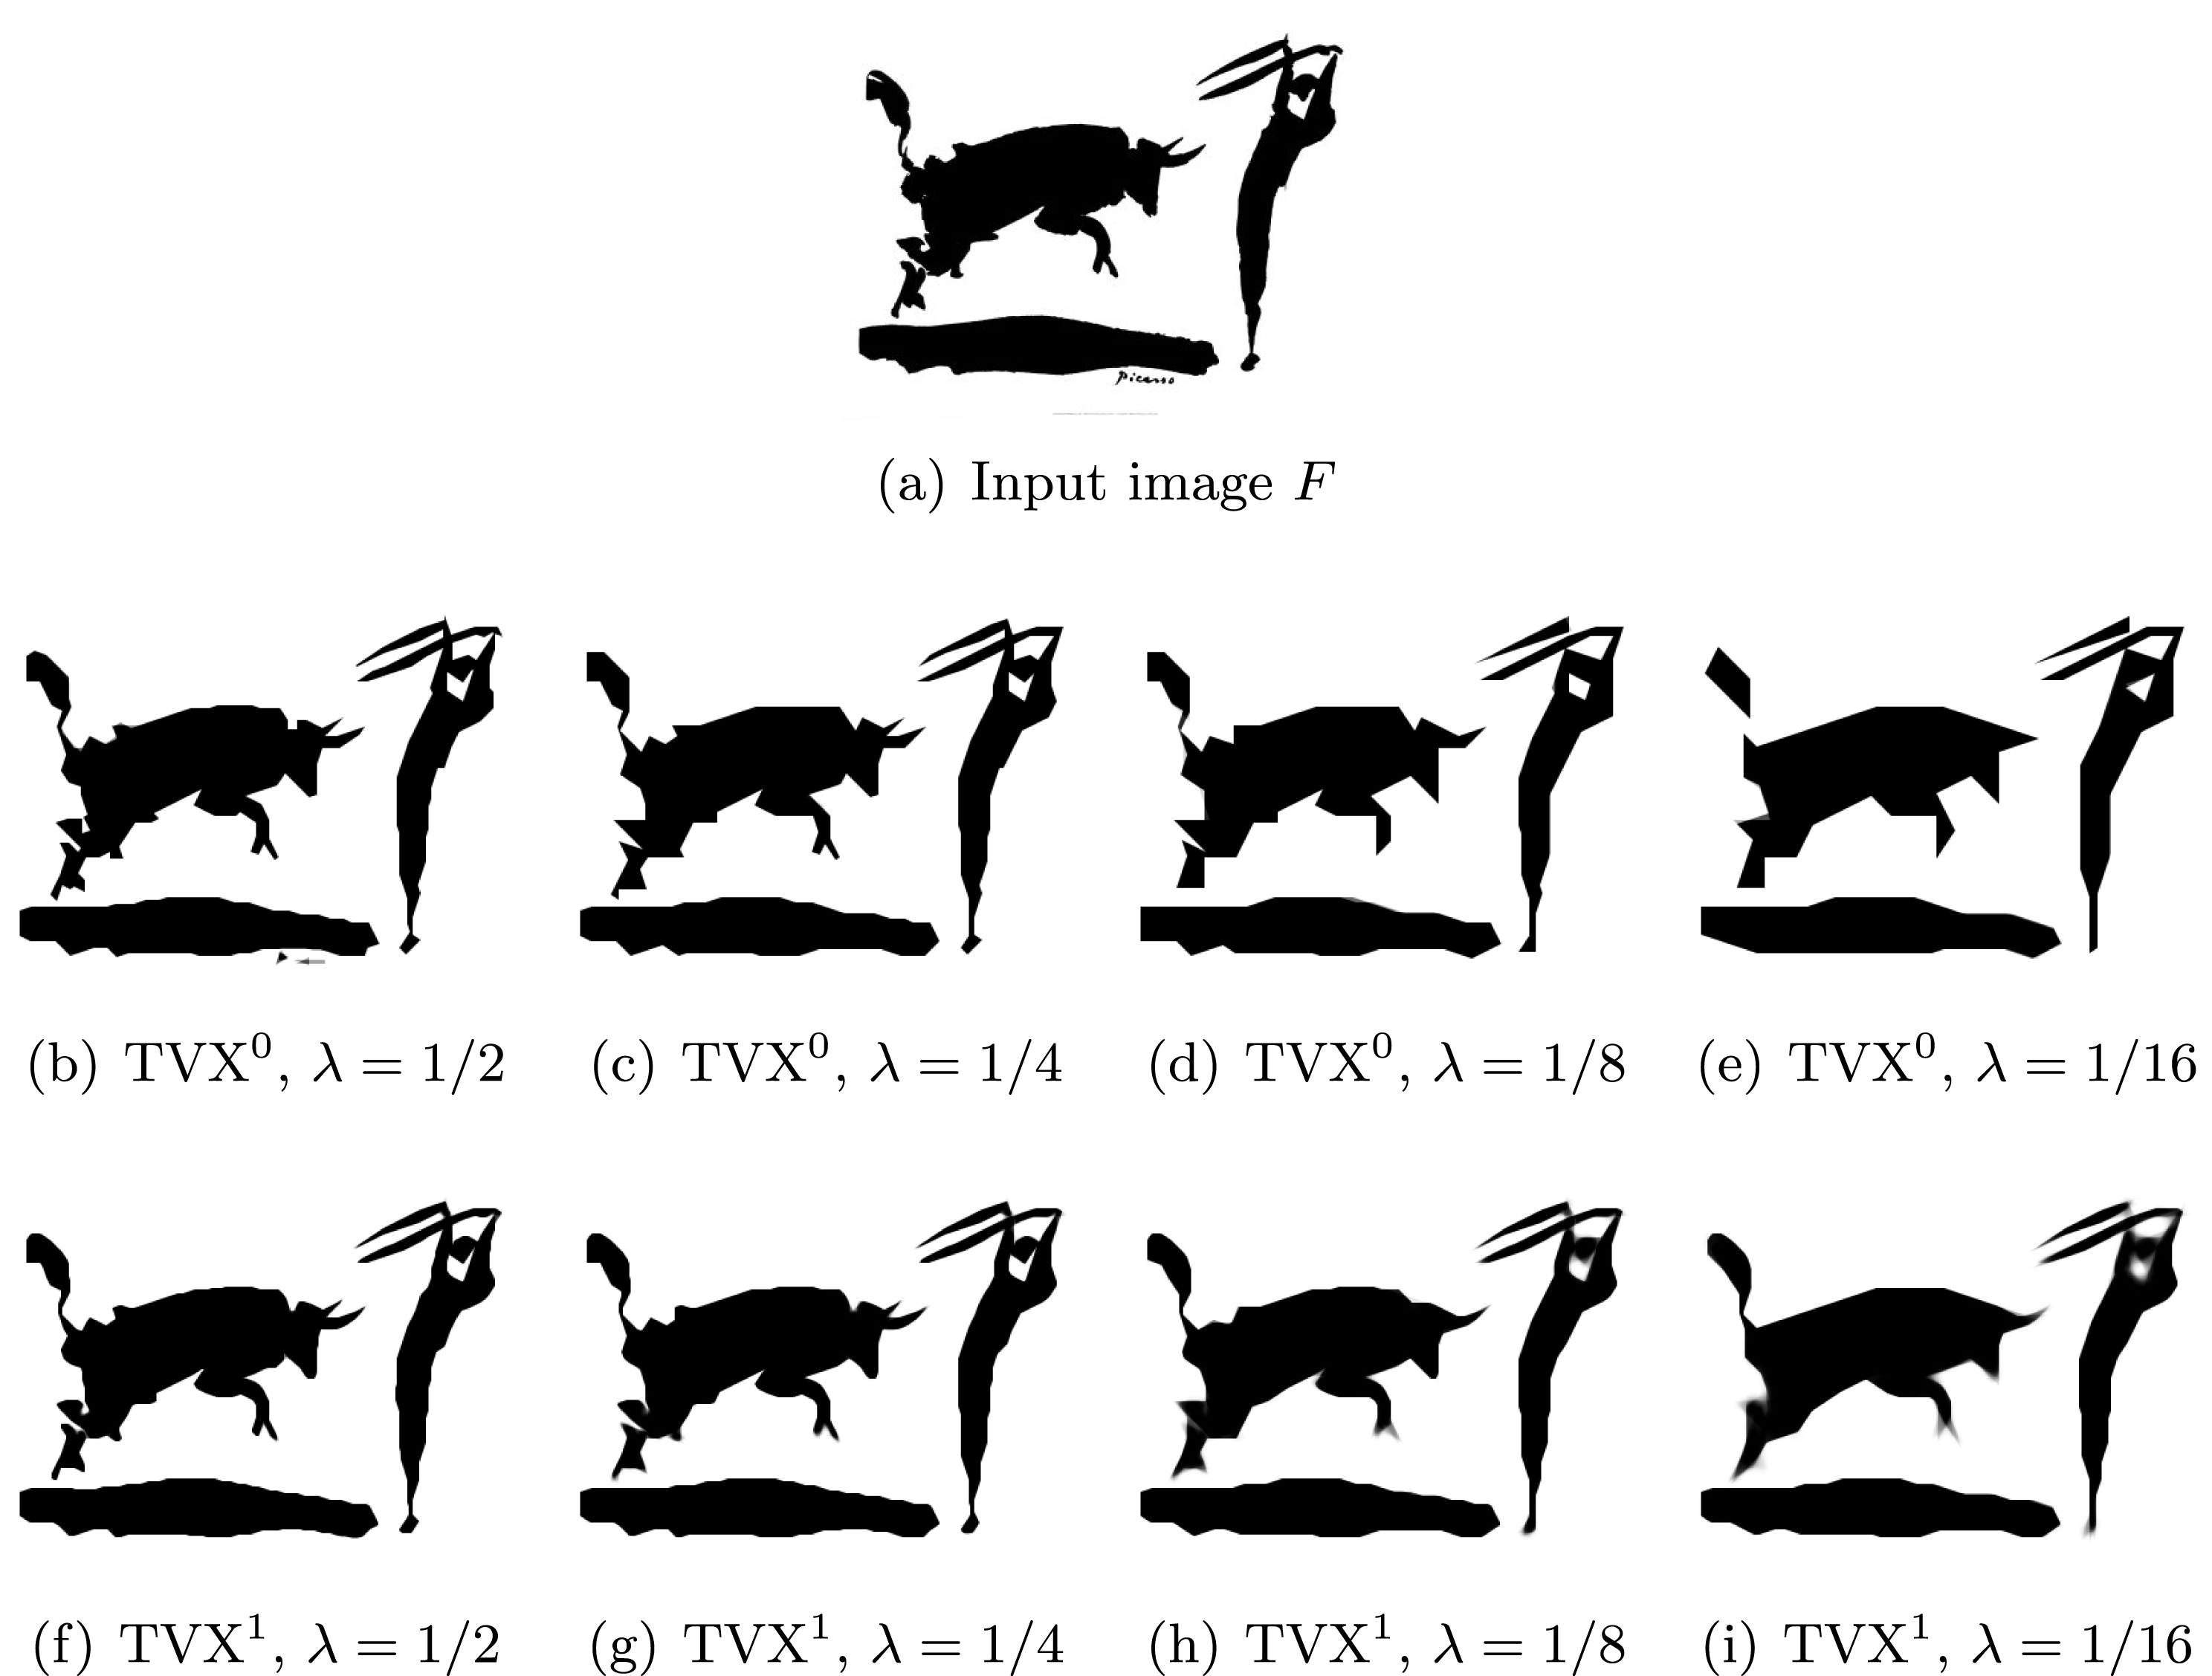
We are now ready to state the discrete approximations of the TVX models:
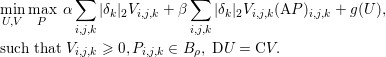 $$\begin{eqnarray}\displaystyle & & \displaystyle \min _{U,V}\max _{P}\;{\it\alpha}\mathop{\sum }_{i,j,k}|{\it\delta}_{k}|_{2}V_{i,j,k}+{\it\beta}\mathop{\sum }_{i,j,k}|{\it\delta}_{k}|_{2}V_{i,j,k}(\text{A}P)_{i,j,k}+g(U),\nonumber\\ \displaystyle & & \displaystyle \text{such that}\;V_{i,j,k}\geq 0,P_{i,j,k}\in B_{{\it\rho}},\;\text{D}U=\text{C}V.\nonumber\end{eqnarray}$$
 The function  $g(U)$ is a data-fitting term, which defines the type of application of the model. The TVX
 $^{0}$ model is obtained by using the constraint
  $|P_{i,j,k}|\leq 1/2$ and the TVX
 $^{1}$ model is obtained by using the constraint
  $|(\text{B}P)_{i,j,k}|\leq 1$.
Introducing additional Lagrange multipliers, the above problems can be easily turned into a standard saddle-point form which can be tackled by Algorithm 6 (PDHG). We leave this task to the reader.
In a first experiment, we apply the TVX models to shape denoising. Consider a shape encoded as a binary image  $F$. The idea is to compute a (relaxed) binary image
  $U$ that approximates the shape of
  $F$ by minimizing the TVX energy. For this, we consider a data-fitting term
  $g(U)={\it\lambda}\langle U,0.5-F\rangle +{\it\delta}_{[0,1]^{m\times n\times o}}(U)$, which measures the difference between the shapes in
  $U$ and
  $F$ and forces the values of
  $U$ to stay in the interval
  $[0,1]$. In all experiments we set
  ${\it\alpha}=0.01$,
  ${\it\beta}=1$ and we use
  $o=32$ discrete orientations. In Figure 7.14 we show the results of TVX
 $^{1}$ and TVX
 $^{0}$ regularization using different weights
  ${\it\lambda}$ in the data-fitting term. It can be seen that TVX
 $^{0}$ minimizes the number of corners of the shape in
  $U$ and hence leads to a gradually simplified polygonal approximation of the original shape. TVX
 $^{1}$ minimizes the total curvature of the shape in
  $U$ and hence leads to a piecewise smooth approximation of the shape.
Visualization of the measure  ${\it\mu}$ in the roto-translation space for the image of Figure 7.14(e), obtained using TVX
 $^{0}$ regularization. Observe that the measure
  ${\it\mu}$ indeed concentrates on thin lines in this space.

In Figure 7.15 we provide a visualization of the measure  ${\it\mu}$ in the roto-translation space for the image shown in Figure 7.14(e), obtained using TVX
 $^{0}$ regularization. One can observe that in our discrete approximation the measure
  ${\it\mu}$ nicely concentrates on thin lines in the roto-translation space.
Image inpainting using TVX $^{1}$ regularization. (a,c,e) Input image with
  $90\%$ missing pixels and recovered solutions. (b,d,f) Input image with
  $80\%$ missing lines and recovered solutions.

In our second experiment we consider image inpainting. For this we choose
 $$\begin{eqnarray}g(U)=\mathop{\sum }_{(i,j)\in {\mathcal{I}}}{\it\delta}_{\{U_{i,j}^{\diamond }\}}(U_{i,j}),\end{eqnarray}$$
 where  $U^{\diamond }\in \mathbb{R}^{m\times n}$ is a given image and
  ${\mathcal{I}}$ defines the set of indices for which pixel information is available. Figure 7.16 shows the image inpainting results, where we have used the same test image as in Figure 7.7. The parameters
  ${\it\alpha},{\it\beta}$ of the TVX model were set to
  ${\it\alpha}=0.01$,
  ${\it\beta}=1$, and we used
  $o=32$ discrete orientations. The parameter
  ${\it\alpha}$ is used to control the amount of total variation regularization while the parameter
  ${\it\beta}$ is used to control the amount of curvature regularization. We tested two different kinds of missing pixel information. In the experiment shown on the left we randomly threw away
  $90\%$ of the image pixels, whereas in the experiment shown on the right we skipped
  $80\%$ of entire rows of the image. From the results one can see that the TVX
 $^{1}$ models can faithfully reconstruct the missing image information even if there are large gaps.
Denoising an image containing salt-and-pepper noise. (a) Noisy image degraded by  $20\%$ salt-and-pepper noise. (b) Denoised image using TVX
 $^{1}$ regularization. Note the significant improvement over the result of the TV-
 $\ell _{1}$ model, shown in Figure 2.3.

In our third experiment we apply the TVX $^{1}$ regularizer for image denoising in the presence of salt-and-pepper noise. Following the classical TV-
 $\ell _{1}$ model, we used a data term based on the
  $\ell _{1}$-norm:
 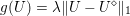 $g(U)={\it\lambda}\Vert U-U^{\diamond }\Vert _{1}$, where
  $U^{\diamond }$ is the given noisy image. We applied the TVX
 $^{1}$ model to the same test image as used in Figure 2.3. In this experiment the parameters for the regularizer were set to
  ${\it\alpha}=0.01$,
  ${\it\beta}=1$. For the data term we used
  ${\it\lambda}=0.25$, and we used
  $o=32$ discrete orientations. Figure 7.17 shows the results obtained by minimizing the TVX
 $^{1}$ model. The result shows that the TVX
 $^{1}$ model performs particularly well at preserving thin and elongated structures (e.g. on the glass pyramid). The main reason why these models works so well when applied to salt-and-pepper denoising is that the problem is actually very close to inpainting, for which curvature minimizing models were originally developed.
7.12 Lasso and dictionary learning
Let us return to one of the first sparse models considered in this paper, the Lasso model (2.2). We will describe how the Lasso model can be used for image denoising. This technique is related to state-of-the art non-local approaches for image denoising, although somewhat simplified (see the references in the Introduction). Let  $p=(p_{1},\ldots ,p_{k})$ be a set of
  $k$ image patches, where each patch
  $p_{i}$,
  $i=1\ldots ,k$ is of size
  $m\times n$ pixels. From the patches we form a matrix
  $P=(P_{1},\ldots ,P_{k})\in \mathbb{R}^{mn\times k}$, where
  $P_{i}\in \mathbb{R}^{mn}$ is a vectorized version of the patch
  $p_{i}$. Moreover, we consider a dictionary
  $D=(D_{1},\ldots ,D_{l})\in \mathbb{R}^{mn\times l}$, where each
  $D_{j}\in \mathbb{R}^{mn}$,
  $j=1,\ldots ,l$ are the atoms of the dictionary. Our goal is now to find a dictionary that allows for a sparse representation of the entire set of patches. The Lasso model specialized to this setting is given by
 $$\begin{eqnarray}\min _{X,D}{\it\lambda}\Vert X\Vert _{1}+\displaystyle \frac{1}{2}\Vert DX-P\Vert _{2}^{2},\end{eqnarray}$$
 where  $X=(X_{1},\ldots ,X_{l})\in \mathbb{R}^{l\times k}$ is a matrix holding the coefficients of the dictionary and
  ${\it\lambda}>0$ is the regularization parameter. The basic idea behind learning an optimal dictionary is based on minimizing the Lasso problem with respect to both
  $X$ and
  $D$. See for example Olshausen and Field (Reference Olshausen and Field1997) for one of the first attempts, Aharon et al. (Reference Aharon, Elad and Bruckstein2006) for an algorithm based on the singular value decomposition, Lee, Battle, Raina and Ng (Reference Lee, Battle, Raina, Ng, Schölkopf, Platt and Hoffman2007) for an algorithm based on alternating minimization, and Mairal, Bach, Ponce and Sapiro (Reference Mairal, Bach, Ponce and Sapiro2009a) for a stochastic (online) algorithm. It is now acknowledged that very large-scale Lasso problems should rather be tackled by accelerated stochastic descent algorithms, for instance the accelerated proximal coordinate gradient method (APCG) of Lin et al. (Reference Lin, Lu and Xiao2015).
Here we directly minimize the Lasso objective using the PALM algorithm (Algorithm 12). In order to eliminate scaling ambiguities, however, it is necessary to put constraints on the atoms of the dictionary. We found it useful to require that all but the first atom  $D_{1}$ should have zero mean and a
  $2$-norm less than or equal to one. The reason why we do not put any constraints on the first atom is that we expect the first atom to capture the low-frequency part of the patches and the other atoms should capture the high frequencies. Hence we consider the following convex set:
 $$\begin{eqnarray}C=\{D\in \mathbb{R}^{mn\times l}:1^{T}D_{j}=0,\;\Vert D_{j}\Vert _{2}\leq 1,\;j=2,\ldots ,l\}.\end{eqnarray}$$
 Further, since we do not expect the patches to be sparse in the low-frequency atom, we penalize the  $\ell _{1}$-norm only for the coefficients corresponding to the high-frequency patches. Using these constraints, the final dictionary learning problem takes the form
 $$\begin{eqnarray}\min _{X,D}{\it\lambda}\mathop{\sum }_{j=2}^{l}\Vert X_{j}\Vert _{1}+\displaystyle \frac{1}{2}\Vert DX-P\Vert _{2}^{2},\quad \text{such that }D\in C.\end{eqnarray}$$
 This problem is non-convex but it has a relatively nice structure, which makes Algorithm 12 suitable. Indeed the data-fitting term is smooth (quadratic) and has partially Lipschitz-continuous gradients. Furthermore, the proximal maps with respect to both the  $\ell _{1}$-norm and the convex set
  $C$ are easy to implement. The proximal map with respect to the
  $\ell _{1}$-norm can be computed by the usual soft-shrinkage formula. The projection of the dictionary onto
  $C$ is computed independently for each patch by first removing the average of each
  $D_{j}$, and then projecting onto the 2-ball with radius 1. In our experiments we used an inertial variant of the PALM algorithm, whose convergence has recently been analysed in Pock and Sabach (Reference Pock and Sabach2016).
Image denoising using a patch-based Lasso model. (a) Original image, and (b) its noisy variant, where additive Gaussian noise with standard deviation  $0.1$ has been added. (c) Learned dictionary containing
  $81$ atoms with patch size
  $9\times 9$, and (d) final denoised image.
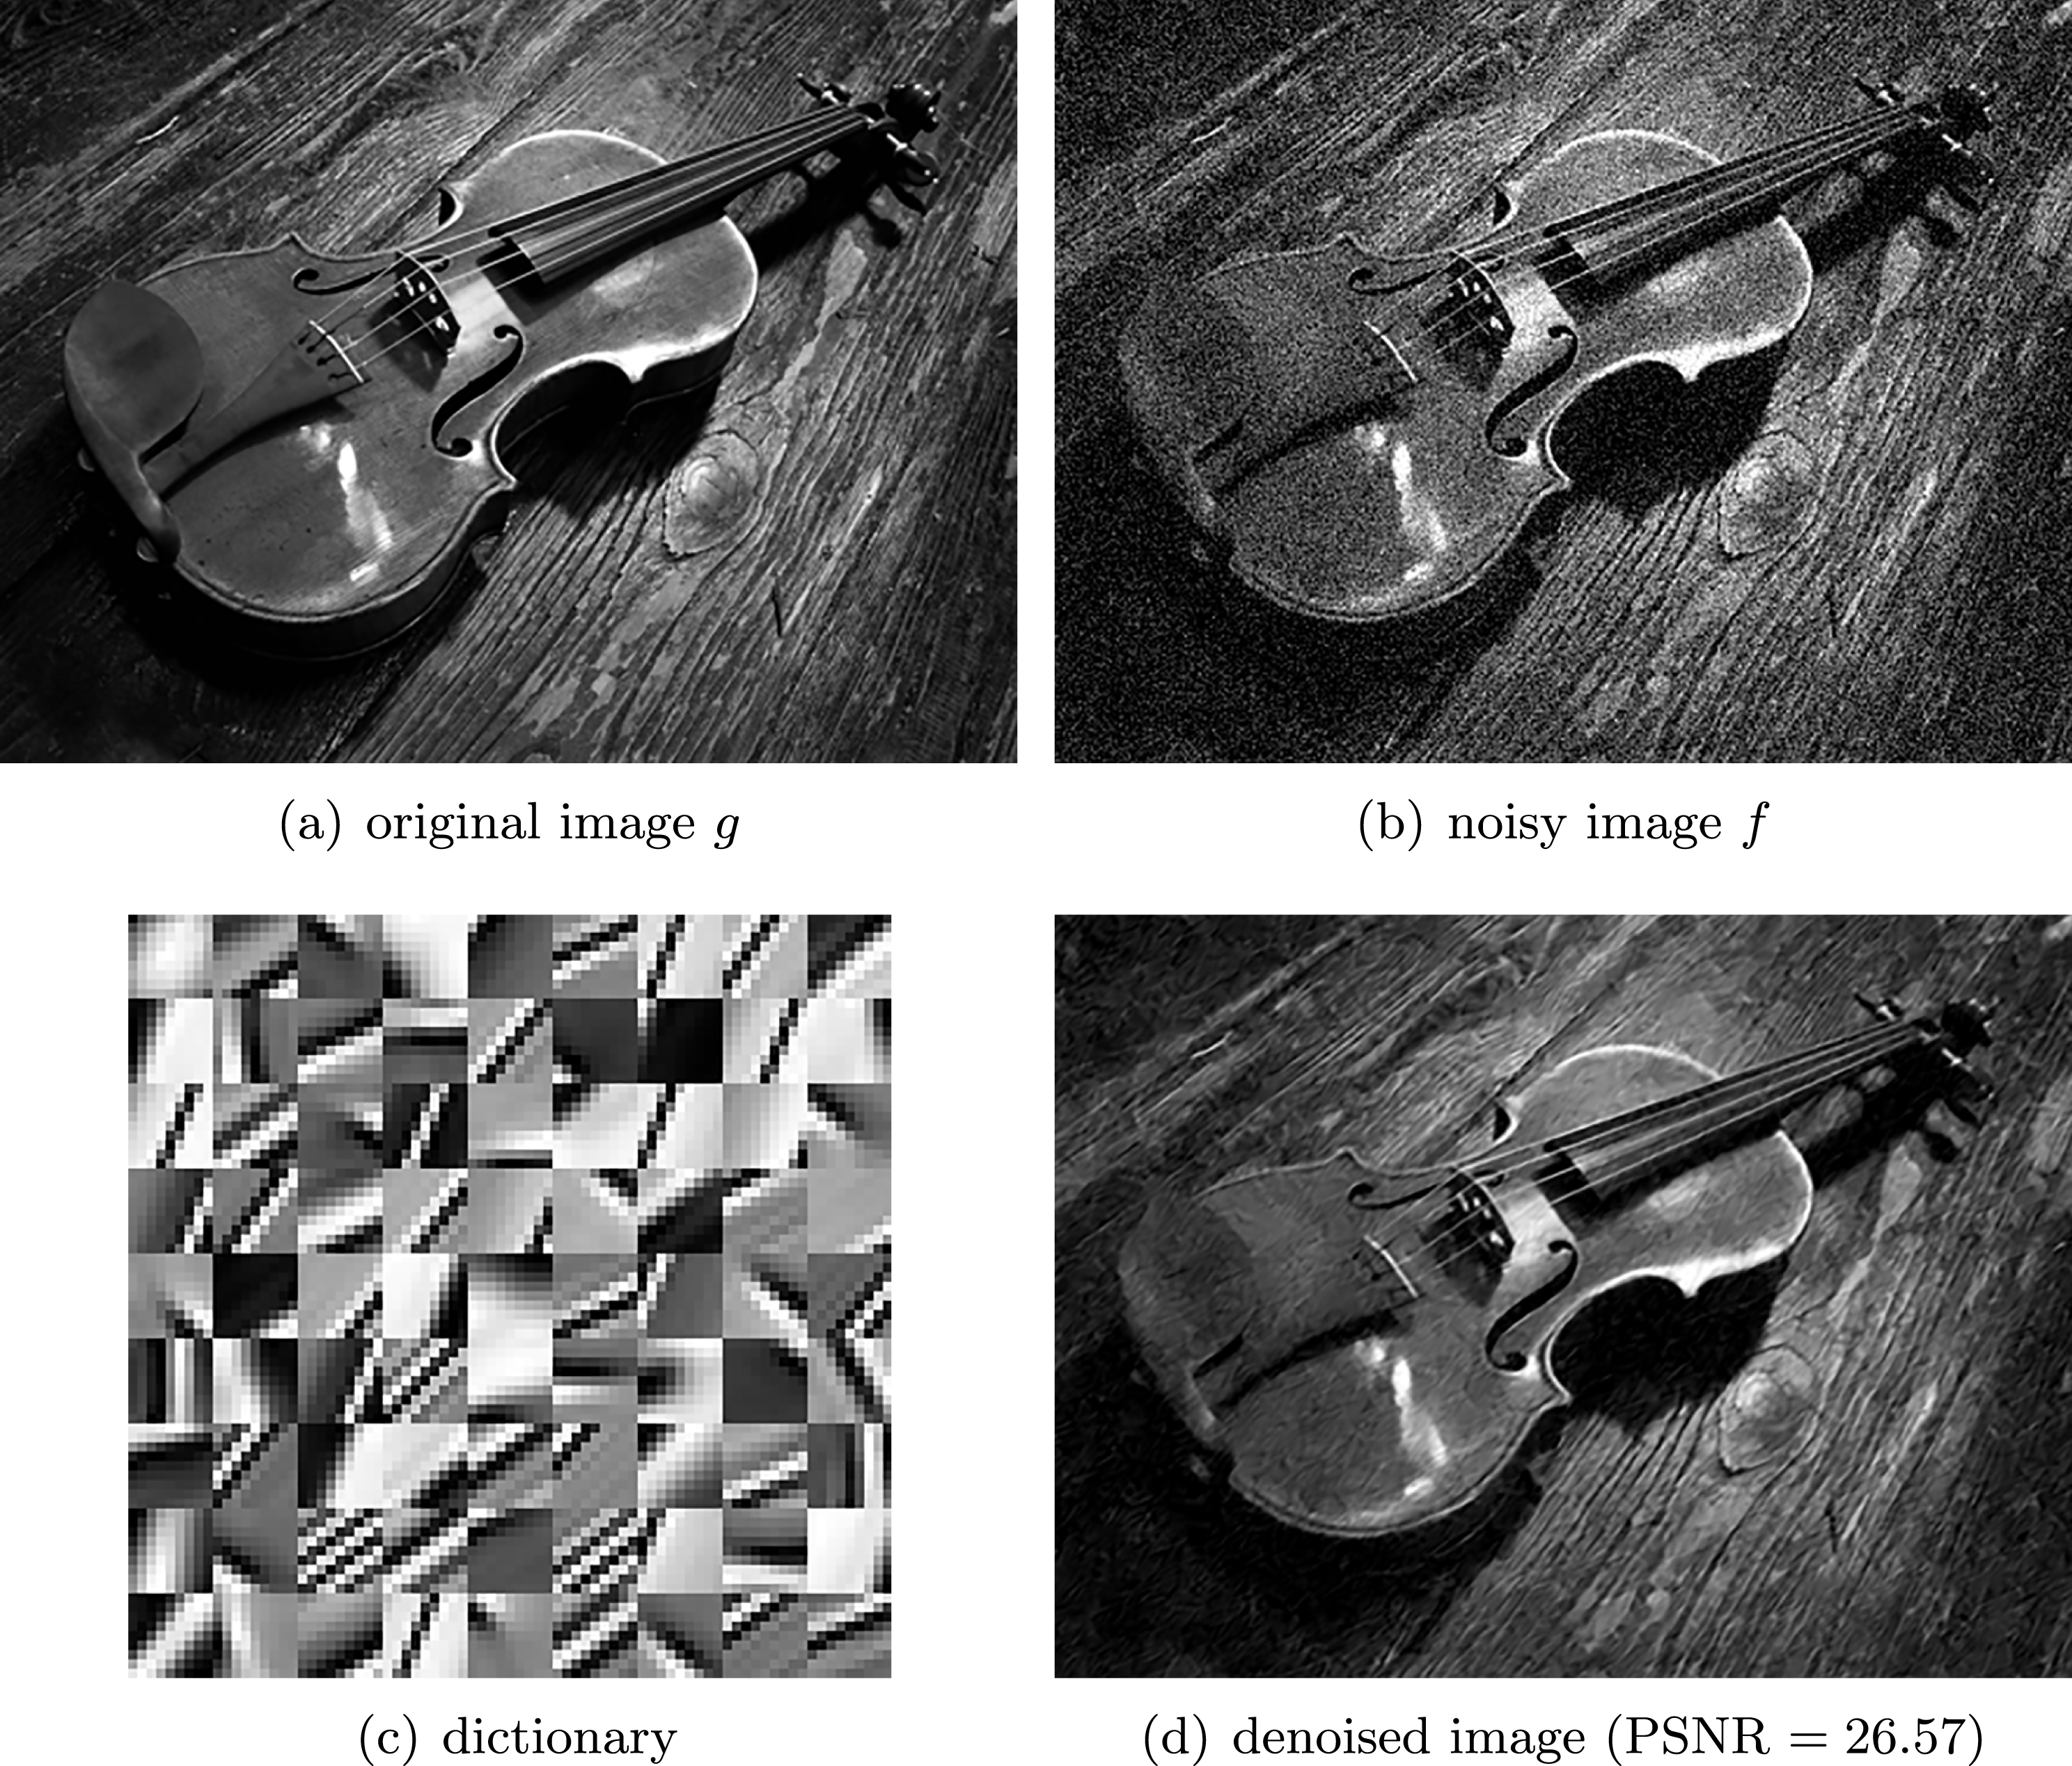
Figure 7.18 illustrates an experiment in which we learned an optimal dictionary on the clean image and then applied the learned dictionary to denoise a noisy version of the image. During learning, we set  ${\it\lambda}=0.1$, we used a patch size of
  $m=n=9$, and the number of dictionary atoms was set to
  $l=81$. The size of the image is
  $327\times 436$, from which we extracted roughly
  $k=136\,500$ patches using a sliding-window approach. One can see that the learned dictionary nicely captures the most frequent structures in the image. The dictionary atom shown top left corresponds to the low-frequency part of the patches. It can be seen from the figure that this atom does not have a zero mean.
After learning was completed, we applied the learned dictionary to the restoration of a noisy version of the original image.Footnote 22 We first extracted the patches  $\tilde{p}_{i}\in \mathbb{R}^{m\times n}$,
  $i=1,\ldots ,k$ from the noisy image and again arranged the patches into a matrix
  $\tilde{P}\in \mathbb{R}^{mn\times k}$. In order to denoise the set of patches, we solved the Lasso problem (7.37), but this time only with respect to the coefficient vector
  $X$. This problem is convex and can be solved using Algorithm 5 (FISTA). The parameter
  ${\it\lambda}$ was set to
  ${\it\lambda}=0.1$. After the patches were denoised, we reconstructed the final image by averaging over all the patches. The reconstructed image is shown in Figure 7.18(d). Observe that the texture and elongated structures are nicely preserved in the denoised image.
Another interesting variant of the patch-based Lasso problem – particularly in the context of image processing – is given by a convolutional sparse model (Zeiler, Krishnan, Taylor and Fergus Reference Zeiler, Krishnan, Taylor and Fergus2010) of the form
 $$\begin{eqnarray}\min _{(v_{i})_{i=1}^{k}}\mathop{\sum }_{i=1}^{k}\Vert v_{i}\Vert _{1}+\displaystyle \frac{{\it\lambda}}{2}\biggl\|\mathop{\sum }_{i=1}^{k}d_{i}\ast v_{i}-u^{\diamond }\biggr\|_{2}^{2},\end{eqnarray}$$
 where  $u^{\diamond }\in \mathbb{R}^{m\times n}$ is an input image,
  $v_{i}\in \mathbb{R}^{m\times n}$,
  $i=1,\ldots ,k$ are a set of
  $k$ sparse coefficient images, and
  $d_{i}\in \mathbb{R}^{l\times l}$,
  $i=1,\ldots ,k$ are the corresponding two-dimensional filter kernels. The approximated image
  $u\in \mathbb{R}^{m\times n}$ can be recovered via
  $u=\sum _{i=1}^{k}d_{i}\ast v_{i}$. The main advantage of the convolutional model over the patch-based model is that the convolution operation inherently models the translational invariance of images. This model is also strongly related to the layers adopted in recently proposed convolutional neural networks (CNNs), which have been shown to perform extremely well on large-scale image classification tasks (Krizhevsky et al. Reference Krizhevsky, Sutskever and Hinton2012).
For learning the filters  $d_{i}$, we minimize the convolutional Lasso problem (7.38) with respect to both the filters
  $d_{i}$ and the coefficient images
  $v_{i}$. Some care has to be taken to avoid a trivial solution. Therefore we fix the first filter kernel to be a Gaussian filter and fix the corresponding coefficient image to be the input image
  $u^{\diamond }$. Hence, the problem is equivalent to learning the dictionary only for the high-frequency filtered image
  $\tilde{u} =u^{\diamond }-g\ast u^{\diamond }$, where
  $g\in \mathbb{R}^{l\times l}$ is a Gaussian filter with standard deviation
  ${\it\sigma}=l$.
To minimize (7.38) in  $v_{i}$ and
  $d_{i}$, we again use the inertial variant of the PALM algorithm. We used
  $k=81$ filters of size
  $l=9$ and the first filter was set to a Gaussian filter of the same size. The regularization parameter
  ${\it\lambda}$ was set to
  ${\it\lambda}=0.2$. Figure 7.19(a) shows the filters we have learned on the clean image shown in Figure 7.18(a). Comparing the learned convolution filters to the dictionary of the patch-based Lasso problem, one can see that the learned filters contain Gabor-like structures (Hubel and Wiesel Reference Hubel and Wiesel1959) but also more complex structures, which is a known effect caused by the induced shift invariance (Hashimoto and Kurata Reference Hashimoto and Kurata2000). We then also applied the convolutional Lasso model to a noisy variant of the original image, and the result is shown in Figure 7.19(b). From the PSNR values, one can see that the convolutional Lasso model leads to a slightly better result.
Image denoising using the convolutional Lasso model. (a) The  $81$ convolution filters of size
  $9\times 9$ that have been learned on the original image. (b) Denoised image obtained by minimizing the convolutional Lasso model.
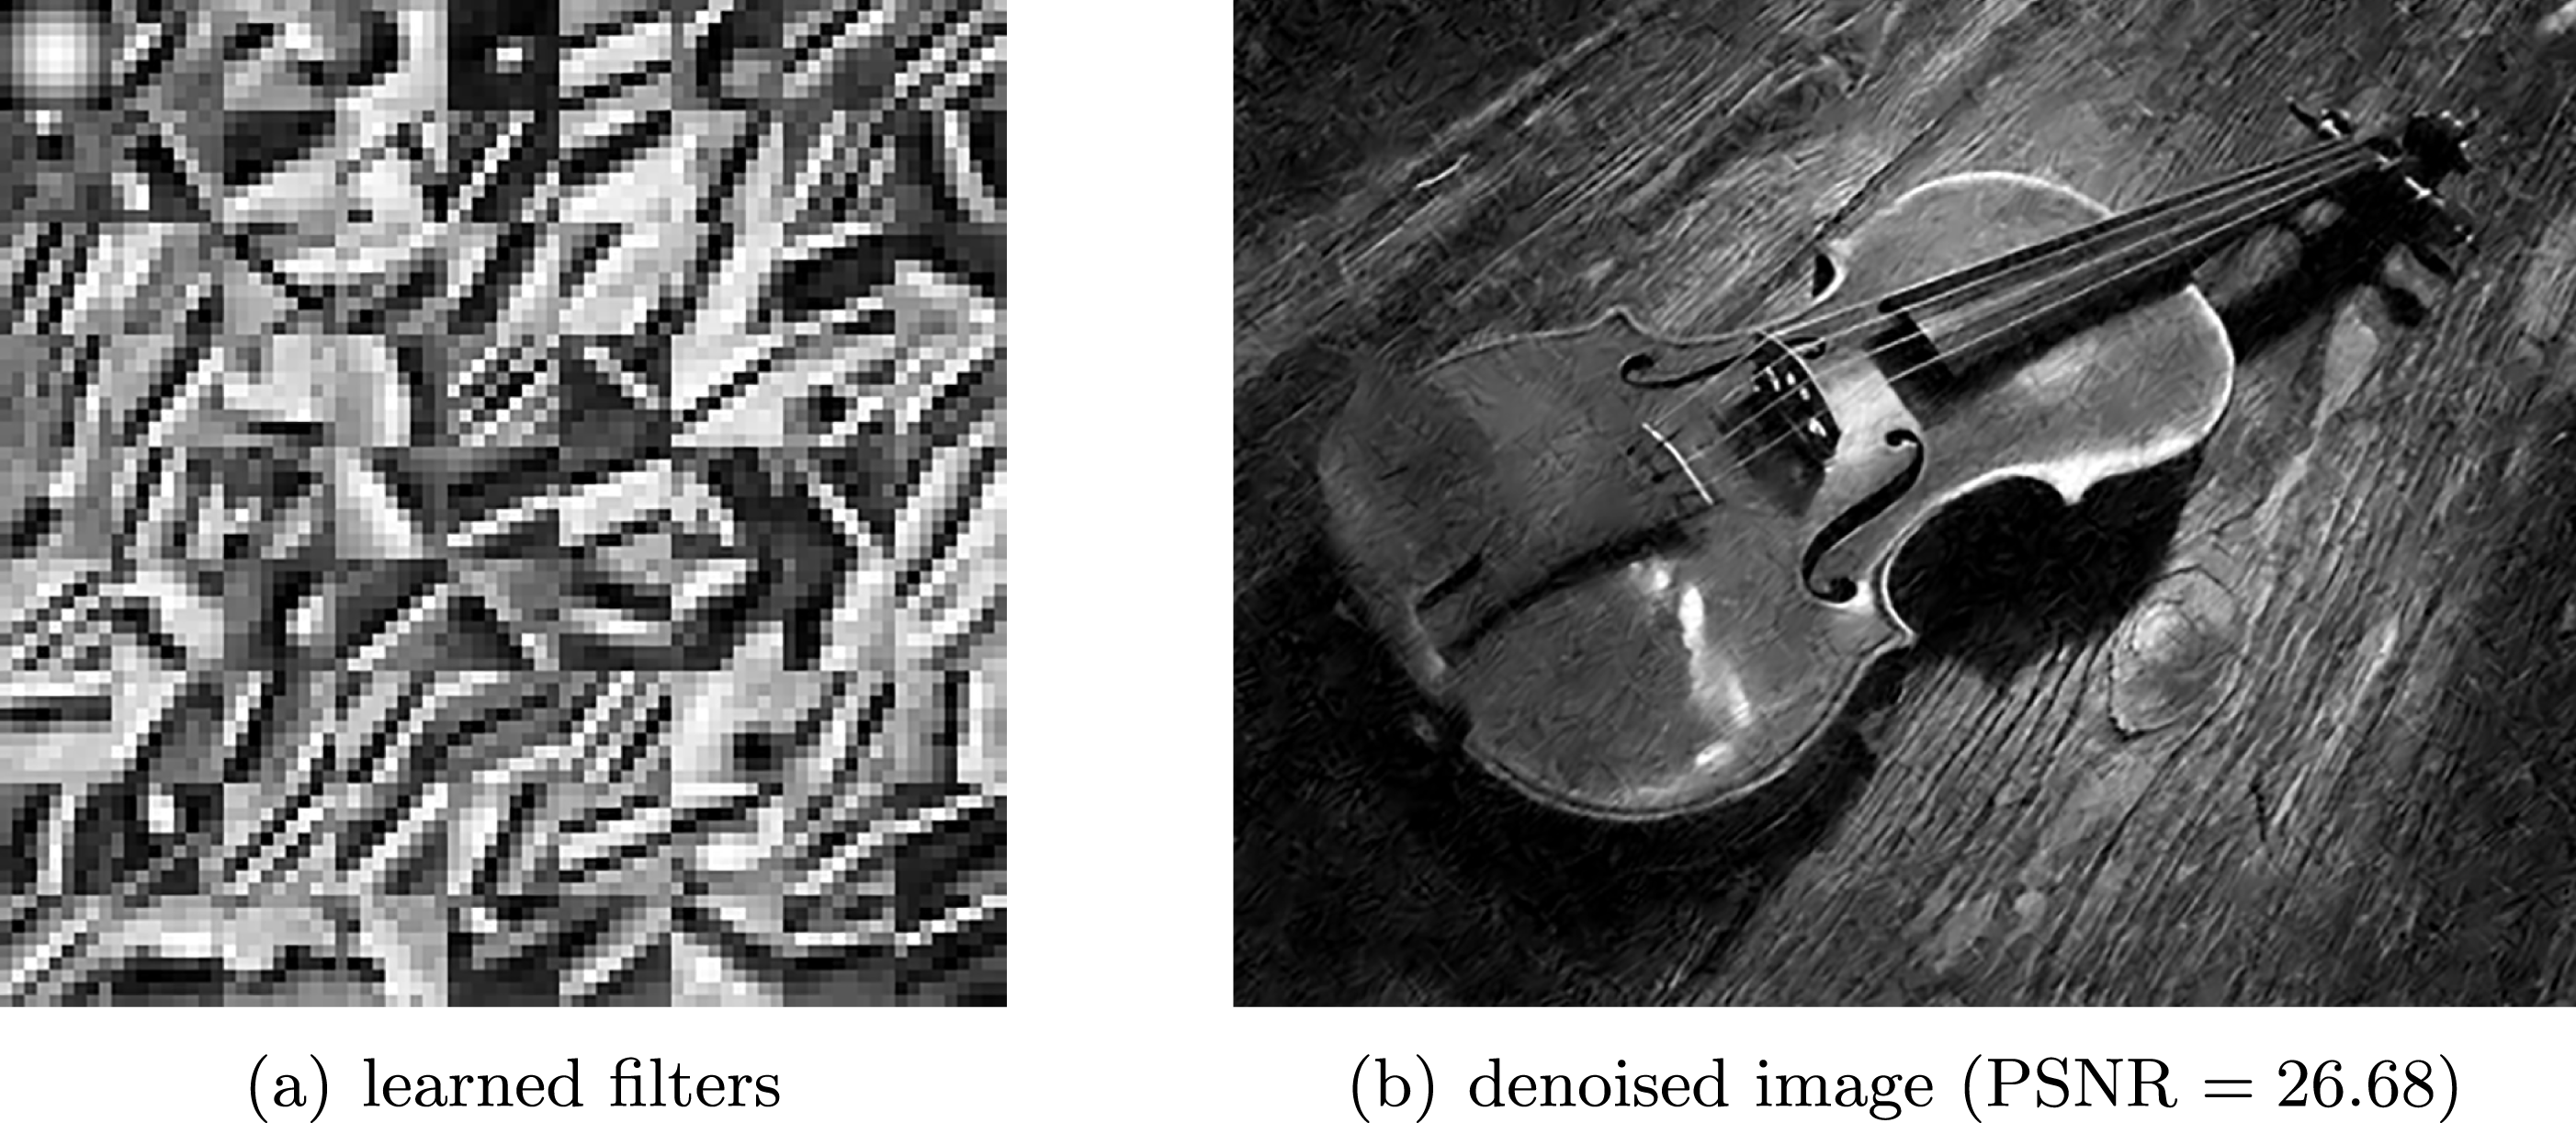
7.13 Support vector machine
Linear classification in a feature space is an important problem in many scientific disciplines. See for example the review paper by Burges (Reference Burges1998) and references therein. The general idea is as follows. Let  $\{x_{1},\ldots ,x_{n}\}\subset \mathbb{R}^{d}$ be a set of
  $d$-dimensional feature vectors with corresponding positive and negative class labels
  $y_{i}\in \{-1,+1\}$. The idea of a linear classifier is to find a separating hyperplane
  $w\in \mathbb{R}^{d}$ and a bias term
  $b\in \mathbb{R}$, such that the feature vectors corresponding to class
  $+1$ are (in some sense) most robustly separated by the feature vectors corresponding to class labels
  $-1$. This problem can be written as the minimization of the following loss function, known as the support vector machine (SVM) (Vapnik Reference Vapnik2000):
 $$\begin{eqnarray}\displaystyle \min _{w,b}\displaystyle \frac{1}{2}\Vert w\Vert ^{2}+\displaystyle \frac{C}{n}\mathop{\sum }_{i=1}^{n}h(y_{i}(\langle w,x_{i}\rangle +b)), & & \displaystyle\end{eqnarray}$$
 where  ${\textstyle \frac{1}{2}}\Vert w\Vert ^{2}$ is a regularization term that avoids overfitting to the training data,
  $h(\cdot )$ is the Hinge-loss function defined by
  $h(t)=\max \{0,1-t\}$, and
  $C>0$ is a regularization parameter. Note that the Hinge-loss function is closely related to the
  $\ell _{1}$-norm and hence it also induces sparsity in the solution – the idea being that it will minimize the number of samples which are within a certain margin around the hyperplane (
 $t\in [0,1]$) or are wrongly classified (
 $t<0$). If the feature space is linearly separable, the SVM returns the hyperplane that maximizes the distance to the closest feature example (which is half the ‘margin’), which can be interpreted as minimizing the risk of misclassifying any new feature example. To simplify the problem, we can replace the bias term with an additional constant
  $(d+1)$th component added to each sample
  $x_{i}$, which corresponds to assuming that all samples ‘live’ in a hyperplane far from the origin, and therefore has a very similar effect (the bias
  $b$ is replaced with
  $cy_{i}w_{d+1}$ for some constant
  $c$ of the order of the norm of the samples). This smoothing makes the problem strongly convex, hence slightly easier to solve, as one can use Algorithm 8. An additional acceleration trick consists in starting the optimization with a small number of samples and periodically adding to the problem a fraction of the worst classified samples. As it is well known (and desirable) that only a small proportion of the samples should be really useful for classification (the ‘support vectors’ which bound the margin), it is expected, and actually observed, that the size of the problems can remain quite small with this strategy.
MNIST training images and dictionary.

An extension of the SVM to non-linear classifiers can be achieved by applying the kernel trick (Aĭzerman, Braverman and Rozonoèr Reference Aĭzerman, Braverman and Rozonoèr1964) to the hyperplane, which lifts the linear classifier to a new feature space of arbitrary (even infinite) dimension (Vapnik Reference Vapnik2000).
To illustrate this method, we have tried to learn a classifier on the  $60\,000$ digits of the MNISTFootnote 23 database (LeCun, Bottou, Bengio and Haffner Reference LeCun, Bottou, Bengio and Haffner1998a): see Figure 7.20. Whereas it is known that a kernel SVM can achieve good performance on this dataset (see the results reported on the web page of the project) it is computationally quite expensive, and we have tried here to incorporate non-linearities in a simpler way. To start with, it is well known that training a linear SVM directly on the MNIST data (which consists of small
  $28\times 28$ images) does not lead to good results. To improve the performance, we trained the 400-component dictionary shown in Figure 7.20, using the model in Section 7.12, and then computed the coefficients (
 $(c_{i})_{i=1}^{400}$) of each MNIST digit on this dictionary using the Lasso problem. This represents a fairly large computation and may take several hours on a standard computer.
Then we trained the SVMs on feature vectors of the form, for each digit,  $(\tilde{c},(c_{i})_{i=1}^{400},(c_{i}^{2})_{i=1}^{400})$ (in dimension
  $801$), where
  $\tilde{c}$ is the constant which maps all vectors in a hyperplane ‘far’ from the origin, as explained above, and the additional
  $(c_{i}^{2})_{i=1}^{400}$ represent a non-linear lifting which slightly boosts the separability of the vectors. This mimics a non-linear kernel SVM with a simple isotropic polynomial kernel.
The technique we have employed here is a standard ‘one-versus-one’ classification approach, which proved slightly more efficient than, for instance, training an SVM to separate each digit from the rest. It consists in training  $45$ vectors
  $w_{i,j}$,
  $0\leq i<j\leq 9$, each separating the training subset of digits
  $i$ from the digits
  $j$ (in this case, in particular, each learning problem remains quite small).
Then, to classify a new digit, we have counted how often it is classified as ‘ $i$’ or ‘
 $j$’ by
  $w_{i,j}$ (which is simply testing whether
  $\langle w_{i,j},x_{i}\rangle$ is positive or negative). If everything were perfect, a digit would be classified nine times as its true label, hence it is natural to consider that the label that gets the maximal number of ‘votes’ is the expected one.Footnote 24 This very elementary approach leads to an error of
  $2.21\%$ on the
  $10\,000$ test digits of the database, which is much worse than the best results reached so far but quite reasonable for such a simple approach. Let us observe that for each failed classification, the second vote was correct except for 70 digits, that is,
  $0.7\%$ of the base: hence it is not surprising that more elaborate representations or classification techniques can reach classification error rates of this order:
  $0.49\%$ for SVM methods based on ‘scattering’ networks (Bruna and Mallat Reference Bruna and Mallat2013) and
  $0.23\%$ for the most recent CNN-based methods (Ciresan, Meier and Schmidhuber Reference Ciresan, Meier and Schmidhuber2012). The failed classifications are shown in Figure 7.21, as well as some of the well-recognized digits.
MNIST classification results.

An interesting extension to the unsupervised dictionary learning problem consists in augmenting the dictionary learning objective function with a loss function, ensuring that the learned features not only lead to a sparse representation but can also be well classified with the SVM; see Mairal (Reference Mairal, Ponce, Sapiro, Zisserman, Bach, Koller, Schuurmans, Bengio and Bottou2009b). This supervised dictionary learning actually improves the final classification results (leading to an error of only  $0.6\%$).
Inverting a convolutional neural network. (a) Original image used to compute the initial feature vector  ${\it\phi}^{\diamond }$. (b) Image recovered from the non-linear deconvolution problem. Due to the high degree of invariances of the CNN with respect to scale and spatial position, the recovered image contains structures from the same object class, but the image looks very different.
7.14 Non-linear deconvolution: inverting a CNN
In this last example, we show an interesting application of non-linear deconvolution to invert a pre-trained convolutional neural network. The CNN we consider here is a state-of-the-art very deep CNN that has been trained on the ImageNet (Krizhevsky et al. Reference Krizhevsky, Sutskever and Hinton2012) classification problem (Simonyan and Zisserman Reference Simonyan and Zisserman2015). Whereas it has been shown by Bruna, Szlam and LeCun (Reference Bruna, Szlam and Lecun2014) that some CNN structures are invertible, it is not clear whether this particular one is. Let  $C:\mathbb{R}^{m\times n\times 3}\rightarrow \mathbb{R}^{k}$ denote a non-linear map that takes a colour image
  $\mathbf{u}$ of size
  $m\times n$ pixels as input and produces a feature vector
  ${\it\phi}$ of length
  $k$. The task is now to start from a given feature vector
  ${\it\phi}^{\diamond }$ and try to find an image
  $\mathbf{u}$ such that
  $C(\mathbf{u})\approx {\it\phi}^{\diamond }$. Since this problem is ill-posed, we aim at minimizing the following total variation regularized problem (Mahendran and Vedaldi Reference Mahendran and Vedaldi2015):
 $$\begin{eqnarray}\min _{\mathbf{u}}{\it\lambda}\Vert \mathbf{D}\mathbf{u}\Vert _{2,1}+\displaystyle \frac{1}{2}\Vert C(\mathbf{u})-{\it\phi}^{\diamond }\Vert ^{2}.\end{eqnarray}$$
We minimize the energy by performing a gradient descent using the iPiano algorithm (Algorithm 11). For this we replace the total variation regularizer with its smooth Huber variant (4.18). The gradient with respect to the data term can be computed by using back-propagation.
Figure 7.22 shows the results we get by first computing a  $4096$-dimensional feature vector
  ${\it\phi}^{\diamond }=C(\mathbf{u}^{\diamond })$ from the original image
  $\mathbf{u}^{\diamond }$ and then inverting this feature vector by solving the non-linear deconvolution problem. We initialized the algorithm with an image
  $\mathbf{u}$ obtained by filtering the original image with Gaussian noise. One can see that the structures that are ‘hallucinated’ by the CNN are of the same class of objects as the original image, but the algorithm produces a completely new, yet almost reasonable image.
Acknowledgements
The authors benefit from support of the ANR and FWF via the ‘EANOI’ (Efficient Algorithms for Nonsmooth Optimization in Imaging) joint project, FWF no. I1148 / ANR-12-IS01-0003. Thomas Pock also acknowledges the support of the Austrian Science Fund (FWF) under the START project BIVISION, no. Y729, and the European Research Council under the Horizon 2020 program, ERC starting grant ‘HOMOVIS’, no. 640156. Antonin Chambolle also benefits from support of the ‘Programme Gaspard Monge pour l’Optimisation et la Recherche Opérationnelle’ (PGMO), through the ‘MAORI’ group, as well as the ‘GdR MIA’ of the CNRS. He also warmly thanks Churchill College and DAMTP, Centre for Mathematical Sciences, University of Cambridge, for their hospitality, with the support of the French Embassy in the UK. Finally, the authors are very grateful to Yunjin Chen, Jalal Fadili, Yura Malitsky, Peter Ochs and Glennis Starling for their comments and their careful reading of the manuscript.
A. Abstract convergence theory
We recall an essential result on weak contractions (or non-expansive mappings) in Hilbert spaces. More details can be found in Bauschke and Combettes (Reference Bauschke and Combettes2011) or the recent review by Burger et al. (Reference Burger, Sawatzky and Steidl2014). As mentioned in Section 4.1, for convex  $f$ the operator
 $$\begin{eqnarray}x\mapsto x-{\it\tau}{\rm\nabla}f(x)\end{eqnarray}$$
 is an ‘averaged operator’ when  ${\it\tau}\in (0,2/L)$, where
  $L$ is the Lipschitz constant of
  ${\rm\nabla}f$: this means that it is of the form
 $$\begin{eqnarray}T_{{\it\theta}}x:={\it\theta}x+(1-{\it\theta})T_{0}x\end{eqnarray}$$
 with  ${\it\theta}\in (0,1)$, where
  $T_{0}$ is a weak contraction, satisfying
  $\Vert T_{0}x-T_{0}y\Vert \leq \Vert x-y\Vert$ for all
  $x,y$. Indeed, let
  ${\it\theta}={\it\tau}L/2$ and
  $T_{0}x:=x-(2/L){\rm\nabla}f(x)$ to recover this fact. Let
  $F$ denote the set of fixed points of
  $T_{0}$, that is,
  $F=\{x\in {\mathcal{X}}:T_{0}x=x\}$. Then we obtain the following result, usually called the Krasnosel’skii–Mann theorem: see Bauschke and Combettes (Reference Bauschke and Combettes2011, Theorem 5.13) and Bertsekas (Reference Bertsekas2015, Theorem 5.1.9).
Theorem A.1. Let  $x\in {\mathcal{X}}$,
  $0<{\it\theta}<1$, and assume
  $F\neq \emptyset$. Then
  $(T_{{\it\theta}}^{k}x)_{k\geq 1}$ weakly converges to some point
  $x^{\ast }\in F$.
Proof. Throughout this proof let  $x_{k}=T_{{\it\theta}}^{k}x$ for each
  $k\geq 0$.
Step 1. The first observation is that since  $T_{{\it\theta}}$ is also a weak contraction, the sequence
  $(\Vert x_{k}-x^{\ast }\Vert )_{k}$ is non-increasing for any
  $x^{\ast }\in F$ (which is also the set of fixed points of
  $T_{{\it\theta}}$). The sequence
  $(x_{k})_{k}$ is said to be Fejér-monotone with respect to
  $F$, which yields a lot of interesting consequences; see Bauschke and Combettes (Reference Bauschke and Combettes2011, Chapter 5) for details. It follows that for any
  $x^{\ast }\in F$, one can define
  $m(x^{\ast }):=\inf _{k}\Vert x_{k}-x^{\ast }\Vert =\lim _{k}\Vert x_{k}-x^{\ast }\Vert$. If there exists
  $x^{\ast }$ such that
  $m(x^{\ast })=0$, then the theorem is proved, as
  $x_{k}$ converges strongly to
  $x^{\ast }$.
Step 2. If not, let us show that we still obtain  $T_{{\it\theta}}x_{k}-x_{k}=x_{k+1}-x_{k}\rightarrow 0$. An operator which satisfies this property is said to be asymptotically regular (Browder and Petryshyn Reference Browder and Petryshyn 1966). We will use the following result, which is standard, and in fact gives a hint that this proof can be extended to more general spaces with uniformly convex norms.
Lemma A.2. For all  ${\it\varepsilon}>0$,
  ${\it\theta}\in (0,1)$, there exists
  ${\it\delta}>0$ such that, for all
  $x,y\in {\mathcal{X}}$ with
  $\Vert x\Vert ,\Vert y\Vert \leq 1$ and
  $\Vert x-y\Vert \geq {\it\varepsilon}$,
 $$\begin{eqnarray}\Vert {\it\theta}x+(1-{\it\theta})y\Vert \leq (1-{\it\delta})\max \{\Vert x\Vert ,\Vert y\Vert \}.\end{eqnarray}$$
 This follows from the strong convexity of  $x\mapsto \Vert x\Vert ^{2}$ (i.e. the parallelogram identity), and we leave the proof to the reader.
Now assume that along a subsequence, we have  $\Vert x_{k_{l}+1}-x_{k_{l}}\Vert \geq {\it\varepsilon}>0$. Observe that
 $$\begin{eqnarray}x_{k_{l}+1}-x^{\ast }={\it\theta}(x_{k_{l}}-x^{\ast })+(1-{\it\theta})(T_{0}x_{k_{l}}-x^{\ast })\end{eqnarray}$$
and that
 $$\begin{eqnarray}(x_{k_{l}}-x^{\ast })-(T_{0}x_{k_{l}}-x^{\ast })=x_{k_{l}}-T_{0}x_{k_{l}}=-\displaystyle \frac{1}{1-{\it\theta}}(x_{k_{l}+1}-x_{k_{l}}),\end{eqnarray}$$
so that
 $$\begin{eqnarray}\Vert (x_{k_{l}}-x^{\ast })-(T_{0}x_{k_{l}}-x^{\ast })\Vert \geq {\it\varepsilon}/(1-{\it\theta})>0.\end{eqnarray}$$
 Hence we can invoke the lemma (remember that  $(x_{k}-x^{\ast })_{k}$ is globally bounded since its norm is non-increasing), and we obtain that, for some
  ${\it\delta}>0$,
 $$\begin{eqnarray}m(x^{\ast })\leq \Vert x_{k_{l}+1}-x^{\ast }\Vert \leq (1-{\it\delta})\max \{\Vert x_{k_{l}}-x^{\ast }\Vert ,\Vert T_{0}x_{k_{l}}-x^{\ast }\Vert \},\end{eqnarray}$$
 but since  $\Vert T_{0}x_{k_{l}}-x^{\ast }\Vert \leq \Vert x_{k_{l}}-x^{\ast }\Vert$, it follows that
 $$\begin{eqnarray}m(x^{\ast })\leq (1-{\it\delta})\Vert x_{k_{l}}-x^{\ast }\Vert .\end{eqnarray}$$
 As  $k_{l}\rightarrow \infty$, we get a contradiction if
  $m(x^{\ast })>0$.
Step 3. Assume now that  $\bar{x}$ is the weak limit of some subsequence
  $(x_{k_{l}})_{l}$. Then we claim it is a fixed point. An easy way to see it is to use Minty’s trick (Brézis Reference Brézis1973) and the fact that
  $I-T_{{\it\theta}}$ is a monotone operator. Another is to use Opial’s lemma.
Lemma A.3 (Opial Reference Opial1967, Lemma 1).
If the sequence  $(x_{n})_{n}$ is weakly convergent to
  $x_{0}$ in a Hilbert space
  ${\mathcal{X}}$, then, for any
  $x\neq x_{0}$,
 $$\begin{eqnarray}\liminf _{n}\Vert x_{n}-x\Vert >\liminf _{n}\Vert x_{n}-x_{0}\Vert .\end{eqnarray}$$
 The proof in the Hilbert space setting is easy and we leave it to the reader. Since  $T_{{\it\theta}}$ is a weak contraction, we observe that for each
  $k$,
$k$,
 $$\begin{eqnarray}\displaystyle \Vert x_{k}-\bar{x}\Vert ^{2} & \geq & \displaystyle \Vert T_{{\it\theta}}x_{k}-T_{{\it\theta}}\bar{x}\Vert ^{2}\nonumber\\ \displaystyle & = & \displaystyle \Vert x_{k+1}-x_{k}\Vert ^{2}+2\langle x_{k+1}-x_{k},x_{k}-T_{{\it\theta}}\bar{x}\rangle +\Vert x_{k}-T_{{\it\theta}}\bar{x}\Vert ^{2},\nonumber\end{eqnarray}$$
and we deduce (thanks to Step 2 above)
 $$\begin{eqnarray}\liminf _{l}\Vert x_{k_{l}}-\bar{x}\Vert \geq \liminf _{l}\Vert x_{k_{l}}-T_{{\it\theta}}\bar{x}\Vert .\end{eqnarray}$$
 Opial’s lemma implies that  $T_{{\it\theta}}\bar{x}=\bar{x}$. One advantage of this approach is that it can be easily extended to a class of Banach spaces (Opial Reference Opial1967).
Step 4. To conclude, assume that a subsequence  $(x_{m_{l}})_{l}$ of
  $(x_{n})_{n}$ converges weakly to another fixed point
  $\bar{y}$. Then it must be that
  $\bar{y}=\bar{x}$, otherwise Opial’s Lemma A.3 would again imply that
  $m(\bar{x})<m(\bar{y})$ and
  $m(\bar{y})<m(\bar{x})$. It follows that the whole sequence
  $(x_{n})$ must converge weakly to
  $\bar{x}$.◻
The notion of averaged operators dates back at least to Schaefer (Reference Schaefer1957), Krasnosel’skiĭ (Reference Krasnosel’skiĭ1955) (with  ${\it\theta}=1/2$) and Mann (Reference Mann1953) (with possibly arbitrarily long averages). Forms of this classical result were proved in the first two papers (usually in a more general context such as Banach spaces) and many others (Opial Reference Opial1967), as well as variants, such as with varying operatorsFootnote 25 (Browder Reference Browder1967). This and many useful extensions can be found in Bauschke and Combettes (Reference Bauschke and Combettes2011). The special case
  ${\it\theta}\geq 1/2$ is the case of ‘firmly non-expansive operators’, which is well known to coincide with the proximity operators and the resolvent
  $(I+A)^{-1}$ of maximal-monotone operators (see the review in Bauschke et al. Reference Bauschke, Moffat and Wang2012). Another important observation is that the composition of two averaged operators is, again, an averaged operator; this is straightforward and we leave the proof to the reader. It implies the convergence of forward–backward splitting and in fact of many similar splitting techniques; see Combettes (Reference Combettes2004) for further results in this direction. Finally, we mention that one can improve such results to obtain convergence rates; in particular, Liang et al. (Reference Liang, Fadili and Peyré2015) have recently shown that for some problems one can get an eventual linear convergence for algorithms based on this type of iteration.
B. Proof of Theorems 4.1, 4.9 and 4.10.
Here we prove the rates of convergence for a class of accelerated descent algorithms introduced in Nesterov (Reference Nesterov2004) and Beck and Teboulle (Reference Beck and Teboulle2009). We give proofs which differ slightly from the classical ones, and unify both presentations. For the FISTA algorithm the proof presented here is found in a few places such as the references Chambolle and Pock (Reference Chambolle and Pock2015b), Chambolle and Dossal (Reference Chambolle and Dossal2015), Burger et al. (Reference Burger, Sawatzky and Steidl2014), Bertsekas (Reference Bertsekas2015) and Bonettini et al. (Reference Bonettini, Porta and Ruggiero2015). As Theorem 4.1 is a particular case of Theorem 4.9 (with  $g=0$), we just prove the latter.
Proof of Theorem 4.9.
We start from inequality (4.37), letting,  $\bar{x}=x^{k}$ and
  $\hat{x}=x^{k+1}$ for
  $k\geq 0$. It follows that, for any
  $x$,
$x$,
 $$\begin{eqnarray}F(x)+(1-{\it\tau}{\it\mu}_{f})\displaystyle \frac{\Vert x-x^{k}\Vert ^{2}}{2{\it\tau}}\geq F(x^{k+1})+(1+{\it\tau}{\it\mu}_{g})\displaystyle \frac{\Vert x-x^{k+1}\Vert ^{2}}{2{\it\tau}}.\end{eqnarray}$$
 Choosing  $x=x^{k}$ shows that
  $F(x^{k})$ is non-increasing. Letting
 $$\begin{eqnarray}{\it\omega}=\frac{1-{\it\tau}{\it\mu}_{f}}{1+{\it\tau}{\it\mu}_{g}}\leq 1\end{eqnarray}$$
 and summing these inequalities from  $k=0$ to
  $n-1$,
  $n\geq 1$, after multiplication by
  ${\it\omega}^{-k-1}$, we find
 $$\begin{eqnarray}\displaystyle & & \displaystyle \mathop{\sum }_{k=1}^{n}{\it\omega}^{-k}(F(x^{k})-F(x))+\mathop{\sum }_{k=1}^{n}{\it\omega}^{-k}\displaystyle \frac{1+{\it\tau}{\it\mu}_{g}}{2{\it\tau}}\Vert x-x^{k}\Vert ^{2}\nonumber\\ \displaystyle & & \displaystyle \hspace{136.57323pt}\leq \mathop{\sum }_{k=0}^{n-1}{\it\omega}^{-k-1}\displaystyle \frac{1-{\it\tau}{\it\mu}_{f}}{2{\it\tau}}\Vert x-x^{k}\Vert ^{2}.\nonumber\end{eqnarray}$$
 After cancellations, and using  $F(x^{k})\geq F(x^{n})$ for
  $k=0,\ldots ,n$, we get
 $$\begin{eqnarray}{\it\omega}^{-n}\biggl(\mathop{\sum }_{k=0}^{n-1}{\it\omega}^{k}\biggr)(F(x^{n})-F(x))+{\it\omega}^{-n}\displaystyle \frac{1+{\it\tau}{\it\mu}_{g}}{2{\it\tau}}\Vert x-x^{n}\Vert ^{2}\leq \displaystyle \frac{1+{\it\tau}{\it\mu}_{g}}{2{\it\tau}}\Vert x-x^{0}\Vert ^{2}.\end{eqnarray}$$
 We deduce both (4.29) (for  ${\it\mu}={\it\mu}_{f}+{\it\mu}_{g}>0$ so that
  ${\it\omega}<1$) and (4.28) (for
  ${\it\mu}=0$ and
  ${\it\omega}=1$).
Proof of Theorem 4.10.
The idea behind the proof of Beck and Teboulle (Reference Beck and Teboulle2009) is to improve this inequality (4.37) by trying to obtain strict decay of the term in  $F$ in the inequality. The trick is to use (4.37) at a point which is a convex combination of the previous iterate and an arbitrary point.
If, in (4.37), we replace  $x$ with
  $((t-1)x^{k}+x)/t$ (
 $t\geq 1$),
  $\bar{x}$ with
  $y^{k}$ and
  $\hat{x}$ with
  $x^{k+1}=T_{{\it\tau}}y^{k}$, where
  $t\geq 1$ is arbitrary, we find that for any
  $x$ (after multiplication by
  $t^{2}$),
 $$\begin{eqnarray}\displaystyle & & \displaystyle t(t-1)(F(x^{k})-F(x))-{\it\mu}\displaystyle \frac{t-1}{2}\Vert x-x^{k}\Vert ^{2}\nonumber\\ \displaystyle & & \displaystyle \qquad \qquad +(1-{\it\tau}{\it\mu}_{f})\displaystyle \frac{\Vert (t-1)x^{k}+x-ty^{k}\Vert ^{2}}{2{\it\tau}}\nonumber\\ \displaystyle & & \displaystyle \qquad \geq t^{2}(F(x^{k+1})-F(x))+(1+{\it\tau}{\it\mu}_{g})\displaystyle \frac{\Vert (t-1)x^{k}+x-tx^{k+1}\Vert ^{2}}{2{\it\tau}}.\end{eqnarray}$$
Then we observe that
 $$\begin{eqnarray}\displaystyle & & \displaystyle -{\it\mu}\displaystyle \frac{t-1}{2}\Vert x-x^{k}\Vert ^{2}+(1-{\it\tau}{\it\mu}_{f})\displaystyle \frac{\Vert x-x^{k}+t(x^{k}-y^{k})\Vert ^{2}}{2{\it\tau}}\nonumber\\ \displaystyle & & \displaystyle \qquad =(1-{\it\tau}{\it\mu}_{f}-{\it\mu}{\it\tau}(t-1))\displaystyle \frac{\Vert x-x^{k}\Vert ^{2}}{2{\it\tau}}+\displaystyle \frac{1-{\it\tau}{\it\mu}_{f}}{{\it\tau}}t\langle x-x^{k},x^{k}-y^{k}\rangle \nonumber\\ \displaystyle & & \displaystyle \qquad \qquad +t^{2}(1-{\it\tau}{\it\mu}_{f})\displaystyle \frac{\Vert x^{k}-y^{k}\Vert ^{2}}{2{\it\tau}}\nonumber\\ \displaystyle & & \displaystyle \qquad =\displaystyle \frac{(1+{\it\tau}{\it\mu}_{g}-t{\it\mu}{\it\tau})}{2{\it\tau}}\biggl\|x-x^{k}+t\displaystyle \frac{1-{\it\tau}{\it\mu}_{f}}{1+{\it\tau}{\it\mu}_{g}-t{\it\mu}{\it\tau}}(x^{k}-y^{k})\biggr\|^{2}\nonumber\\ \displaystyle & & \displaystyle \qquad \qquad +t^{2}(1-{\it\tau}{\it\mu}_{f})\biggl(1-\displaystyle \frac{1-{\it\tau}{\it\mu}_{f}}{1+{\it\tau}{\it\mu}_{g}-t{\it\mu}{\it\tau}}\biggr)\displaystyle \frac{\Vert x^{k}-y^{k}\Vert ^{2}}{2{\it\tau}}\nonumber\\ \displaystyle & & \displaystyle \qquad =\displaystyle \frac{(1+{\it\tau}{\it\mu}_{g}-t{\it\mu}{\it\tau})}{2{\it\tau}}\biggl\|x-x^{k}+t\displaystyle \frac{1-{\it\tau}{\it\mu}_{f}}{1+{\it\tau}{\it\mu}_{g}-t{\it\mu}{\it\tau}}(x^{k}-y^{k})\biggr\|^{2}\nonumber\\ \displaystyle & & \displaystyle \qquad \qquad -t^{2}(t-1)\displaystyle \frac{{\it\tau}{\it\mu}(1-{\it\tau}{\it\mu}_{f})}{1+{\it\tau}{\it\mu}_{g}-t{\it\mu}{\it\tau}}\displaystyle \frac{\Vert x^{k}-y^{k}\Vert ^{2}}{2{\it\tau}}.\nonumber\end{eqnarray}$$
 It follows that, for any  $x\in {\mathcal{X}}$,
 $$\begin{eqnarray}\displaystyle & & \displaystyle t(t-1)(F(x^{k})-F(x))+(1+{\it\tau}{\it\mu}_{g}-t{\it\mu}{\it\tau})\displaystyle \frac{\Vert x-x^{k}-t{\textstyle \frac{1-{\it\tau}{\it\mu}_{f}}{1+{\it\tau}{\it\mu}_{g}-t{\it\mu}{\it\tau}}}(y^{k}-x^{k})\Vert ^{2}}{2{\it\tau}}\nonumber\\ \displaystyle & & \displaystyle \qquad \geq t^{2}(F(x^{k+1})-F(x))+(1+{\it\tau}{\it\mu}_{g})\displaystyle \frac{\Vert x-x^{k+1}-(t-1)(x^{k+1}-x^{k})\Vert ^{2}}{2{\it\tau}}\nonumber\\ \displaystyle & & \displaystyle \qquad \qquad +t^{2}(t-1)\displaystyle \frac{{\it\tau}{\it\mu}(1-{\it\tau}{\it\mu}_{f})}{1+{\it\tau}{\it\mu}_{g}-t{\it\mu}{\it\tau}}\displaystyle \frac{\Vert x^{k}-y^{k}\Vert ^{2}}{2{\it\tau}}.\end{eqnarray}$$
 We let  $t=t_{k+1}$ above. Then we can get a useful recursion if we let
 $$\begin{eqnarray}\displaystyle & & \displaystyle {\it\omega}_{k}=\displaystyle \frac{1+{\it\tau}{\it\mu}_{g}-t_{k+1}{\it\mu}{\it\tau}}{1+{\it\tau}{\it\mu}_{g}}=1-t_{k+1}\displaystyle \frac{{\it\mu}{\it\tau}}{1+{\it\tau}{\it\mu}_{g}}\in [0,1],\end{eqnarray}$$
 $$\begin{eqnarray}\displaystyle & & \displaystyle t_{k+1}(t_{k+1}-1)\leq {\it\omega}_{k}t_{k}^{2},\end{eqnarray}$$
 $$\begin{eqnarray}\displaystyle & & \displaystyle {\it\beta}_{k}=\displaystyle \frac{t_{k}-1}{t_{k+1}}\displaystyle \frac{1+{\it\tau}{\it\mu}_{g}-t_{k+1}{\it\mu}{\it\tau}}{1-{\it\tau}{\it\mu}_{f}}={\it\omega}_{k}\displaystyle \frac{t_{k}-1}{t_{k+1}}\displaystyle \frac{1+{\it\tau}{\it\mu}_{g}}{1-{\it\tau}{\it\mu}_{f}},\end{eqnarray}$$
 $$\begin{eqnarray}\displaystyle & & \displaystyle y^{k}=x^{k}+{\it\beta}_{k}(x^{k}-x^{k-1}).\end{eqnarray}$$
 Denoting  ${\it\alpha}_{k}=1/t_{k}$ and
 $$\begin{eqnarray}q=\displaystyle \frac{{\it\tau}{\it\mu}}{1+{\it\tau}{\it\mu}_{g}}=\displaystyle \frac{{\it\tau}{\it\mu}_{f}+{\it\tau}{\it\mu}_{g}}{1+{\it\tau}{\it\mu}_{g}}<1,\end{eqnarray}$$
 we easily check that these rules are precisely the same as in Nesterov (Reference Nesterov2004, formula (2.2.9), p. 80), with the minor difference that in our case the choice  $t_{0}=0,t_{1}=1$ is admissibleFootnote 26 and a shift in the numbering of the sequences
  $(x^{k})$,
  $(y^{k})$. In this case we find
 $$\begin{eqnarray}\displaystyle & & \displaystyle t_{k+1}^{2}(F(x^{k+1})-F(x))+\displaystyle \frac{1+{\it\tau}{\it\mu}_{g}}{2{\it\tau}}\Vert x-x^{k+1}-(t_{k+1}-1)(x^{k+1}-x^{k})\Vert ^{2}\nonumber\\ \displaystyle & & \displaystyle \qquad \leq {\it\omega}_{k}\biggl(t_{k}^{2}(F(x^{k})-F(x))+\displaystyle \frac{1+{\it\tau}{\it\mu}_{g}}{2{\it\tau}}\Vert x-x^{k}-(t_{k}-1)(x^{k}-x^{k-1})\Vert ^{2}\biggr),\nonumber\end{eqnarray}$$
so that
 $$\begin{eqnarray}\displaystyle & & \displaystyle t_{k}^{2}(F(x^{k})-F(x))+\displaystyle \frac{1+{\it\tau}{\it\mu}_{g}}{2{\it\tau}}\Vert x-x^{k}-(t_{k}-1)(x^{k}-x^{k-1})\Vert ^{2}\nonumber\\ \displaystyle & & \displaystyle \qquad \leq \biggl(\mathop{\prod }_{n=0}^{k-1}{\it\omega}_{n}\biggr)\biggl[t_{0}^{2}(F(x^{0})-F(x))+\displaystyle \frac{1+{\it\tau}{\it\mu}_{g}}{2{\it\tau}}\Vert x-x^{0}\Vert ^{2}\biggr].\end{eqnarray}$$
 The update rule for  $t_{k}$ reads
 $$\begin{eqnarray}t_{k+1}(t_{k+1}-1)=(1-qt_{k+1})t_{k}^{2},\end{eqnarray}$$
so that
 $$\begin{eqnarray}t_{k+1}=\displaystyle \frac{1-qt_{k}^{2}+\sqrt{(1-qt_{k}^{2})^{2}+4t_{k}^{2}}}{2}.\end{eqnarray}$$
 We need to make sure that  $qt_{k+1}\leq 1$, so that (B.3) holds. This is proved exactly as in the proof of Lemma 2.2.4 of Nesterov (Reference Nesterov2004). Assuming (as in Nesterov Reference Nesterov2004) that
  $\sqrt{q}t_{k}\leq 1$, we observe that (B.8) yields
 $$\begin{eqnarray}qt_{k+1}^{2}=qt_{k+1}+(1-qt_{k+1})qt_{k}^{2}.\end{eqnarray}$$
 If  $qt_{k+1}\geq 1$, then
  $qt_{k+1}^{2}\leq qt_{k+1}$, and hence
  $qt_{k+1}\leq q<1$, a contradiction. Hence
  $qt_{k+1}<1$ and we obtain that
  $qt_{k+1}^{2}$ is a convex combination of
  $1$ and
  $qt_{k}^{2}$, so that
  $\sqrt{q}t_{k+1}\leq 1$. We have shown that when
  $\sqrt{q}t_{0}\leq 1$, which we will now assume,
  $\sqrt{q}t_{k}\leq 1$ for all
  $k$. Finally, we also observe that
 $$\begin{eqnarray}t_{k+1}^{2}=(1-qt_{k}^{2})t_{k+1}+t_{k}^{2},\end{eqnarray}$$
 showing that  $t_{k}$ is an increasing sequence. It remains to estimate the factor
 $$\begin{eqnarray}{\it\theta}_{k}=t_{k}^{-2}\mathop{\prod }_{n=0}^{k-1}{\it\omega}_{n}\quad \text{for }k\geq 1.\end{eqnarray}$$
From (B.4) (with an equality) we find that
 $$\begin{eqnarray}1-\displaystyle \frac{1}{t_{k+1}}={\it\omega}_{k}\displaystyle \frac{t_{k}^{2}}{t_{k+1}^{2}},\end{eqnarray}$$
so
 $$\begin{eqnarray}t_{0}^{2}{\it\theta}_{k}=\displaystyle \frac{t_{0}^{2}}{t_{k}^{2}}\mathop{\prod }_{n=0}^{k-1}{\it\omega}_{n}=\mathop{\prod }_{n=1}^{k}\biggl(1-\displaystyle \frac{1}{t_{k}}\biggr)\leq (1-\sqrt{q})^{k}\end{eqnarray}$$
 since  $1/t_{k}\geq \sqrt{q}$. If
  $t_{0}\geq 1$, then
  ${\it\theta}_{k}\leq (1-\sqrt{q})^{k}/t_{0}^{2}$. If
  $t_{0}\in [0,1[$, we instead write
 $$\begin{eqnarray}{\it\theta}_{k}=\displaystyle \frac{{\it\omega}_{0}}{t_{k}^{2}}\mathop{\prod }_{n=1}^{k-1}{\it\omega}_{n}=\displaystyle \frac{{\it\omega}_{0}}{t_{1}^{2}}\mathop{\prod }_{n=2}^{k}\biggl(1-\displaystyle \frac{1}{t_{k}}\biggr)\end{eqnarray}$$
 and observe that (B.9) yields (using  $2-q\geq 1\geq q$)
 $$\begin{eqnarray}t_{1}=\displaystyle \frac{1-qt_{0}^{2}+\sqrt{1+2(2-q)t_{0}^{2}+q^{2}t_{0}^{4}}}{2}\geq 1.\end{eqnarray}$$
 Also,  ${\it\omega}_{0}\leq 1-q$ (from (B.3)), so that
 $$\begin{eqnarray}{\it\theta}_{k}\leq (1+\sqrt{q})(1-\sqrt{q})^{k}.\end{eqnarray}$$
 The next step is to bound  ${\it\theta}_{k}$ by
  $O(1/k^{2})$. It also follows from Nesterov (Reference Nesterov2004, Lemma 2.2.4). In our notation, we have
 $$\begin{eqnarray}\displaystyle \frac{1}{\sqrt{{\it\theta}_{k+1}}}-\displaystyle \frac{1}{\sqrt{{\it\theta}_{k}}}=\displaystyle \frac{{\it\theta}_{k}-{\it\theta}_{k+1}}{\sqrt{{\it\theta}_{k}{\it\theta}_{k+1}}(\sqrt{{\it\theta}_{k}}+\sqrt{{\it\theta}_{k+1}})}\geq \displaystyle \frac{{\it\theta}_{k}(1-(1-1/t_{k+1}))}{2{\it\theta}_{k}\sqrt{{\it\theta}_{k+1}}}\end{eqnarray}$$
 since  ${\it\theta}_{k}$ is non-increasing. It follows that
 $$\begin{eqnarray}\displaystyle \frac{1}{\sqrt{{\it\theta}_{k+1}}}-\displaystyle \frac{1}{\sqrt{{\it\theta}_{k}}}\geq \displaystyle \frac{1}{2t_{k+1}\sqrt{{\it\theta}_{k+1}}}=\displaystyle \frac{1}{2}\displaystyle \frac{1}{\sqrt{\mathop{\prod }_{n=0}^{k}{\it\omega}_{n}}}\geq \displaystyle \frac{1}{2},\end{eqnarray}$$
showing that
 $$\begin{eqnarray}1/\sqrt{{\it\theta}_{k}}\geq \displaystyle \frac{k-1}{2}+t_{1}/\sqrt{{\it\omega}_{0}}\geq \displaystyle \frac{k+1}{2}.\end{eqnarray}$$
 Hence, provided that  $\sqrt{q}t_{0}\leq 1$, we also find
 $$\begin{eqnarray}{\it\theta}_{k}\leq \displaystyle \frac{4}{(k+1)^{2}}.\end{eqnarray}$$
We have shown the following result.
Theorem B.1. If  $\sqrt{q}t_{0}\leq 1$,
  $t_{0}\geq 0$, then the sequence
  $(x^{k})$ produced by iterations
  $x^{k}=T_{{\it\tau}}y^{k}$ with (B.9), (B.3), (B.5), (B.6) satisfies
 $$\begin{eqnarray}\displaystyle F(x^{k})-F(x^{\ast })\leq r_{k}(q)\biggl(t_{0}^{2}(F(x^{0})-F(x^{\ast }))+\displaystyle \frac{1+{\it\tau}{\it\mu}_{g}}{2{\it\tau}}\Vert x^{0}-x^{\ast }\Vert ^{2}\biggr), & & \displaystyle\end{eqnarray}$$
 where  $x^{\ast }$ is a minimizer of
  $F$, and
 $$\begin{eqnarray}r_{k}(q)=\left\{\begin{array}{@{}ll@{}}\min \biggl\{\displaystyle \frac{(1-\sqrt{q})^{k}}{t_{0}^{2}},\displaystyle \frac{4}{(k+1)^{2}}\biggr\}\quad & \text{if }t_{0}\geq 1,\\ \min \biggl\{(1+\sqrt{q})(1-\sqrt{q})^{k},\displaystyle \frac{4}{(k+1)^{2}}\biggr\}\quad & \text{if }t_{0}\in [0,1).\end{array}\right.\end{eqnarray}$$
 Theorem 4.10 is a particular case of this result, for  $t_{0}=0$.
Remark B.2 (constant steps).
If  ${\it\mu}>0$ (which is
  $q>0$), then an admissible choice which satisfies (B.3), (B.4) and (B.5) is to take
  $t=1/\sqrt{q}$,
  ${\it\omega}=1-\sqrt{q}$, and
 $$\begin{eqnarray}{\it\beta}={\it\omega}^{2}\displaystyle \frac{1+{\it\tau}{\it\mu}_{g}}{1-{\it\tau}{\it\mu}_{f}}=\displaystyle \frac{\sqrt{1+{\it\tau}{\it\mu}_{g}}-\sqrt{{\it\tau}{\it\mu}}}{\sqrt{1+{\it\tau}{\it\mu}_{g}}+\sqrt{{\it\tau}{\it\mu}}}.\end{eqnarray}$$
Then (B.11) becomes
 $$\begin{eqnarray}F(x^{k})-F(x^{\ast })\leq (1-\sqrt{q})^{k}\biggl(F(x^{0})-F(x^{\ast })+{\it\mu}\displaystyle \frac{\Vert x^{0}-x^{\ast }\Vert ^{2}}{2}\biggr).\end{eqnarray}$$
Remark B.3 (monotone algorithms).
The algorithms studied here are not necessarily ‘monotone’ in the sense that the objective  $F$ is not always non-increasing. A workaround implemented in various papers (Tseng Reference Tseng2008, Beck and Teboulle Reference Beck and Teboulle2009) consists in choosing
  $x^{k+1}$ to be any point for which
  $F(x^{k+1})\leq F(T_{{\it\tau}}y^{k})$,Footnote 27 which will not change (B.1) much except that, in the last term,
  $x^{k+1}$ should be replaced with
  $T_{{\it\tau}}y^{k}$. Then, the same computations carry on, and it is enough to replace the update rule (B.6) for
  $y^{k}$ with
 $$\begin{eqnarray}\displaystyle y^{k} & = & \displaystyle x^{k}+{\it\beta}_{k}(x^{k}-x^{k-1})+{\it\omega}_{k}\displaystyle \frac{\mathtt{t}_{k}}{\mathtt{t}_{k+1}}\displaystyle \frac{1+{\it\tau}{\it\mu}_{g}}{1-{\it\tau}{\it\mu}_{f}}(T_{{\it\tau}}y^{k-1}-x^{k})\nonumber\\ \displaystyle & = & \displaystyle x^{k}+{\it\beta}_{k}\biggl((x^{k}-x^{k-1})+\displaystyle \frac{\mathtt{t}_{k}}{\mathtt{t}_{k}-1}(T_{{\it\tau}}y^{k-1}-x^{k})\biggr)\end{eqnarray}$$
 to obtain the same rates of convergence. The most sensible choice for  $x^{k+1}$ is to take
  $T_{{\it\tau}}y^{k}$ if
  $F(T_{{\it\tau}}y^{k})\leq F(x^{k})$, and
  $x^{k}$ otherwise (see ‘MFISTA’ in Beck and Teboulle Reference Beck and Teboulle2009), in which case one of the two terms (
 $x^{k}-x^{k-1}$ or
  $T_{{\it\tau}}y^{k-1}-x^{k}$) vanishes in (B.6’).
Tao et al. (Reference Tao, Boley and Zhang2015) recently suggested choosing  $x^{k+1}$ to be the point reaching the minimum value between
  $F(T_{{\it\tau}}y^{k})$ and
  $F(T_{{\it\tau}}x^{k})$ (this requires additional computation), hoping to attain the best rate of accelerated and non-accelerated proximal descents, and thus obtain a linear convergence rate for the standard ‘FISTA’ (
 ${\it\mu}=0$) implementation if
  $F$ turns out to be strongly convex. This is very reasonable and seems to be supported by experiment, but we are not sure how to prove it.
C. Convergence rates for primal–dual algorithms
The goal of this appendix is to give an idea of how the convergence results in Section 5.1 are established, and also to explicitly give a proof of a variant of the accelerated rate in Theorem 5.2, which to our knowledge is not found in the current literature, and is an easy adaption of the proofs in Chambolle and Pock (Reference Chambolle and Pock2011, Reference Chambolle and Pock2015a). In Section C.1 we sketch a proof of Theorem 5.1, establishing the  $O(1/k)$ ergodic convergence rate, while in Section C.2 we prove a variant of Theorem 5.2.
C.1 The PDHG and Condat–Vũ algorithm
We give an elementary proof of the rate of convergence of Theorem 5.1. It is easily extended to the non-linear proximity operator (or ‘mirror descent’: Beck and Teboulle Reference Beck and Teboulle2003); in fact the proof is identical (Chambolle and Pock Reference Chambolle and Pock2015a).
The first observation is that if  $(\hat{x},{\hat{y}})={\mathcal{P}}{\mathcal{D}}_{{\it\tau},{\it\sigma}}(\bar{x},\bar{y},\tilde{x},{\tilde{y}})$, then for all
  $(x,y)\in {\mathcal{X}}\times {\mathcal{Y}}$ we have
 $$\begin{eqnarray}\displaystyle & & \displaystyle {\mathcal{L}}(\hat{x},y)-{\mathcal{L}}(x,{\hat{y}})\nonumber\\ \displaystyle & & \displaystyle \qquad \leq \displaystyle \frac{1}{2{\it\tau}}\Vert x-\bar{x}\Vert ^{2}-\displaystyle \frac{1+{\it\tau}{\it\mu}_{g}}{2{\it\tau}}\Vert x-\hat{x}\Vert ^{2}-\displaystyle \frac{1-L_{h}{\it\tau}}{2{\it\tau}}\Vert \hat{x}-\bar{x}\Vert ^{2}\nonumber\\ \displaystyle & & \displaystyle \qquad \qquad +\displaystyle \frac{1}{2{\it\sigma}}\Vert y-\bar{y}\Vert ^{2}-\displaystyle \frac{1}{2{\it\sigma}}\Vert y-{\hat{y}}\Vert ^{2}-\displaystyle \frac{1}{2{\it\sigma}}\Vert {\hat{y}}-\bar{y}\Vert ^{2}\nonumber\\ \displaystyle & & \displaystyle \qquad \qquad +\langle K(x-\hat{x}),{\tilde{y}}-{\hat{y}}\rangle -\langle K(\tilde{x}-\hat{x}),y-{\hat{y}}\rangle .\end{eqnarray}$$
 In fact this follows from (4.36), applied on one hand to the function  $g(x)+h(x)+\langle Kx,{\tilde{y}}\rangle$, and on the other hand to
  $f^{\ast }(y)-\langle K\tilde{x},y\rangle$. For all
  $x,y$, we obtain
 $$\begin{eqnarray}\displaystyle & & \displaystyle g(x)+h(x)+\langle Kx,{\tilde{y}}\rangle +\displaystyle \frac{1}{2{\it\tau}}\Vert x-\bar{x}\Vert ^{2}\nonumber\\ \displaystyle & & \displaystyle \qquad \geq g(\hat{x})+h(\hat{x})+\langle K\hat{x},{\tilde{y}}\rangle +\displaystyle \frac{1-{\it\tau}L_{h}}{2{\it\tau}}\Vert \bar{x}-\hat{x}\Vert ^{2}+\displaystyle \frac{1+{\it\tau}{\it\mu}_{g}}{2{\it\tau}}\Vert x-\hat{x}\Vert ^{2},\nonumber\\ \displaystyle & & \displaystyle f^{\ast }(y)-\langle K\tilde{x},y\rangle +\displaystyle \frac{1}{2{\it\sigma}}\Vert y-\bar{y}\Vert ^{2}\nonumber\\ \displaystyle & & \displaystyle \qquad \geq f^{\ast }({\hat{y}})-\langle K\tilde{x},{\hat{y}}\rangle +\displaystyle \frac{1}{2{\it\sigma}}\Vert \bar{y}-{\hat{y}}\Vert ^{2}+\displaystyle \frac{1}{2{\it\sigma}}\Vert {\hat{y}}-y\Vert ^{2},\nonumber\end{eqnarray}$$
 where  ${\it\mu}_{g}\geq 0$ is a convexity parameter for
  $g$, which we will consider in Section C.2. Summing these two inequalities and rearranging, we obtain (C.1).
The PDHG algorithm corresponds to the choice  $(\tilde{x},{\tilde{y}})=(2x^{k+1}-x^{k},y^{k})$,
  $(\hat{x},{\hat{y}})=(x^{k+1},y^{k+1})$,
  $(\bar{x},\bar{y})=(x^{k},y^{k})$. We deduce (assuming
  ${\it\mu}_{g}=0$) that
 $$\begin{eqnarray}\displaystyle & & \displaystyle {\mathcal{L}}(x^{k+1},y)-{\mathcal{L}}(x,y^{k+1})\nonumber\\ \displaystyle & & \displaystyle \quad +\displaystyle \frac{1}{2{\it\tau}}\Vert x-x^{k+1}\Vert ^{2}+\displaystyle \frac{1}{2{\it\sigma}}\Vert y-y^{k+1}\Vert ^{2}-\langle K(x-x^{k+1}),y-y^{k+1}\rangle \nonumber\\ \displaystyle & & \displaystyle \quad +\displaystyle \frac{1-{\it\tau}L_{h}}{2{\it\tau}}\Vert x^{k+1}-x^{k}\Vert ^{2}+\displaystyle \frac{1}{2{\it\sigma}}\Vert y^{k+1}-y^{k}\Vert ^{2}-\langle K(x^{k+1}-x^{k}),y^{k+1}-y^{k}\rangle \nonumber\\ \displaystyle & & \displaystyle \leq \displaystyle \frac{1}{2{\it\tau}}\Vert x-x^{k}\Vert ^{2}+\displaystyle \frac{1}{2{\it\sigma}}\Vert y-y^{k}\Vert ^{2}-\langle K(x-x^{k}),y-y^{k}\rangle .\nonumber\end{eqnarray}$$
 Thanks to (5.9), each of the last three lines is non-negative. We sum this from  $i=0,\ldots ,k-1$, and find that
 $$\begin{eqnarray}\mathop{\sum }_{i=1}^{K}{\mathcal{L}}(x^{i},y)-{\mathcal{L}}(x,y^{i})\leq \displaystyle \frac{1}{2{\it\tau}}\Vert x-x^{0}\Vert ^{2}+\displaystyle \frac{1}{2{\it\sigma}}\Vert y-y^{0}\Vert ^{2}-\langle K(x-x^{0}),y-y^{0}\rangle .\end{eqnarray}$$
 Equation (5.10) follows from the convexity of  $({\it\xi},{\it\eta})\mapsto {\mathcal{L}}({\it\xi},y)-{\mathcal{L}}(x,{\it\eta})$, and using
 $$\begin{eqnarray}2\langle K(x-x^{0}),y-y^{0}\rangle \leq \displaystyle \frac{\Vert x-x^{0}\Vert ^{2}}{{\it\tau}}+\displaystyle \frac{\Vert y-y^{0}\Vert ^{2}}{{\it\sigma}}.\end{eqnarray}$$
C.2 An accelerated primal–dual algorithm
We briefly show how one can derive a result similar to Theorem 5.2 for a variant of the algorithm, which consists in performing the over-relaxation step in the variable  $y$ rather than the variable
  $x$. We still consider problem (5.8), in the case where
  $g$ is
  ${\it\mu}_{g}$-convex with
  ${\it\mu}_{g}>0$, and as before
  ${\rm\nabla}h$ is
  $L_{h}$-Lipschitz. Given
  $x^{0},y^{0}=y^{-1}$, we let at each iteration
 $$\begin{eqnarray}(x^{k+1},y^{k+1})={\mathcal{P}}{\mathcal{D}}_{{\it\tau}_{k},{\it\sigma}_{k}}(x^{k},y^{k},x^{k+1},y^{k}+{\it\theta}_{k}(y^{k}-y^{k-1})),\end{eqnarray}$$
 where  ${\it\theta}_{k},{\it\tau}_{k},{\it\sigma}_{k}$ will be made precise later. We let
 $$\begin{eqnarray}\displaystyle x^{k+1} & = & \displaystyle \text{prox}_{{\it\tau}g}(x^{k}-{\it\tau}({\rm\nabla}h(x^{k})+K^{\ast }(y^{k}+{\it\theta}_{k}(y^{k}-y^{k-1})))),\end{eqnarray}$$
 $$\begin{eqnarray}\displaystyle y^{k+1} & = & \displaystyle \text{prox}_{{\it\sigma}f^{\ast }}(y^{k}+{\it\sigma}Kx^{k+1}).\end{eqnarray}$$
 Using (C.1) with  $(\tilde{x},{\tilde{y}})=(x^{k+1},y^{k}+{\it\theta}_{k}(y^{k}-y^{k-1}))$, we obtain that for all
  $(x,y)\in {\mathcal{X}}\times {\mathcal{Y}}$,
 $$\begin{eqnarray}\displaystyle & & \displaystyle \displaystyle \frac{1}{2{\it\tau}_{k}}\Vert x-x^{k}\Vert ^{2}+\displaystyle \frac{1}{2{\it\sigma}_{k}}\Vert y-y^{k}\Vert ^{2}\nonumber\\ \displaystyle & & \displaystyle \qquad \geq {\mathcal{L}}(x^{k+1},y)-{\mathcal{L}}(x,y^{k+1})+\displaystyle \frac{1+{\it\tau}_{k}{\it\mu}_{g}}{2{\it\tau}_{k}}\Vert x-x^{k+1}\Vert ^{2}+\displaystyle \frac{1}{2{\it\sigma}_{k}}\Vert y-y^{k+1}\Vert ^{2}\nonumber\\ \displaystyle & & \displaystyle \qquad \qquad -\langle K(x^{k+1}-x),y^{k+1}-y^{k}\rangle +{\it\theta}_{k}\langle K(x^{k+1}-x),y^{k}-y^{k-1}\rangle \nonumber\\ \displaystyle & & \displaystyle \qquad \qquad +\displaystyle \frac{1-{\it\tau}_{k}L_{h}}{2{\it\tau}_{k}}\Vert x^{k}-x^{k+1}\Vert ^{2}+\displaystyle \frac{1}{2{\it\sigma}_{k}}\Vert y^{k}-y^{k+1}\Vert ^{2}.\nonumber\end{eqnarray}$$
Letting
 $$\begin{eqnarray}{\rm\Delta}_{k}(x,y):=\frac{\Vert x-x^{k}\Vert ^{2}}{2{\it\tau}_{k}}+\frac{\Vert y-y^{k}\Vert ^{2}}{2{\it\sigma}_{k}},\end{eqnarray}$$
 and assuming we can choose  $({\it\tau}_{k},{\it\sigma}_{k},{\it\theta}_{k})$ satisfying
 $$\begin{eqnarray}\displaystyle \displaystyle \frac{1+{\it\tau}_{k}{\it\mu}_{g}}{{\it\tau}_{k}} & \geq & \displaystyle \displaystyle \frac{1}{{\it\theta}_{k+1}{\it\tau}_{k+1}},\end{eqnarray}$$
 $$\begin{eqnarray}\displaystyle {\it\sigma}_{k} & = & \displaystyle {\it\theta}_{k+1}{\it\sigma}_{k+1},\end{eqnarray}$$
we obtain
 $$\begin{eqnarray}\displaystyle & & \displaystyle {\rm\Delta}_{k}(x,y)-{\it\theta}_{k}\langle K(x^{k}-x),y^{k}-y^{k-1}\rangle \nonumber\\ \displaystyle & & \displaystyle \qquad \geq {\mathcal{L}}(x^{k+1},y)-{\mathcal{L}}(x,y^{k+1})+\displaystyle \frac{1}{{\it\theta}_{k+1}}{\rm\Delta}_{k+1}(x,y)\nonumber\\ \displaystyle & & \displaystyle \qquad \qquad -\langle K(x^{k+1}-x),y^{k+1}-y^{k}\rangle +\displaystyle \frac{1-{\it\tau}_{k}L_{h}}{2{\it\tau}_{k}}\Vert x^{k+1}-x^{k}\Vert ^{2}\nonumber\\ \displaystyle & & \displaystyle \qquad \qquad +\displaystyle \frac{1}{2{\it\sigma}_{k}}\Vert y^{k+1}-y^{k}\Vert ^{2}+{\it\theta}_{k}\langle K(x^{k+1}-x^{k}),y^{k}-y^{k-1}\rangle .\nonumber\end{eqnarray}$$
 Now using (with  $L=\Vert K\Vert$)
 $$\begin{eqnarray}\displaystyle & & \displaystyle {\it\theta}_{k}\langle K(x^{k+1}-x^{k}),y^{k}-y^{k-1}\rangle \nonumber\\ \displaystyle & & \displaystyle \qquad \geq -\displaystyle \frac{{\it\theta}_{k}^{2}L^{2}{\it\sigma}_{k}{\it\tau}_{k}}{2{\it\tau}_{k}}\Vert x^{k}-x^{k+1}\Vert ^{2}-\displaystyle \frac{1}{2{\it\sigma}_{k}}\Vert y^{k}-y^{k-1}\Vert ^{2},\nonumber\end{eqnarray}$$
 we find, using  $1/{\it\theta}_{k+1}={\it\sigma}_{k+1}/{\it\sigma}_{k}$, that
 $$\begin{eqnarray}\displaystyle & & \displaystyle {\rm\Delta}_{k}(x,y)-{\it\theta}_{k}\langle K(x^{k}-x),y^{k}-y^{k-1}\rangle +\displaystyle \frac{1}{2{\it\sigma}_{k}}\Vert y^{k}-y^{k-1}\Vert ^{2}\nonumber\\ \displaystyle & & \displaystyle \qquad \geq {\mathcal{L}}(x^{k+1},y)-{\mathcal{L}}(x,y^{k+1})\nonumber\\ \displaystyle & & \displaystyle \qquad \qquad +\displaystyle \frac{{\it\sigma}_{k+1}}{{\it\sigma}_{k}}\Big({\rm\Delta}_{k+1}(x,y)-{\it\theta}_{k+1}\langle K(x^{k+1}-x),y^{k+1}-y^{k}\rangle \nonumber\\ \displaystyle & & \displaystyle \hspace{204.85983pt}+\displaystyle \frac{1}{2{\it\sigma}_{k+1}}\Vert y^{k+1}-y^{k}\Vert ^{2}\Big)\nonumber\\ \displaystyle & & \displaystyle \qquad \qquad +\displaystyle \frac{1-{\it\tau}_{k}L_{h}-{\it\theta}_{k}^{2}L^{2}{\it\sigma}_{k}{\it\tau}_{k}}{2{\it\tau}_{k}}\Vert x^{k+1}-x^{k}\Vert ^{2}.\nonumber\end{eqnarray}$$
 If we can ensure, for all  $k$, that
 $$\begin{eqnarray}{\it\tau}_{k}L_{h}+{\it\theta}_{k}^{2}L^{2}{\it\sigma}_{k}{\it\tau}_{k}\leq 1,\end{eqnarray}$$
then we will deduce by induction that
 $$\begin{eqnarray}\displaystyle & & \displaystyle {\rm\Delta}_{0}(x,y)\geq \mathop{\sum }_{i=1}^{k}\displaystyle \frac{{\it\sigma}_{i-1}}{{\it\sigma}_{0}}({\mathcal{L}}(x^{i},y)-{\mathcal{L}}(x,y^{i}))\nonumber\\ \displaystyle & & \displaystyle \qquad +\displaystyle \frac{{\it\sigma}_{k}}{{\it\sigma}_{0}}\biggl({\rm\Delta}_{k}(x,y)-{\it\theta}_{k}\langle K(x^{k}-x),y^{k}-y^{k-1}\rangle +\displaystyle \frac{1}{2{\it\sigma}_{k}}\Vert y^{k}-y^{k-1}\Vert ^{2}\biggr).\nonumber\end{eqnarray}$$
Finally, letting
 $$\begin{eqnarray}T_{k}=\mathop{\sum }_{i=1}^{k}\displaystyle \frac{{\it\sigma}_{i-1}}{{\it\sigma}_{0}},\quad (X^{k},Y^{k})=\displaystyle \frac{1}{T_{k}}\mathop{\sum }_{i=1}^{k}\displaystyle \frac{{\it\sigma}_{i-1}}{{\it\sigma}_{0}}(x^{k},y^{k}),\end{eqnarray}$$
 for each  $k$ and using the convexity of
  ${\mathcal{L}}(\cdot ,y)-{\mathcal{L}}(x,\cdot )$, we find that
 $$\begin{eqnarray}\displaystyle {\rm\Delta}_{0}(x,y) & \geq & \displaystyle T_{k}({\mathcal{L}}(X^{k},y)-{\mathcal{L}}(x,Y^{k}))\nonumber\\ \displaystyle & & \displaystyle +\,\displaystyle \frac{{\it\sigma}_{k}}{{\it\sigma}_{0}}\displaystyle \frac{1-{\it\theta}_{k}^{2}L^{2}{\it\tau}_{k}{\it\sigma}_{k}}{2{\it\tau}_{k}}\Vert x_{k}-x\Vert ^{2}+\displaystyle \frac{1}{2{\it\sigma}_{0}}\Vert y_{k}-y\Vert ^{2}.\nonumber\end{eqnarray}$$
 There are several choices of  ${\it\tau}_{k},{\it\sigma}_{k},{\it\theta}_{k}$ that will ensure a good rate of convergence for the ergodic gap or for the distance
  $\Vert x_{k}-x\Vert$; see Chambolle and Pock (Reference Chambolle and Pock2015a) for a discussion. A simple choice, as in Chambolle and Pock (Reference Chambolle and Pock2011), is to take, for
  $k\geq 0$,
 $$\begin{eqnarray}\displaystyle & & \displaystyle {\it\theta}_{k+1}=\displaystyle \frac{1}{\sqrt{1+{\it\mu}_{g}{\it\tau}_{k}}},\end{eqnarray}$$
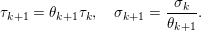 $$\begin{eqnarray}\displaystyle & & \displaystyle {\it\tau}_{k+1}={\it\theta}_{k+1}{\it\tau}_{k},\quad {\it\sigma}_{k+1}=\displaystyle \frac{{\it\sigma}_{k}}{{\it\theta}_{k+1}}.\end{eqnarray}$$
One can show that in this case, since
 $$\begin{eqnarray}\displaystyle \frac{1}{{\it\tau}_{k+1}}=\displaystyle \frac{1}{{\it\tau}_{k}}+\displaystyle \frac{{\it\mu}_{g}}{1+\sqrt{1+{\it\mu}_{g}{\it\tau}_{k}}},\end{eqnarray}$$
 we have  ${\it\tau}_{k}\sim 2/({\it\mu}_{g}k)$, so that
 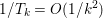 $1/T_{k}=O(1/k^{2})$. In this case,
 $$\begin{eqnarray}{\it\tau}_{k}L_{h}+{\it\theta}_{k}^{2}L^{2}{\it\sigma}_{k}{\it\tau}_{k}={\it\tau}_{k}L_{h}+{\it\theta}_{k}^{2}L^{2}{\it\sigma}0{\it\tau}_{0}\leq {\it\tau}_{0}(L_{h}+L^{2}{\it\sigma}_{0}),\end{eqnarray}$$
 so choosing  ${\it\sigma}_{0}$ arbitrarily and
  ${\it\tau}_{0}\leq 1/(L_{h}+L^{2}{\it\sigma}_{0})$ will yield convergence. If, moreover,
 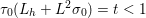 ${\it\tau}_{0}(L_{h}+L^{2}{\it\sigma}_{0})=t<1$, we find, in addition to the ergodic rate
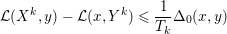 $$\begin{eqnarray}{\mathcal{L}}(X^{k},y)-{\mathcal{L}}(x,Y^{k})\leq \displaystyle \frac{1}{T_{k}}{\rm\Delta}_{0}(x,y)\end{eqnarray}$$
 for all  $(x,y)\in {\mathcal{X}}\times {\mathcal{Y}}$, the rate for the iterate
  $x^{k}$:
 $$\begin{eqnarray}\Vert x_{k}-x^{\ast }\Vert ^{2}\lesssim \displaystyle \frac{4}{(1-t){\it\mu}_{g}^{2}k^{2}}\biggl(\displaystyle \frac{1}{{\it\tau}_{0}^{2}}\Vert x^{0}-x^{\ast }\Vert ^{2}+\displaystyle \frac{1}{{\it\sigma}_{0}{\it\tau}_{0}}\Vert y^{0}-y^{\ast }\Vert ^{2}\biggr),\end{eqnarray}$$
 where  $(x^{\ast },y^{\ast })$ is a saddle point.