

INTRODUCTION
Gastrointestinal parasitism of calves, in particular with Ostertagia ostertagi, is a significant challenge to their health, welfare and productivity. As such, a variety of control strategies have been proposed to reduce the negative effects of parasitism (Cockroft, Reference Cockroft2015). These include the Weybridge ‘dose and move’ strategy, a reduction in stocking rate and dosing at strategic time points of the grazing season (Michel and Lancaster, Reference Michel and Lancaster1970; Hansen et al. Reference Hansen, Zajac, Eversole and Gerken1989; Cockroft, Reference Cockroft2015). More recently, targeted selective treatment, where specific individuals of a population as opposed to the whole population are treated, has been suggested as an alternative control strategy (Höglund et al. Reference Höglund, Dahlström, Sollenberg and Hessle2013a ; O'Shaughnessy et al. Reference O'Shaughnessy, Earley, Mee, Doherty, Crosson, Barrett and de Waal2015).
Quantifying the effectiveness of such strategies is both time consuming and expensive, and in many respects it is difficult, if not impossible to make comparisons between them due to confounding variables (Höglund, Reference Höglund2010). Simulation modelling is a potential alternative to experimentation and, provided that a model is based on sound principles and data, it has the potential to evaluate different approaches to control. In order to be able to assess the effectiveness of such control strategies, a stochastic (i.e. probabilistic, population-based) model allowing for individual-response differences is required. This is because individuals will affect parasite epidemiology and subsequently influence the effectiveness of control. Stochastic models (Renshaw, Reference Renshaw1991) can help to evaluate such strategies, by simulating identical scenarios allowing a direct comparison of treatment effectiveness, and to identify potential interactions, thereby aiding in the assessment of the feasibility of novel control strategies. Currently, we are not aware of published simulation models that allow us to account for variation between individual calves within a group and variation in parasite supra population, i.e. parasite populations at all development stages across all hosts.
The aim of this paper was to develop a stochastic simulation model that was capable of accounting for such variation and can be utilized in future studies of parasite control strategies. The stochastic model was based on the deterministic approach previously developed by Berk et al. (Reference Berk, Bishop, Forbes and Kyriazakis2016). The deterministic model is able to account for the interactions between gastrointestinal parasites and an individual calf to predict parasite infra-populations, i.e. populations within individual hosts. By introducing variation in growth and resistance traits amongst calves, along with an epidemiological-transmission layer, we aimed to develop a model which considers O. ostertagi-calf interactions along with their epidemiological consequences. Following model development, its behaviour was evaluated under simple manipulations such as variations in stocking rate and larval pasture contamination (PC). Finally, the model was validated against the prevailing management control strategies, such as reduced stocking rate, the ‘dose and move’ strategy and strategic anthelmintic drenching.
MATERIALS AND METHODS
A previously developed dynamic, deterministic model (Berk et al. Reference Berk, Bishop, Forbes and Kyriazakis2016) to describe the interactions between gastrointestinal parasites and an individual calf, was extended to a stochastic one for a grazing population/herd of calves. A brief description of the individual calf model is given below, followed by a more detailed description of the additional features incorporated towards the development of a grazing population model. Abbreviations used throughout the paper are defined below and provided in Appendix Table A1.
Individual calf model
A schematic diagram representing the model interactions for an individual calf infected by O. ostertagi is provided in Fig. 1. Briefly, it was assumed that a healthy calf attempts to ingest sufficient nutrients to meet demands for growth and maintenance (Coop and Kyriazakis, Reference Coop and Kyriazakis1999). In the presence of parasitic infection, a parasitized calf experiences an endogenous protein loss (Fox, Reference Fox1993). Consequently, the calf is assumed to invest in an immune response to reduce the impact of infection (Claerebout and Vercruysse, Reference Claerebout and Vercruysse2000). However, despite the endogenous protein loss and the increased resource requirement for the development of immunity, a reduction in feed intake occurs as a result of immune components, e.g. cytokines and related pathological and inflammatory responses (Fox et al. Reference Fox, Gerrelli, Pitt, Jacobs, Gill and Gale1989; Kyriazakis, Reference Kyriazakis2014). This reduction was modelled as a function of the rate of acquisition of immunity (Laurenson et al. Reference Laurenson, Bishop and Kyriazakis2011). Consequently, the calf consumes insufficient food resources to fulfil its requirements. Ingested protein, after the loss due to parasitism, was assumed to be first allocated to maintenance and repair requirements (Coop and Kyriazakis, Reference Coop and Kyriazakis1999). Remaining food resources were then allocated between growth and immunity, proportional to their requirements (Kahn et al. Reference Kahn, Kyriazakis, Jackson and Coop2000; Doeschl-Wilson et al. Reference Doeschl-Wilson, Vagenas, Kyriazakis and Bishop2008; Laurenson et al. Reference Laurenson, Bishop and Kyriazakis2011). Such requirements were defined in accordance to Vagenas et al. (Reference Vagenas, Doeschl-Wilson, Bishop and Kyriazakis2007).
Schematic description of the parasite–host interactions. The rectangular boxes and solid lines indicate the flow of ingested feed resources; the oval boxes indicate the host–parasite interactions and the hexagonal boxes represent the key measurable stages of the parasite life cycle. Host immune response and related pathological and inflammatory responses were assumed to lead to parasite-induced anorexia (broken line).
Herd population model
In contrast to previously published models (Vagenas et al. Reference Vagenas, Doeschl-Wilson, Bishop and Kyriazakis2007; Doeschl-Wilson et al. Reference Doeschl-Wilson, Vagenas, Kyriazakis and Bishop2008; Laurenson et al. Reference Laurenson, Kyriazakis and Bishop2012), between-animal variation was only modelled at the phenotypic level, for the sake of simplicity. Phenotypic variation was assumed to occur in animal growth characteristics, maintenance requirements and host immunity to gastrointestinal parasitism.
Variation in growth characteristics
A growing calf was described by its empty bodyweight at weaning (EBW), protein mass at maturity (P M ), a growth rate parameter (B*) and the lipid-to-protein ratio at maturity (LPR M ). These parameters were selected to minimize correlation to one another, hence preventing problems that would arise from correlated parameters for stochastic simulations (Symeou et al. Reference Symeou, Leinonen and Kyriazakis2016). Growth was assumed to be driven by protein and lipid retention, with expected growth rates described by adaptations of existing functions (Emmans, Reference Emmans1997; Emmans and Kyriazakis, Reference Emmans and Kyriazakis1997), such that:
 $$\Delta PGrowth_{max} = P \,{\cdot}\left( {\displaystyle{{B{^\ast}} \over {P_M ^{0 \cdot 27}}}} \right) \cdot \ln \left( {\displaystyle{{P_M} \over P}} \right)$$
 $$\Delta Lipid_{des} = \Delta PGrowth_{max} \cdot LPR_M \cdot d \cdot \left( {\displaystyle{P \over {P_M}}} \right)^{(d - 1)} $$
where ΔPGrowth
max
is the expected rate of protein retention (kg day−1), ΔLipid
des
is the expected rate of lipid retention (kg day−1), P is the current body protein mass (kg), and $d = 1 \cdot\, 46 \cdot LPR_M^{0 \cdot 23} $
.
$d = 1 \cdot\, 46 \cdot LPR_M^{0 \cdot 23} $
.
Thus, differences in initial EBW (EBW i ), P M , B* and LPR M can result in between-animal variation in initial body weight, growth rate, mature body composition and mature body weight. As such, these input parameters were assumed to vary phenotypically and are given in Table 1.
Calf traits for which phenotypic variation between individuals was assumed to occur within the model, with corresponding parameter values for their mean and coefficient of variation (CV)
See the text for sources of parameter values.
Variation in maintenance requirements
The body maintenance requirements for protein (PR maint , kg day−1) and metabolizable energy (ER maint , MJ day−1) were modelled in accordance with Emmans and Kyriazakis (Reference Emmans and Kyriazakis2001):
 $$PR_{maint} = p_{maint} \; \displaystyle{P \over {P_M^{0 \cdot 27}}} $$
 $$ER_{maint} = e_{maint} \; \displaystyle{P \over {P_M^{0 \cdot 27}}} $$
where p maint is the constant associated with protein maintenance requirements and e maint is the constant associated with energy maintenance requirements. Phenotypic variation in the parameters p maint and e maint was assumed, as it signifies differences in maintenance requirements for protein and energy (Knap and Schrama, Reference Knap and Schrama1996; Laurenson et al. Reference Laurenson, Kyriazakis and Bishop2012).
Variation in host immunity
The immune response was represented by the host-controlled traits of parasite establishment, mortality (μ, proportion of adult worms/day) and fecundity (F, eggs/female/day). Establishment was determined by subtracting the effect of mortality from the combined effect of establishment and mortality (EM, change in adult worm numbers/day). The functions used to describe these traits were characterized in Berk et al. (Reference Berk, Bishop, Forbes and Kyriazakis2016) as:
 $$EM = (EM_{max} - EM_{min} ) \cdot \exp \; ( - k_{EM} \cdot LD) + EM_{min} $$
 $$\mu = \displaystyle{{(\mu _{max} - \mu _{min} ) \cdot (LD)^2} \over {k_\mu ^2 + \; (LD)^2}} + \mu _{min} $$
 $$F = (F_{max} - F_{min} ) \cdot \exp ( - k_F \cdot LD) + F_{min} $$
where LD is the larvaldays as a measure of parasite exposure; EM max , μ max and F max are the maxima of the combined effect of establishment and mortality, mortality and fecundity, respectively; EM min , μ min and F min are the minima of the combined effect of establishment and mortality, mortality and fecundity, respectively; k EM , k μ and k F are the rate constants of the relationships between larvaldays and the combined effect of establishment and mortality, mortality and fecundity, respectively.
The calves were assumed to be initially naïve to gastrointestinal parasites and gradually acquired immunity as calf exposure to infective larvae increased. The rate of immune acquisition was therefore determined by the length of temporal exposure to infective larvae and the rate parameters k EM , k μ , k F , for each of the host-controlled immunity traits. All parameters describing the maxima, minima and rate of acquisition for each of the host-controlled immunity traits were assumed to exhibit between animal variations.
Variation in feed intake
In addition to variation in the specified traits, a degree of random variation was assumed to reflect the influence of external factors controlling variation in day to day feed intake that were not explicitly accounted for by the model. Due to the correlation between growth and feed intake tending towards unity in this model, daily random deviation in feed intake was adjusted to give a more realistic phenotypic correlation between feed intake and growth rate of approximately 0·8 (Cammack et al. Reference Cammack, Leymaster, Jenkins and Nielsen2005; Laurenson et al. Reference Laurenson, Kyriazakis and Bishop2012).
Parameter values and distributions
The model was parameterized such that the calf and its growth represented a weaned, castrated male (steer) Limousin × Holstein Friesian born in autumn; this common cross currently represents the majority of beef cattle reared in the UK (Todd et al. Reference Todd, Wooliams and Roughsedge2011). Autumn born calves are capable of utilizing grass in spring and hence are turned out at 6 months of age and left at pasture until late autumn (Phillips, Reference Phillips2010). Parasitological parameters were based on those gathered from published literature (Berk et al. Reference Berk, Bishop, Forbes and Kyriazakis2016). Each trait selected to be phenotypically variable was assigned a population mean and coefficient of variation (CV) as provided in Table 1 based on several sources. The immune development traits were assumed to follow a log-normal distribution, whereas all other traits were assumed to be normally distributed (Vagenas et al. Reference Vagenas, Doeschl-Wilson, Bishop and Kyriazakis2007; Laurenson et al. Reference Laurenson, Kyriazakis and Bishop2012). Over recent years calves have been selectively bred to show favourable traits, such as growth rate (Prakash, Reference Prakash2009). However, immune traits are rather more difficult to select for (Frisch, Reference Frisch1981; Prakash, Reference Prakash2009). Log-normal distributions were assigned to the immune rate parameters to allow for higher levels of variation (several-fold increase or decrease) without the negative values that could arise from utilizing a normal distribution for these parameters. For the growth attributes the mean values were taken as presented by Berk et al. (Reference Berk, Bishop, Forbes and Kyriazakis2016) and CVs based on estimates for other ruminants (Vagenas et al. Reference Vagenas, Doeschl-Wilson, Bishop and Kyriazakis2007; Laurenson et al. Reference Laurenson, Kyriazakis and Bishop2012). Similarly, the mean value of immune traits were taken as presented by Berk et al. (Reference Berk, Bishop, Forbes and Kyriazakis2016) and, owing to a lack of data to provide confident estimates, CVs were based on values for lambs infected with the closely related parasite Teladorsagia circumcincta (Laurenson et al. Reference Laurenson, Kyriazakis and Bishop2012).
All traits, other than those representing the host immune response, were assumed to be uncorrelated (Doeschl-Wilson et al. Reference Doeschl-Wilson, Vagenas, Kyriazakis and Bishop2008). However, the acquisition of immunity was assumed to be a function of overlapping effector mechanisms (components of the Th2 immune response; Mihi et al. Reference Mihi, van Meulder, Vancoppernolle, Rinaldi, Chiers, van den Broeck, Goddeeris, Vercruysse, Claerebout and Geldhof2014). Thus, the rate-determining parameters (k EM , k μ , k F ) were assumed to be strongly correlated (coefficient of correlation r = +0·5) (Laurenson et al. Reference Laurenson, Kyriazakis and Bishop2012). Establishment was calculated as the combined effect of establishment and mortality minus the effect of mortality alone, as such predictions for establishment and mortality were correlated. In order to counteract this, a negative correlation (r = −0·2) was applied to the parameters describing the maximum effect of combined establishment and mortality and the minimum mortality. For correlated traits a Cholesky decomposition of the variance–covariance matrix was used to generate the co-variances between the phenotypic input parameters of the individual animals.
Epidemiological module
To simulate natural infection of calves in the herd, it was necessary to consider external environmental conditions, including the epidemiology of free-living parasite stages. Many aspects of parasite epidemiology are affected by environmental conditions, in particular temperature and moisture (Stromberg, Reference Stromberg1997). Temperature was considered to have the most prominent effect as described below, and moisture was assumed non-limiting under UK conditions. The potential effects of other environmental factors, such as moisture or UV light, were not considered (Stromberg, Reference Stromberg1997).
Grass quantity and quality
The total grazing pasture available to the calf herd was defined in hectares (H, ha). The initial quantity of grass per hectare (GPH 0) was defined as 2500 kg DM ha−1 in accordance with English Beef and Lamb Executive (EBLEX) Grazing Planning (2013) and an even grass coverage was assumed. As such, the initial quantity of grass available for grazing (G 0, kg DM) was calculated as:
 $$G_0 = GPH_0 \cdot H$$
Each day (t), the total grass available for grazing (G, kg DM) was updated to take into account the grass consumed by the calf population and new grass growth. Thus, G t was estimated in accordance with Laurenson et al. (Reference Laurenson, Kyriazakis and Bishop2012):
 $$G_t = G_{t - 1} - \mathop \sum \nolimits FI_{t - 1} + (GG \cdot H)$$
where $\mathop \sum \nolimits FI$
is the total feed intake for all simulated calves, and GG is daily grass growth (kg DM ha−1) which was estimated for the relevant grazing period using the average grass growth per day for each month reported by EBLEX (2013). GG ranged from 30 to 60 kg DM ha−1 over the 180 day simulated grazing season.
$\mathop \sum \nolimits FI$
is the total feed intake for all simulated calves, and GG is daily grass growth (kg DM ha−1) which was estimated for the relevant grazing period using the average grass growth per day for each month reported by EBLEX (2013). GG ranged from 30 to 60 kg DM ha−1 over the 180 day simulated grazing season.
A reasonably consistent relationship between calendar month and quality of grass has been reported (Trouw Nutrition, 2010; AHDB, 2013). Consequently, the crude protein (CP, g kg−1 DM) and metabolizable energy (ME, MJ kg−1 DM) content of grass were time-dependent according to data obtained from fields grazed by cattle in the UK (Woodward et al. Reference Woodward, Shepherd and Hein1938; Dale et al. Reference Dale, Mayne, Ferris, Hopps, Verner, Mulholland, McCluggage and Matthews2012). As such, over the simulated grazing period of 180 days, CP ranged from 165 to 199 g kg−1 DM, and ME ranged from 11·2 to 12·0 mJ kg−1 DM.
Pasture contamination
A given number of overwintered infective L3 larvae were assumed to be resident on pasture and comprise the initial L3 larval contamination (IL 0, L3 kg−1 DM). As such, the initial total infective L3 larval population on pasture (LP 0) was calculated as:
 $$LP_0 = IL_0 {\cdot}G_0 $$
On subsequent days a small number of additional larvae were assumed to become resident on pasture as a result of the maturation and migration of a low level of overwintering eggs, L1 and L2 (Bairden et al. Reference Bairden, Armour and Duncan1995; Urquhart et al. Reference Urquhart, Armour, Duncam, Dunn and Jennings1996). This was modelled as an exponential decay function (Pandey, Reference Pandey1972; Myers and Taylor, Reference Myers and Taylor1989), such that the infective L3 larvae arising daily from an initial underlying contamination of eggs, L1 and L2 (IL, L3 kg−1 DM) was estimated on day t as:
 $$IL_t = 0 {\cdot} 05\,{\rm exp}( - 0 {\cdot} 05t) \cdot IL_0 $$
For simplicity, the assumption was that there is a constant relationship between the initial L3 contamination and subsequent development of L3 from overwinter eggs, L1 and L2 larvae. However, this consideration was only made prior to the appearance of infective L3 larvae arising from eggs deposited by the calf population. The time to earliest appearance of egg-producing adult female worms within the host population, and hence eggs deposited onto pasture, was assumed to be 17 days (Williams et al. Reference Williams, Roberts and Todd1974). The proportion of eggs that develop into infective L3 larvae was assumed to be 0·15 (Young and Anderson, Reference Young and Anderson1981). The number of days taken for the eggs to reach the infective L3 stage, and the mortality rate of infective L3 larvae, were assumed to be temperature dependent (Pandey, Reference Pandey1972; Smith et al. Reference Smith, Grenfell and Anderson1986).
To model temperature-dependent effects over the simulated grazing season, the mean of the average monthly temperatures observed by the UK Meteorological Office over a 3-year period (2010–2012) were used. A fourth-order interpolating polynomial was fitted to the average monthly temperatures to produce a 6-months temperature curve (Emmanouil et al. Reference Emmanouil, Galanis and Kallos2006), such that the maximum temperature (Temp, °C) on day t was given by:
 $$Temp_t = 0 {\cdot}000000013t^4 - 0 {\cdot}0000077t^3 + 0 {\cdot}00067t^2 + 0 {\cdot}084t + 6{ \cdot} 3$$
As such, over the simulated grazing period of 180 days, Temp ranged from 7·8 to 15·4 °C.
An exponential relationship was fitted between paired data describing temperature and development time (DT), i.e. number of days taken to develop from egg to an infective L3 larva on pasture (Rose, Reference Rose1961). As a result, the mean development time of eggs deposited on day t, DT (days, rounded to the nearest integer), was assumed to be dependent on Temp:
 $$DT_t = 146\; e^{ - 0 \cdot 189 \cdot Temp_t} + 2{\cdot}92$$
The stochastic nature of development time was represented as a uniform distribution (mean = DT t days, range = ±4 days), over whole day increments (Rose, Reference Rose1961). As such, DT ranged from 7 to 40 days over the simulated grazing period. Thus, the number of new infective L3 larvae (newIL) arising from eggs previously deposited by the calf population was calculated from a convolution of egg deposition and egg maturation time distributions:
 $$newIL_t = \left( {\mathop \sum \limits_{i = 0}^{i = t} U[(t - i) - DT_i ]\; PEI {\cdot}E_i} \right)$$
where U[~] is a uniform probability distribution centred at zero with a range of −4 to +4 days, and t is the current day, i any previous day (from 0 to current day), E i the total egg output of the calf population on day i, DT i the mean development time for eggs deposited on day i, and PEI the proportion of eggs that develop into infective L3 larvae. U has a value of ~11% probability of maturing on day DT after deposition on pasture, and on the 4 days previous and following day DT.
The relationship between Temp and the larval mortality rate (L 3 M, proportion of infective L3 larvae dead day−1) was defined using data from Young and Anderson (Reference Young and Anderson1981) for the temperature ranges observed in the UK. A linear relationship was assumed (Grenfell et al. Reference Grenfell, Smith and Anderson1986), such that L 3 M on day t was given as:
 $$L_3 M = 0 {\cdot} 0014 {\cdot }Temp_t + 0{ \cdot} 018$$
Over the simulated grazing period, L 3 M ranged from 0·029 to 0·040 (Young and Anderson, Reference Young and Anderson1981).
Consequently, the total infective L3 larval population on pasture (LP) at the start of day t was given as:
 $$\eqalignno{LP_t &= \left( {LP_{t - 1} - \mathop \sum \nolimits LI_{t - 1}} \right) \cdot (1 - L3M_t )\cr &\quad + (IL_t \cdot H),\quad \hbox{when }\enspace newIL_t = 0 &(16)}$$
 $$\eqalignno{\quad \enspace LP_t &= \left( {LP_{t - 1} - \mathop \sum \nolimits LI_{t - 1}} \right) \cdot (1 - L3M_t )\cr &\quad + newIL_t,\hskip6pt \hbox{when}\hskip6pt newIL_t \gt 0 &(17)}$$
where $\mathop \sum \nolimits LI$
is the total larval intake of the calf population.
$\mathop \sum \nolimits LI$
is the total larval intake of the calf population.
Larval intake
Calves were assumed to graze randomly across pasture. However, the spatial distribution of the larvae across the pasture was assumed to be aggregated (Boag et al. Reference Boag, Topham and Webster1989; Grenfell et al. Reference Grenfell, Wilson, Isham, Boyd and Dietz1995; Verschave et al. Reference Verschave, Levecke, Duchateau, Vercruysse and Charlier2015). A negative binomial probability distribution was used with the mean being mean larval contamination of pasture (L3 kg−1 DM) and the exponent describing the degree of aggregation k = 1·41 (Verschave et al. Reference Verschave, Levecke, Duchateau, Vercruysse and Charlier2015). Hence, the larval intake (LI, infective L3 larvae) of an individual calf was determined by its feed intake (FI, kg DM) and by sampling the pasture according to the negative binomial distribution, such that:
 $$LI_t = FI_t {\cdot}NB\left( {\displaystyle{{LP_t} \over {G_t}}, \;k} \right)$$
where LP t /G t (L3 larvae day−1) is the mean number of L3 larvae per ha grazed on day t.
Simulations
The modelled herd comprised 500 calves generated using a stochastic Monte-Carlo simulation, created in MATLAB (2015). For the model inputs defined in Table 1, this population size resulted in a maximum relative s.e. of 1·34% (estimated for F max ), which was considered sufficiently large given that further increases in population size showed no further reduction in s.e.
Model behaviour
Model behaviour was evaluated by simulating a selection of IL 0 levels and stocking rates. To investigate model behaviour under differing IL 0 levels (0, 100, 200 or 500 O. ostertagi L3 kg−1 DM), the grazing area was set to 100 ha to represent a conventional stocking rate of 5 calves ha−1 (EBLEX, 2013). To investigate model behaviour under differing stocking rates, IL 0 was set to 200 O. ostertagi L3kg−1 DM, and the grazing area adjusted for low (3 calves ha−1), conventional (5 calves ha−1) and high (7 calves ha−1) stocking rates, as defined by EBLEX (2013). In all cases, calves were assumed to be parasitologically naïve when turned out in early April for 180 days. Model outputs were calculated on a daily basis and presented as the population mean for: (1) parasite worm burden (WB, worms); (2) fecal egg count (FEC, eggs g−1 feces); (3) feed intake (FI, kg DM); (4) relative reduction in calf bodyweight gain (BWG, kg) (comparative to a non-parasitized healthy calf); and (5) pasture larval contamination (PC, L3 larvae kg−1 DM).
Model validation (control strategies)
To validate model outputs, predictions were compared with observations made in experimental studies investigating the impact of a variety of nematode control strategies (stocking rates, ‘dose and move’ and strategic anthelmintic treatment). Where possible, experimental observations were compared with the population mean for the following model outputs: (1) FEC (eggs g−1 feces); and (2) PC (L3 kg−1 DM). Where observed percentages of O. ostertagi present in relation to other parasites were recorded, direct quantitative comparisons were made. In cases where parasite species differentiation was not made the total numbers of strongyle eggs or pasture larval counts were used to provide a qualitative validation.
Experimental studies from available literature were selected for comparison on criteria stated in Appendix Table A2. A thorough literature review identified the following eight studies that met the specified criteria and were therefore used to validate model predictions for: (1) stocking rate (Nansen et al. Reference Nansen, Foldager, Hansen, Henriksen and Jørgensen1988); (2) strategic dosing (Jacobs et al. Reference Jacobs, Foster and Gowling1989; Fisher and Jacobs, Reference Fisher and Jacobs1995; Taylor et al. Reference Taylor, Mallon, Kenny and Edgar1995; Vercruysse et al. Reference Vercruysse, Hilderson and Claerebout1995; Satrija et al. Reference Satrija, Nansen and Jørgensen1996; Sarkũnas et al. Reference Sarkũnas, Malakauskas, Nansen, Hansen and Paulikas1999); and (3) dose and move (Michel and Lancaster, Reference Michel and Lancaster1970). Initial model input values were taken from each study and included: (1) the initial larval contamination (L3 kg−1 DM); (2) calf stocking rate; (3) day of turnout; and (4) experimental treatment strategy. For cases where calves received unplanned supplementary feed or emergency anthelmintic treatments part way during the experimental period, measurements taken beyond these points were not included. The actions taken to ensure that the simulations were comparable with experimental observations are below.
Growth rates
The model required P M and B* as inputs. All studies meeting the criteria described above were performed a number of years ago and hence it was necessary to account for changes that may have occurred in these traits as a result of selective breeding. This was done according to the method detailed in Berk et al. (Reference Berk, Bishop, Forbes and Kyriazakis2016). It was assumed that calf body composition has remained the same with no direct selection for lean cattle, but rather for heavier mature weights (Emmans and Kyriazakis, Reference Emmans and Kyriazakis2001; Hays and Preston, Reference Hays, Preston, Hafs and Zimbelman2012).
Following this, the mean of parameter B* (Table 1) was adjusted such that model outputs reflected the growth rates observed for un-infected calves in each study. In the absence of un-infected experimental control groups, calves under a strategic ivermectin treatment were assumed to reflect the growth rate of un-infected calves. For example, in Michel and Lancaster (Reference Michel and Lancaster1970) calves receiving repeated anthelmintic treatments were assumed to reflect growth rates of un-infected calves.
Epidemiological components
To account for the variations in turnout date, the date of turnout was used as an input for each experiment. This allowed for seasonal factors such as grass growth, grass quality and temperature-dependent effects to be adjusted accordingly.
Mixed Cooperia infections
It was necessary to consider mixed infections of O. ostertagi and Cooperia due to limitations in the published literature for model validation. Such infections have been observed to cause a greater depression in growth than mono-specific infections (Kloosterman et al. Reference Kloosterman, Albers and Van Den Brink1984; Satrija and Nansen, Reference Satrija and Nansen1993). It is widely recognized that although in a single O. ostertagi infection any protein loss can be reabsorbed in the small intestine, in a mixed infection the presence of Cooperia in the small intestine hinders the reabsorption process (Fox, Reference Fox1993; Holmes, Reference Holmes1993). Thus, parameters describing the protein loss associated with both larval and worm mass were increased by 10% (Kloosterman et al. Reference Kloosterman, Albers and Van Den Brink1984).
Control via stocking rate
The constant population size of 500 calves was used for all simulations. As such, the total grazing area (H, ha) was adjusted to match the differing stocking rates of each experimental study. In the experimental study of Nansen et al. (Reference Nansen, Foldager, Hansen, Henriksen and Jørgensen1988), which investigated two stocking rates, a mid-season rotation was incorporated whereby half of the calves were moved to clean pastures, thus halving the stocking rate on current pasture. To account for this, H was doubled at the appropriate time-point. Further, to simulate calves that moved to a clean pasture the same parameters were defined; however, at the time of the mid-season rotation when H was increased, the PC was also reset to 10 L3 kg−1 DM as representative of a ‘clean’ pasture.
Control via dose and move
During the period for which Michel and Lancaster (Reference Michel and Lancaster1970) conducted their study, ivermectin was not available and thiabendazole was the drug of choice; the efficacy of this drug is likely to have been high at the time of this experiment and hence an efficacy of 0·99 and no residual activity (Prichard et al. Reference Prichard, Steel and Hennessy1981) were assumed. Following anthelmintic drenching, calves were immediately moved to a ‘cleaner’ pasture by resetting the grass available for grazing (G t ) to 2500 kg DM ha−1 (EBLEX, 2013) and PC to 50 L3 kg−1 DM (with no resident egg, L1 or L2 population).
Control via strategic anthelmintic treatment
Although there are no universal guidelines for strategic anthelmintic dosing, the recommended timings for administration of ivermectin are 3, 8 and 13 weeks post-turnout in order to minimize worm egg output until mid-July, when most overwintered larvae have died (Cockroft, Reference Cockroft2015). Ivermectin, the most widely used anthelmintic, was assumed to have an efficacy of 0·99 against O. ostertagi with residual activity for three weeks (NOAH, 2015). Following this period of residual efficacy against O. ostertagi, ivermectin efficacy was assumed to decrease by 0·15 per day. This was parameterized such that model predictions for FEC and PC exhibited similar patterns to those observed in ivermectin treated calves (Vercruysse et al. Reference Vercruysse, Hilderson, Dorny and Berghen1988). Ivermectin was assumed to be equally effective against all worm and larval stages residing within the host.
RESULTS
Model behaviour
Frequency distribution of output traits
Output performance traits were normally distributed at all times. For example, the means (and s.d.) for body weight were 363 (32·7), 429 (41·5), 487 (51·5) and 534 (60·4) kg at 40, 80, 120 and 160 days post-turnout, respectively, for calves grazing clean pasture at a conventional stocking density (5 calves ha−1). In contrast, although parasitological inputs were normally or log-normally distributed, the frequency distribution of predicted WB and FEC became increasingly right-skewed over time, as demonstrated for FEC in Fig. 2.
Frequency distribution of fecal egg counts (FEC, eggs g−1 feces) of 500 calves grazed at a conventional stocking density of 5 calves ha−1 on a pasture initially contaminated with 200 Ostertagia ostertagi L3 kg−1 DM grass, on day: (A) 40, (B) 80, (C) 120 and (D) 160.
Increasing initial contamination (IL0)
Parasitological traits
The population mean of WB and FEC for IL 0 levels of 100, 200 and 500 L3 kg−1 DM are given in Fig. 3A and B. Whilst increasing IL 0 caused minor changes in the maximum predicted WB, the timing of peak WB was predicted to decrease with increasing IL 0. The maximum mean WB (and day of peak) for IL 0 levels of 100, 200 and 500 L3 kg−1 DM were 37 159 (114), 37 772 (109) and 32 831 (103), respectively. For the highest IL 0 of 500 L3 kg−1 DM an additional small peak in WB was observed during the early stages of infection at approximately day 45. Additionally all IL 0 levels showed a marked increase in the gradient of WB around day 80. Similar to WB, the day of peak FEC (eggs g−1 feces) decreased with increasing IL 0, and caused minor changes in the maximum predicted FEC. The maximum FEC (and day of peak) for IL 0 levels of 100, 200 and 500 L3 kg−1 DM were 47 (95), 48 (43) and 67 (38), respectively. The intermediate IL 0 of 200 L3 larvae kg−1 DM was predicted to show a similar maximum FEC to the lowest IL 0 of 100 L3 larvae kg−1 DM; however, two peaks of approximately equal magnitude were observed. Ultimately, FEC reached similar final levels irrespective of IL 0.
The mean parasitological and performance traits for 500 calves, at a conventional stocking rate of 5 calves ha−1, grazing pasture initially contaminated (IL 0) with either 0, 100, 200 or 500 Ostertagia ostertagi L3 kg−1 DM grass. The parasitological traits provided are: (A) mean worm burden and (B) mean fecal egg count (eggs g−1 feces) for the population. The performance traits provided are: (C) mean feed intake (kg DM) and (D) mean relative body weight gain (kg) in relation to the un-infected calf population. The epidemiological trait provided is: (E) pasture larval contamination (L3 kg−1 DM grass).
Performance traits
The population mean for FI and relative reductions in BWG are given in Fig. 3C and D. Increasing IL 0 resulted in an increased maximum reduction and earlier achievement of maximum reduction in FI, and a faster rate of recovery towards the FI of an uninfected calf. Across the duration of the grazing season the average FI for control calves on clean pasture was 7·64 kg DM day−1: the average relative reductions were 5% for all IL 0 levels. Consistent with the predicted patterns for FI, reductions in BWG were greater for higher IL 0 in the early stages of infection; however, in the latter stages the magnitude of differences between IL 0 became negliable. The average relative reductions in average daily BWG across the season were 0·12, 0·12 and 0·10 kg day−1 for IL 0 levels of 100, 200 and 500 L3 kg−1 DM, respectively.
Pasture contamination
Predictions for PC (L3 kg−1 DM) are given in Fig. 3E. Similar patterns were observed for all IL 0 with PC decreasing up until day 52 when PC began to increase towards a peak. Increasing IL 0 resulted in an earlier peak, however, the maximum predicted PC did not relate directly to IL 0. The intermediate IL 0 of 200 L3 kg−1 DM showed the lowest peak PC. The maximum predicted PC (and day of maximum) for IL 0 levels of 100, 200 and 500 L3 kg−1 DM were 903 (116), 825 (82) and 901 (77) L3 kg−1 DM, respectively. Upon reaching the peak, PC then declined to similar levels, irrespective of IL 0.
Stocking rate
Parasitological traits
The population mean for WB and FEC for three stocking rates are given in Fig. 4A and B. Calf stocking rates had no effect on WB until day 78, at which point WB increased with increasing stocking rates as a reflection of patterns in PC. Higher stocking rates resulted in increased maximum WB. The maximum WB (and day of peak) for low, conventional and high stocking rates were 20 749 (110), 37 772 (109) and 61 508 (109), respectively. Maximum FEC was similar for all stocking rates as was the day of FEC peak. The maximum FEC (and day of maximum) for low, conventional and high stocking rates were 48 (44), 48 (43) and 48 (38), respectively. A second peak in FEC was observed for conventional and high stocking rates; the second peak (and day of peak) for conventional and high stocking rates were at 38 (94) and 44 (90), respectively.
The mean parasitological and performance traits for 500 calves grazing pasture initially contaminated with 200 Ostertagia ostertagi L3 kg−1 DM grass, and kept at stocking rates of either 3, 5 or 7 calves ha−1. The parasitological traits provided are: (A) mean worm burden, and (B) mean fecal egg count (eggs g−1 feces) for the population. The performance traits provided are: (C) mean feed intake (kg DM) and (D) mean relative body weight gain (kg) in relation to the un-infected calf population. The epidemiological trait provided is: (E) pasture larval contamination (L3 kg−1 DM grass). The group of untreated calves showed no differences in feed intake and growth due to the assumption of optimal grass availability at the start of the grazing season.
Performance traits
The population mean for FI and relative reduction in BWG are given in Fig. 4C and D. As with the parasitological outputs, there was no divergence between stocking rates for either of the performance traits until day 78. The maximum reduction in FI increased with increasing stocking rates, and FI remained compromised in relation to un-infected calves for all stocking rates throughout the simulated grazing period. Across the duration of the grazing season, the average FI for control calves on clean pasture was 7·64 kg DM day−1, and the average comparative FI were reduced by 4, 5 and 5% for low, conventional and high stocking rates, respectively. The relative reduction in BWG increased for increasing stocking rates. The average daily BWG across the season were reduced in comparison to uninfected calves by 0·07, 0·12 and 0·24 kg day−1 for low, conventional and high stocking rates, respectively.
Pasture contamination
Predictions for PC (L3 kg−1 DM) are given in Fig. 4E. Initially, similar patterns were observed for all stocking rates with PC decreasing until day 52, at which point L3 from eggs deposited on pasture eggs first appear and PC increased to a peak and then declined. Increasing stocking rates resulted in an increased maximum PC. The maximum predicted PC (and day of maximum) for low, conventional and high stocking rates were 409 (82), 825 (82) and 1722 (108) L3 kg−1 DM, respectively. It was therefore observed that IL 0 did not affect performance or infestation significantly.
Validation
The following sections detail model outputs for the validation simulations.
Stocking rates
Graphical comparisons of FEC between the model and the experiments conducted by Nansen et al. (Reference Nansen, Foldager, Hansen, Henriksen and Jørgensen1988) are provided in Fig. 5A–D. In general, model predictions showed similar patterns to the observed data. FEC increased steadily to a peak and then began to decline, with the exception of observations made on calves kept at high stocking rates on the same pasture (Fig. 5C), for which a high FEC was observed at the final measurement. The majority of data were close to the predicted population mean, and all observations except one were between the estimated lower and upper extreme values of the modelled population.
Comparison of experimental observations (●) of Nansen et al. (Reference Nansen, Foldager, Hansen, Henriksen and Jørgensen1988) to simulated mean prediction (-) for fecal egg count (FEC, eggs g−1 feces) (A–D) and pasture contamination (L3 kg−1 DM grass) (E–H), along with the lower and upper extreme values ( … ) for individuals within the simulated population. Calves were kept at a moderate stocking rate (11·7 calves ha−1) for the first half of the grazing season, and on day 60, split into two equal groups (5·8 calves ha−1) and either: (A) remained on the same pasture or (B) moved to a cleaner pasture (10 L3 kg−1 DM grass). This was repeated for a high stocking rate (17·5 calves ha−1), and on day 60, groups of calves (8·8 calves ha−1) either: (C) remained on the same pasture or (D) moved to a cleaner pasture (10 L3 kg−1 DM grass).
A graphical comparison for observed and predicted levels of PC is provided in Fig. 5E–H. For calves remaining on the same pasture throughout the study (Fig. 5E and G), the model predicted PC to increase to a peak and then decline. A slight dip was predicted on day 60 when the stocking rate was halved. For the calves moved to clean pasture on day 60 post-turnout (Fig. 5F and H), the model predicted an increase in PC up until day 60 when PC was reset to low levels; after which PC increased to a peak then slowly declined. For both comparisons of PC, a more pronounced effect was seen at the higher stocking rate. Although there was some lack of consistency in the patterns of observed values the model predictions appear to show a reasonable likeness to individual observed points upon graphical comparison, with the exception of the final measurements taken for calves remaining on the same pasture for both stocking rates; the latter appears to be an outlier among the other observations.
Dose and move
A graphical comparison of PC was made for the three dose and move experiments conducted in successive years (Michel and Lancaster, Reference Michel and Lancaster1970). For calves remaining on the same pasture (Fig. 6A, C and E) similar patterns were seen for observed and predicted outputs with an increase in PC up to a peak followed by a decline. The calves moved mid-July (Fig. 6B, D and F) showed a reduced contamination from the move date with only a small increase in PC on the new pasture.
Comparison of experimental observations (●) of Michel and Lancaster (Reference Michel and Lancaster1970) to simulated predictions (-) for pasture contamination (L3 kg−1 DM grass). For untreated control calves grazed on pasture in: (A) 1965, (C) 1966 and (E) 1967. For calves given thiabendazole on day 70 and moved to ‘clean’ pasture (50 L3 kg−1 DM grass) in: (B) 1965, (D) 1966 and (F) 1967.
Strategic dosing
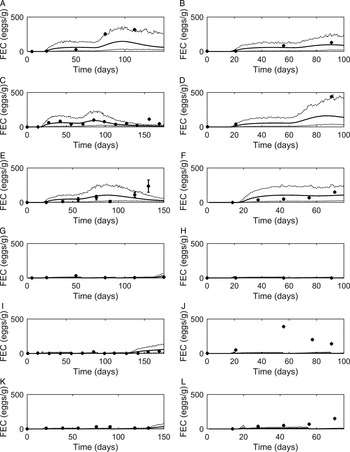
Graphical comparisons of FEC for each of the six previously identified strategic anthelmintic dosing studies are presented in Fig. 7A–F. Predicted FEC in the untreated groups were similar to observed FEC. Observed FEC increased as time progressed, and in studies conducted for a sufficient time period (>150 days) FEC reached a peak and began to decline (Jacobs et al. Reference Jacobs, Foster and Gowling1989; Taylor et al. Reference Taylor, Mallon, Kenny and Edgar1995; Satrija et al. Reference Satrija, Nansen and Jørgensen1996) although rebounded later. Model predictions were consistently similar to observations made for the ivermectin treated groups (Fig. 7G–L) which showed low FEC across time, with the exception of data from Fisher and Jacobs (Reference Fisher and Jacobs1995). For all comparisons, the majority of data were close to the predicted population mean for FEC, falling between the estimated lower and upper extreme values for individuals of the modelled population. Additional graphical comparisons were made for PC for five of the studies; a graphical comparison for untreated calves is given in Fig. 8A–E, both observed and predicted patterns showed initially an increase in PC as time progressed. Congruent with FEC, PC also reached a peak and began to decline (Taylor et al. Reference Taylor, Mallon, Kenny and Edgar1995). However, this was not supported by Satrija et al. (Reference Satrija, Nansen and Jørgensen1996), where predictions diverged from observed PC from day 100. For the graphical comparisons of ivermectin treated groups (Fig. 8F–J), all observations and predictions showed a low level of PC, with the exception of Satrija et al. (Reference Satrija, Nansen and Jørgensen1996) where a notable increase in PC was observed at the latter stages of the experiment.
Comparison of experimental observations (●) to simulated mean prediction (-) for fecal egg count (FEC, eggs g−1 feces), along with the predicted lower and upper extreme values ( … ) for individuals within the simulated population. Predictions were made for the group of calves receiving no anthelmintic treatment for experimental data from: (A) Taylor et al. (Reference Taylor, Mallon, Kenny and Edgar1995), (B) Vercruysse et al. (Reference Vercruysse, Hilderson and Claerebout1995), (C) Satrija et al. (Reference Satrija, Nansen and Jørgensen1996), (D) Fisher and Jacobs (Reference Fisher and Jacobs1995), (E) Jacobs et al. (Reference Jacobs, Foster and Gowling1989) and (F) Sarkũnas et al. (Reference Sarkũnas, Malakauskas, Nansen, Hansen and Paulikas1999). Comparisons were also made for calves receiving ivermectin on weeks 3, 8 and 13 post-turnout (G–L).
Comparison of experimental observations (●) to simulated mean prediction (-) for pasture contamination (L3 kg−1 DM grass) in the group of calves receiving no anthelmintic treatment. The experimental data are from: (A) Taylor et al. (Reference Taylor, Mallon, Kenny and Edgar1995), (B) Vercruysse et al. (Reference Vercruysse, Hilderson and Claerebout1995), (C) Satrija et al. (Reference Satrija, Nansen and Jørgensen1996), (D) Fisher and Jacobs (Reference Fisher and Jacobs1995) and (E) Sarkũnas et al. (Reference Sarkũnas, Malakauskas, Nansen, Hansen and Paulikas1999). Comparisons were also made for calves receiving ivermectin on weeks 3, 8 and 13 post-turnout (F–J).
DISCUSSION
A stochastic model was developed to account for the impacts of variation between calves in their ability to deal with O. ostertagi, under management conditions that have the potential to affect parasite infra- and supra-populations. Previous comparable studies where calves received the same, or similar, levels of parasite challenge indicated disparities in the immune response exhibited by individuals (Michel, Reference Michel1969; Michel and Sinclair, Reference Michel and Sinclair1969). A recent meta-analysis on O. ostertagi infections of calves (Verschave et al. Reference Verschave, Vercruysse, Claerebout, Rose, Morgan and Charlier2014) found large variations between studies when predicting immune responses. Thus, introducing such variation in simulation models is necessary, as individuals affect parasite epidemiology and can influence the effectiveness of controls. This cannot be captured by models that assume that all individuals within a group are alike and deal with an ‘average’ animal, as is the case for deterministic models (Smith and Guerrero, Reference Smith and Guerrero1993; Grenfell et al. Reference Grenfell, Wilson, Isham, Boyd and Dietz1995; Fox et al. Reference Fox, Marion, Davidson, White and Hutchings2013).
Stochastic models enable to address uncertainty and variability in the various factors believed to be important in the behaviour of the system, which in this case comprises the cattle herd, the parasites and their environment. The major issues explored here was variation within the herd and how the distribution of parameter values could affect herd performance and parasitological outputs. The mean characteristics of the system reflect complex interactions of the model parameters, which were defined as probabilistic distributions rather than fixed values. Beyond the mean characteristics, the model also predicted the expected range of outcomes for FEC, such as those shown in Figs 5 and 7. For the purposes of comparability, the simulations presented here were performed on a fixed number of calves (n = 500) while stocking density values were set by specifying different values for the grazing area; hence, it was possible to compare directly the predicted averages and extremes. It would be possible to model smaller, more typical, herd sizes, but in this case would be necessary to perform multiple simulations to obtain a proper statistical description of herd characteristics. The emphasis in this work has been on describing variation within the calf population, but the approach can be extended to capture uncertainties in other factors. For example, the historical average temperature profile used here could be replaced by a stochastic representation; multiple simulations over time would then give insights into the range of possible outcomes.
Converting our deterministic model into a stochastic one presented us with two major challenges. The first one was to introduce variation between the individuals of a herd. Values that enable parameterization of the variation between individual calves in growth characteristics exist or at least can be deduced (Ferreira et al. Reference Ferreira, MacNeil and Van Vleck1999; Laurenson et al. Reference Laurenson, Bishop and Kyriazakis2011; Mc Hugh et al. Reference Mc Hugh, Evans, Amer, Fahey and Berry2011). This, however, is not the case for traits that are associated with the ability of hosts to deal with the parasite. For this reason, we resorted to values that have been assumed for sheep (Vagenas et al. Reference Vagenas, Doeschl-Wilson, Bishop and Kyriazakis2007; Laurenson et al. Reference Laurenson, Bishop and Kyriazakis2011). As there is an increased requirement for characterizing animals for a number of phenotypic and genetic traits (Goddard and Hayes, Reference Goddard and Hayes2009), the hope is that animal breeders will provide such information for health-related traits, in a manner already done for other animals, such as for resistance to mastitis in dairy cattle (Gernand et al. Reference Gernand, Rehbein, von Borstel and König2012).
The second challenge was to introduce an epidemiological component to the model. Previous attempts to quantify free-living stages of O. ostertagi have become increasingly complex (Gettinby and Paton, Reference Gettinby and Paton1981; Grenfell et al. Reference Grenfell, Smith and Anderson1987; Smith et al. Reference Smith, Grenfell, Anderson and Beddington1987a ; Chaparro et al. Reference Chaparro, Canziani and Fiel2013; Rose et al. Reference Rose, Wang, Van Dijk and Morgan2015). As our focus was on host–parasite interactions we kept this aspect relatively simple. Moisture was assumed to be a non-limiting factor, although in reality rainfall and moisture levels may have a notable effect on aspects of parasite epidemiology (Young and Anderson, Reference Young and Anderson1981). However, the net impact on PC levels can be considered to be small due to counteracting mechanisms. For example, heavy rainfall increases larval mortality and accelerates the passage of larvae from pasture downward into the soil reservoir (Al Saqur et al. Reference Al Saqur, Armour, Bairden, Dunn, Jennings and Murray1982; Gruner et al. Reference Gruner, Mauleon and Sauve1982; Grenfell et al. Reference Grenfell, Smith and Anderson1986), whilst increased moisture helps the transmission of larvae from fecal pats to herbage by translocation and by splash dispersal (Grønvold and Høgh-Schmidt, Reference Grønvold and Høgh-Schmidt1989; Stromberg, Reference Stromberg1997). Only temperature was accounted for in the model, as being the most influential climatological feature on PC levels (Stromberg, Reference Stromberg1997). Development time (DT) for eggs to reach infective L3 larvae was dependent on the average daily temperature on the day of excretion alone. A cumulative measure of temperature was not used due to the non-linear relationship between temperature and development, and daily fluctuations in temperature. The sensitivity of the average DT to temperature was tested by adding random variation (CV = 0·5) in temperature; however, there was little to no impact on the outputs generated suggesting this to be a fair assumption.
Additionally, demographic stochasticity was incorporated into the model in the form of variation in feed intake and random aggregated distribution of larvae in the pasture. Random variation in calf feed intake impacts on calf growth and the larval intake of an individual, whilst aggregated variation in pasture larvae will influence the larval intake of an individual. Seasonal effects are perceived to impact upon the levels of larval aggregation across pasture; this is an almost ubiquitous feature of parasitic infections due to weather-dependent dispersal patterns of L3 larvae from fecal pats. It has previously been observed that significant aggregation was only apparent during particular months, with the level of aggregation correlating to larval numbers (Flota-Bañuelos et al. Reference Flota-Bañuelos, Martínez, López-Collado, Vargas Mendoza, González Hernández and Fajersson2013). High PC related to low aggregation and low PC to high aggregation (Flota-Bañuelos et al. Reference Flota-Bañuelos, Martínez, López-Collado, Vargas Mendoza, González Hernández and Fajersson2013; Verschave et al. Reference Verschave, Levecke, Duchateau, Vercruysse and Charlier2015). Although mitigating factors, such as passive dispersal or fecal avoidance behaviours (Hutchings et al. Reference Hutchings, Knowler, Mcanulty and Mcewan2007) are recognized, an aggregated pasture is still expected (Grenfell et al. Reference Grenfell, Wilson, Isham, Boyd and Dietz1995) and accounted for. The negative binomial is known to provide a good empirical relationship for this overdispersion (Barger, Reference Barger1987; Boag et al. Reference Boag, Topham and Webster1989; Fox et al. Reference Fox, Marion, Davidson, White and Hutchings2013); however, to avoid model complexity the level of aggregation (k) was assumed the same for all contamination levels.
Contrary to horizontal aggregation, distribution of larvae along the sward was assumed to be evenly distributed. Due to factors such as distance of larvae from the feces, seasonal variations and vertical migration of larvae, modelling the vertical distribution would be incredibly complex (Pandey, Reference Pandey1974). Often greater proportions of larvae are found lower on herbage; this may have implications for calves kept at high stocking rates where calves graze closer to the base of thee sward. An exaggerated increase in larval uptake can be observed relative to lower stocking rates (Gruner and Sauve, Reference Gruner and Sauve1982), inducing a more rapid immune acquisition.
An investigation of model behaviour highlighted the importance of interactions between immune acquisition and epidemiology. Parasitological burdens of those individuals that exhibited a slow immune acquisition began to recover earlier than might be expected due to the effect of immunocompetent calves within the herd, which produced fewer eggs, acting to reduce PC levels. Increasing levels of initial pasture contamination (IL 0) resulted in earlier peaks in PC and parasitological outputs (WB and FEC) arising from higher parasitic exposure and hence a more rapid immune acquisition. Differences between peak values were marginal due to assumed density-dependent effects on parasite fecundity (Michel et al. Reference Michel, Lancaster and Hong1978; Smith et al. Reference Smith, Grenfell and Anderson1987b ) and the mid-summer rise in PC. The faster immune acquisition by calves exposed to high IL 0 enabled them to counteract the mid-summer rise in L3 in comparison to a lower IL 0. This is supported by the hypothesis that turnout date, ultimately defining the degree of immune acquisition prior to the mid-summer rise in PC, is perhaps more important than IL 0 (Eysker, Reference Eysker1986; Höglund et al. Reference Höglund, Hessle and Dahlström2013b ; Taylor et al. Reference Taylor, Coop and Wall2015). The final PC and net impact of parasitism on performance was similar for all IL 0 levels; this is in line with a meta-analysis which suggested the relationship between weight gain and IL 0 was insignificant (Shaw et al. Reference Shaw, Vercruysse, Claerebout and Dorny1998b ). However, this is not to say IL 0 levels are not important to consider. When accompanied by different control strategies the IL 0 will likely have an impact on parasitological and performance outcomes.
Changes in stocking rate had comparatively greater parasitological and performance effects than changes in IL 0. The effect is generally inconsequential early in the season due to high grass growth and low PC; however as the season progresses grass growth subsides and a mid-summer rise in PC occurs (Henriksen et al. Reference Henriksen, Jørgensen and Nansen1976; Nansen et al. Reference Nansen, Foldager, Hansen, Henriksen and Jørgensen1988). At high stocking rates, the intensity of hosts results in lower grass availability and increased total egg excretion, causing a more dramatic rise in PC. Consequently, the peak parasitological outputs increased with increased stocking rate, as observed experimentally (Hansen et al. Reference Hansen, Zajac, Eversole and Gerken1989; Thamsborg et al. Reference Thamsborg, Jørgensen and Nansen1998). There was a significant difference predicted in the final net performance of calves kept at each stocking rate. Since it was assumed that pasture availability was non-limiting, this was purely a result of infection. This was in line with experimental work showing significant reductions in mean weight gains for conventional and high stocking rates comparative with a low stocking rate (Hansen et al. Reference Hansen, Zajac, Eversole and Gerken1989; Thamsborg et al. Reference Thamsborg, Jørgensen and Nansen1998). Although experimentally it is difficult to ascertain whether these losses resulted from parasitism or a lack of grass availability, Nansen et al. (Reference Nansen, Foldager, Hansen, Henriksen and Jørgensen1988) concluded that parasitism was the major cause of poor performance at high stocking rates. The model predicted a reduction in BWGs of between 5 and 16%; interestingly meta-analyses conducted on a variety of breeds have shown average reduction in BWG of 5·4% (Shaw et al. Reference Shaw, Vercruysse, Claerebout, Agneessens and Dorny1997) and 22·7% (Shaw et al. Reference Shaw, Vercruysse, Claerebout and Dorny1998a ) for sub-clinical infections. Although breed may affect observed reductions, it should also be noted these may be slightly larger as a result of concurrent Cooperia infections; this is discussed later.
To validate the model, the most common control strategies aiming to reduce the parasitic challenge and burden were identified; these included reduced stocking rate and the Weybridge ‘dose and move’ technique (Michel and Lancaster, Reference Michel and Lancaster1970). ‘Dose and move’ incorporates a planned move coinciding with an anticipated peak in PC, generally mid-July for most of the UK (Smith, Reference Smith2014). It has previously proved to be a successful control strategy (Michel and Lancaster, Reference Michel and Lancaster1970; Henriksen et al. Reference Henriksen, Jørgensen and Nansen1976; Nansen et al. Reference Nansen, Grønvold, Jørgensen, Henriksen, Foldager and Sejrsen1989; Eysker et al. Reference Eysker, van der Aar, Boersema, Dop and Kooyman1998). However, lack of pasture availability has made it increasingly difficult to implement low stocking rates and ‘dose and move’ strategies (Herd, Reference Herd1988; Shaw et al. Reference Shaw, Vercruysse, Claerebout, Agneessens and Dorny1997). The ‘dose and move’ strategy is also believed to accelerate the development of anthelmintic resistance by removing refugia on pasture (van Wyk, Reference Van Wyk2001). As a result, strategic anthelmintic dosing at specific time points has become critical to maintaining calf health. The objective is to prevent the build-up of PC by limiting fecal egg output during the early part of the grazing season (Vercruysse and Claerebout, Reference Vercruysse and Claerebout1997). This is achieved by strategic treatment with anthelmintics, which has been observed to be effective against parasitic gastroenteritis for a full season, under conditions where the parasitic challenge is large enough to induce severe parasitic gastroenteritis in controls (Hollanders et al. Reference Hollanders, Berghen, Dorny, Hilderson, Vercruysse and Ryan1992; Vercruysse et al. Reference Vercruysse, Hilderson and Claerebout1995).
Previous quantitative evaluation of the deterministic model on which the current stochastic one was based, revealed the former model as reasonably proficient at estimating mean parasitological traits. This places a degree of confidence on the current model, provided that its sources of stochastic variation have been estimated accurately. Based on comparing observed and predicted FEC for the current, stochastic model in order to estimate parameter values for calf variation and parasite epidemiology, the model appeared to be proficient at estimating observed outputs under the specified scenarios. In cases where discrepancies between predicted and observed FEC were observed, contributory factors were identified. Some studies did not distinguish between parasite genera, stating only that O. ostertagi were the most prevalent species, whilst in others calves were treated with anthelmintics on clinical grounds following the final measurements used for validation suggesting disease may have been border-line clinical at the time of measurements.
Additional comparisons were made between observed and predicted values for average PC; in most cases the predictions provided a good fit, however a few discrepancies were apparent. As previously mentioned, the aggregated nature of PC is likely to influence the sampling of PC; if sufficient repeated measures are not taken then an under or overestimation of the PC level may occur (Verschave et al. Reference Verschave, Levecke, Duchateau, Vercruysse and Charlier2015). Upon sampling PC some experimenters have opted to consciously avoid fecal pats, where the highest concentrations of larvae exist: this may have resulted in an under estimation of observed PC (Henriksen et al. Reference Henriksen, Jørgensen and Nansen1976; Nansen et al. Reference Nansen, Foldager, Hansen, Henriksen and Jørgensen1988). Poor grass growth causes a higher concentration of larvae on pasture (Vercruysse et al. Reference Vercruysse, Hilderson and Claerebout1995) and, as for FEC, the lack of distinction between parasite genera may also result in discrepancies between observed and predicted PC. A clear example comes from Satrija et al. (Reference Satrija, Nansen and Jørgensen1996) whereby PC switches from predominantly O. ostertagi to predominantly Cooperia in August; from this point onwards the model does not predict PC well.
Should these factors not account for the differences between observed and predicted PC it may be a result of a model oversimplification. These may result in inaccurate predictions made on PC which in turn would affect the larval intake due to the self-proliferating nature of the relationships defined in the model. If this is the case, explanations for why FEC still provide a good fit must be considered, implying that the within-host relationships may over or under compensate for these differences.
Monospecific and concurrent artificial infections of O. ostertagi and Cooperia suggested an absence of inter-species interactions (Kloosterman et al. Reference Kloosterman, Albers and Van Den Brink1984; Satrija and Nansen, Reference Satrija and Nansen1993; Hilderson et al. Reference Hilderson, Vercruysse, Claerebout, De Graaf, Fransen and Berghen1995). Concurrent infections did, however, show greater than additive FEC in comparison with the two monospecific infections (Kloosterman et al. Reference Kloosterman, Albers and Van Den Brink1984; Satrija and Nansen, Reference Satrija and Nansen1993; Hilderson et al. Reference Hilderson, Vercruysse, Claerebout, De Graaf, Fransen and Berghen1995), thought to be a consequence of enhanced pathological effects (Parkins et al. Reference Parkins, Taylor, Holmes, Bairden, Salman and Armour1990). This has been suggested to reflect the fact that Cooperia increases the rate of protein loss leading to a reduced growth rate and growth requirements. Slower growth will be accompanied by lower feed intake, which will have a concentration effect on FEC due to lower output of feces (Parkins et al. Reference Parkins, Taylor, Holmes, Bairden, Salman and Armour1990). This is supported by reduced pepsinogen levels, reflecting abomasal damage (Parkins et al. Reference Parkins, Taylor, Holmes, Bairden, Salman and Armour1990), and almost doubled plasma losses for concurrent infections comparative to monospecific O. ostertagi infections (Kloosterman et al. Reference Kloosterman, Albers and Van Den Brink1984; Parkins and Holmes, Reference Parkins and Holmes1989). To account for a mixed infection the most comprehensive method would be to create a model component for predicting the effects of Cooperia on the host, and determine species interactions. Although some data exists on artificial Cooperia infections as has been summarized by Verschave et al. (Reference Verschave, Rose, Morgan, Claerebout, Vercruysse and Charlier2016), there is very limited data on artificial mixed infections and hence it would be difficult to decipher species interactions for a full range of infection levels.
The development of a stochastic model to account for host–parasite interactions opens up a number of opportunities for future developments. Firstly, it enables the effectiveness of different control strategies to be assessed, including targeted selective treatments where specific individuals of a population are treated, as opposed to the whole population (Höglund et al. Reference Höglund, Dahlström, Sollenberg and Hessle2013a ; O'Shaughnessy et al. Reference O'Shaughnessy, Earley, Mee, Doherty, Crosson, Barrett and de Waal2015). This method has been advocated as a potential way to reduce parasite resistance to anthelmintics, but hard, non-confounded data to support this does not exist (Höglund, Reference Höglund2010). Introduction of potential parasite resistance mechanisms would allow for such refugia-based strategies to be assessed for effectivity and sustainability over short- and long-term periods; this would provide a useful tool considering the challenges of experimentally investigating long-term effects. Further to this, the addition of second grazing season (SGS) calves would allow exploration of the impact of different control strategies on the immune acquisition of SGS calves and effects of hypobiosis. The model is also flexible enough to allow the investigation into the consequences of breeding for parasite resistance through the addition of a genetic component. Although breeding of resistant cattle stock would prove challenging (Kloosterman et al. Reference Kloosterman, Albers and Van Den Brink1978) there is large potential for genetic progress, more so than sheep (Kloosterman et al. Reference Kloosterman, Parmentier and Ploeger1992).
ACKNOWLEDGEMENT
We would like to thank Joao Filipe for his comments on previous versions of the manuscript.
FINANCIAL SUPPORT
This work was supported by BBSRC (Grant code: BB/K50175X/1), Merial and KTN in the form of a postgraduate studentship for Zoe Berk, supervised by Ilias Kyriazakis and Andrew Forbes.
APPENDIX
A table of common abbreviations used throughout the text
A list of the required criteria that were achieved by experimental studies in order for them to be appropriate for use in validating the model


 Open access