

Supplementation of the bovine feed with plant oils is a strategy implemented to achieve partial replacement of saturated fatty acids (SFA) with unsaturated fatty acids (FA) in milk( Reference Markey 1 ). There is limited evidence assessing the influence of dairy products on postprandial biomarkers of endothelial function( Reference Labonté 2 ). We aimed to assess the effect of consumption of SFA-reduced, monounsaturated fat (MUFA)-enriched dairy products (modified) compared to dairy products with a typical FA-profile of retail products (control) on postprandial soluble adhesion molecules.
Fifty adults at moderate cardiovascular disease risk (31 men, 19 women; age 53 (SE 2) years; BMI 25·9 (SE 0·5) kg/m2) participated in this 12-week, randomized, crossover, double-blinded, controlled dietary intervention. By implementing a flexible food-exchange model, iso-energetic high-fat (38 %TE), high dairy diets (control dietary target: 19 %TE SFA, 11 %TE MUFA; modified: 16 %TE SFA, 14 %TE MUFA) were achieved. A sequential two-meal postprandial investigation was conducted at the beginning and end of each intervention period, whereby participants received a test breakfast (50 g fat; 0 min) and lunch (30 g fat; 330 min) rich in either control or modified dairy products. Blood samples were collected at 0, 180, 300 and 420 min after the test breakfast for the measurement of postprandial soluble E-selectin, P-selectin, intercellular adhesion molecule-1 (ICAM-1) and vascular cell adhesion molecule-1 (VCAM-1) responses. Data are presented as the change in the incremental area under the curve (iAUC; Fig. 1) relative to the baseline visit.
Change in the iAUC from the baseline study visits for the postprandial soluble adhesion molecule responses following consumption of sequential high-fat meals incorporating either control or modified dairy products. Mixed model analyses, adjusting for baseline values, age, gender, BMI, period and treatment. Values are means with vertical bars as standard errors. P ≥ 0·05 for all outcome measures.
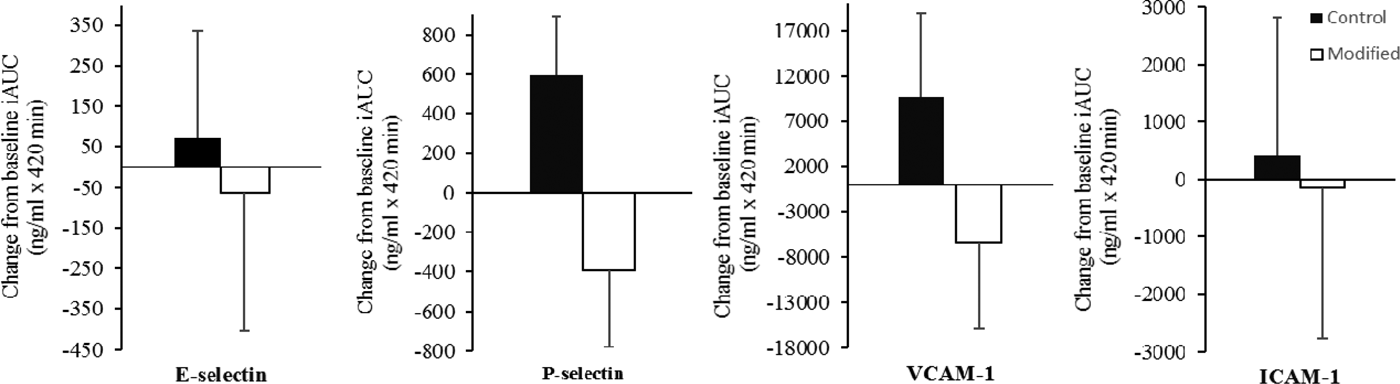
Following chronic consumption of the modified diet, there was no treatment effect observed in the postprandial response of soluble adhesion molecules, compared to the control diet. These findings are part of the RESET intervention trial (NCT02089035), which will also investigate the impact of FA-modified products on postprandial vascular function and inflammatory markers.
This research was supported by the Medical Research Council (MR/K020218/1), with food in-kind from Arla Foods UK and AAK (UK) Ltd.

