


Normal physiological and behavioural perturbation of net body water (fluid) balance changes daily total body water (TBW) by <1 %( Reference Cheuvront, Ely and Kenefick 1 ). The demands of physical activity perturb whole-body fluid balance and results in a net water deficit (dehydration) that may affect exercise tolerance and/or performance( Reference Goulet 2 – Reference Wall, Watson and Peiffer 4 ). Physical activity accelerates the rate of substrate oxidation and the depletion of body energy stores. Particularly during intense exercise, the preferential use of carbohydrate as a substrate leads to accelerated use of muscle glycogen and an increase in branched chain amino acid oxidation by muscle that is inversely related to muscle glycogen content( Reference Kasperek and Snider 5 ). After exercise, amino acids, particularly the essential amino acids (EAA), are required in support of tissue repair and remodelling. A recovery beverage should, therefore, fulfil both fluid and nutrient requirements. Supported by evidence that milk can act as an effective rehydration fluid( Reference Shirreffs, Watson and Maughan 6 , Reference Watson, Love and Maughan 7 ), it is reasoned that the nutrient composition of milk offers a superior recovery fluid than water or carbohydrate–electrolyte solutions (CE).
A common, laboratory-based, experimental paradigm to investigate the optimal strategy for fluid replacement is to undertake prolonged (approximately 90 min) exercise and thermal dehydration to a fixed decrease in body mass (−2 % BM), a surrogate of change in TBW( Reference Shirreffs, Taylor and Leiper 8 , Reference Shirreffs and Maughan 9 ). The outcome of these studies recommends a fluid replacement regimen that requires the ingestion of a fluid volume equivalent to 150 % of the BM loss during exercise to be consumed within 1 h after exercise( Reference Sawka, Burke and Eichner 10 ). The volume of fluid equivalent to 150 % of an approximately 2 % loss in BM for an 80 kg male approximates to 2·5 litres, which, when ingested in bolus mode over a short time (i.e. 1 h), results in enhanced diuresis and failure to restore net fluid balance (NFB) within 4–6 h( Reference Shirreffs, Taylor and Leiper 8 , Reference Shirreffs and Maughan 9 , Reference Nose, Mack and Shi 11 ). The rate and magnitude of fluid retention following exercise and thermal dehydration is enhanced by the addition of electrolytes( Reference Nose, Mack and Shi 11 – Reference Merson, Maughan and Shirreffs 13 ), carbohydrate( Reference Nielsen, Sjogaard and Ugelvig 14 – Reference Clayton, Evans and James 17 ) and protein( Reference Seifert, Harmon and DeClercq 18 – Reference James, Mattin and Aldiss 21 ) affecting singly, or in combination, the inter-related processes of gastric emptying, intestinal absorption and retention. Addition of electrolytes, carbohydrate and protein may also fulfil the requirement to replenish body reserves and recovery of muscle glycogen.
Recent evidence suggests that a ‘metered’ approach to fluid replacement post exercise is a more effective strategy( Reference Jones, Bishop and Green 22 ). A metered fluid intake has greater ecological validity for the athlete, but whether the presence of electrolytes or macronutrients in the rehydration fluid would act in synergy with a metered fluid intake to improve body NFB following exercise is not known. In this study, exercise and thermal dehydration to −2 % BM was used to examine net body fluid balance over a 5-h period following metered replacement of three rehydration fluids of constant volume, equivalent to 150 % of the exercise-induced BM loss. Plain water (W) was used as the control fluid against which a proprietary CE and low-fat milk (M) was compared. CE is purported to be optimised for post-exercise restoration of fluid and carbohydrate and is a popular form of replenishment fluid following exercise( 23 ). M was chosen for the enhanced electrolyte (K) and macro-nutrient (carbohydrate, protein and fat) composition and healthier nutrient profile compared with proprietary CE products. The primary aim was to investigate whether NFB following exercise and thermal dehydration to −2 % BM was enhanced by a metered rate of ingestion of M or CE compared with W. A secondary aim was to investigate whether the composition of the rehydration fluid was sufficient to affect a change in circulating pre-provasopressin (CTproAVP) – a novel biomarker of the potent antidiuretic arginine vasopressin (AVP) and signature of an augmented osmoregulatory response.
Methods
Subjects
All procedures were carried out in accordance with the ethical standards outlined in the most recent version of the Declaration of Helsinki, and procedures involving human subjects were approved by the Faculty of Education & Health Sciences Research Ethics Committee (EHSREC10/45), University of Limerick. Subjects were provided with full details of the study, and queries related to the study were addressed before a written statement of informed consent was obtained. Seven healthy men (age 26·2 (sd 6·1) years, height 1·79 (sd 0·08) m, BM 86·4 (sd 11·5) kg and body fat 21·4 (sd 4·5) %) volunteered to participate in the investigation. At the time of the study, all were engaged in regular physical activity (>3 h/week) but were not accustomed to exercise in a warm environment. Because of the nature of the investigation, those with known lactose intolerance were excluded.
Experimental protocol
All subjects attended two habituation and three experimental trials. In the 24 h preceding each trial, subjects were instructed to abstain from alcohol and strenuous physical activity. Subjects also recorded a weighed food and fluid intake and physical activity diary and were asked to replicate these patterns of dietary intake and physical activity before each subsequent trial. In the 24 h preceding the first trial, subjects provided a record of weighed food and fluid intake and a diary of physical activity. Subjects were instructed to repeat these behaviours before subsequent trials. All trials commenced in the morning, normally 07.00 hours, and followed a standardised protocol. On the evening preceding a trial day, subjects were instructed to fast from midnight and to consume 500 ml of water 1 h before arrival at the laboratory. On arrival, subjects completed a subjective feelings questionnaire and provided a urine and venous blood sample. Height, to the nearest 0·1 cm (Seca 213 Stadiometer; Seca), BM, to the nearest 0·1 kg, TBW (bioelectric impedance analysis; MC-180MA; Tanita UK Ltd) and body composition (dual energy X-ray absorptiometry; Lunar iDXATM; GE Healthcare) were measured during the first habituation trial. Measurement of BM and body water content was repeated on all subsequent trial days. At the second habituation trial, subjects completed a familiarisation session on a cycle ergometer (Monark Ergomedic 874E; Monark Exercise AB) to confirm the steady-state work rate to be undertaken during the dehydration phase of the three experimental trials. The experimental trials were randomised and separated by 7 d. The experimental trial proceeded as follows: after provision of a urine sample, an 18 G cannula was inserted into a superficial vein located at the antecubital fossa and a basal (resting) blood sample was drawn. Subjects then consumed a standardised breakfast comprising 40 g of cornflakes, full-fat milk (200 ml), a breakfast bar (37 g; Kellogg’s® Nutri-Grain®; Kellogg Company) and plain water (100 ml) 1 h before the dehydration phase. Further blood samples were drawn post exercise and at 1, 2, 3, 4 and 5 h of the rehydration phase.
Dehydration phase
Before entering an environmental chamber maintained at 30 (sd 1·1)°C and 58 (sd 8) % relative humidity, subjects voided their bladder and BM was measured. Subjects then undertook a continuous bout of cycle exercise for 50 min, towelled dry and reweighed. Subjects returned to the environmental chamber to continue exercise for 10-min intervals until a BM loss of approximately 1·8 % was achieved. Having showered, dried thoroughly and voided their bladder subjects were reweighed to determine total BM loss during the dehydration phase. Expired air was collected and analysed for the rate of VO2 and carbon dioxide production (VCO2) by indirect calorimetry (AMIS 2000; Innovision A/S) from which estimates of the rate of energy expenditure, carbohydrate and fat metabolism were calculated( Reference Frayn 24 ).
Rehydration phase
Rehydration commenced 25 min after the end of the dehydration phase and lasted for 5 h. For this phase, subjects remained seated in a laboratory (20·5 (sd 1·2)°C, 35 (sd 8) % relative humidity) and, other than the rehydration fluid, no food or drink was consumed. The rehydration fluid was randomly assigned and administered to subjects at room temperature (18–20°C). The composition of the rehydration fluids, that is, milk (0·1 % skimmed milk; Glanbia Consumer Foods Ireland Plc; trial M), CE (Powerade; Coca Cola Ltd; trial CE) and water (Centra; Musgrave Retail Partners Ireland; trial W), is provided in Table 1.
Energy density, osmolality, protein, carbohydrate and fat content, sodium and potassium concentration of the rehydration fluids (Mean values and standard deviations)
M, milk; CE, carbohydrate–electrolyte solution; W, water.
Subjects ingested a volume (litres) equivalent to 150 % of the BM loss (kg). Using a metered protocol, 1000 ml was provided to be ingested within the first 30 min and 500 ml every 30 min thereafter until the required volume of fluid was consumed. Subjects were allowed 15 min in which to consume each aliquot. All subjects completed the ingestion of the required volume of all fluids within the specified time. Subjects were instructed to empty their bladder as completely as possible at the end of each hour. The volume of urine provided was measured, and a 5 ml aliquot was retained for analysis. Any additional urine produced during the recovery period was collected and added to the bolus produced at the end of each hour. Subjective feelings relating to hydration (thirst, hunger, bloatedness, mouth taste, alertness, headache, tiredness and refreshment) were assessed by 100 mm visual analogue scales. Subjective responses for hydration were provided for the basal state, following the completion of the dehydration phase and at the end of each hour during the rehydration phase. Subjective responses relating to drink taste (visual appeal, palatability, aftertaste, sweetness and saltiness) were obtained for 2 h of the rehydration period.
Biochemical analysis
Whole-blood samples were analysed immediately after collection for Na and K concentration by ion-selective potentiometry (I-STAT®; Abbott Laboratories). Intra-assay CV using control solutions was <1 % for both Na and K. Inter-assay CV was <1·5 % for Na and <11 % for K, using baseline samples. Plasma and urine osmolality was measured by freezing-point depression (Advanced Micro-Osmometer Model 3220; Advanced Instruments Inc.). The intra-assay CV for Posm was 1·2 %. CTproAVP was measured in a single batch with a commercial sandwich immunoluminometric assay (B.R.A.H.M.S LUMItest CTproAVP; B.R.A.H.M.S AG). The lower detection limit of this assay was 0·4 pM, and the functional assay sensitivity (<20 % inter-assay CV) was <1 pM. The intra-assay CV was <10 %.
Statistical analysis
Unless stated otherwise, data are presented as means and standard deviations. Statistical analysis was performed within the Statistical Package for the Social Sciences (SPSS, 21.0; SPSS Inc.). Data were checked for normality of distribution by Shapiro–Wilk test. Data containing two independent factors were analysed by two-factor (time×trial) repeated-measures ANOVA. Variables containing one factor were analysed using a one-factor repeated-measures ANOVA. Bonferroni-adjusted paired sample Student’s t test was used to compare the means and locate significant differences. The 95 % level of confidence was the criterion of statistical difference (P<0·05). Where statistical significance marginally exceeded 0·05 the effect size, Cohen’s d was calculated to indicate the standardised difference between means. Friedman’s test and post hoc Wilcoxon’s signed-rank tests were used to compare differences between trials for non-parametric data relating to subjective responses rated by visual analogue scales.
Results
Basal hydration status
No difference was observed in basal BM, hydration status or blood electrolyte concentration for each trial (Table 2), indicating that the subjects complied fully with the prescribed pre-experimental protocol.
Body mass, total body water, blood and urine osmolality and electrolyte concentration at basal (Mean values and standard deviations)
M, milk; CE, carbohydrate–electrolyte solution; W, water.
* P values for the difference between groups analysed by univariate ANOVA.
Dehydration phase
The dehydration protocol achieved a BM loss of −1·84 (sd 0·28) kg (W), −1·86 (sd 0·37) kg (CE) and −1·82 (sd 0·28) kg (M), which did not differ between trials (P=0·84). This corresponded to −2·2 (sd 0·2) % (W), −2·2 (sd 0·2) % (CE) and −2·1 (sd 0·2) % (M) loss of the subjects’ basal BM. The duration of exercise required to achieve this was not different between trials (P=0·16): 94 (sd 17) min (W), 93 (sd 11) min (CE) and 101 (sd 16) min (M). Estimates of energy expenditure, carbohydrate and fat oxidation are provided in Table 3.
Estimate of energy expenditure, carbohydrate and fat oxidation during the exercise and dehydration phase (Mean values and standard deviations)
M, milk; CE, carbohydrate–electrolyte solution; W, water.
* P values for the difference between groups analysed by univariate ANOVA.
Rehydration phase
Aligned with the outcome of the dehydration phase, the volume of fluid ingested during the rehydration phase was not significantly different between trials (P=0·84); 2764 (sd 416) ml (W), 2796 (sd 556) ml (CE) and 2732 (sd 426) ml (M). Significantly lower mean hourly urine volume was observed in the rehydration phase in M compared with CE and W (time×trial, P=0·01), resulting in a lower cumulative urine volume in M compared with CE (P=0·013) and W (P=0·007) but no difference between CE and W (P=0·68) (Fig. 1(a)). At 5 h, total urine volume in M (794 (sd 99) ml) was lower than W (1429 (sd 131) ml) (P=0·018) but not CE (1314 (sd 164) ml) (P=0·057; d=1·7). Percentage fluid retention reflected these differences between trials: 71 (sd 4) % (M), 52 (sd 16) % (CE, P=0·048) and 47 (sd 15) % (W, P=0·014).
Urinary volume (a) and net fluid balance (b) over the course of the experimental trials. Values are means and standard deviations represented by vertical bars. * Value of milk (M) significantly different from carbohydrate–electrolyte solution (CE) and water (W) (P<0·05). † Value of M is significantly different from W (P<0·05). ![]() , Trial M;
, Trial M; ![]() , trial CE;
, trial CE; ![]() , trial W.
, trial W.
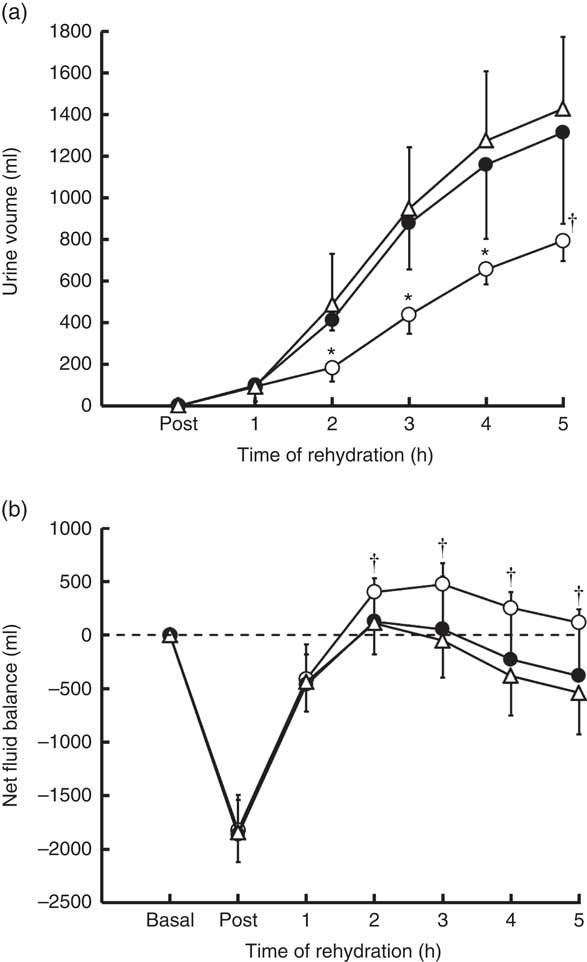
Whole-body NFB was calculated from the change in BM (reflecting the loss of fluid by sweating), fluid ingested and urine produced. No significant difference in NFB was observed between trials following dehydration (P=0·84), but a significant difference in the time course of change in NFB was observed between trials (time×trial, P=0·003) in the rehydration phase (Fig. 1(b)). A higher overall NFB was maintained throughout the rehydration phase in M than CE (P=0·001) and W (P=0·006), with no difference between CE and W (P=0·69). At 2 h into rehydration, NFB was positive compared with basal in M and significantly greater than CE (P=0·031) but not W (P=0·09, d=1·38). At 3 h, NFB remained positive in M and greater than W (P=0·019) but not CE (P=0·069, d=1·21), and this trend continued to 5 h, at which point NFB in M remained positive compared with basal and greater than W (P=0·011) but not CE (P=0·077, d=1·6).
Plasma osmolality and pre-provasopressin
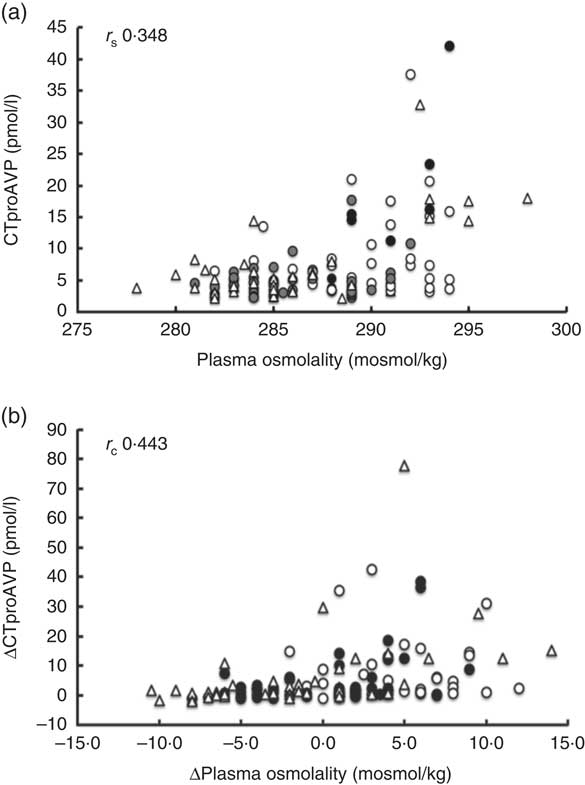
The relationship between plasma osmolality (Posm) and CTproAVP is reported in Fig. 2. Spearman’s rank correlation revealed a moderate, but statistically significant (P<0·0001), association between Posm and serum CTproAVP concentration (Fig. 2(a)) and between the change in CTproAVP induced by a change in Posm (Fig. 2(b)). A threshold of effect on serum CTproAVP is observed when Posm increased above approximately 290 mosmol/kg, which approximates to approximately 3 mosmol/kg increase in Posm from basal values.
Relationship between (a) plasma osmolality and pre-provasopressin (CTproAVP) concentration and (b) change in pre-provasopressin (∆CTproAVP) measured over the course of the experimental trials shown as scatter plots. r
s
, Spearman’s rank correlation coefficient (n 126); ![]() , trial milk;
, trial milk; ![]() , trial carbohydrate–electrolyte solution;
, trial carbohydrate–electrolyte solution; ![]() , trial water.
, trial water.
Posm was similar for all trials at basal (288 (sd 4·5) mosmol/kg, W; 287 (sd 3·2) mosmol/kg, CE; 288 (sd 3·4) mosmol/kg, M, P=0·33) and increased following dehydration, with no significant difference between trials (P=0·22) (online Supplementary Fig. S1(a)). A significant difference in the time course of change in Posm during rehydration was observed between trials (time×trial, P=0·003) (Fig. 3(a)), remaining elevated above basal levels in trial M compared with trial CE and W (P=0·001). At 1 h, Posm remained elevated above basal in M compared with CE (P=0·016) but not W (P=0·051, d=1·74); at 2 h, M was greater than CE (P=0·002) and W (P=0·002); at 3 h, M was greater that W (P=0·04) but not CE (P=0·052, d=1·13); at 4 h, M was greater than CE (P=0·046) and W (P=0·001) and CE was greater than W (P=·037). At the end of the 5-h rehydration period, Posm returned to within basal levels for M 288 (sd 3·9) mosmol/kg, CE 287 (sd 2·6) mosmol/kg and W 286 (sd 1·5) mosmol/kg, with no difference (P=0·13) between trials.
Change in plasma osmolality (∆Posm) (a) and serum pre-provasopressin (∆CTproAVP) (b) from basal values over the course of the experimental trials. Values are the means and standard deviations represented by vertical bars. * Value of milk (M) significantly different from carbohydrate–electrolyte solution (CE) and water (W) (P<0·05). † Value of M significantly different from W (P<0·05). ‡ Value of M significantly different from CE (P<0·05). § Value of CE significantly different from W (P<0·05). ![]() , Trial M;
, Trial M; ![]() , trial CE;
, trial CE; ![]() , trial W.
, trial W.
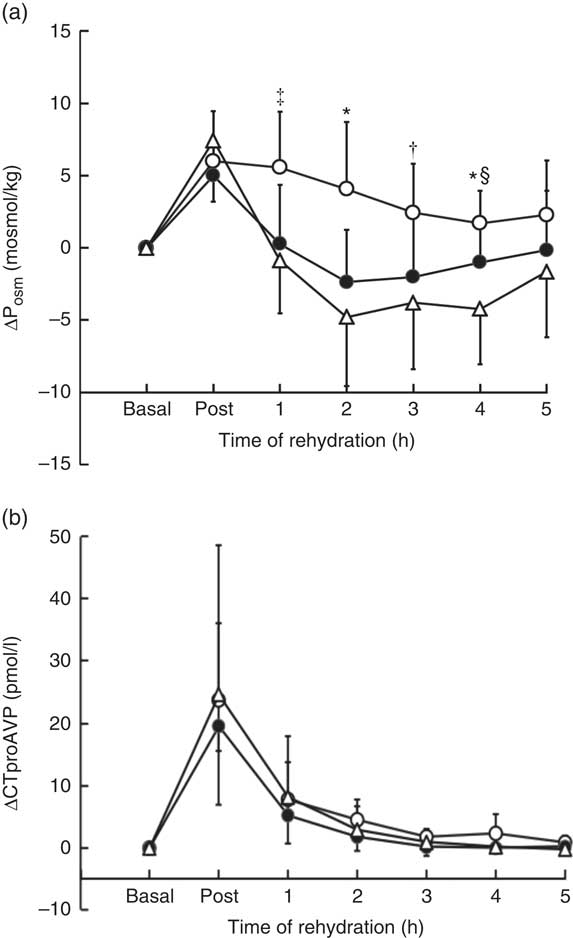
No significant difference in the time course of change in serum CTproAVP was observed between trials (time×treatment, P=0·96) (online Supplementary Fig. S1(b)). Serum CTproAVP was similar for all trials at basal (4·6 (sd 1·2) pmol/l, W; 4·3 (sd 1·6) pmol/l, CE; 4·1 (sd 1·8) pmol/l, M, P=0·73) and increased approximately 5-fold from basal in response to dehydration to 29·1 (sd 26·9) pmol/l (W), 23·8 (sd 13·5) pmol/l (CE) and 27·8 (sd 13·4) pmol/l (M) (P=0·72) (Fig. 3(b)). CTproAVP decreased during rehydration to values that were not significantly different from basal at 1 h (P>0·05), and remained unchanged thereafter.
Plasma electrolytes
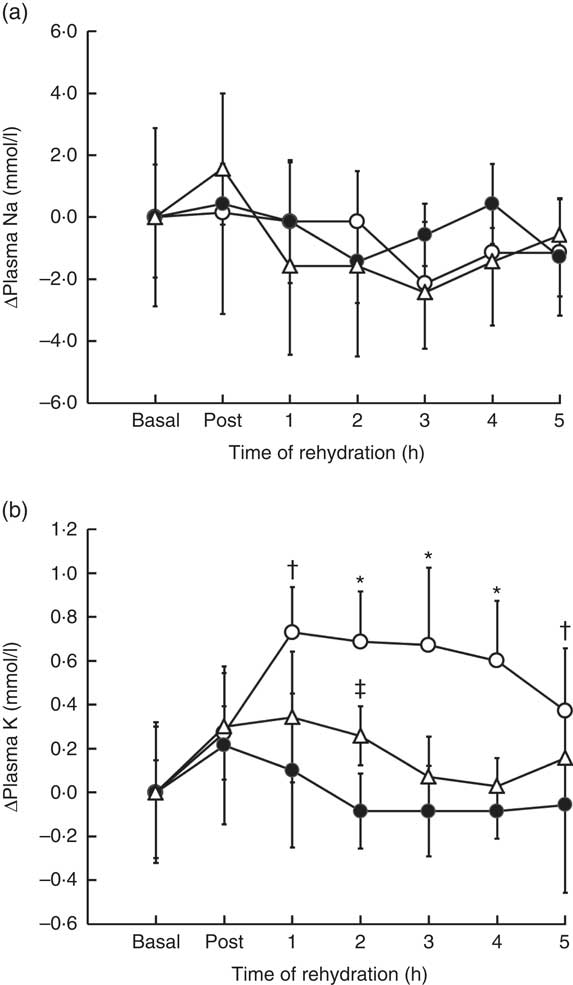
Plasma Na was similar for all trials at basal (140 (sd 2·0) mmol/l, W; 141 (sd 2·9) mmol/l, CE; 141 (sd 1·7) mmol/l, M, P=0·55), and no significant difference in plasma Na in response over the duration of the experiment was observed between trials (time×trial, P=0·22) (online Supplementary Fig. S2(a)) (Fig. 4(a)). Basal plasma K was similar for all trials (3·93 (sd 0·30) mmol/l, W; 3·96 (sd 0·32) mmol/l, CE; 3·91 (sd 0·15) mmol/l, M, P=0·95), increasing by 0·25 (sd 0·22) mmol/l following dehydration, with no significant difference in response between trials (P=0·71) (online Supplementary Fig. S2(a)). A significant difference in plasma K during rehydration was observed between trials (time×treatment; P<0·001), remaining elevated above basal for the 5-h rehydration period in M and greater than in trial CE (P=0·006) and W (P=0·008), with no difference in response between CE and W (P=0·11). At 1 h into rehydration, K remained significantly elevated above basal in M compared with CE (P=0·001) but not W (P=0·063, d=1·74); at 2 h, M was greater than CE (P=0·005) and W (P=0·021); at 3 h, M was greater than CE (P=0·024) and W (P=0·013); at 4 h, M was greater than CE (P=0·004) and W (P=0·022) and greater in M compared with CE (P=0·003) but not W (P=0·88) at 5 h (Fig. 4(b)).
Change in plasma sodium (a) and plasma potassium (b) from basal values over the course of the experimental trials. Values are the means and standard deviations represented by vertical bars. * Value of milk (M) significantly different from carbohydrate–electrolyte solution (CE) and water (W) (P<0·05). † Value of M significantly different from CE (P<0·05). ‡ Value of CE significantly different from W (P<0·05). ![]() , Trial M;
, Trial M; ![]() , trial CE;
, trial CE; ![]() , trial W.
, trial W.
Subjective feelings of hydration and drink acceptance
There was a marked increase in perceived thirst score immediately post exercise for all trials, although no overall difference in change in thirst perception scores was observed between test drinks during the rehydration period (P=0·53). Ingestion of a rehydration fluid reduced the feeling of thirst from a pooled mean of 81 (sd 6) to 45 (sd 4) mm and gradually returned to basal feelings of thirst by the end of the 5-h rehydration period for all three trials: M 51 (sd 26) mm (P=0·67); CE 50 (sd 24) mm (P=0·79); and W trials 51 (sd 27) mm (P=0·39). Participants scored mouth taste lowest in W trial (14 (sd 4) mm) compared with CE (35 (sd 13) mm) (P=0·034) and M (44 (sd 8) mm) (P=0·013). Perceived feeling of hunger differed between test drinks during rehydration (time×trial) (P=0·037), with a lower overall mean score in the M trial 51 (sd 9) mm compared with W 79 (sd 9) mm, and CE 66 (sd 14) mm. Similar perceived levels of bloatedness (P=0·15), alertness (P=0·28), tiredness (P=0·063), headache (P=0·16) and level of refreshment (P=0·06) were reported for all rehydration fluids. Subjective feelings associated with drink taste were analysed for the 2nd hour of fluid ingestion. There was no difference in perceived visual appeal (P=0·54), palatability (P=0·57) or aftertaste (P=0·06) between trials. There was a higher perceived sweetness for CE compared with M (P=0·048) and W (P=0·018). Perceived saltiness also scored highest in the CE trial – 29 (sd 28) mm compared with M 18 (sd 30) mm (P=0·046) and W 3 (sd 3) mm (P=0·028) trials, although overall scores were low across trials.
Energy and substrate intake in comparison with expenditure
A comparison of the total energy, carbohydrate and fat intake provided in the rehydration phase for M and CE is provided in Table 4. The mean total energy provision was approximately 2-fold greater for M than CE, the difference being less because of carbohydrate (approximately 40 % greater in M) than for the additional protein and fat provided in M. Relative to the mean estimates of energy expenditure, M provided 106 % of total energy, 82 % of total carbohydrate and 10 % of total fat oxidised during exercise. In comparison, CE provided 57 % of total energy and 73 % of total carbohydrate used during exercise.
Estimate of energy, carbohydrate and fat provided during the rehydration phase (Mean values and standard deviations)
M, milk; CE, carbohydrate–electrolyte solution.
* P values for the difference between groups analysed by paired sample t test.
Discussion
The purpose of a metered rate of fluid ingestion was to optimise the inter-related processes of gastric emptying, intestinal absorption and retention of the rehydration fluid. The rate of gastric emptying is related to rate of fluid ingestion that is modulated by the energy density and osmolality of the fluid, with energy density exerting a greater influence than osmolality( Reference Vist and Maughan 25 , Reference Calbet and MacLean 26 ). M contains approximately double the energy density compared with the CE, and rehydration studies using fluids containing milk protein confirm a slowing in the rate of gastric emptying and a delay in the rate of intestinal water absorption into the circulation( Reference Calbet and MacLean 26 ). Once fluid is absorbed and released into the circulation, the magnitude and time course of change in Posm is a key determinant of water retention. The loss of plasma volume and associated increase in Posm during dehydration was associated with a 5-fold increase in CTproAVP, a marker of the antidiuretic hormone AVP. CTproAVP is produced during synthesis of mature AVP in a 1:1 ratio as a stable peptide, sensitive to measurement by specific immunoassay and representative of the antidiuretic effect of AVP( Reference Balanescu, Kopp and Gaskill 27 ). Analysed over all samples and all time points, a highly significant association between Posm and CTproAVP (r s 0·348; P<0·001) was observed. The mean increase in CTproAVP across all trials in response to exercise and thermal-induced dehydration was 5-fold the basal level but, as shown in Fig. 2, plasma CTproAVP concentration at a given osmolality varied widely between individuals, particularly at osmolalities above 287 mosmol/kg, and highlights the polygenetic variability of this response( Reference Cheuvront, Kenefick and Charkoudian 28 , Reference Zerbe, Miller and Robertson 29 ). However, despite the continued elevation in Posm in the early phase of rehydration in M, CTproAVP returned to basal levels within 1 h of rehydration in all trials.
An increase in AVP is predicted to promote a compensatory change in renal water conservation and decrease in water excretion subsequently potentiated by ingestion of the rehydration fluid. Ingestion of W caused the largest decrease in Posm (approximately 12 mosmol/l) from 295 (sd 2·2 mosmol/l) following dehydration to 283 (sd 2·9) mosmol/l at 2 h rehydration. The response to ingestion of CE did not differ significantly from W, but the outcome in M was to maintain an elevated Posm of +5 mosmol/l during the early phase of rehydration (Fig. 3). The maintenance of an elevated Posm in M might be predicted by the protein content in M, the higher energy density resulting in a decrease in the rate of gastric emptying( Reference Calbet and MacLean 26 ). In addition, the protein in M could augment the osmotic/oncotic pressure via an increase in plasma albumin and/or post ingestion increase in plasma amino acid concentration( Reference James, Clayton and Evans 19 , Reference James, Mattin and Aldiss 21 ). Plasma albumin is the major contributor to oncotic pressure that trends towards an increase over time when milk-based proteins are added to a carbohydrate beverage( Reference Hobson and James 30 ). On the basis of pilot data (unpublished results), total free amino acid concentration following ingestion of M or CE increases approximately 500 µmol/l in M and decreases approximately 400 µmol/l in CE, 1 h post ingestion. Acting independently, the change in plasma albumin and amino acid concentration of this magnitude may be too low to alter serum osmolality, but could act in synergy to augment NFB.
Analysed across all trials, no effect of the experimental protocol on plasma Na was observed (online Supplementary Fig. S2(a). Considering the strong influence that Na and chloride, its principal anion, exerts on Posm, these data are perplexing, possibly reflecting the relative imprecision offered by the point-of-care platform of measurement. In contrast, a significant increase in plasma K was observed over the rehydration phase in M (online Supplementary Fig. S2(b)). The maintenance of plasma K in M relative to CE and W could have contributed to water retention via its effect on the renin–angiotensin–aldosterone axis. Controlled infusion of potassium chloride results in an increase in circulating aldosterone; the response is most sensitive to an increase in plasma K within a range of 0·1–0·5 mmol/l( Reference Himathongkam, Dluhy and Williams 31 ) – that is, of comparable magnitude to that observed in the present study.
The main considerations for an athlete in recovery from exercise are the replacement of fluid and electrolytes lost in sweat, repletion of body energy reserves, principally muscle and liver glycogen, and the provision of nutrient support to the regeneration or adaptation of skeletal muscle( Reference Thomas, Erdman and Burke 32 ). In recovery, M provided 106 % of total energy and 82 % of total carbohydrate oxidised during exercise compared with 57 % of total energy and 73 % of total carbohydrate provided by CE. The recommended intake of carbohydrate in recovery is 1·0–1·2 g/kg per h to be consumed at frequent intervals during the first 4–6 h post exercise( Reference Thomas, Erdman and Burke 32 ). The mean intake for M (1·6 g/kg per 5 h) was higher than CE (1·3 g/kg per 5 h), but both rehydration solutions fell short of the recommended recovery rate for carbohydrate intake. Although protein intake in recovery may enhance glycogen resynthesis, particularly in the early (0–2 h) phase or when the carbohydrate intake is sub-optimal( Reference Ivy, Goforth and Damon 33 ), the primary effect of adding protein to a recovery fluid, particularly when consumed in close proximity to exercise, would be to stimulate skeletal muscle protein synthesis (MPS)( Reference Tipton, Rasmussen and Miller 34 ). The mean protein intake in M was 90 g, equivalent to 1·1 g/kg BM, and greater than the recommended intake of protein to stimulate MPS post exercise( Reference Thomas, Erdman and Burke 32 ). Furthermore, the EAA composition of milk proteins approximates to 50 %. EAA, particularly leucine, are the main nutrient regulators of MPS, which lends support to the use of milk protein as a natural and effective source of protein for recovery( Reference Tipton, Elliott and Cree 35 ). However, in practice, an athlete would probably use a recovery beverage as a supplement to habitual dietary intake, and the present investigation did not address the effect of habitual dietary intake in combination with a recovery beverage, and it is probable that solid food and beverage intake would influence the temporal pattern of restoration of body NFB( Reference Maughan, Leiper and Shirreffs 36 ). However, when time between exercise bouts is short (<6 h), the potential for gastrointestinal disturbance in the following training session is an important consideration in the recovery plan and a liquid recovery strategy may be more acceptable.
Finally, gastrointestinal disturbance is a relevant consideration during recovery post exercise, particularly when large volumes of nutrient-dense fluids, such as M, are consumed. Although published evidence is lacking( Reference Wong, Williams and Simpson 37 ), a metered rate of fluid ingestion is considered to reflect, more closely, ad libitum drinking patterns, avoiding over-distension of the stomach and potential for negative gastrointestinal effects, such as bloatedness. Subjects were screened for lactose intolerance, as those with lactose intolerance generally can only tolerate relatively small dose of lactose approximately 12 g (approximately 200 ml of milk)( 38 ). However, large lactose loads can result in gastrointestinal disturbances such as bloating and diarrhoea that may be further exacerbated in those with undiagnosed lactase deficiency. Possibly reflecting the lower rate of lactose load, the subjective feeling of bloatedness post ingestion of milk in the first 2 h of rehydration in this study scored relatively low (≤34 mm) compared with previous studies using a non-metered approach( Reference Kasperek and Snider 5 ).
In conclusion, it was possible to demonstrate a significant advantage in the restoration of body NFB over a 5-h period following exercise and thermal dehydration to −2%BM by a metered replacement of M compared with CE or W. Consumed as the sole recovery diet, neither M nor CE provided optimal nutrition for recovery. However, the protein component of M, essentially absent in CE and W, may further enhance glycogen resynthesis and promote MPS. In addition, the minerals (Ca, P, Zn, I) and vitamins (A, E, B group vitamins) in M that are not present in CE contribute to micro-nutrient requirements of the athlete.
Acknowledgements
The authors would like to thank Gavin Connolly, Alexandra Cremona, Katie Hughes, Robert Davies and Beate Gilson for their assistance in the data collection and the subjects for providing their time and commitment to the project.
This work was supported by the National Dairy Council, Ireland. The National Dairy Council, Ireland had no role in the design, analysis or writing of this article.
S. S. and P. J. conceived the study design. S. S. conducted the study and managed the data collection. S. S. and P. J. undertook the data analysis and co-authored the manuscript.
Supported by National Dairy Council Research Scholarship to S. S.
Supplementary Material
For supplementary material/s referred to in this article, please visit http://dx.doi.org/10.1017/S0007114516002907


