


Introduction
The coronavirus disease 2019 (COVID-19) outbreak constituted a global public health emergency that introduced numerous psychosocial challenges, such as social isolation, health concerns, widened social inequalities, and uncertainty about the future (Gruber et al., Reference Gruber, Prinstein, Clark, Rottenberg, Abramowitz, Albano, Aldao, Borelli, Chung, Davila, Forbes, Gee, Hall, Hallion, Hinshaw, Hofmann, Hollon, Joormann, Kazdin and Weinstock2021). This time of multidimensional stress coincided with a global increase in depressive and anxiety disorders during early stages of the COVID-19 pandemic (Hampshire et al., Reference Hampshire, Hellyer, Soreq, Mehta, Ioannidis, Trender, Grant and Chamberlain2021), with some studies identifying young people as being disproportionately affected (Pierce et al., Reference Pierce, Hope, Ford, Hatch, Hotopf, John, Kontopantelis, Webb, Wessely, McManus and Abel2020; Santomauro et al., Reference Santomauro, Mantilla Herrera, Shadid, Zheng, Ashbaugh, Pigott, Abbafati, Adolph, Amlag, Aravkin, Bang-Jensen, Bertolacci, Bloom, Castellano, Castro, Chakrabarti, Chattopadhyay, Cogen, Collins and Ferrari2021; Xiong et al., Reference Xiong, Lipsitz, Nasri, Lui, Gill, Phan, Chen-Li, Iacobucci, Ho, Majeed and McIntyre2020). Adolescence and early adulthood are sensitive developmental periods for the emergence of mental health problems (McGrath et al., Reference McGrath, Al-Hamzawi, Alonso, Altwaijri, Andrade, Bromet, Bruffaerts, de Almeida, Chardoul, Chiu, Degenhardt, Demler, Ferry, Gureje, Haro, Karam, Karam, Khaled and Kovess-Masfety2023; Solmi et al., Reference Solmi, Radua, Olivola, Croce, Soardo, Salazar de Pablo, Il Shin, Kirkbride, Jones, Kim, Kim, Carvalho, Seeman, Correll and Fusar-Poli2022) and having a history of childhood adversity (CA; such as child abuse or neglect) is known to potentiate that vulnerability (Kessler et al., Reference Kessler, McLaughlin, Green, Gruber, Sampson, Zaslavsky, Aguilar-Gaxiola, Alhamzawi, Alonso, Angermeyer, Benjet, Bromet, Chatterji, de Girolamo, Demyttenaere, Fayyad, Florescu, Gal, Gureje and Williams2010; McLaughlin et al., Reference McLaughlin, Greif Green, Gruber, Sampson, Zaslavsky and Kessler2012). Recent longitudinal findings suggest that the COVID-19 outbreak may have exacerbated mental health problems in young people with CA (Stinson et al., Reference Stinson, Sullivan, Peteet, Tapert, Baker, Breslin, Dick, Gonzalez, Guillaume, Marshall, McCabe, Pelham, Van Rinsveld, Sheth, Sowell, Wade, Wallace and Lisdahl2021). Therefore, investigating the impact of the COVID-19 pandemic on the mental health of young people with CA and identifying protective factors that can mitigate mental health problems is essential for informing targeted psychosocial interventions aimed at boosting resilience in vulnerable young people.
The global prevalence of exposure to CA is estimated at around 50% (Bellis et al., Reference Bellis, Hughes, Leckenby, Perkins and Lowey2014; Green et al., Reference Green, McLaughlin, Berglund, Gruber, Sampson, Zaslavsky and Kessler2010). This includes stressful experiences like abuse, neglect, bullying, or severe poverty, and generally represents a deviation from the “expectable” childhood environment (McLaughlin, Reference McLaughlin2016). Chronic and repeated exposure to psychosocial stressors require young people to adapt their neurobiological, psychological, and social functioning, ultimately increasing the risk for later-life mental health problems (Cicchetti & Valentino, Reference Cicchetti, Valentino and Cicchetti2006; Clark et al., Reference Clark, Caldwell, Power and Stansfeld2010; Danese & McEwen, Reference Danese and McEwen2012; Kessler et al., Reference Kessler, McLaughlin, Green, Gruber, Sampson, Zaslavsky, Aguilar-Gaxiola, Alhamzawi, Alonso, Angermeyer, Benjet, Bromet, Chatterji, de Girolamo, Demyttenaere, Fayyad, Florescu, Gal, Gureje and Williams2010; Lupien et al., Reference Lupien, McEwen, Gunnar and Heim2009). Stress is typically perceived when environmental demands outweigh an individual’s ability to effectively cope with those demands (Lazarus & Folkman, Reference Lazarus and Folkman1984; Monroe, Reference Monroe2008). In turn, perceived stress is thought to influence the pathogenesis of mental health problems by eliciting negative affective states (e.g., feelings of depression and anxiety), which then exert direct effects on physiological processes or behavioral patterns that influence susceptibility to prolonged mental disorders (Cohen et al., Reference Cohen, Janicki-Deverts and Miller2007). For example, CA has been associated with hypersensitive threat processing on both a neurobiological (e.g., heightened activity of the hypothalamus-pituitary-adrenal (HPA) axis; (Hein & Monk, Reference Hein and Monk2017; McCrory et al., Reference McCrory, De Brito, Sebastian, Mechelli, Bird, Kelly and Viding2011; Moreno-López et al., Reference Moreno-López, Ioannidis, Askelund, Smith, Schueler and van Harmelen2020)) and psychosocial level (e.g., over-attribution of threat-related cues; (Lee & Hoaken, Reference Lee and Hoaken2007)). This hypervigilance to threat-related cues may be adaptive in the short-term to support survival in dangerous and stressful environments (e.g., maltreatment), but can impair social functioning in the long-term through a compromised ability to negotiate interpersonal challenges (e.g., hostile attributional bias) (McCrory et al., Reference McCrory, Ogle, Gerin and Viding2019). The social transactional model of mental health vulnerability (McCrory et al., Reference McCrory, Foulkes and Viding2022) posits that such neurocognitive adaptations following CA can inadvertently generate a social environment characterized by more stressful interpersonal experiences (i.e., stress generation; (McCrory et al., Reference McCrory, Ogle, Gerin and Viding2019)) and fewer protective social relationships (i.e., social thinning; (Nevard et al., Reference Nevard, Green, Bell, Gellatly, Brooks and Bee2021; Sheikh et al., Reference Sheikh, Abelsen and Olsen2016)), consequently increasing mental health problems.
The COVID-19 pandemic was marked by numerous stress-inducing experiences such as risk of serious illness or death. Longitudinal studies in young people without CA from diverse cultural contexts, consistently reported a link between pandemic-related stress exposure and increased levels of mental health problems, specifically depression and anxiety symptoms (Hawes et al., Reference Hawes, Szenczy, Klein, Hajcak and Nelson2022; Kauhanen et al., Reference Kauhanen, Wan Mohd Yunus, Lempinen, Peltonen, Gyllenberg, Mishina, Gilbert, Bastola, Brown and Sourander2023; Santomauro et al., Reference Santomauro, Mantilla Herrera, Shadid, Zheng, Ashbaugh, Pigott, Abbafati, Adolph, Amlag, Aravkin, Bang-Jensen, Bertolacci, Bloom, Castellano, Castro, Chakrabarti, Chattopadhyay, Cogen, Collins and Ferrari2021; Xiong et al., Reference Xiong, Lipsitz, Nasri, Lui, Gill, Phan, Chen-Li, Iacobucci, Ho, Majeed and McIntyre2020). In addition, the pandemic led to various socioeconomic restructuring (e.g., university closures, lack of access to private space), which predicted concurrent eating disorder psychopathology in young people, even after adjusting for baseline CA (Ioannidis et al., Reference Ioannidis, Hook, Wiedemann, Bhatti, Czabanowska, Roman-Urrestarazu, Grant, Goodyer, Fonagy, Bullmore, Jones and Chamberlain2022). The stress sensitization hypothesis postulates that CA exposure is associated with a lower stress threshold in response to additional stressors encountered later in life, particularly during adolescence, which can give rise to mental health problems (Hammen et al., Reference Hammen, Henry and Daley2000; Hammen, Reference Hammen2015; La Rocque et al., Reference La Rocque, Harkness and Bagby2014). In line with that hypothesis, studies conducted during the COVID-19 pandemic have observed that young people with more severe CA were more likely to report elevated depression and anxiety symptoms (Doom et al., Reference Doom, Seok, Narayan and Fox2021; Gotlib et al., Reference Gotlib, Borchers, Chahal, Gifuni, Teresi and Ho2020; Guo et al., Reference Guo, Fu, Liu, Zhang, Wang and van IJzendoorn2020; Kalia et al., Reference Kalia, Knauft and Hayatbini2020; Stinson et al., Reference Stinson, Sullivan, Peteet, Tapert, Baker, Breslin, Dick, Gonzalez, Guillaume, Marshall, McCabe, Pelham, Van Rinsveld, Sheth, Sowell, Wade, Wallace and Lisdahl2021). Moreover, Achterberg et al. (Reference Achterberg, Dobbelaar, Boer and Crone2021) and Gotlib et al. (Reference Gotlib, Borchers, Chahal, Gifuni, Teresi and Ho2020) identified perceived stress as a potential mechanism linking challenging pre-pandemic experiences, such as CA or psychopathology, with elevated internalizing and externalizing behavior during the first two months of the COVID-19 pandemic. However, the number of studies investigating pandemic-related mental health vulnerability in young people with CA is limited and requires further examination.
Although having a history of CA is associated with a higher risk of later-life mental health problems, a substantial proportion of individuals are able to maintain or regain mental health despite exposure to CA (Ioannidis et al., Reference Ioannidis, Askelund, Kievit and van Harmelen2020; Kalisch et al., Reference Kalisch, Baker, Basten, Boks, Bonanno, Brummelman, Chmitorz, Fernàndez, Fiebach, Galatzer-Levy, Geuze, Groppa, Helmreich, Hendler, Hermans, Jovanovic, Kubiak, Lieb, Lutz and Kleim2017). Research conducted before the COVID-19 pandemic has shown that social support, particularly perceived friendship support, is a potent stress buffer capable of protecting young people with CA against the emergence and progression of mental health problems (König et al., Reference König, Berhe, Ioannidis, Orellana, Davidson, Kaser, Moreno-López and van Harmelen2023; van Harmelen et al., Reference van Harmelen, Blakemore, Goodyer and Kievit2021, Reference van Harmelen, Gibson, St Clair, Owens, Brodbeck, Dunn, Lewis, Croudace, Jones, Kievit and Goodyer2016). The availability of social support has also proven to buffer against the emergence of mental health problems following later-life stress exposure such as natural disasters or terrorist attacks (Bonanno et al., Reference Bonanno, Galea, Bucciarelli and Vlahov2007, Reference Bonanno, Westphal and Mancini2011). Despite growing evidence that the COVID-19 pandemic had a disproportionate impact on the mental health of young people with CA, compared to those without CA (Gotlib et al., Reference Gotlib, Borchers, Chahal, Gifuni, Teresi and Ho2020; Kalia et al., Reference Kalia, Knauft and Hayatbini2020), few studies have investigated social buffering effects on mental health symptoms during the pandemic in young people with CA (McLaughlin et al., Reference McLaughlin, Rosen, Kasparek and Rodman2022) and most studies lacked access to pre-pandemic baseline measures (Kauhanen et al., Reference Kauhanen, Wan Mohd Yunus, Lempinen, Peltonen, Gyllenberg, Mishina, Gilbert, Bastola, Brown and Sourander2023). Studies involving young people without CA have shown that those with higher levels of perceived social support, particularly friendship support, reported lower levels of depression and anxiety symptoms during the COVID-19 pandemic (Özmete & Pak, Reference Özmete and Pak2020; Grey et al., Reference Grey, Arora, Thomas, Saneh, Tohme and Abi-Habib2020; Bernasco et al., Reference Bernasco, Nelemans, van der Graaff and Branje2021; Houghton et al., Reference Houghton, Kyron, Hunter, Lawrence, Hattie, Carroll and Zadow2022; Juvonen et al., Reference Juvonen, Lessard, Kline and Graham2022; Magson et al., Reference Magson, Freeman, Rapee, Richardson, Oar and Fardouly2021). Furthermore, those who felt virtually more connected with their friends during national lockdowns also reported lower levels of depression and anxiety symptoms (Ellis et al., Reference Ellis, Dumas and Forbes2020; Magson et al., Reference Magson, Freeman, Rapee, Richardson, Oar and Fardouly2021; McKinlay et al., Reference McKinlay, May, Dawes, Fancourt and Burton2022). In fact, not being able to see their friends was the greatest concern of young people during the first pandemic-related lockdown in Australia (Magson et al., Reference Magson, Freeman, Rapee, Richardson, Oar and Fardouly2021). This concern was rated as most distressing over and above health concerns, disruptions to daily routines, and educational worries.
The Resilience after COVID-19 Threat (REACT) study offers the rare opportunity to investigate friendship buffering effects on mental health symptoms before and at three timepoints during the COVID-19 pandemic in 102 young people (aged 16-26) with retrospectively self-reported low to moderate CA (Smith et al., Reference Smith, Moreno-López, Davidson, Dauvermann, Orellana, Soneson, Ioannidis, Kaser and van Harmelen2021). Specifically, young people were assessed pre-pandemic (August 2019 to March 2020), during the first national lockdown in the UK (April to May 2020), during phased reopening (July to August 2020), and leading up to and during the second lockdown (October to November 2020). Prior to the pandemic, we have investigated the same sample of young people with CA and observed an association between greater perceived friendship quality and better mental health (König et al., Reference König, Berhe, Ioannidis, Orellana, Davidson, Kaser, Moreno-López and van Harmelen2023). In addition, we found that in a representative MRI sub-sample (n = 62), high-quality friendships may aid hippocampal stress responsivity in those with threat experiences. Building on these findings, we first investigated the impact of the COVID-19 pandemic on psychosocial functioning. Specifically, we hypothesized that in response to the COVID-19 outbreak, young people with CA would report an overall increase in depression and anxiety symptoms (Hawes et al., Reference Hawes, Szenczy, Klein, Hajcak and Nelson2022; Kauhanen et al., Reference Kauhanen, Wan Mohd Yunus, Lempinen, Peltonen, Gyllenberg, Mishina, Gilbert, Bastola, Brown and Sourander2023; Santomauro et al., Reference Santomauro, Mantilla Herrera, Shadid, Zheng, Ashbaugh, Pigott, Abbafati, Adolph, Amlag, Aravkin, Bang-Jensen, Bertolacci, Bloom, Castellano, Castro, Chakrabarti, Chattopadhyay, Cogen, Collins and Ferrari2021; Xiong et al., Reference Xiong, Lipsitz, Nasri, Lui, Gill, Phan, Chen-Li, Iacobucci, Ho, Majeed and McIntyre2020; hypothesis 1.1) as well as a reduction in perceived friendship quality (Bernasco et al., Reference Bernasco, Nelemans, van der Graaff and Branje2021; Magson et al., Reference Magson, Freeman, Rapee, Richardson, Oar and Fardouly2021; hypothesis 1.2). In addition, we expected these trends to be exacerbated during lockdown periods given that research by Pedersen et al. (Reference Pedersen, Andersen, Clotworthy, Jensen, Strandberg-Larsen, Rod and Varga2022) has shown poorer mental health outcomes in response to lockdowns and improved outcomes related to reopening phases. Second, we investigated CA exposure as a risk factor for poorer psychosocial outcomes during the COVID-19 pandemic. Specifically, we hypothesized that during the COVID-19 pandemic more severe CA would be associated with worse depression and anxiety symptoms (Gotlib et al., Reference Gotlib, Borchers, Chahal, Gifuni, Teresi and Ho2020; Kalia et al., Reference Kalia, Knauft and Hayatbini2020; hypothesis 2.1) as well as lower levels of perceived friendship quality (McCrory et al., Reference McCrory, Foulkes and Viding2022; Nevard et al., Reference Nevard, Green, Bell, Gellatly, Brooks and Bee2021; Sheikh et al., Reference Sheikh, Abelsen and Olsen2016; hypothesis 2.2). Third, we investigated whether any friendship buffering effect observed before the COVID-19 pandemic would also extend into the COVID-19 pandemic. Specifically, we hypothesized that higher friendship quality would be associated with lower depression and anxiety symptoms before and during the COVID-19 pandemic (Özmete & Pak, Reference Özmete and Pak2020; Bernasco et al., Reference Bernasco, Nelemans, van der Graaff and Branje2021; Houghton et al., Reference Houghton, Kyron, Hunter, Lawrence, Hattie, Carroll and Zadow2022; Juvonen et al., Reference Juvonen, Lessard, Kline and Graham2022; König et al., Reference König, Berhe, Ioannidis, Orellana, Davidson, Kaser, Moreno-López and van Harmelen2023; Magson et al., Reference Magson, Freeman, Rapee, Richardson, Oar and Fardouly2021; hypothesis 3). Finally, we explored the role of perceived stress during the COVID-19 pandemic as a potential mechanism linking pre-pandemic friendship quality with mental health symptoms during the COVID-19 pandemic (Achterberg et al., Reference Achterberg, Dobbelaar, Boer and Crone2021; Gotlib et al., Reference Gotlib, Borchers, Chahal, Gifuni, Teresi and Ho2020).
Methods
Study description
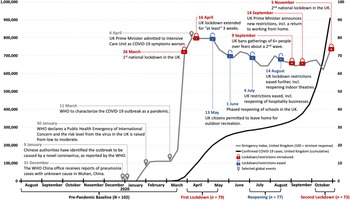
The REACT study (Smith et al., Reference Smith, Moreno-López, Davidson, Dauvermann, Orellana, Soneson, Ioannidis, Kaser and van Harmelen2021) builds on the Resilience after Individual Stress Exposure (RAISE) study, a UK multilevel study of young people aged 16-26 with retrospectively self-reported CA. The RAISE study commenced in August 2019 and was terminated prematurely in March 2020 due to a pandemic-related university-wide closure of laboratory research activities (Moreno-López et al., Reference Moreno-López, Sallie, Ioannidis, Kaser, Schueler, Askelund, Turner and van Harmelen2021). For the REACT study, we contacted all RAISE participants (N = 102, M age = 22.24, 64.7% female) who had previously provided consent at the pre-pandemic baseline to be recontacted for future studies. This study utilized data collected at four online assessment timepoints. The pre-pandemic baseline took place between August 2019 and March 2020. The first follow-up assessment occurred from April to May 2020, during the first national lockdown in the UK (first lockdown: n = 79). The second follow-up assessment occurred from July to August 2020, a period of eased restrictions (reopening: n = 77). The final follow-up assessment occurred from October to November 2020, a second phase of increased pandemic-related restrictions (second lockdown: n = 73) (Figure 1). All participants provided informed consent for both the RAISE and REACT studies. Comprehensive study protocols for both the RAISE study (Moreno-López et al., Reference Moreno-López, Sallie, Ioannidis, Kaser, Schueler, Askelund, Turner and van Harmelen2021) and the REACT study (Smith et al., Reference Smith, Moreno-López, Davidson, Dauvermann, Orellana, Soneson, Ioannidis, Kaser and van Harmelen2021) have been previously published. Participants were recruited across Cambridgeshire, UK from the general population through flyers and via social media as well as from previous studies conducted at the Department of Psychiatry, University of Cambridge (NSPN 2400 Cohort; Kiddle et al., Reference Kiddle, Inkster, Prabhu, Moutoussis, Whitaker, Bullmore, Dolan, Fonagy, Goodyer and Jones2018). The RAISE study received funding from the Royal Society in January 2018 and ethical approval from the National Research Ethics Service and the NRES Committee East of England-Cambridge Central (REC reference: 18/EE/0388, IRAS project ID: 241765) in February 2019. The REACT study was approved to be funded by the same grants and received ethical approval from the Cambridge Psychology Research Ethics Committee (PRE.2020.037).
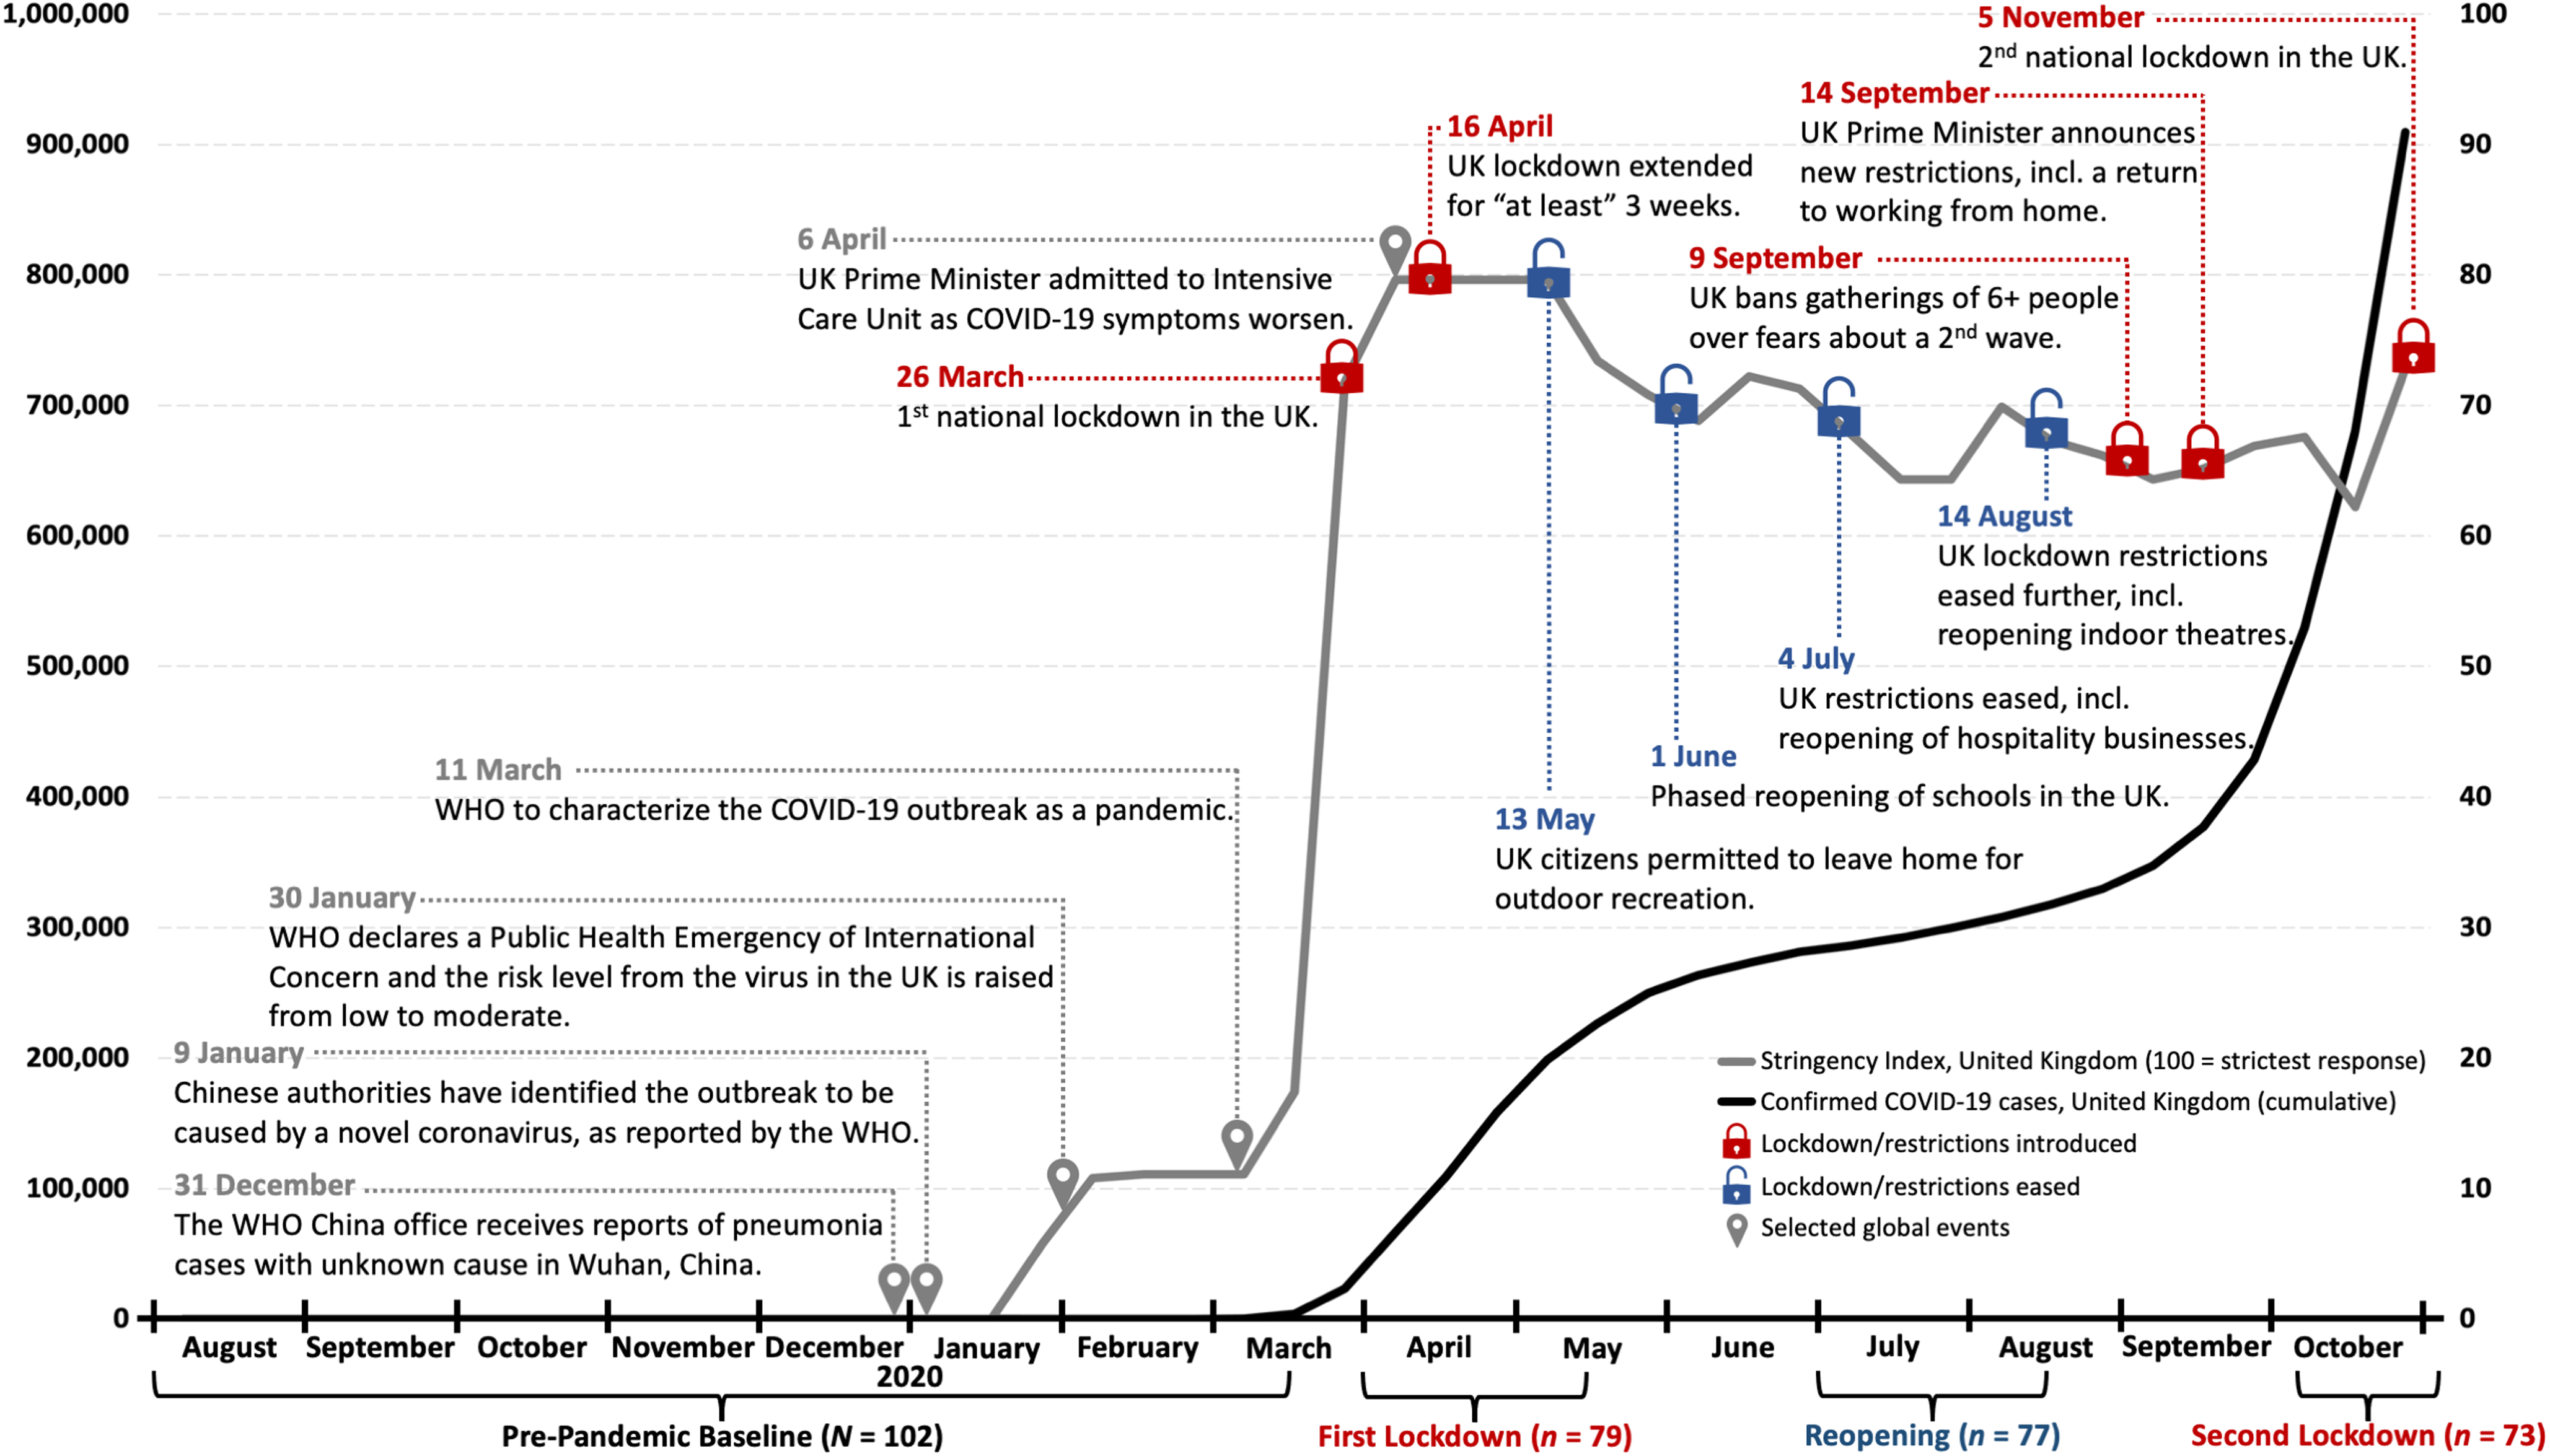
Study assessment timepoints and UK COVID-19 cases and restrictions from August 2019 to November 2020. Note. The stringency index is a composite measure comprised of nine metrics including school and workplace closures, cancelation of public events, and travel bans. A higher stringency index indicates stricter UK government policies. Data related to the UK stringency index and confirmed COVID-19 cases has been retrieved from the Oxford COVID-19 Government Response Tracker (Hale et al., Reference Hale, Angrist, Goldszmidt, Kira, Petherick, Phillips, Webster, Cameron-Blake, Hallas, Majumdar and Tatlow2021). In addition, information about selected UK COVID-19 restrictions and developments has been retrieved from the (Institute for Government, 2022) and the British Foreign Policy Group (Aspinall, Reference Aspinall2020).
Participants
Individuals were eligible to participate if they were aged between 16–26 years, able to speak, write, and understand English, and self-reported CA before the age of 16. Eligibility criteria were assessed via telephone before the pre-pandemic baseline by a trained member of the study team. Participants received a total of £100 upon completion of all four study phases. Specifically, participants received £10 for the completion of the pre-pandemic baseline assessments and £30 for the completion of each follow-up assessment. A dropout analysis using two-sample t-tests compared characteristics between the second lockdown sample and the participants (n = 29) who dropped out before that assessment timepoint, indicating that attrition was random and not influenced by specific sample characteristics (e.g., age, gender identity, CA experiences, or friendship quality; supplementary Table S1).
Measures
At all assessment timepoints, participants received an email with a secure online link to remotely complete self-report questionnaires. All questionnaires (incl. instructions and items) were carefully selected to ensure accessibility and age-appropriateness for our entire sample, which ranged in age from 16 to 26 (Demkowicz et al., Reference Demkowicz, Richie, Ashworth, Tait, Miles, Panayiotou, Patalay, Burrell and Deighton2021). Only the measures relevant for the current study are reported below (supplementary Tables S1), for a complete list of measures please see Moreno-López et al. (Reference Moreno-López, Sallie, Ioannidis, Kaser, Schueler, Askelund, Turner and van Harmelen2021) and Smith et al. (Reference Smith, Moreno-López, Davidson, Dauvermann, Orellana, Soneson, Ioannidis, Kaser and van Harmelen2021).
Mental health
The Mood and Feelings Questionnaire (MFQ; Angold & Costello, Reference Angold and Costello1987) was used to assess current (i.e., past two weeks) depression symptoms. At each assessment timepoint, participants rated 33 items such as “I felt miserable or unhappy” on a 4-point Likert scale (1 = never, 4 = always). Positive items were reverse coded so that higher scores indicate more depression symptoms. Internal consistency for the total scale was excellent across all assessment timepoints (pre-pandemic baseline: α = .94, first lockdown: α = .93, reopening: α = .95, second lockdown: α = .95).
The Revised Children’s Manifest Anxiety Scale (RCMAS; Reynolds & Richmond, Reference Reynolds and Richmond1978) was used to assess current (i.e., past two weeks) anxiety symptoms. At each assessment timepoint, participants rated items such as “I worried a lot of the time” on a 4-point Likert scale (1 = never, 4 = always). Positive items were reverse coded so that higher scores indicate more anxiety symptoms. This 28-item screening measure comprises three subscales (physiological anxiety, worry/oversensitivity, social concerns/concentration), which were combined to estimate the total severity of anxiety symptoms. Internal consistency for the total scale was excellent across all assessment timepoints (pre-pandemic baseline: α = .94, first lockdown: α = .95, reopening: α = .95, second lockdown: α = .95).
Perceived friendship quality
The Cambridge Friendship Questionnaire (CFQ; van Harmelen et al., Reference van Harmelen, Kievit, Ioannidis, Neufeld, Jones, Bullmore, Dolan, Fonagy and Goodyer2017) was used to assess the self-reported number, availability, and quality of current friendships. At each assessment timepoint, participants rated items such as “Do you feel that your friends understand you?”. Negative items were reverse coded so that higher scores indicate greater perceived friendship quality. As previously detailed (König et al., Reference König, Berhe, Ioannidis, Orellana, Davidson, Kaser, Moreno-López and van Harmelen2023), an exploratory factor analysis conducted on the 8-items of the CFQ revealed low factor loading (< .40; Stevens, Reference Stevens2001) of item 6 (“Do people who aren’t your friends laugh at you or tease you in a hurtful way?”), which therefore was excluded from all subsequent analyses. Internal consistency for the 7-item solution was acceptable across all assessment timepoints (pre-pandemic baseline: α = .75, first lockdown: α = .73, reopening: α = .68, second lockdown: α = .77).
Perceived stress
The Perceived Stress Scale (PSS; Cohen et al., Reference Cohen, Kamarck and Mermelstein1983) was used to assess current (i.e., past two weeks) levels of appraised stress, but was only assessed during the follow-up timepoints. At each follow-up assessment timepoint, participants rated 10 items such as “How often have you felt nervous and stressed” on a 5-point Likert scale (1 = never, 5 = very often). Positive items were reverse coded so that higher scores indicate greater levels of perceived stress. Internal consistency for the total scale was excellent across all assessment timepoints (first lockdown: α = .88, reopening: α = .93, second lockdown: α = .86).
Childhood adversity
At pre-pandemic baseline, different types of CA experiences were assessed using three retrospective self-report questionnaires: the Short-Form of the Childhood Trauma Questionnaire, the Measure of Parental Style Questionnaire, and the Alabama Parenting Questionnaire. Positive items on these questionnaires were reverse coded so that higher scores indicate more severe CA experiences. See below for details on how these scales were further processed to compute a cumulative CA index. Please note that this analytic procedure has been applied and presented to full detail in previous works (König et al., Reference König, Berhe, Ioannidis, Orellana, Davidson, Kaser, Moreno-López and van Harmelen2023). However, for completeness, we will provide a summary of its methodological details here.
The Short-Form of the Childhood Trauma Questionnaire (CTQ-SF; Bernstein et al., Reference Bernstein, Stein, Newcomb, Walker, Pogge, Ahluvalia, Stokes, Handelsman, Medrano, Desmond and Zule2003) was used to assess maltreatment experiences within the family environment during childhood or adolescence. Participants rated items such as “I didn’t have enough to eat” on a 5-point Likert scale (1 = never true, 5 = very often true). This 28-item screening measure comprises five subscales (sexual, physical, and emotional abuse, and physical and emotional neglect), which can be combined to estimate a total severity score. Internal consistency was excellent for the total scale (Cronbach’s α = .92) and acceptable to excellent for the four subscales (physical abuse: α = .81; emotional abuse: α = .85; physical neglect: α = .72; emotional neglect: α = .93). The sexual abuse subscale (α = .94) was excluded from all analyses due to too low prevalence (Mdn = 0, IQR = 0). Based on established cutoff scores for the CTQ (Bernstein et al., Reference Bernstein, Fink, Handelsman, Foote, Lovejoy, Wenzel, Sapareto and Ruggiero1994), our baseline sample can be characterized reporting low to moderate levels of CA.
The Measure of Parental Style Questionnaire (MOPS; Parker et al., Reference Parker, Roussos, Hadzi-Pavlovic, Mitchell, Wilhelm and Austin1997) was used to assess adverse maternal and paternal parenting style experiences. Participants rated items such as “My father was physically violent or abusive to me” on a 4-point Likert scale (1 = not true at all, 4 = extremely true). This 30-item screening measure comprises six subscales (maternal and paternal abuse, -indifference, and -overcontrol), which can be combined to estimate a total severity score. Internal consistency was excellent for the total maternal scale (α = .91) and paternal scale (α = .90) and acceptable to good for the six subscales (maternal abuse: α = .86, -indifference: α = .88; -overcontrol: α = .78; paternal abuse: α = .77; -indifference: α = .90; -overcontrol: α = .89).
The Alabama Parenting Questionnaire (APQ; Frick, Reference Frick1991) was used to assess past adverse parenting experiences. Participants rated items such as “Your parents spanked you with their hand when you have done something wrong” on a 5-point Likert scale (1 = never true, 5 = very often true). This 42-item screening measure comprises five subscales (corporal punishment, parental involvement, negative parenting, poor monitoring/supervision, and inconsistent discipline), which can be combined to estimate a total severity score. At pre-pandemic baseline, a modified 15-item version of the APQ was administered retaining all five subscales (guided by Elgar et al. (Reference Elgar, Waschbusch, Dadds and Sigvaldason2007)). Internal consistency was poor for two subscales (poor monitoring/supervision: α = .51; inconsistent discipline: α = .57), which led to their exclusion from all analyses. Internal consistency was good for the 9-item total scale (α = .85) and acceptable to good for the remaining three subscales (corporal punishment: α = .86; parental involvement: α = .77; negative parenting: α = .83).
Principal component analysis
To compute a cumulative CA index (higher index indicating more severe CA experiences), a principal component analysis (PCA) with non-orthogonal (oblique) rotation was run on individual scores of the three APQ subscales, four CTQ-SF subscales, and six MOPS subscales. The PCA was run using the psych R package (version 2.3.3; Revelle, Reference Revelle2022) and mean imputations to replace missing values were performed using the mice R package (version 3.16.0; Van Buuren & Groothuis-Oudshoorn, Reference Van Buuren and Groothuis-Oudshoorn2011). The Kaiser-Meyer-Olkin measure verified the sampling adequacy for the analysis (KMO = .85; “meritorious” according to Kaiser (Reference Kaiser1974)) and all KMO values for individual items were ≥ .70. Bartlett’s test of sphericity, χ278 = 722.86, p < .001, indicated that correlations between items were sufficiently large for a PCA. Examining the scree plot in the context of our relatively small sample size led us to retain a two-component solution. The principal component (PC) scores and their associations have been previously visualized and summarized by (König et al., Reference König, Berhe, Ioannidis, Orellana, Davidson, Kaser, Moreno-López and van Harmelen2023). In summary, PC1 explained 37% of variance and is referred to as the deprivation dimension because most items capture experiences related to the absence of expected inputs from the environment. PC2 explained 21% of variance and is referred to as the threat dimension because most items capture experiences related to harm or threat of harm. To account for the contributions of both PCs, we weighted the scores for each PC by their explained variance and subsequently summed these scores to compute a single index of total severity experienced. This cumulative CA index was utilized in all subsequent analyses. Please note that dimensional effects of CA were not the focus of the current study and are therefore only reported in the supplementary information on an exploratory basis (Tables S10–S15).
Statistical analysis
All analyses were performed in R (version 4.3.0; R Core Team, 2022). In case of missing questionnaire data, total scores were only derived if 100% of items were answered for scales with <15 items or if 85% of items were answered for scales with ≥15 items. This resulted in an average of 1.96% of missing questionnaire data at pre-pandemic baseline, 1.27% during the first lockdown, 6.49% at reopening, and 1.37% during the second lockdown (Supplementary Table S2). Outliers were detected and excluded based on the Rosner’s test (EnvStats R package version 2.7.0; Millard, Reference Millard2013). First, we examined whether the COVID-19 outbreak was associated with an increase in depression and anxiety symptoms (hypothesis 1.1) as well as a reduction in perceived friendship quality (hypothesis 1.2). Specifically, we examined whether these trends were exacerbated during lockdown periods. Second, we examined whether more severe CA exposure was associated with greater depression and anxiety symptoms (hypothesis 2.1) as well as lower levels of perceived friendships quality (hypothesis 2.2) before and during the COVID-19 pandemic. Third, we examined whether higher friendship quality would be associated with lower depression and anxiety symptoms before and during the COVID-19 pandemic (hypothesis 3). To accomplish this, we utilized linear mixed-effects models (lmerTest R package version 3.1.3; Kuznetsova et al., Reference Kuznetsova, Brockhoff and Christensen2017). In building our models, we started with a random intercept model including only the fixed effect of assessment timepoint. In step 2, we added fixed effects for CA or friendship support to determine their additional predictive value. In step 3, we added the interaction terms for assessment timepoint × CA or assessment timepoint × friendship support to account for potential differential impacts of CA or friendship support over time. In step 4, we added age at assessment timepoint and gender identity as covariates. Subject-level random intercepts were included for all models (Baayen et al., Reference Baayen, Davidson and Bates2008) and reported coefficients were standardized using z-scores. Across all models, missing data was handled using maximum likelihood estimation allowing for the comparison of nested models using Akaike Information Criteria (AIC; Akaike, Reference Akaike1974). Model fit was assessed using both the AIC value with a lower value indicating better model fit as well as likelihood ratio tests with a non-significant difference (p > .05) resulting in the retention of the more parsimonious model. Please see our supplementary information for all model specifications and a summary of model fit indices (Tables S4-S26). Main effects of the best-fitting models were inspected using omnibus Type III F tests with Satterthwaite’s approximation for degrees of freedom. Post-hoc analyses were corrected for multiple comparisons using the false discovery rate (FDR) correction method (Benjamini & Hochberg, Reference Benjamini and Hochberg1995). Given that mental health indicators were found to fluctuate depending on pandemic-related social distancing restrictions (Pedersen et al., Reference Pedersen, Andersen, Clotworthy, Jensen, Strandberg-Larsen, Rod and Varga2022), we further explored the interrelationships between changes in friendship quality and mental health symptoms across all assessment timepoints. Specifically, based on the (Kievit et al., Reference Kievit, Brandmaier, Ziegler, van Harmelen, de Mooij, Moutoussis, Goodyer, Bullmore, Jones, Fonagy, Lindenberger and Dolan2018) tutorial, three exploratory bivariate latent change score (BLCS) models (lavaan R package version 0.6.16; Rosseel, Reference Rosseel2012) were built to examine the interplay between perceived friendship quality and mental health symptoms from pre-pandemic baseline to first lockdown, first lockdown to reopening, and reopening to second lockdown (see supplementary section G for further information; Figure S5). Because of our comparatively small sample size, we chose to analyze three distinct BLCS models instead of incorporating all relationships into a single model (Hertzog et al., Reference Hertzog, Lindenberger, Ghisletta and Oertzen2006). Finally, we explored whether perceived stress during the first lockdown mediated the relationship between pre-pandemic levels of perceived friendship quality and mental health symptoms during reopening. Given that perceived stress was only assessed during follow-up and mediation has been proposed to represent a process that unfolds over time (O’Laughlin et al., Reference O’Laughlin, Martin and Ferrer2018), we used a sequential mediation analysis (sem R package version 3.1.15; Fox, Reference Fox2006) to capture the temporal sequence of the process of interest (Cain et al., Reference Cain, Zhang and Bergeman2018). To further explore the self-reported psychosocial experiences of young people with CA during the COVID-19 pandemic, we analyzed four items from the COVID-19 Adolescent Symptom and Psychological Experience Questionnaire (CASPE; Ladouceur, Reference Ladouceur2020) with findings detailed in the supplementary information (section J; Figures S9–S11).
Two post-hoc simulation-based power analyses were conducted. First, we used the mixedpower R package (version 0.1.0; Kumle et al., Reference Kumle, Võ and Draschkow2021) to estimate power in our linear mixed-effects model examining the main effect of friendship quality on depression symptoms before and during the COVID-19 pandemic (Marginal R 2 = .178; Conditional R 2 = .668). Results of these Monte Carlo simulations indicated that a sample size of N = 70 corresponds to more than 80% power for detecting the main effect. Hence, our sample sizes, ranging from N = 102 before the COVID-19 pandemic to N = 73 during the second lockdown, should provide at least 80% power to detect main effects. Second, to estimate sample size and power for our sequential mediation model, we ran Monte Carlo simulations via the Shiny App developed by Schoemann et al. (Reference Schoemann, Boulton and Short2017) (available at https://schoemanna.shinyapps.io/mc_power_med/). These simulations indicated that a sample of N = 73 participants results in 80% power for detecting the indirect effect (ab path). Further details on these statistical power considerations are provided in the supplementary information (section I).
Results
The impact of the COVID-19 pandemic on mental health symptoms (hypothesis 1.1)
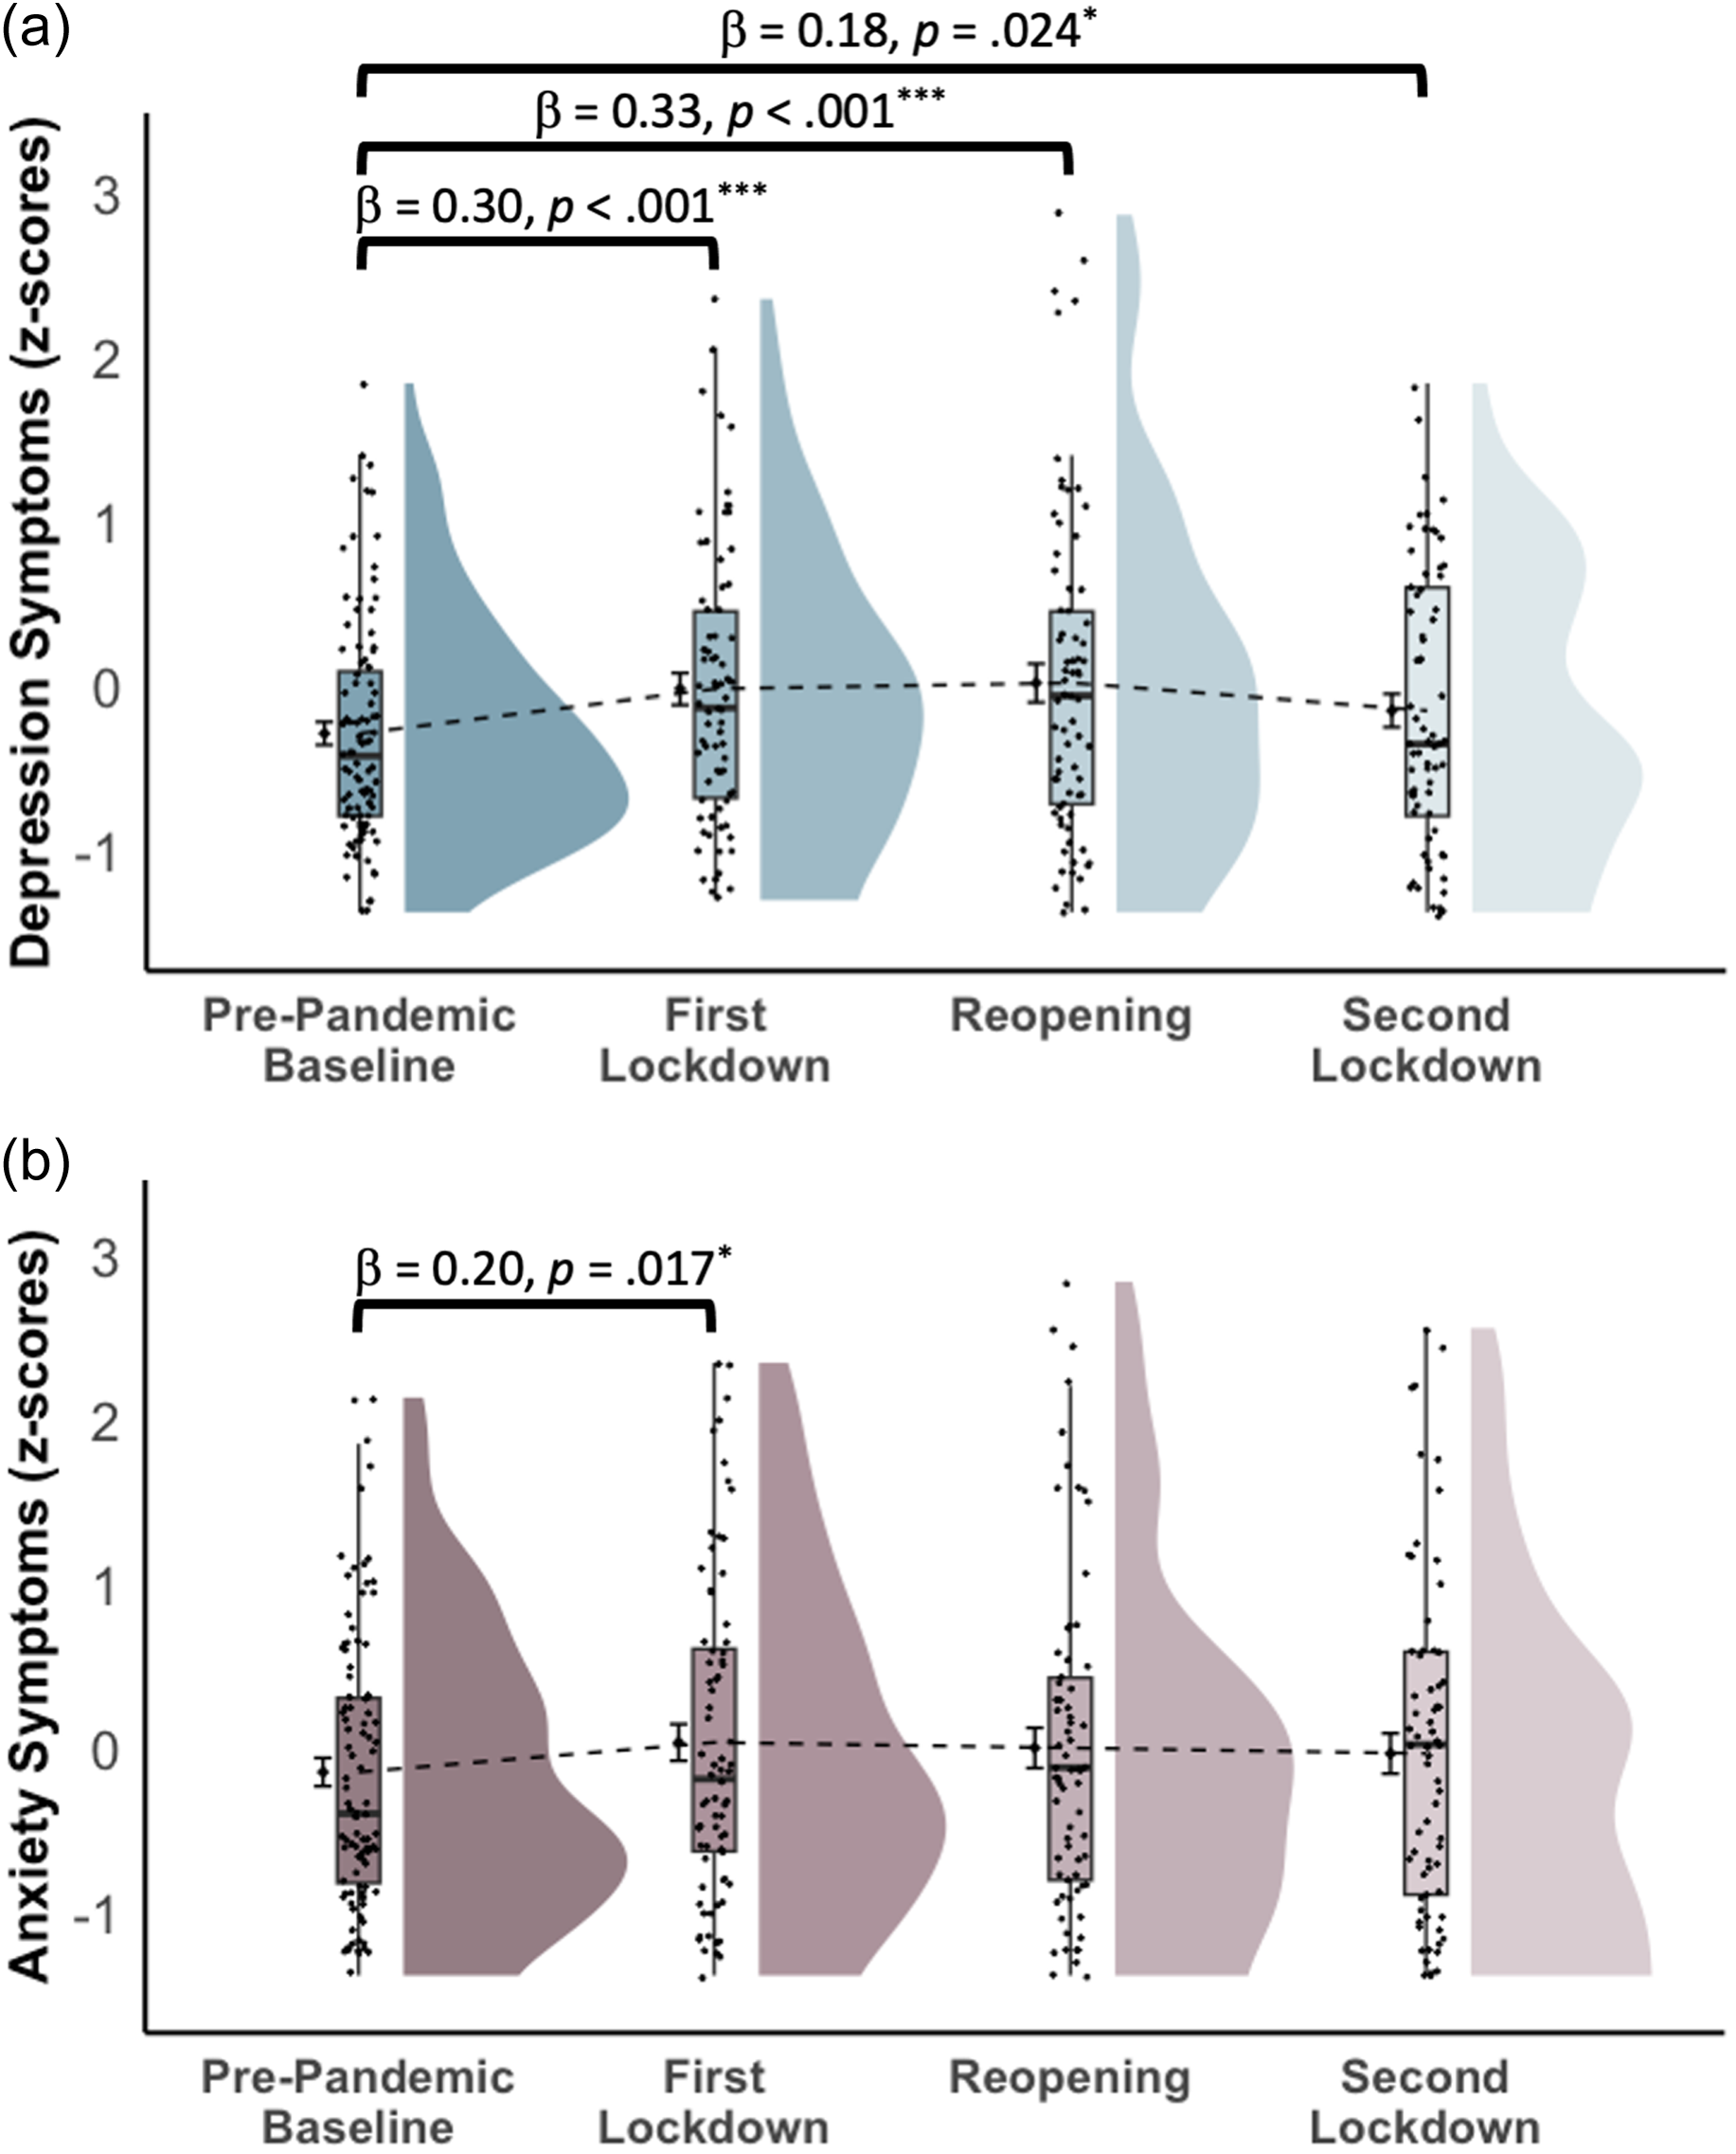
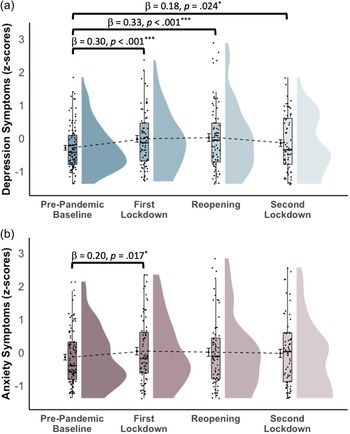
Compared to pre-pandemic baseline levels, depression symptoms significantly increased during the COVID-19 pandemic (β = 0.06, SE = 0.03, 95% CI [0.01, 0.12], p = .016). Specifically, depression symptoms were significantly elevated during the first lockdown (β = 0.30, SE = 0.08, 95% CI [0.14, 0.45], p < .001), the reopening (β = 0.33, SE = 0.08, 95% CI [0.17, 0.49], p < .001), and the second lockdown (β = 0.18, SE = 0.08, 95% CI [0.02, 0.34], p = .024) (Table 1, Figure 2a). Anxiety symptoms were significantly elevated during the first lockdown (β = 0.20, SE = 0.08, 95% CI [0.04, 0.37], p = .017), but returned to pre-pandemic baseline levels during reopening (β = 0.15, p = .088), and the second lockdown (β = 0.12, p = .184) (Table 1, Figure 2b). No main effect of time was observed for anxiety symptoms across the COVID-19 pandemic (β = 0.03, p = .248). Therefore, the following analyses will focus on the effects related to depression symptoms. Findings related to anxiety symptoms are reported in the supplementary information (Tables S4–S5, S8, S14–S16, S18–S22, S26; Figures S3, S4, S6, S8), along with supplementary Table S3 displaying correlations between the main study variables across all assessment timepoints.
(a) Depression and (b) anxiety symptoms before and during the COVID-19 pandemic. Note. Compared to pre-pandemic baseline levels, participants self-reported (a) elevated depression symptoms during the first lockdown (p < .001), the reopening (p < .001), and the second lockdown (p = .024) and (b) elevated anxiety symptoms during the first lockdown (p = .017). The raincloud plots (Allen et al., Reference Allen, Poggiali, Whitaker, Marshall, van Langen and Kievit2019) display standardized depression and anxiety scores (y-axis) across all assessment timepoints (x-axis). To emphasize the main effect of time, we first plotted the mean and 95% confidence intervals for each assessment timepoint and connected these with a dashed line. Second, we added box plots showing the median (solid vertical line) and interquartile range. The black dots represent individual raw datapoints. Third, we added violin plots to visualize the probability distribution. β = standardized coefficient; *p < .05, ***p < .001.
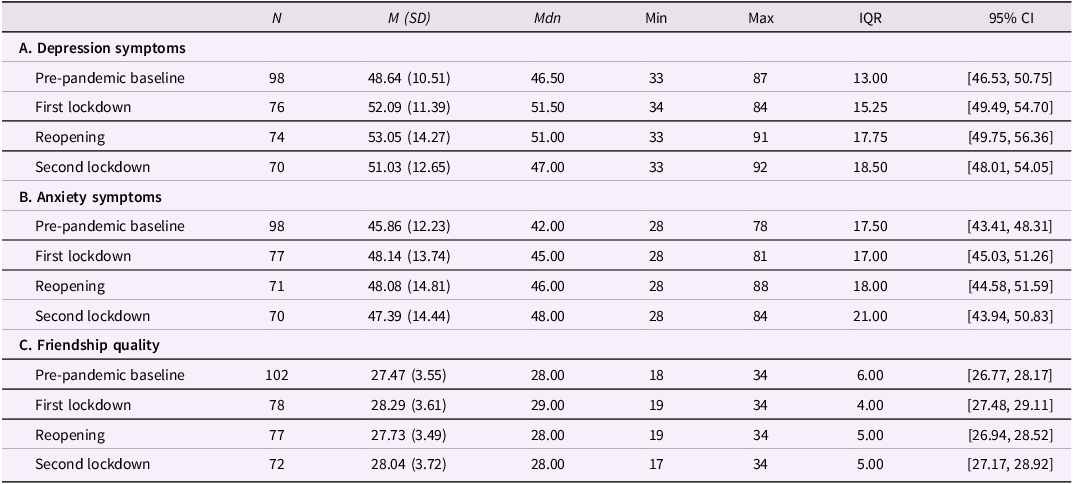
Descriptive statistics for (A) depression symptoms, (B) anxiety symptoms, and (C) friendship quality before and during the COVID-19 pandemic

Note. Descriptive statistics are provided for raw scores of the respective self-report questionnaire, following outlier removal. IQR = interquartile range, 95% CI = 95% confidence interval.
The impact of the COVID-19 pandemic on perceived friendship quality (hypothesis 1.2)
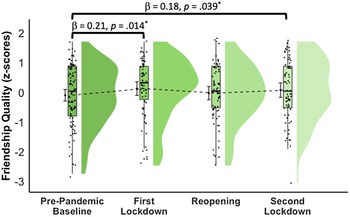
Compared to pre-pandemic baseline levels, our sample reported a significant increase in perceived friendship quality during the first lockdown (β = 0.21, SE = 0.08, 95% CI [0.04, 0.38], p = .014), a return to pre-pandemic baseline levels during reopening (β = 0.07, p = .436), and another significant increase during the second lockdown (β = 0.18, SE = 0.09, 95% CI [0.01, 0.35], p = .039) (Table 1, Figure 3, supplementary Tables S6, S7). No main effect of time was observed for friendship quality across the COVID-19 pandemic (β = 0.04, p = .136).
Perceived friendship quality before and during the COVID-19 pandemic. Note. Compared to pre-pandemic baseline levels, participants self-reported elevated levels of perceived friendship quality during the first (p = .014) and second lockdown (p = .039). This raincloud plot displays standardized perceived friendship quality scores (y-axis) across all assessment timepoints (x-axis). To emphasize the main effect of time, we first plotted the mean and 95% confidence intervals for each assessment timepoint and connected these with a dashed line. Second, we added box plots showing the median (solid vertical line) and interquartile range. The black dots represent individual raw datapoints. Third, we added violin plots to visualize the probability distribution. β = standardized coefficient; *p < .05.

The impact of childhood adversity on depression symptoms before and during the COVID-19 pandemic (hypothesis 2.1)
Depression symptoms before and during the pandemic were not related to CA. Specifically, compared to the baseline model which included only assessment timepoint as a main effect (AIC = 636.43, BIC = 658.93), adding CA as a predictor did not significantly improve model fit (AIC = 634.82, BIC = 661.06, p > .05) (see supplementary Table S8).
The impact of childhood adversity on perceived friendship quality before and during the COVID-19 pandemic (hypothesis 2.2)
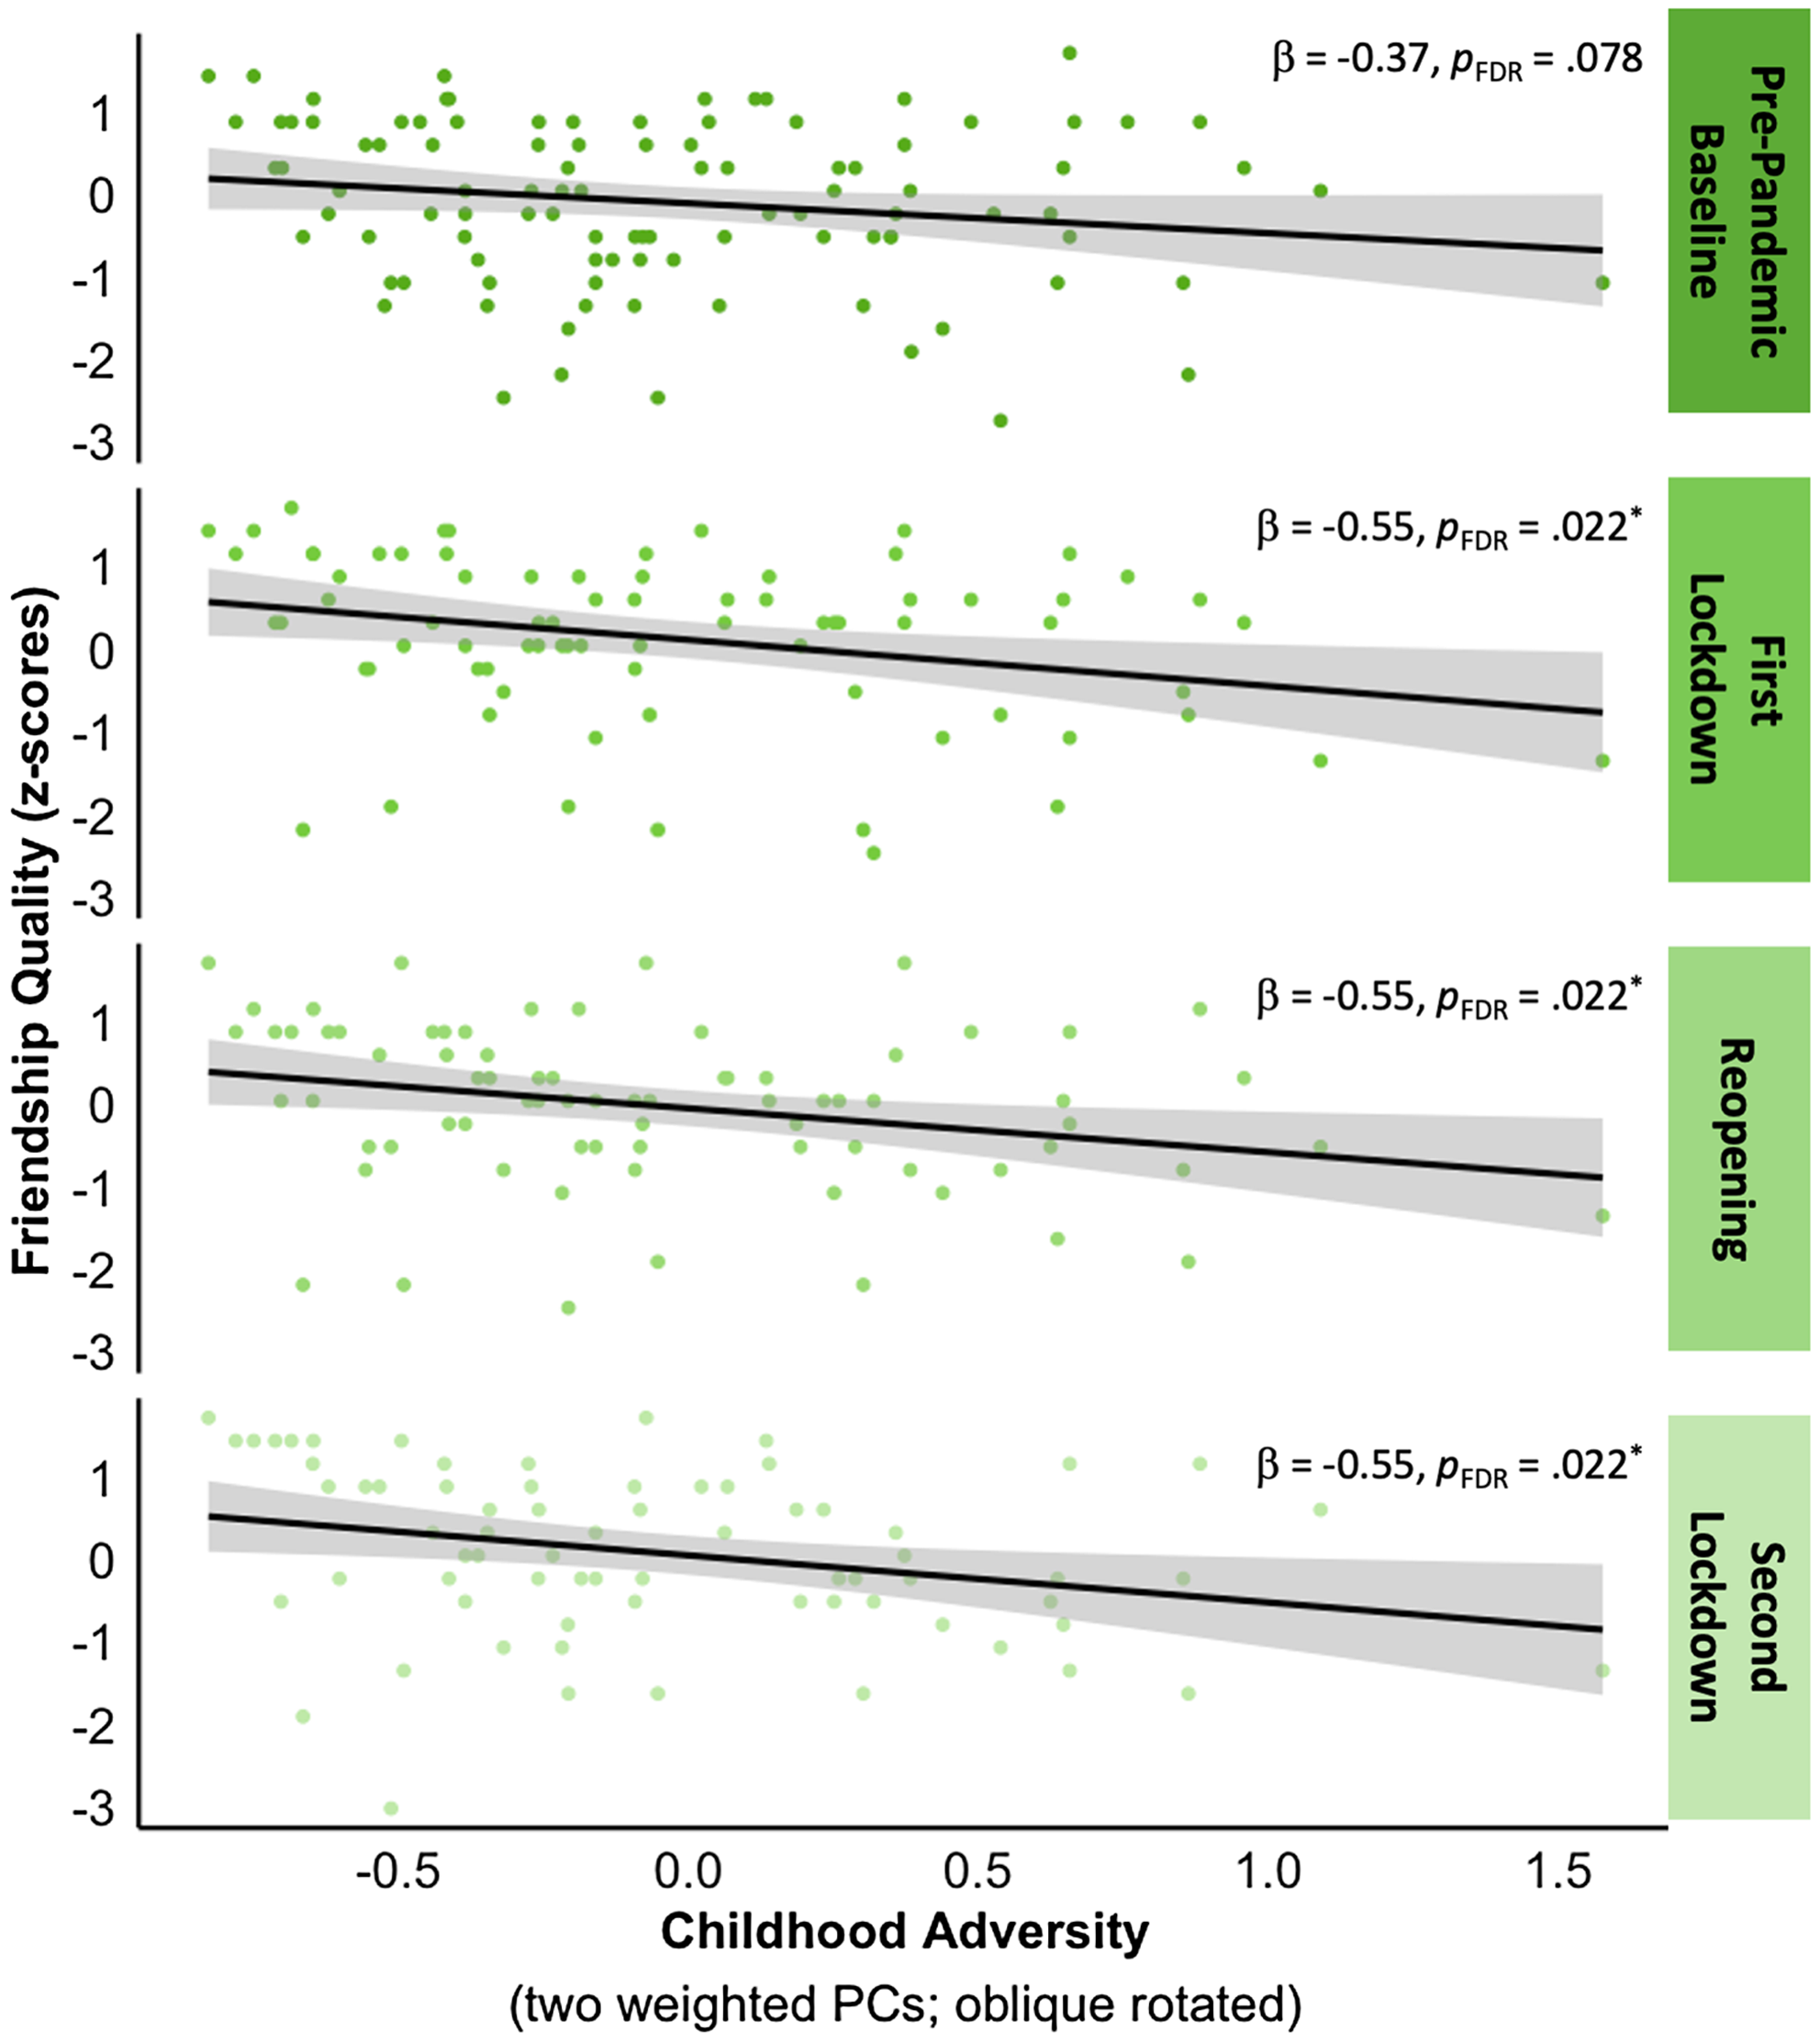
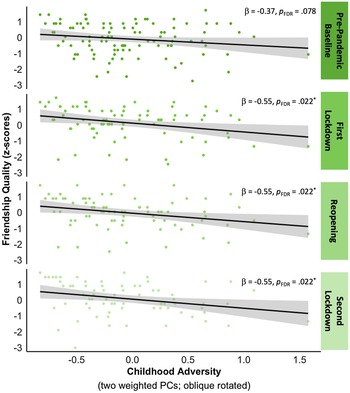
When controlling for all assessment timepoints, more severe CA was associated with lower friendship quality (β = −0.42, SE = 0.18, 95% CI [−0.78, −0.07], p = .020). FDR-corrected post-hoc analyses revealed that this relationship was present at each assessment timepoint during the COVID-19 pandemic (psFDR = .022) but absent at pre-pandemic baseline (p FDR = .078) (Figure 4 and supplementary Tables S8, S9, Figure S1).
Childhood adversity effects on perceived friendship quality before and during the COVID-19 pandemic. Note. Participants with more severe CA (x-axis) self-reported lower friendship quality (y-axis) at each assessment timepoint during the COVID-19 pandemic (psFDR = .022) but not at pre-pandemic baseline (p FDR = .078). Index scores of CA comprise two weighted and oblique rotated principal components (PCs). Both axes represent standardized scores. The shading of individual data points corresponds to the four different assessment timepoints. The black lines show the best-fitting linear regression lines, and the shaded regions represent the 95% confidence intervals. β = standardized coefficient; *p FDR < .05.
Friendship effects on depression symptoms before and during the COVID-19 pandemic (hypothesis 3)
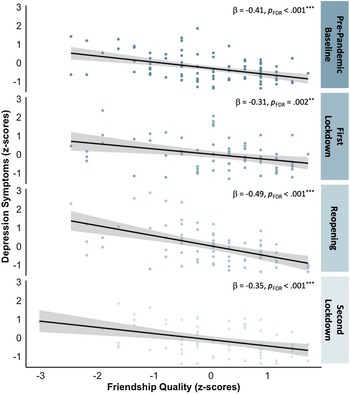
When controlling for all assessment timepoints, greater perceived friendship quality was associated with lower levels of depression symptoms (β = −0.35, SE = 0.06, 95% CI [−0.48, -0.22], p < .001). FDR-corrected post-hoc analyses confirmed that this negative relationship between friendship quality and depression symptoms was present at each assessment timepoint (psFDR < .003) (Figure 5 and supplementary Tables S16, S17, Figure S2).
Friendship effects on depression symptoms before and during the COVID-19 pandemic. Note. Participants with greater perceived friendship quality (x-axis) also self-reported lower levels of depression symptoms (y-axis) across all assessment timepoints (psFDR < .003). Both axes represent standardized scores. The black lines show the best-fitting linear regression lines and the shaded regions represent the 95% confidence intervals. β = standardized coefficient; **p FDR < .01, ***p FDR < .001.

Exploring the interplay between perceived friendship quality and depression symptoms from before to during the COVID-19 pandemic
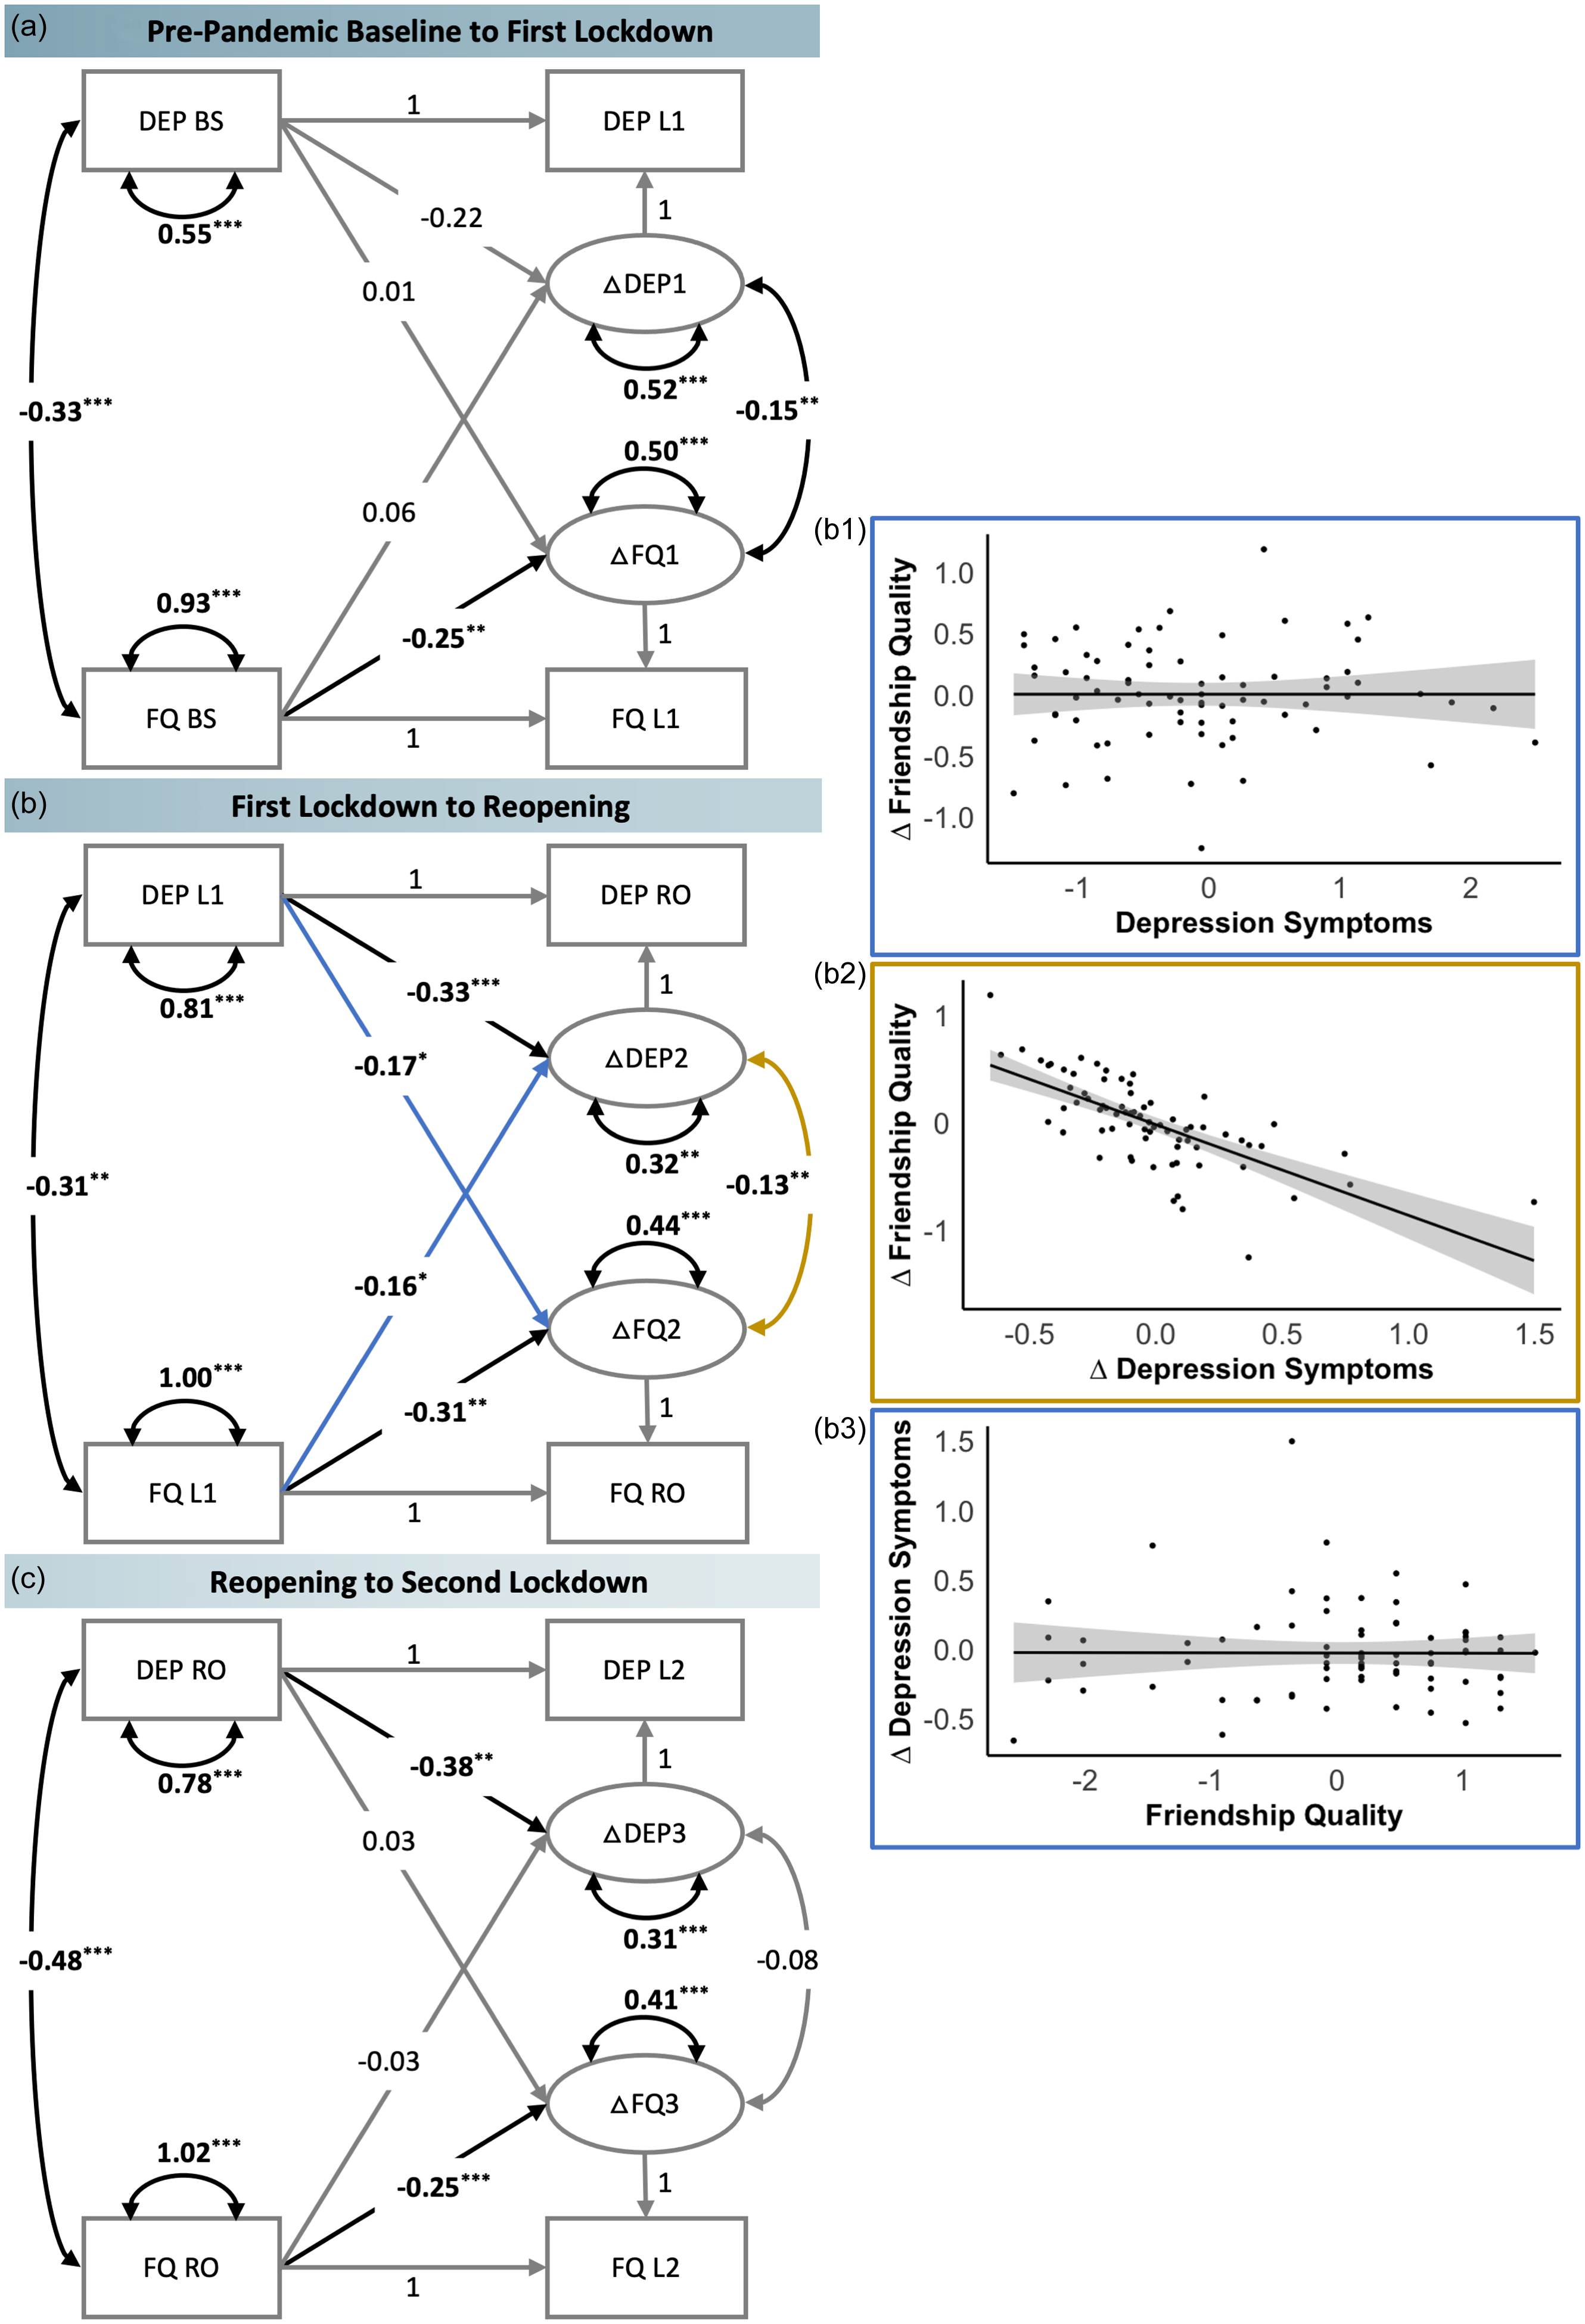
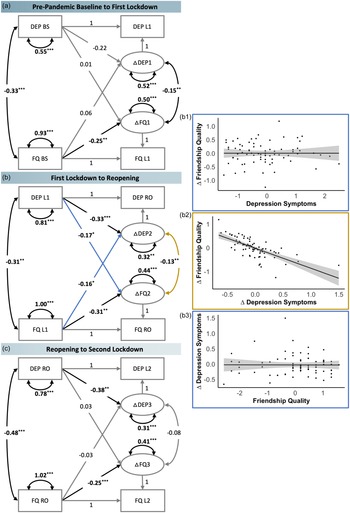
We utilized BLCS modeling to explore the interrelationships between perceived friendship quality and depression symptoms from before to during the COVID-19 pandemic (Figure 6, supplementary Tables S19–S22). Specifically, we estimated the dynamics between both domains of interest from pre-pandemic baseline to first lockdown, first lockdown to reopening, and reopening to second lockdown.
The interplay between perceived friendship quality and depression symptoms from before to during the COVID-19 pandemic. Note. Each path shows standardized parameter estimates. FQ = friendship quality domain, DEP = depression symptom domain, BS = pre-pandemic baseline, L1 = first lockdown, RO = reopening, L2 = second lockdown. Δ = latent change score, → = directed relationship, ↔ = undirected relationship. Path in black denote significant effects. (b1) correlation between change in friendship quality from the first lockdown to reopening and depression symptoms at the first lockdown, (b2) correlation between change in friendship quality and change in depression symptoms from the first lockdown to reopening, (b3) correlation between change in depression symptoms from the first lockdown to reopening and friendship quality at the first lockdown. Comparisons between raw correlations (b1 & b3) and the model estimated coupling parameters indicate potential suppression effects. Refer to supplementary section G for guidance on interpreting these models. *p < .05, **p < .01, ***p < .001.
Pre-pandemic baseline to first lockdown
First, we observed a strong negative correlation between friendship quality and depression symptoms at pre-pandemic baseline (Est = −0.33, SE = 0.08, z = −4.15, p < .001), indicating that individuals with greater friendship quality self-reported lower depression symptoms and vice versa (Figure 6a).
Second, greater friendship quality at pre-pandemic baseline was negatively associated with change in friendship quality between pre-pandemic baseline and the first lockdown (Est = −0.25, SE = 0.09, z = −2.86, p = .004). This indicates that those with already high friendship quality before the pandemic showed a slower increase in friendship quality when entering the first lockdown. Those with lower friendship quality instead reported a stronger increase in perceived quality when entering the first lockdown. However, greater friendship quality at pre-pandemic baseline was not associated with change in depression symptoms between both timepoints (Est = 0.06, p = .512). Furthermore, greater depression symptoms at pre-pandemic baseline were neither associated with change in friendship quality (Est = 0.01, p = .916) nor the change in depression symptoms (Est = −0.22, p = .101).
Third, after accounting for these coupling and self-feedback pathways, we observed that changes in both friendship quality and depression symptoms were negatively correlated (Est = −0.15, SE = 0.06, z = −2.72, p = .007), suggesting that changes in both domains co-occur at the same time. In other words, a greater change in friendship quality co-occurred with a slower change in depression symptoms and vice versa.
First lockdown to reopening
First, we observed a strong negative correlation between friendship quality and depression symptoms during the first lockdown (Est = −0.31, SE = 0.10, z = −2.99, p = .003), indicating that individuals with greater friendship quality self-reported lower depression symptoms and vice versa (Figure 6b).
Second, greater friendship quality during the first lockdown was negatively associated with change in friendship quality between the first lockdown and reopening (Est = −0.31, SE = 0.10, z = −3.08, p = .002). This indicates that those with greater friendship quality showed a slower change in friendship quality between both timepoints. Moreover, greater friendship quality during the first lockdown was negatively associated with change in depression symptoms between both timepoints (Est = −0.16, SE = 0.07, z = −2.30, p = .022). This indicates that higher friendship quality during the first lockdown was associated with a slower change in depression symptoms. Furthermore, greater depression symptoms during the first lockdown were negatively associated with both change in depression symptoms (Est = −0.33, SE = 0.09, z = −3.57, p < .001) and change in friendship quality (Est = −0.17, SE = 0.08, z = −2.08, p = .037). This suggests that higher friendship quality during the first lockdown was associated with a slower increase in depression symptoms when entering the reopening period and that higher depressive symptoms during the first lockdown were associated with a slower increase in friendship quality. Such patterns of regression to the mean are often observed (Barnett et al., Reference Barnett, van der Pols and Dobson2005).
Third, after accounting for these coupling and self-feedback pathways, we observed that changes in both friendship quality and depression symptoms were negatively correlated (Est = −0.13, SE = 0.04, z = −2.99, p = .003), suggesting that changes in both domains co-occur at the same time.
Reopening to second lockdown
First, we observed a strong negative correlation between friendship quality and depression symptoms during reopening (Est = −0.48, SE = 0.11, z = −4.31, p < .001), indicating that individuals with greater friendship quality self-reported lower depression symptoms and vice versa (Figure 6c).
Second, greater friendship quality during reopening was negatively associated with change in friendship quality between reopening and the second lockdown (Est = −0.25, SE = 0.06, z = −3.87, p < .001), indicating that those with greater friendship quality showed a slower change in friendship quality between both timepoints. However, greater friendship quality during reopening was not associated with change in depression symptoms between both timepoints (Est = 0.03, p = .682). Furthermore, greater depression symptoms during reopening were negatively associated with change in depression symptoms (Est = −0.38, SE = 0.13, z = −2.97, p = .003), but not associated with change in friendship quality (Est = 0.03, p = .764).
Third, after accounting for these coupling and self-feedback pathways, we observed that changes in both friendship quality and depression symptoms were not correlated (Est = −0.08, p = .140).
Exploring perceived stress as a potential mechanism linking perceived friendship quality with depression symptoms
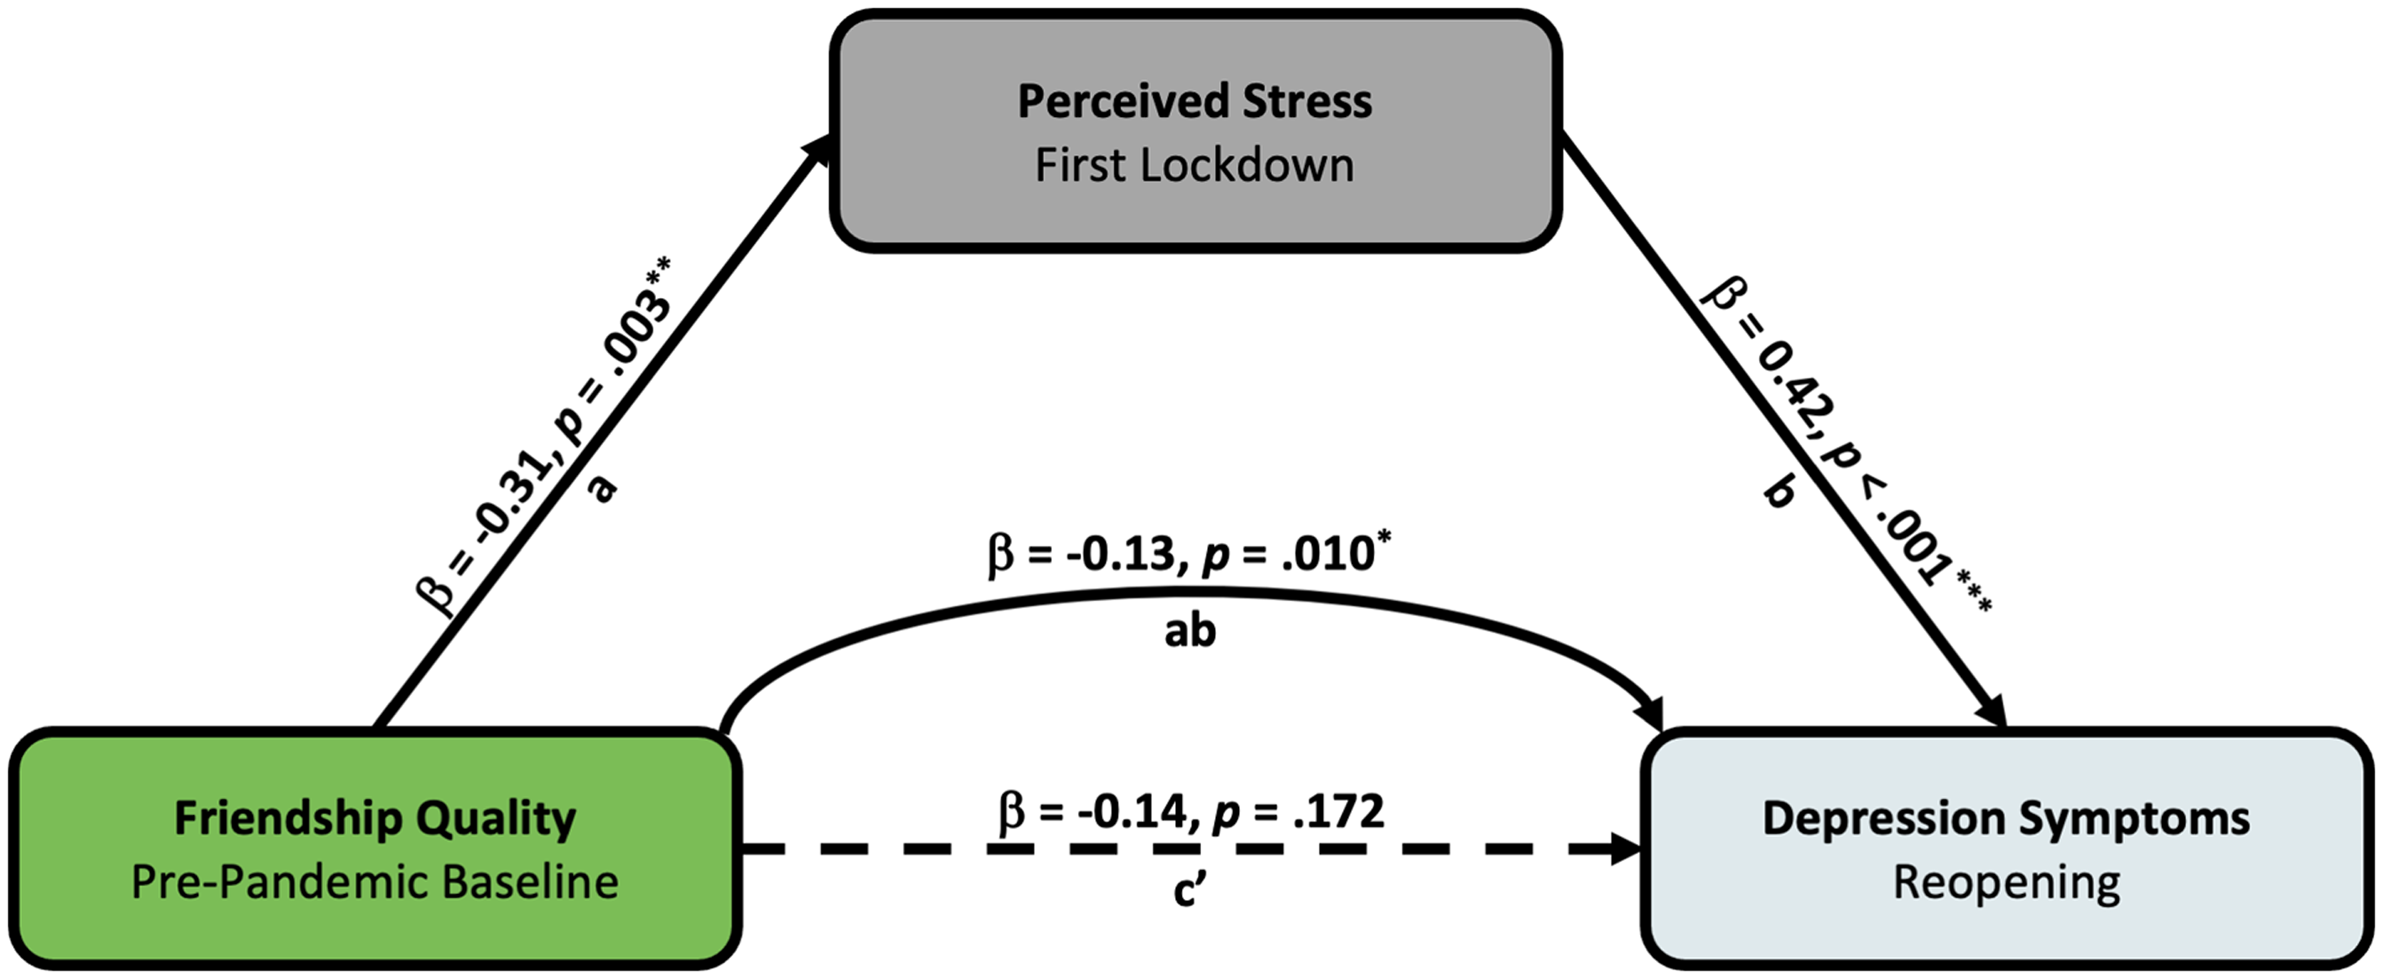
A sequential mediation analysis revealed that perceived stress during the first lockdown fully mediated the relationship between friendship quality during pre-pandemic baseline and depression symptoms during reopening (indirect effect: β = −0.13, SE = 0.05, 95% CI [0.25,−0.05], p = .010; Figure 7). This analysis controlled for gender identity because of a significant main effect on perceived stress across all pandemic assessment timepoints (β = 0.61, SE = 0.20, 95% CI [0.21, 1.00], p = .003). Specifically, females reported significantly greater levels of perceived stress during the COVID-19 pandemic than males (supplementary section H; Figure S7; Tables S23–S25).
Perceived stress mediates the relationship between perceived friendship quality and depression symptoms. Note. Path a shows the standardized regression coefficient of the relationship between friendship quality during pre-pandemic baseline and perceived stress during the first lockdown. Path b shows the standardized regression coefficient of the relationship between perceived stress during the first lockdown and depression symptoms during reopening, while controlling for gender identity. Paths ab (indirect effect) and c’ (direct effect) show the standardized regression coefficient of the relation between friendship quality during pre-pandemic baseline and depression symptoms during reopening without and while controlling for perceived stress during the first lockdown, respectively. Pre-pandemic baseline = August 2019 to March 2020 (N = 97 after outlier removal); first lockdown = April to May 2020 (n = 75 after outlier removal); reopening = July to August 2020 (n = 73 after outlier removal). Dashed line denotes non-significant effect. β = standardized coefficient; *p < .05, ***p < .001.
Discussion
In this study, we prospectively assessed friendship buffering effects on mental health symptoms from before to during the COVID-19 pandemic in 102 young people (aged 16–26) with low to moderate CA. Additionally, we explored the mediating role of perceived stress during the COVID-19 pandemic. First, we observed an overall increase in depression symptoms from before to during the COVID-19 pandemic. Anxiety symptoms were significantly elevated during the first lockdown but returned to pre-pandemic baseline levels afterwards. Perceived friendship quality increased during the first and second lockdown but returned to pre-pandemic baseline levels during reopening. Contrary to the stress sensitization hypothesis (Hammen et al., Reference Hammen, Henry and Daley2000), CA was not predictive of elevated depression symptoms following the COVID-19 outbreak. However, CA was associated with social thinning following the outbreak. Next, high-quality friendships were predictive of lower depression symptoms before and during the COVID-19 pandemic. In addition, we found that improvements in friendship quality co-occurred with reductions in depression symptoms between pre-pandemic baseline and reopening. Finally, we identified perceived stress during the first lockdown as a potential mechanism linking pre-pandemic baseline levels of perceived friendship quality with depression symptoms during reopening. Our findings highlight the importance of fostering stable and supportive friendships in young people with CA and suggest that through reducing stress perceptions high-quality friendships can mitigate mental health problems during times of multidimensional stress.
In line with global longitudinal and meta-analytic findings (Pierce et al., Reference Pierce, Hope, Ford, Hatch, Hotopf, John, Kontopantelis, Webb, Wessely, McManus and Abel2020; Racine et al., Reference Racine, McArthur, Cooke, Eirich, Zhu and Madigan2021; Robinson et al., Reference Robinson, Sutin, Daly and Jones2022; Santomauro et al., Reference Santomauro, Mantilla Herrera, Shadid, Zheng, Ashbaugh, Pigott, Abbafati, Adolph, Amlag, Aravkin, Bang-Jensen, Bertolacci, Bloom, Castellano, Castro, Chakrabarti, Chattopadhyay, Cogen, Collins and Ferrari2021), we observed a continuous increase in depression symptoms following the COVID-19 outbreak. For example, a meta-analysis by Racine et al. (Reference Racine, McArthur, Cooke, Eirich, Zhu and Madigan2021), which included 29 studies and 80,879 young people worldwide, found that the global prevalence of clinically elevated depression symptoms in young people increased throughout the first year of the COVID-19 pandemic. A different trend has been observed for anxiety symptoms, which peaked during the first lockdown and returned to pre-pandemic baseline levels afterwards. A similar trajectory has been reported by Fancourt et al. (Reference Fancourt, Steptoe and Bu2021) as well as Robinson et al. (Reference Robinson, Sutin, Daly and Jones2022) and may be related to a reduction in perceived threats from uncertain physical and social environments following the first lockdown (Schweizer et al., Reference Schweizer, Lawson and Blakemore2023).
Surprisingly, perceived friendship quality increased during lockdowns compared to periods with less physical restrictions. This finding contrasts with trends observed in German and UK populations, where perceptions of social cohesion (i.e., social integration and stability) declined during pandemic-related lockdowns, particularly among vulnerable groups (Borkowska & Laurence, Reference Borkowska and Laurence2021; Silveira et al., Reference Silveira, Hecht, Matthaeus, Adli, Voelkle and Singer2022). However, qualitative findings by Larivière-Bastien et al. (Reference Larivière-Bastien, Aubuchon, Blondin, Dupont, Libenstein, Séguin, Tremblay, Zarglayoun, Herba and Beauchamp2022) suggest that, despite maintaining virtual contact with peers during pandemic-related lockdowns, young people in Canada experienced a shift in their perspectives on in-person socialization and friendships. This shift, characterized by an increased awareness of the irreplaceable nature of friendships, may have triggered greater feelings of appreciation, particularly during lockdowns. Furthermore, the shift from face-to-face to predominantly online social interactions may have especially benefitted those with low-quality friendships, at least concerning access to support (Foulkes & Blakemore, Reference Foulkes and Blakemore2021). Our exploratory bivariate latent change score models revealed that higher friendship quality at pre-pandemic baseline (or reopening) was negatively associated with changes in friendship quality between pre-pandemic baseline and the first lockdown (or between reopening and the second lockdown). This suggests that vulnerable young people with higher baseline friendship quality experienced slower changes in friendship quality during the lockdowns, whereas those with lower friendship quality experienced more rapid improvements. Relatedly, Cole et al. (Reference Cole, Nick, Zelkowitz, Roeder and Spinelli2017) showed that young people with low-quality friendships may be more successful in receiving support online. One explanation could be that maladaptive social functioning, such as poor social skills, pose less of a risk for social rejection or relationship conflicts when navigating the online world (Breaux et al., Reference Breaux, Cash, Lewis, Garcia, Dvorsky and Becker2023; Rodríguez-Domínguez et al., Reference Rodríguez-Domínguez, Carrascal-Caputto and Durán2022). Furthermore, online social interactions have the advantage of not being geographically constrained, allowing young people with CA to more easily connect with individuals who share similar experiences (Ziebland & Wyke, Reference Ziebland and Wyke2012). Additionally, Wright & Wachs (Reference Wright and Wachs2023) found that increased technology use for maintaining friendships predicted lower levels of self-isolation and higher friendship quality among young people in the U.S. during a pandemic-related lockdown. This buffering effect, observed around the same time as the first pandemic-related lockdown in the UK, contributes to the growing body of research highlighting the protective role of technology in sustaining relationship with significant others, such as friends, particularly when face-to-face contact is not possible (Juvonen et al., Reference Juvonen, Lessard, Kline and Graham2022). Having said that, the online world comes, unsurprisingly, with its own set of risks and challenges. For example, a systematic review by Daine et al. (Reference Daine, Hawton, Singaravelu, Stewart, Simkin and Montgomery2013) investigated the internet’s influence on the risk of self-harm or suicide among vulnerable young people and found that up to 80% of those at risk had been exposed to suicide and self-harm-related materials online. Additionally, while online forums can be perceived as supportive communities, their use can also expose vulnerable young people to cyberbullying and the normalization of self-harming behaviors (Daine et al., Reference Daine, Hawton, Singaravelu, Stewart, Simkin and Montgomery2013). Relatedly, research by Lytle et al. (Reference Lytle, Silenzio, Homan, Schneider and Caine2017) explored risk and protective factors for suicidal behaviors in marginalized young people and found that greater perceived in-person social support was linked to reduced odds of experiencing bullying, an effect not observed for perceived online social support. Hence, future research is needed to carefully examine if and how online platforms can be safely harnessed to facilitate meaningful social interactions, especially for vulnerable young people.
Contrary to the stress sensitization hypothesis (Hammen et al., Reference Hammen, Henry and Daley2000; Hammen, Reference Hammen2015), CA did not exacerbate depression symptoms following the COVID-19 outbreak. This may be because our sample was rather well-functioning, reporting only low to moderate CA as well as on average high levels of pre-pandemic friendship quality (König et al., Reference König, Berhe, Ioannidis, Orellana, Davidson, Kaser, Moreno-López and van Harmelen2023). While stress sensitization did not predict internalizing problems, it may have affected externalizing behavior and hence social functioning, which would explain our observed social thinning effect following the COVID-19 outbreak. For example, in a sample of young people with severe childhood neglect experiences, Wade et al. (Reference Wade, Zeanah, Fox, Tibu, Ciolan and Nelson2019) showed that greater exposure to later-life stressors was predictive of more externalizing problems. Translational research is needed to explore how training specific psychosocial skills in young people with CA may foster protective, high-quality, and stable social relationships. One pragmatic and mechanistically informed target for intervention is self-regulation skills training. For example, Miller et al. (Reference Miller, Yu, Chen and Brody2015) showed that among low-income young people, better self-regulation (i.e., the capacity to regulate one’s thoughts, feelings, and actions) was associated with more positive psychosocial outcomes such as reduced depressive symptoms, internalizing problems, substance use, and aggressive behavior. However, better self-regulation in these disadvantaged young people was also associated with accelerated epigenetic aging, highlighting potential unforeseen health costs. Relatedly, Fritz et al. (Reference Fritz, Fried, Goodyer, Wilkinson and van Harmelen2018) conducted a network analysis to investigate interrelations between empirically grounded protective factors in young people with and without CA. Compared to those without CA, young people with CA demonstrated predominantly antagonistic associations between protective factors. In other words, the degree to which protective factors hamper rather than enhance each other was significantly higher in young people with CA. For example, low expressive suppression (i.e., the conscious display of certain emotions) was associated with low friendship support in young people with CA, but with high friendship support in young people without CA. Hence, to appropriately tailor preventative interventions towards the needs of young people with CA, future research must investigate the dynamics between protective factors and carefully consider potential health consequences (Méndez Leal & Silvers, Reference Méndez Leal and Silvers2021).
Next, we replicated recent longitudinal findings in young people without CA showing a link between high-quality friendships and better mental health following the first pandemic-related lockdown in the UK (Ashworth et al., Reference Ashworth, Putwain, McLoughlin, Saini, Chopra, Rosser and Eames2022; Wiedemann et al., Reference Wiedemann, Stochl, Neufeld, Fritz, Bhatti, Hook, Goodyer, Dolan, Bullmore, Chamberlain, Fonagy, Perez and Jones2022). Specifically, we observed that high-quality friendship support was associated with lower depression symptoms before and during the COVID-19 pandemic. This study adds to a growing literature highlighting the mental health benefits of social support during the COVID-19 pandemic. For example, Choi et al. (Reference Choi, Lee, Liu, Fatori, Bauermeister, Luh, Clark, Brunoni, Bauermeister and Smoller2023) analyzed longitudinal data from 69,066 US adults (aged 18–88) and found that social support was associated with a 55% reduction in the odds of depression symptoms during the COVID-19 pandemic.
By utilizing bivariate latent change score modeling, we were able to further explore the dynamic interplay between friendship quality and depression symptoms before and during the COVID-19 pandemic. Specifically, we ran three models to capture the relations of interest between pre-pandemic baseline and first lockdown, first lockdown and reopening, and reopening and second lockdown. Across all models, young people with greater friendship quality self-reported lower depression symptoms and vice versa. This not only confirms our repeated cross-sectional and longitudinal findings, highlighting how high-quality friendships can protect against depression symptoms experienced before and during the COVID-19 pandemic (Bernasco et al., Reference Bernasco, Nelemans, van der Graaff and Branje2021; Gariépy et al., Reference Gariépy, Honkaniemi and Quesnel-Vallée2016; Sommerlad et al., Reference Sommerlad, Marston, Huntley, Livingston, Lewis, Steptoe and Fancourt2021; van Harmelen et al., Reference van Harmelen, Gibson, St Clair, Owens, Brodbeck, Dunn, Lewis, Croudace, Jones, Kievit and Goodyer2016), but also that greater depression symptoms can put young people at risk for experiencing poorer friendship support (Rosenquist et al., Reference Rosenquist, Fowler and Christakis2011). Furthermore, we found that improvements in friendship quality co-occurred with reductions in depression symptoms, which aligns with past pre-pandemic findings in a large sample of young people with CA (van Harmelen et al., Reference van Harmelen, Blakemore, Goodyer and Kievit2021). This correlated change was observed between pre-pandemic baseline and reopening and may have disappeared afterwards due to a decreasing trend in depression symptoms. Together, these correlational findings align with the notion that mental health after stress exposure is dynamic and can fluctuate over time and that, at least to some extent, mental health is influenced by friendship support and vice versa (Ioannidis et al., Reference Ioannidis, Askelund, Kievit and van Harmelen2020; Masten, Reference Masten2014). Next, we observed that young people who entered the COVID-19 pandemic with high-quality friendships were better able to maintain that level of support, even during periods of increased physical distancing (Foulkes & Blakemore, Reference Foulkes and Blakemore2021). In turn, these individuals might have been better equipped to deal with pandemic-related stressors as evident by lower depression symptoms. Furthermore, we found that following the COVID-19 outbreak, young people who reported higher depression symptoms were less likely to report reductions in their symptomatology over time. Interestingly, this association was not observed between pre-pandemic baseline and first lockdown. This is opposite to Fancourt et al. (Reference Fancourt, Steptoe and Bu2021) longitudinal observations and suggests that, at least in our well-functioning sample, preexisting depression symptomatology was not a risk factor for higher levels of depression symptoms during the first lockdown. Finally, cross-domain coupling effects emerged between the first lockdown and reopening. However, comparisons between raw correlations and the model estimated coupling parameters indicate potential suppression effects (Maassen & Bakker, Reference Maassen and Bakker2001), which is why we refrain from interpreting these findings. Across all models, we observed significant individual differences in perceived friendship quality, depression symptoms, and their change between timepoints. This should be investigated in future studies as effects found at the group level may not generalize to the individual level (Foulkes & Blakemore, Reference Foulkes and Blakemore2018).
Next, we observed that pre-pandemic friendship quality longitudinally buffered depression symptoms during reopening via lowering perceived stress during the first lockdown. This finding aligns with recent research proposing pandemic-related stress perception as a mechanism linking challenging pre-pandemic experiences, such as CA or psychopathology, with reduced mental health and well-being during the COVID-19 pandemic (Achterberg et al., Reference Achterberg, Dobbelaar, Boer and Crone2021; Gotlib et al., Reference Gotlib, Borchers, Chahal, Gifuni, Teresi and Ho2020). In addition, we found that females reported higher levels of perceived stress during the COVID-19 pandemic compared to males. This aligns with prior reports indicating a global trend wherein females exhibited a greater increase in the prevalence and burden of mental health problems following the COVID-19 outbreak than males (Choi et al., Reference Choi, Lee, Liu, Fatori, Bauermeister, Luh, Clark, Brunoni, Bauermeister and Smoller2023; Fancourt et al., Reference Fancourt, Steptoe and Bu2021; Gotlib et al., Reference Gotlib, Borchers, Chahal, Gifuni, Teresi and Ho2020; Santomauro et al., Reference Santomauro, Mantilla Herrera, Shadid, Zheng, Ashbaugh, Pigott, Abbafati, Adolph, Amlag, Aravkin, Bang-Jensen, Bertolacci, Bloom, Castellano, Castro, Chakrabarti, Chattopadhyay, Cogen, Collins and Ferrari2021).
Several limitations should be noted. First, our sample of well-educated young people with low to moderate CA may not fully generalize to young people with more severe CA or to the broader UK population. For example, close to all participants were able to access the internet to not only complete the study but also to stay connected with friends via social media. Relatedly, our participants self-reported on average high-quality friendships before and during the COVID-19 pandemic, suggesting an overall well-functioning group of young people with CA. Second, to comply with UK physical distancing regulations, all data was necessarily derived from remotely collected self-reports. This may have unwillingly led to the exclusion of groups unable to engage remotely. Furthermore, relying solely on self-reports might have led participants to exhibit response tendencies influenced by social desirability or mood states, potentially inflating the relationship among variables (Jordan & Troth, Reference Jordan and Troth2020). Future research should carefully consider the role of stress exposure and employ diverse methods, such as investigating whether friendship support also buffers neurobiological stress responses in young people with CA (Scheuplein & van Harmelen, Reference Scheuplein and van Harmelen2022). Third, we present findings pertaining to one of the most prevalent mental health challenges during adolescence and early adulthood. However, future research needs to investigate whether the buffering effects extend to other mental health conditions such as bipolar disorder, psychosis, or suicidality. Finally, we utilized bivariate latent change score modeling to explore the dynamic interplay between friendship quality and depression symptoms before and during the COVID-19 pandemic. Future longitudinal studies with larger sample sizes and considerable assessment timepoints are needed to replicate these preliminary findings (Brandmaier et al., Reference Brandmaier, von Oertzen, Ghisletta, Hertzog and Lindenberger2015).
The COVID-19 outbreak evidently exerted adverse effects on the mental health of young people who were already known to be at greater risk for the development of prolonged mental health conditions (McGrath et al., Reference McGrath, Al-Hamzawi, Alonso, Altwaijri, Andrade, Bromet, Bruffaerts, de Almeida, Chardoul, Chiu, Degenhardt, Demler, Ferry, Gureje, Haro, Karam, Karam, Khaled and Kovess-Masfety2023; Solmi et al., Reference Solmi, Radua, Olivola, Croce, Soardo, Salazar de Pablo, Il Shin, Kirkbride, Jones, Kim, Kim, Carvalho, Seeman, Correll and Fusar-Poli2022). Indeed, a UK national health survey reported that between 1995 and 2014 the prevalence of long-lasting mental health conditions increased up to sixfold across children, adolescents, and young adults (Pitchforth et al., Reference Pitchforth, Fahy, Ford, Wolpert, Viner and Hargreaves2019). While part of this trend may be attributed to an increased awareness and reduced stigma surrounding mental health, the growing burden of mental health problems faced by vulnerable young people and COVID-19 as a potential amplifier of these difficulties must be considered by mental health services. To appropriately inform these services a more nuanced understanding of risk and protective factors is needed. For instance, within the same sample, we recently demonstrated that assessing the severity of different CA dimensions aids in specifying neural mechanisms underlying mental health vulnerability (König et al., Reference König, Berhe, Ioannidis, Orellana, Davidson, Kaser, Moreno-López and van Harmelen2023). Furthermore, the experience of social relationships changed during the COVID-19 pandemic with individuals turning to more remote methods of communication (Ofcom, 2020). From a policy perspective, it will be important to critically investigate the effectiveness of online tools, such as social media, to buffer against negative mental health effects in vulnerable young people (Orben et al., Reference Orben, Tomova and Blakemore2020; Ruggeri et al., Reference Ruggeri, Stock, Haslam, Capraro, Boggio, Ellemers, Cichocka, Douglas, Rand, van der Linden, Cikara, Finkel, Druckman, Wohl, Petty, Tucker, Shariff, Gelfand, Packer and Willer2023).
In conclusion, we showed that young people with CA reported a significant increase in depression symptoms following the COVID-19 outbreak and that high-quality friendship support buffered these symptoms through reducing perceived stress. A history of CA in combination with exposure to pandemic-related stress was found to contribute to an attenuated social support network, consequently increasing the risk for mental health problems. Therefore, psychosocial interventions targeting stress (re)appraisals or aimed at fostering stable and supportive friendships could enhance resilience in young people with CA, especially during times of multidimensional stress.
Supplementary material
For supplementary material accompanying this paper visit https://doi.org/10.1017/S0954579424001986
Availability of data and materials
Upon publication, all R scripts and pseudonymized data will be made available on DataverseNL. To facilitate the blind peer review process, R scripts and pseudonymized data are temporarily available on OSF: https://osf.io/mdqgr/?view_only=54716c69fa964f4b82b805af52248678.
Acknowledgements
The authors would like to thank all members of the study team as well as all adolescents and young adults who participated in the study.
Author contributions
M König: Conceptualization, Methodology, Validation, Formal analysis, Data curation, Visualization, Writing - original draft. AJS: Investigation, Project administration. LML: Investigation, Project administration. ED: Investigation. MD: Investigation. SO: Investigation. EMM: Formal analysis. TSP: Supervision. M Kaser: Investigation. KI: Investigation. ALvH: Conceptualization, Investigation, Methodology, Supervision, Funding acquisition, Writing - review & editing. All authors read and approved the final manuscript.
Funding statement
The Resilience after Individual Stress Exposure (RAISE) study and the Resilience after the COVID-19 Threat (REACT) study have both been funded by two grants from the Royal Society to ALvH (RGF\EA\180029 & RGF\R1\180064). This work was further supported by a Royal Society Dorothy Hodgkin fellowship (DH150176) and a VIDI grant from the Dutch Research Council (NWO; 2023/SGW/01507764) for ALvH as well as a Wolfe Health fellowship for LML. M König and ALvH were supported by the Social Resilience and Security program at Leiden University.
Competing interests
The authors have no competing interests to declare that are relevant to the content of this article. KI receives a stipend for editorial work from Elsevier.


 Open access