

Introduction
Since the beginning of the twentieth century, Europe’s rural population has declined significantly. In 1910, this population amounted to 185 million people, but in 1980 it had fallen to 155 million (Bairoch, Reference Bairoch1988). From then until the end of the first decade of the twenty-first century, it fell by a little over five million people. In around 1800, in preindustrial Europe, 88 per cent of the continent’s population was rural. Today, however, only approximately 25 per cent of Europeans live in rural areas (Collantes and Pinilla, Reference Collantes and Pinilla2011). Industrialisation and economic growth have, therefore, led to an intense urbanisation process. Initially, the demographic transition compensated the rural exodus to the towns with strong natural growth. Therefore, although the rural population was gradually accounting for a lower proportion of the total population, not only did it maintain its workforce but it grew in Europe as a whole until 1910. Since then, intense depopulation processes have taken place in a large part of the continent.
However, rural depopulation is far from being an exclusively European phenomenon or one that just relates to the global north. Weak economic growth until recent years in poor developing countries and their belated demographic transition have allowed their rural populations to continue growing to the present day. Nevertheless, there has been a strong decline in the percentage of the rural population of the total population. As certain emerging countries have gained higher rhythms of economic growth and urbanisation, they have also begun to experience rural depopulation. China is a paradigmatic case. Its extraordinary rate of economic growth in recent decades and the strong rural-urban migration is generating the emergence of situations of intense rural depopulation (Li, Reference Li2015; Gao et al., Reference Gao, Xu, Liu, Deng, Zeng, Ling and Wei2017; Wang et al., Reference Wang, Zhang, Yang, Yang and Hong2019).
If the demographic contraction or the abandonment of human settlements experienced intensely by developed countries could become a phenomenon affecting a much larger geographical area, learning about the trajectory and causes of rural depopulation in these countries can provide useful lessons for the future in the developing world.
The studies that have analysed demographic dynamics over the long term have improved our knowledge of the causes of these processes or their dynamics. In general, the study of the location of the population has been based on two principal theoretical approaches. On the one hand, it has been argued that geography (environmental or physical conditions) is the principal cause of the distribution patterns of the population (Beeson et al., Reference Beeson, Dejong and Troesken2001; Bosker, Reference Bosker and Buringh2017; Gallup et al., Reference Gallup, Sachs and Mellinger1999; Gallup and Sachs, Reference Gallup and Sachs2000; Rappaport and Sachs, Reference Rappaport and Sachs2003). Alternatively, the new economic geography has emphasised that the existence of increasing returns derived from the new economic activities together with industrialisation, while decreasing transport costs, provided conditions that stimulated processes of agglomeration in economic activity and the population (Duranton and Puga, Reference Duranton and Puga2004; Krugman, Reference Krugman1991a and Reference Krugman1991b; Michaels et al., Reference Michaels, Rauch and Redding2012; Fujita et al., Reference Fujita, Krugman and Venables1999; Henderson et al., Reference Henderson, Shalizi and Venables2001; Fujita and Thisse, Reference Fujita and Thisse2002). Another strand of the literature has focused on the effects of suburbanisation in population patterns (Baum-Snow, Reference Baum-Snow2007; Baum-Snow et al., Reference Baum-Snow, Henderson, Turner, Zhang and Brandt2020; Banerjee et al., Reference Banerjee, Duflo and Qian2020; Duranton and Turner, Reference Duranton and Turner2012).
However, the analysis of rural depopulation processes has received less attention (Collantes and Pinilla, Reference Collantes and Pinilla2011; Collantes, Reference Collantes2004, Reference Collantes2006 and 2001; Saville, Reference Saville1957; Cejudo and Navarro, Reference Cejudo and Navarro2022). Moreover, there is very little literature that has analysed the characteristics of the human settlements that have experienced a reduction, or sometimes a complete loss of their population.Footnote 1 The literature on depopulation has usually worked with administrative units, such as regions, provinces, districts or municipalities, as there is usually a greater availability of demographic and other data on these levels. However, people live in scattered houses, villages, towns or cities, and the characteristics of the settlements where they reside can be crucial for understanding the evolution of their population, particularly if we take into account that until recently, rural-urban emigration has been the principal reason explaining the demographic contraction of rural human settlements. Therefore, the specific characteristics of the human settlements, in terms of their geographical conditions, size, economic activity or provision of services, are essential for understanding their demographic dynamics.
Within this context, our objective is to research, in a first approach, the extent to which the characteristics of the different types of settlements are important to explain their demographic dynamics in situations of population decline and, therefore, which of these have been affected to a greater extent by the depopulation processes. In short, we seek to establish whether there has been a rural penalty for living in these types of nuclei, particularly in those that have certain characteristics.
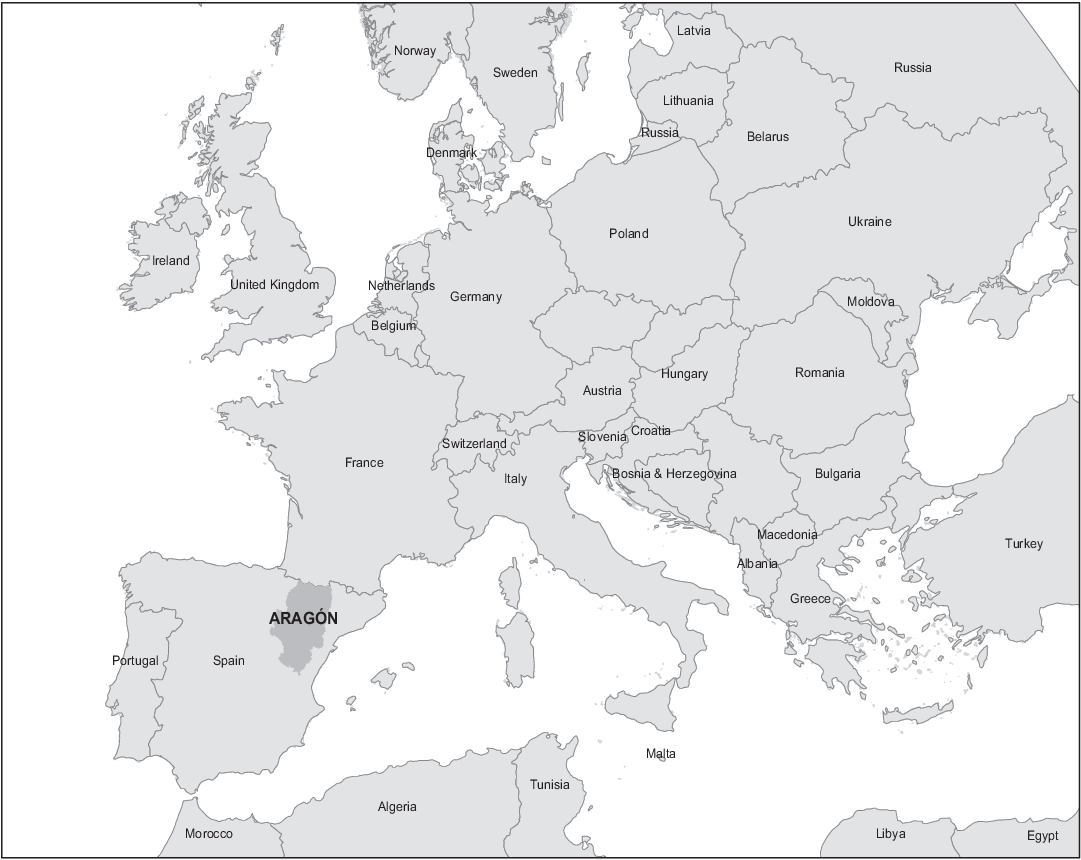
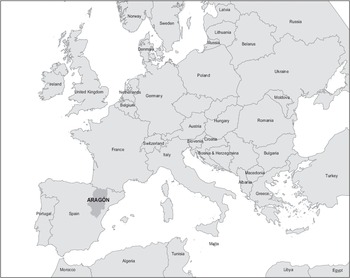
Given the difficulty involved in working at this level of population disaggregation, we have chosen Aragón as a case study (Figure 1). Located in north-east Spain, Aragón has a total area of 47,720 square kilometres and its population in 2001 was 1,294,225 inhabitants. Aragón is divided into three provinces: Huesca, the most northern province; Teruel, the most southern province; and Zaragoza, which is in the centre. In 2003, its population density was the twelfth lowest of all of the NUTS II units of the UE-25.Footnote 2
Location of Aragón in Europe.
This region experienced intense rural depopulation processes throughout the twentieth century. In the year 2000, of the thirty-three districts making up Aragón, twenty-five had a population of less than 1900. The absolute loss was over 25 per cent in twenty-two of them. The most extreme cases, with losses of over 50 per cent, occurred in eleven districts (Ayuda et al., Reference Ayuda, Pinilla and Sáez2000). As a result, twenty of these districts had a population density of less than ten inhabitants per kilometre.2 If Spain is a paradigmatic case of rural depopulation in Europe, we can therefore say that Aragón has been one of the regions affected by it.
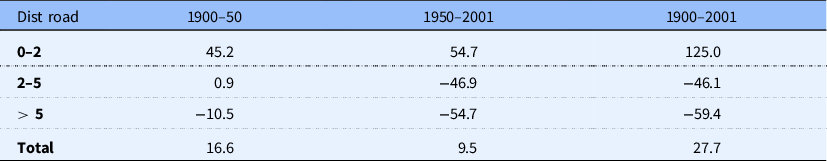
However, the case of Aragón is not exceptional in Spain, but like those of other interior regions of the interior or north (Table 1). Its principal difference is that its depopulation process began earlier. The extent of the mountainous areas in Aragón and its proximity to one of the principal Spanish migratory basins (Barcelona) explain this precocity, similar to that of other regions with similar characteristics (Ayuda and Pinilla, Reference Ayuda and Pinilla2002; Collantes, Reference Collantes2004 and Reference Collantes2009; Collantes and Pinilla, Reference Collantes and Pinilla2004; Molina, Reference Molina2002; Silvestre, Reference Silvestre2001). In the period of the most intense depopulation, between 1950 and 1991, the whole of rural Spain experienced similar depopulation processes.
Rural population change: Spain, agrarian regions, and Aragon (1900–2000) (cumulative annual growth rate)
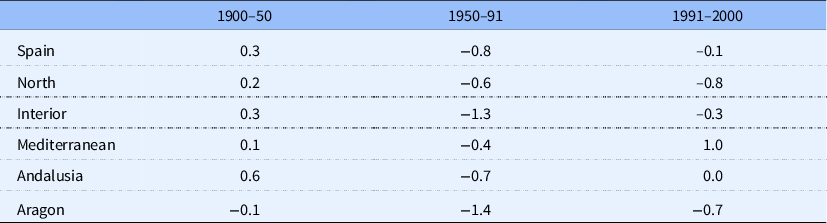
Source: Own calculation based on the annual population records of the National Statistics Office (INE). Includes only the population residing in municipalities, which throughout the whole period have a size smaller than 10,000 inhabitants. Details of the provinces included in each region can be found in the online supplementary material.
The choice of Aragón as a case study has some additional advantages. First, Spain is the European country for which the most extensive historical literature has been developed on depopulation (Banco de España, 2021; Camarero, Reference Camarero1993; Camarero et al., Reference Camarero, Cruz, González, del Pino, Oliva and Sampedro2009; Camarero and Oliva, Reference Camarero and Oliva2022; Collantes, Reference Collantes2004; Collantes and Pinilla, Reference Collantes and Pinilla2011 and Reference Collantes and Pinilla2019b; Goerlich and Mas, Reference Goerlich and Mas2006; Vidal and Recaño, Reference Vidal and Recaño1986). Second, Aragón has been the region on which the most studies on the estimation of depopulation have been published and also on depopulation from a historical perspective (Ayuda et al., Reference Ayuda, Pinilla and Sáez2000; Collantes and Pinilla, Reference Collantes and Pinilla2004; Esparcia, Reference Esparcia2008; Pinilla, Reference Pinilla1995; Recaño, Reference Recaño2002; Ruiz, Reference Ruíz1998).
Sources and methods
To construct the database that supports this study, the official census data have been used. The population censuses, published approximately every ten years since 1860, provide disaggregated data by municipality, the smallest administrative unit. However, as our objective is to analyse the dynamics of the population settlements that really exist, it is necessary to work with more disaggregated information. This is possible using the residential registers, which are published a few years after year census. They disaggregate the figures of the inhabitants of each municipality into the population units that really exist. For the population units of Aragón, these data were listed in a publication of the Statistical Institute of Aragón (2005), which provides information about the evolution of the population of each settlement between 1900 and 2001. However, one possible limitation of the study is the variation in the criteria with which these nomenclatures have classified the scattered population.
As our principal objective is to determine the importance that the type of settlement has for the evolution of its population, we have classified these settlements into three categories: principal entities (where the municipal administration is located); secondary entities (which form a municipality with the principal entity); and the population residing in homes scattered across the municipality. We have separated from the first category those settlements that have been provincial capitals as these towns have unique administrative characteristics.
We have also considered other characteristics of the population settlements that could influence their demographic dynamics. Therefore, we have taken into account their altitude, their initial size, their proximity to the nearest railway station (more or less than one hour on foot), their proximity to the nearest road (in kilometres) and their distance from the principal Aragonese city, Zaragoza. There is a major problem with these two distance variables as the data are not available for each settlement but only for each municipality. Therefore, their results should be read with caution. We have also taken into account which settlements were head of the judicial district.
After constructing the database, first we conducted a statistical analysis to explain the evolution of the settlements in accordance with their type and characteristics. This first estimate enables us to gain a fairly clear view of the relationship between depopulation and all of the characteristics of each nucleus. In a second phase, we have contemplated an econometric model with the objective of determining the extent to which, jointly, the characteristics of the settlements are important in explaining their demographic evolution. In our model, the dependent variable that we seek to explain is the evolution of the population throughout the twentieth century.
We have carried out this analysis for the whole of the period, that is 1900–2001 and for two subperiods: 1900–50 and 1950–2001. Not only is the division of the twentieth century symmetrical, but the two periods also correspond to two different types of economy. The first corresponds to a situation in which agriculture continued to be the principal source of employment in the context of an ongoing process of industrialisation; the second corresponds to the culmination of the industrialisation process and the configuration of an economy in which agriculture employed a very small percentage of the active population.
In the first half of the twentieth century, emigration from the rural areas of Aragón was significant, particularly between 1910 and 1930, and moved principally to three large cities: two outside of Aragón (Barcelona and Valencia) and the third, the regional capital, Zaragoza (Silvestre, Reference Silvestre2001). Foreign emigration, principally to America, was of secondary importance (Pinilla, Reference Pinilla2003). In the second subperiod, there was a strong intensification of migration, particularly until 1975. The previous destinations maintained their importance, although from 1955, the flows towards America stopped and other European countries became more relevant, but always much less important than domestic destinations as Barcelona, Valencia or Zaragoza (Pinilla, Reference Pinilla2003).
Due to the principal cause of the loss of population being the rural exodus, there are some limitations to the econometric analysis as we have not been able to include in the model all variables that could be important. Such variables are those that would enable us to explain the economic reasons for the migrations, such as the difference in earnings between the origins and destinations of the emigrants or the labour opportunities in the destinations.Footnote 3 There is extensive literature that has addressed this issue for Spain from a historical point of view, which has concluded that these income gaps were fundamental (Ródenas, Reference Ródenas1994; Sánchez Alonso, Reference Sanchez-Alonso2000; Silvestre, Reference Silvestre2001, Reference Silvestre2005; Collantes and Pinilla, Reference Collantes and Pinilla2011). Our analysis will enable us to broaden our knowledge on rural depopulation, as it focuses on other important reasons that explain it, such as the access to services depending on the characteristics of the places of residence of the population.Footnote 4
Theory
Why the population does not disperse uniformly across the territory of a country but tends to concentrate in certain points is a question that has been addressed extensively by the literature in recent decades, particularly driven by the rise of the new economic geography (Krugman, Reference Krugman1991a and Reference Krugman1991b; Fujita and Thisse, Reference Fujita and Thisse2002). In this respect, the majority of existing work has tended to focus on analysing urbanisation and the population dynamics of large cities (Duranton and Puga, Reference Duranton and Puga2004; Fujita et al., Reference Fujita, Krugman and Venables1999; Michaels et al., Reference Michaels, Rauch and Redding2012). However, what we can consider as the other side of the coin, that is, rural depopulation has been studied much less. From the mid-twentieth century, this depopulation has led to the decrease in the population density of wide rural areas to levels that the European Union considers as demographic deserts. In reality, there are very few studies that, from a long-term perspective, address rural depopulation processes and their causes in developed countries (see Saville, Reference Saville1957; Collantes and Pinilla, Reference Collantes and Pinilla2011). Many of the historical analyses of rural depopulation have focused on the European mountain areas, as these have been the areas that have experienced a more profound population loss (Collantes and Pinilla, Reference Collantes and Pinilla2004; Collantes, Reference Collantes2004, Reference Collantes2006 and Reference Collantes2009). The scarcity of long-term historical studies contrasts with the relative abundance of studies analysing the situation in which these depopulated rural areas now find themselves or the most appropriate policies for their possible revitalisation.Footnote 5
First it is necessary to clarify precisely what we mean by rural depopulation. Specifically, it refers to a situation in which the population of rural areas or the rural settlements contracts. In other words, it is a process of a declining population that occurs in a sustained way in a specific period of time. These rural depopulation processes can be explained initially by the exodus of large quantities of the rural population during the industrialisation process to the expanding cities and also to other countries. While the first phase of the demographic transition was taking place, the considerable natural growth of the population compensated these losses. However, when this transition reached the final stages, the net outgoing population (negative migratory balance) exceeded the natural growth (births less deaths) by far, which led to the contraction of the population. Even when this rural-urban migration ended or slowed significantly, the depopulation processes continued, as one of the consequences of rural emigration is the ageing and masculinisation of the remaining rural population, which perpetuates the demographic decline (Camarero, Reference Camarero1993; Ayuda et al., Reference Ayuda, Pinilla and Sáez2000).
As the industrialisation processes and the demographic transition have occurred at different paces in the global north, their depopulation processes have also taken place between different dates, ranging from the earliest in England and France starting in around 1860 and lasting until 1901 in the English case and in 1975 in France, to the latest countries, such as Spain, Italy, Romania or Poland, which began their depopulation processes after 1950 (Collantes and Pinilla, Reference Collantes and Pinilla2011). Of course, if, instead of considering the rural population of the whole country we conduct a more disaggregated analysis on a regional level, the time frames and case studies are much more varied.
In any event, we can formulate a theoretical explanation to understand the rural depopulation processes in developed countries.
The first part of the explanation fully coincides with the theories that have explained the migrations based on the so-called disequilibrium models. That is, the rural populations emigrated to the urban centres, where modern industry was located (or to other continents or countries), seeking to improve their income and employment opportunities (Todaro, Reference Todaro1969; Grenwood, Reference Greenwood1997; Hunt, Reference Hunt1993). On the one hand, modern growth opened a progressively wider gap between urban and rural incomes, giving rise to massive population movements of people seeking better-paid jobs (Silvestre, Reference Silvestre2005). In the same way, the mass emigration from Europe to other continents during the first globalisation can be explained by the wage gap existing between the countries in the New World (the United States, Canada, Argentina, Australia, New Zealand …) and those of the old European continent (Hatton and Williamson, Reference Hatton and Williamson2005). On the other hand, industrial and urban growth generated a rapidly expanding labour market that offered new opportunities to the rural populations. The progressive modernisation and mechanisation of the agriculture of developed countries facilitated and boosted rural-urban migrations as it was possible to substantially increase agricultural production with a declining agricultural population (Federico, Reference Federico2005).
As such, on the European continent between 1950 and 2005 the active agricultural population declined from 66.8 million people to 14.2 million, while net agricultural production grew between the same years from 94,412 million US dollars to 193,760 million (at 1999–2001 prices). Consequently, labour productivity in European agriculture multiplied tenfold in this period (Martín-Retortillo and Pinilla, Reference Martín-Retortillo and Pinilla2015). In some countries, when non-agricultural jobs were generated in rural areas in industry or services, the population loss was lower.
A second part of the explanation for rural depopulation, particularly important after 1950 and parallel with the construction of modern European welfare states, resides in the gap that opened between the rural and urban environments with respect to accessing public and private services (Clout, Reference Clouth1976). When access to secondary and tertiary education was no longer a privilege of the highest income segments of the population, rural families emigrated in order to provide a better education for their children and increase their economic possibilities. In the same way, when healthcare was offered by the public health systems, the concentration of their services in certain places also widened the gap of opportunities for those who continued living in small rural settlements. In general, the welfare state increasingly provided public services that families considered as essential. If those who lived in the rural environment believed that this was a disadvantage to continue residing there, this was another reason to emigrate (Collantes and Pinilla, Reference Collantes and Pinilla2011; Pérez Díaz, Reference Pérez Días1967; Faus, Reference Faus1986). As well as the access to public services, access to private services was lower in the rural areas than the urban centres, which reinforced the incentives to emigrate.
Finally, when the entry of women into extra-domestic labour markets began to grow, the opportunities offered by the cities or larger populations were greater than those in the villages where agriculture continued to be the principal source of employment. Therefore, many rural women considered that emigrating to the cities opened employment and personal horizons that were not within their reach in the rural areas (Camarero, Reference Camarero1993; Camarero et al., Reference Camarero, Castellanos, García and Sampedro2006). In this way, women attempted to mitigate the existence of a gender penalty in rural well-being. Their income was lower than that of the men due to their lower access to the labour market and the lower paid jobs that they performed (García Sanz, Reference García Sanz1997). There was also a gender bias in the distribution of domestic tasks that was even greater than in the cities (García-Ramón, Reference García-Ramón1997).
Many of the studies cited at the beginning of this section analyse rural depopulation in the light of these theoretical paradigms, but have principally examined national and regional cases. Some have deepened the analysis to the municipal level, which, in general, reveal population losses inversely proportional to the size of these municipalities.Footnote 6 However, to date, there has been no theoretical analysis that explains why certain types of rural settlements have suffered greater population losses than others.
It is important to take into account, first, that the urban network in Spain at the beginning of the twentieth century was formed over the course of many centuries of history, principally the medieval period, although it underwent subsequent transformations. Two factors were crucial for this configuration. First, in a predominantly agricultural economy, preindustrial transport technology obliged the places of residence to be located close to the cultivated land or cattle pastureland. It was not feasible to frequently make trips of more than one day. Second, in the case of the Iberian Peninsula, the conquest of the lands under Islamic control by the Christian kingdoms also affected the foundation or disappearance of population nuclei (Beltrán et al., Reference Beltrán Tapia, Díez-Minguela, Martínez-Galarraga and Tirado Fabregat2020).
The beginning of the industrialisation process profoundly altered the pre-existing urban network, as the rapid growth of certain nuclei contrasted with the slower growth of others or with the stagnation or loss of population of certain places (Esparcia, Reference Esparcia2008). The key to understanding these vastly different dynamics resides in understanding the location advantages of each settlement for expansion, particularly, of non-agricultural activities.
The location advantages of certain settlements could be derived from their geography, particularly when they were close to communication networks, such as railways, canals, ports or roads (Rappaport and Sachs, Reference Rappaport and Sachs2003; Beeson, Reference Beeson, Dejong and Troesken2001). Furthermore, the location of settlements in places difficult to access or with complex agro-climate conditions for the primary sector was particularly unfavourable, for example, when they were located at a high altitude or on steep slopes (Gallup et al., Reference Gallup, Sachs and Mellinger1999; Gallup and Sachs, Reference Gallup and Sachs2000).
The new economic geography has also addressed the different opportunities that arose with industrialisation for the different population nuclei, although it has mainly focused on the size of the cities and their growth dynamics. Its explanation is based on the advantages of agglomeration or the increased returns for the installation of economic activities. In this respect, the smaller the population nuclei, the lower their possibilities of becoming the destination of the new industries. The new economic geography has sought to demonstrate that the concentration of economic activity from the beginning of industrialisation responds principally to the advantages that firms could obtain, increasing their productivity, if they installed their facilities close to their markets, their suppliers and their competitors (Krugman Reference Krugman1991a and Reference Krugman1991b; Fujita and Thisse, Reference Fujita and Thisse2002). Only when there were clear cost advantages in establishing the facilities close to crucial resources, such as mining deposits, did the patterns of concentrating the activity go against this logic.
The agglomeration and concentration of economic activities required a substantial reduction in transport costs to make it possible. The railway was one of the key elements that facilitated the reduction in land transport costs until around the time of the Second World War and even later in the case of goods transportation (Bogart et al., Reference Bogart, Álvarez-Palau, Satchell, Shaw-Taylor and You2017, Esteban, Reference Esteban2021). The roads and motor vehicles, such as cars or lorries, became more important later.
Access to public and private services, as previously mentioned, is considered as being essential for explaining rural depopulation. Obviously, we cannot assume that there was a homogeneous distribution of these services across the territory. They tended to be concentrated in certain towns, with their degree of dispersion depending on the fixed costs implied in the provision of the service. We can confirm that the settlements where these services were located had an advantage.Footnote 7 Obviously, the cities were in the best possible situation as this is where the services were usually installed first. But small settlements had, to a highly variable degree, educational, healthcare, administrative or retail services. In some cases, a weak access to services could be compensated when the settlement was located close to a large city, which enabled better access to them.Footnote 8 Therefore, it is reasonable to consider that a lower availability of these services stimulated the process of the loss of inhabitants of those human settlements in a more unfavourable situation (Pérez Díaz, Reference Pérez Días1967; Santillana, Reference Santillana1981; Faus, Reference Faus1986; Collantes and Pinilla, Reference Collantes and Pinilla2011).
Considering all of this, our theoretical hypothesis is that the variation in the population of the different types of settlements depended on their initial size, their geographical location, their proximity to large cities and the availability of public and private services. To confirm this hypothesis, first we will use statistical data that explain the depopulation process of the settlements in the territory under study, according to the characteristics that we have indicated. Although the simple statistical data provide strong results, subsequently, we will seek a more robust confirmation of our hypothesis, considering an econometric model in which the evolution of the population of the different settlements depends on: their altitude, distance from the nearest railway station and road; initial size; type of settlement, distinguishing between the principal entity of the municipality, the secondary entities and the scattered population; whether the nucleus is the home of the justice courts or not; and the distance to the city of Zaragoza, the only large city of the region.
Due to a lack of data for the settlements, we cannot consider their economic specialisation or the earnings of their populations, which, combined with the expected income in the migratory destinations would explain a large part of the rural exodus, as indicated by many studies (García Ferrer, Reference García-Ferrer1979; Santillana, Reference Santillana1981; Bentolila and Dolado, Reference Bentolila and Dolado1994; Ródenas, Reference Ródenas1994; Juarez, Reference Juarez2000). In our case, we are assuming that for the emigrants, the income gap between the origin and destination and the displacement costs were the same for all types of settlement (Boyer and Hatton, Reference Boyer and Hatton1997). Despite the challenge that this poses, it enables us to examine the relevance of the characteristics of the different types of settlement.
Results
In 1900, the rural population of Aragón was distributed across a large number of settlements. Many of them, around two-thirds, were also the principal entity of their municipality. The three provincial capitals, and only important cities, accounted for a small percentage of the total population (12.3 per cent – see Table 2). The vast majority of the population, therefore, lived in settlements that we can consider as small. The urban network extended across a very large territory, so the population density of the majority of its districts was low, fluctuating between ten and twenty-five inhabitants per square kilometre (Ayuda et al., Reference Ayuda, Pinilla and Sáez2000). More than 50,000 people resided in scattered rural settlements. These were agri-livestock farms that were particularly prevalent in mountainous areas, although not exclusive to them. A family resided in each farm. (Ruiz, Reference Ruíz1998; Hernández, Reference Hernández2005 and Reference Hernández2008). The production of these farms was adapted to their environmental conditions; therefore, the weight of the different activities could vary. Self-consumption was prominent, but they also had commercial relations with the outside for the sale of their surpluses or the purchase of goods that they did not produce. They were distributed across the territory that they farmed, and they were often far from the villages, as their location was highly conditioned by geographic factors.
Number and population by types of settlement
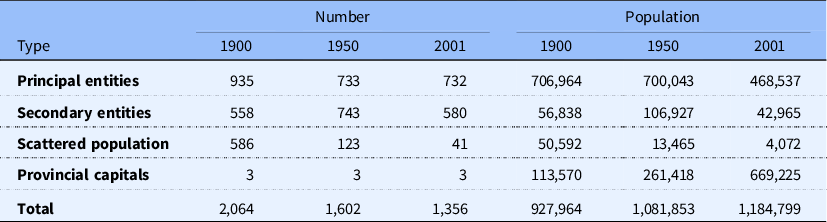
Note: For 1900, each entity is considered to belong to a certain type if it remained as such for more than half of the period 1900–50. For 1950 and 2001, each entity is considered to belong to a certain type if it remained as such for more than half of the period 1950–2001. Therefore, it is not possible to compare the population in this table between the different years, as the status of many settlements changed.
Source: Authors’ own elaboration based on Instituto Aragonés de Estadística (2005).
The administrative reorganisation processes taking place throughout the century led to the merger of a large number of small local councils with other larger ones. Therefore, the number of principal entities decreased significantly (by around two hundred).
Between 1900 and 2001, all types of settlement lost population in Aragón, except the provincial capitals (Table 3). The contrast between the latter, which increased their population by 489 per cent, and the demographic decline of the rest is striking. Maximum losses corresponded to the scattered population that practically disappeared, as it declined by 92 per cent. The studies on depopulation do not usually indicate that the phenomenon affected the scattered population much more than that living in concentrated nuclei (Infante-Amate et al., Reference Infante-Amate2016; Infante-Amate and Martínez de la Fuente, Reference Infante-Amate and Martínez de la Fuente2018; Ruiz, Reference Ruíz1998). Within these, the losses were more pronounced in the secondary entities (-44 per cent) than in the principal entities (-32 per cent).
Variation in the Aragonese population in accordance with the types of settlement (%)
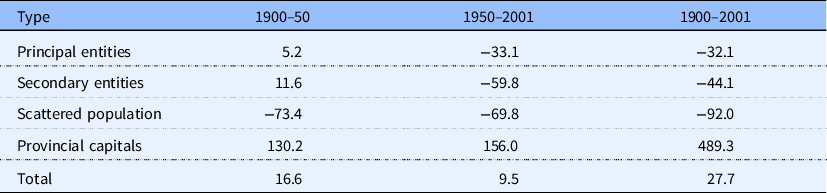
Note: Each entity is considered to belong to a certain type if it remained as such for more than half of the period considered. See the supplementary material for the absolute values of variation in the population used to calculate the percentage variation in the article.
Source: Authors’ own elaboration based on Instituto Aragonés de Estadística (2005).
In the first half of the twentieth century, depopulation only affected the scattered population, as all the other types of settlement gained population, although with the exception of the provincial capitals, the gains were very small. By way of contrast, in the second half of the twentieth century, the losses were high in all settlements, apart from the provincial capitals. The maximum loss was in the scattered population (-70 per cent), followed by that of the secondary entities (-60 per cent) and that of the principal entities (-33 per cent). The population losses, therefore, varied greatly between the different types of settlement. In many cases, the population losses were so intense in this period that many settlements, both concentrated and dispersed, were left without any inhabitants. These are what we refer to today as abandoned villages (Acín and Pinilla, Reference Acín and Pinilla1995).
Table 4 shows that there was an inverse relationship between demographic growth and the size of the nuclei. Those with less than 5,000 inhabitants lost population over the whole century and this loss was greater for the smallest settlements. The growth was more positive for the settlements with more than 5,000 inhabitants and higher for the largest. This perception does not change if we analyse the two halves of the twentieth century separately. In both halves, there is an inverse relationship between the growth of the population and the size of the settlements. Between 1900 and 1950 only those settlements with less than 1,000 inhabitants lost population.
Variation in the Aragonese population in accordance with the size of settlement (%)
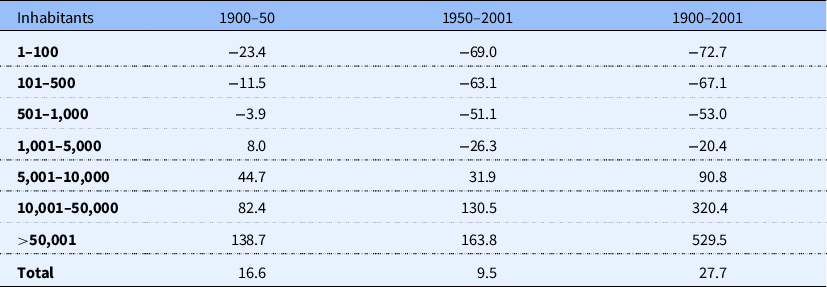
Note: We have considered that each entity belonged to the category to which it corresponded at the beginning of each period.
Source: Authors’ own elaboration based on Instituto Aragonés de Estadística (2005).
Table 5 shows that there was an inverse relationship between altitude and demographic growth. Only the overall population of settlements located between 0 and 500 metres grew and the demographic contraction was the highest for those located at an altitude of over 1,000 metres. The settlements at over 500 metres lost population in the twentieth century overall and in the two subperiods into which we have divided it.
Variation in the Aragonese population in accordance with the altitude of the settlements (metres) (%)
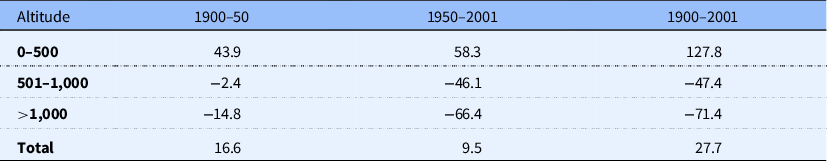
Source: Authors’ own elaboration based on Instituto Aragonés de Estadística (2005).
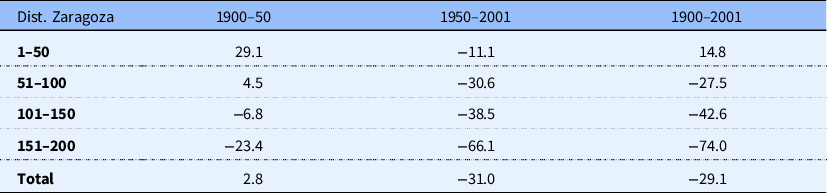
The distance to Zaragoza, the only city of the region that had more than 100,000 inhabitants throughout the century, also seems to be an element that influenced the variation in the population (Table 6). If we classify the settlements in accordance with their distance to Zaragoza, all of the settlement groups lost population, except those located within less than 50 kilometres from this city. Furthermore, the further away the settlement from Zaragoza, the greater the population loss.
If we classify the settlements in accordance with their distance from the nearest railway station, those that are located more than an hour away by foot lost population, while those that were closest gained population (Table 7).
Variation in the Aragonese population in accordance with the distance from the nearest railway station (%)

Note: The table indicates whether the distance by food to the nearest railway station was more or less than one hour in 1900. For the period 1950–2001, we have considered the distance from the railway station in 1930.
Source: Authors’ own elaboration based on Instituto Aragonés de Estadística (2005).
The data in Table 8 show that being located far from a road was a disadvantage and favoured population loss.
Variation in the Aragonese population in accordance with the distance to the nearest road (kilometres) (%)
Note: The table indicates the distance to the nearest road in 1912 and 1940.
We can deepen our analysis if we move from the description of demographic trends to the joint analysis of the factors determining the evolution of the population in the different types of settlements. The econometric model contemplated in Table 9 shows the importance of each of them in each sub-period and in the period of a whole and the sign of their effects.
Determinants of the variation in the population of the settlements in Aragón (1900–2001)
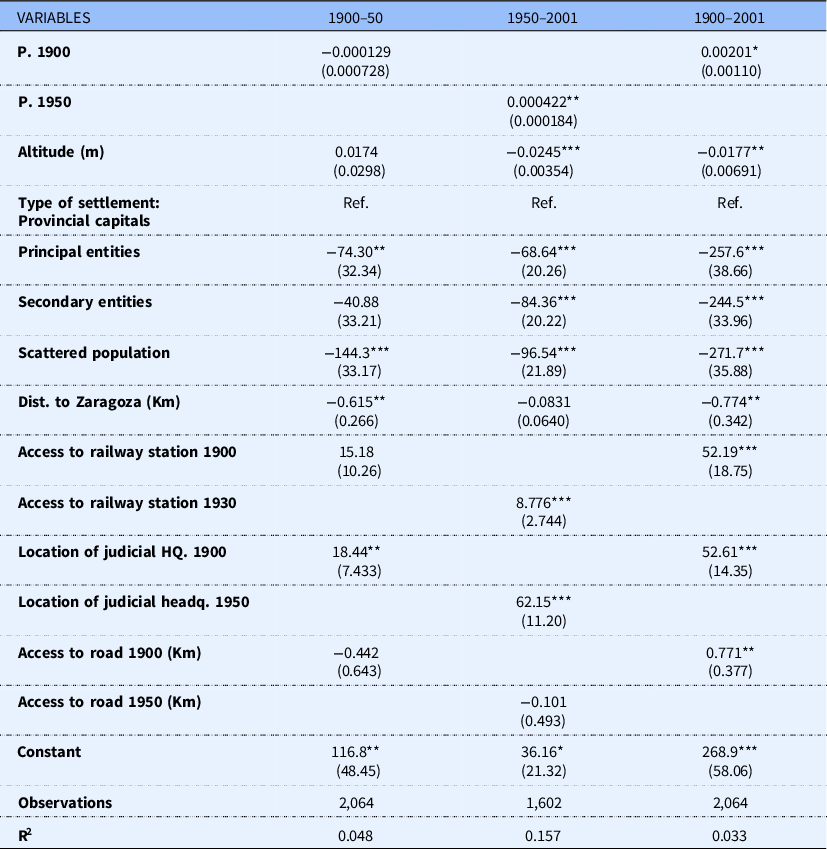
Note: *OLS estimates with heteroskedasticity robust standard errors in parentheses. The dependent variable is the rate of variation of the population in each period in percentage form. ***p<0.01, **p<0.05, *p<0.1.
**P1900: number of inhabitants in 1900; P1950: number of inhabitants in 1950; to avoid the problem of the dummy variables tramp, the principal entities have been taken as a reference category; the distance to Zaragoza is measured in km; the accessibility to a railway station is measured with a dummy variable that takes the value of 1 if the entity was less than one hour on foot from the railway station in 1900 and 0 otherwise, for the first subperiod or for the whole period and in 1930, for the subperiod 1950–2001. The variables Judicial district headquarters_1900 and Judicial district headquarters_1950 are also dummy variables that take the value of 1 if the entity was the judicial district headquarters in the corresponding year and 0 otherwise. The accessibility to a road (access to road 1900 and access to road 1950) is measure as the distance in km to a road.
If we begin with the model for the twentieth century as a whole, the results show that the type of settlement was decisive in explaining the greater growth of the provincial capital (the omitted variable) and a lower growth in all cases, particularly for the scattered population. Being the judicial headquarters, which is an indicator of the availability of other services or administrative bodies, favoured the growth of the population. These results apparently only allow the partial validation of our hypothesis, as the difference in the demographic growth between principal and secondary entities is not important. However, when we examine the models for each of the two subperiods, we can observe that from 1950 the type of settlement was much more decisive. All types of entities, except the provincial capitals, lost population in this period, but the influence of the type of settlement on this loss seems to follow a gradient: lower for the principal entities, more for the secondary entities and much more for the scattered settlements. In general, all of the rural settlements had disadvantages compared to the cities, but in the second half of the twentieth century, not being the nucleus in which the municipal administration was located (secondary entities) led to a greater reduction in the population. It was a bigger disadvantage to live among the scattered population in the two subperiods, and an advantage to live in the provincial capitals and the nuclei where the courts were located.
The rest of the variables produce the expected results, confirming our hypothesis. The greater initial size favoured a greater/lesser growth/degrowth. Being located at a higher altitude produced a lower growth/higher degrowth. The greater distance to a railway station led to a lower growth/greater degrowth of the population. Only the proximity to a road is either insignificant in all periods or appears with a sign contrary to the century as a whole. As we have explained, given that the distance to a railway station and major road does not take into account the differences between the settlements of each municipality, we should take these results with extreme caution. Finally, the greater distance to Zaragoza gave rise to a loss of population/lower growth, although this variable was only significant before 1950.
Discussion
It is clear that the demographic growth of human settlements in Aragón depended largely on the economic activities that were developed in them and their capacity to generate employment and income. Our model cannot include this fundamental variable, as this information is not available for the level of disaggregation with which we are working or for other higher levels, as it only exists for the provinces. Therefore, our models obtain a lower explanatory power. This notwithstanding, we have sought to verify the importance that certain characteristics of these settlements had on their demographic dynamics. The results confirm the individual effects shown in the descriptive statistics that we have presented. We have also estimated models using the panel data methodology based on the information of all of the censuses and the results coincide (see supplementary material).
Our starting hypothesis was that the evolution of the population of the human settlements of Aragón, characterised by the loss of population for all groups of less than 10,000 inhabitants, not only depended on their first nature geographical advantage or location (altitude) and second nature geographical advantage or increasing returns (initial size) but the access to public services was also decisive. As it is impossible to determine the provision of services in each settlement, we have assumed that there was a relationship between the type of settlement (provincial capitals, principal entities, secondary entities, scattered population) and their availability.Footnote 9 Furthermore, being the headquarters of the judicial bodies reinforced this availability.
The study highlights that in the first half of the twentieth century, only the provincial capitals and nuclei with judicial bodies benefited in demographic terms due to a greater access to services. However, from 1950 two key events explain why the type of nucleus in which the population resided became more important. The construction of the welfare state was delayed in Spain, compared to other countries of Western Europe (Pons and Silvestre, Reference Pons and Silvestre2010). Until during the 1960s, decisive steps were not taken to form a social security system to offer free healthcare to the population as a whole, although it was mostly after 1980 when it was when it was achieved (Espuelas, Reference Espuelas2017).
Until 1942 the provision of health services was carried out privately. The local councils were obliged to hire doctors exclusively to treat people in a situation of extreme poverty.Footnote 10 The rest of the population used two systems to obtain access to healthcare. They either paid these doctors, who had low wages, each time they used their services, or paid a fixed consultation and treatment fee, which was a monthly payment enabling them to access the service whenever they needed it (Comelles et al., Reference Comelles, Perdiguero and Bueno2020). The rural doctors had to treat patients from the whole of the municipality and hospitals were only availability in towns of a certain size. In 1942, the Seguro Obligatorio de Enfermedad (SOE) (statutory sickness insurance) was introduced which only covered part of the wage earners, excluding farmers for many years. It was not until the introduction of democracy in 1977 and the passing of the general Social Security law in 1983 that the free access to health services became universal. This implied a change in the public health model and, logically, in that of the rural environment. In some villages, primary healthcare clinics were created, which is where the medical staff were concentrated. On certain days, the doctors travelled to dispensaries located in other village where there were no doctors to treat the patients. The new model concentrated healthcare due to the high fixed cost of the facilities and equipment and to form healthcare teams. Meanwhile, hospitals were only constructed in cities of a certain size (six in the whole of Aragón without counting those of the city of Zaragoza).
Although primary education was compulsory from the mid-nineteenth century, only a small minority had access to secondary education and the high schools were located in the provincial capitals or large towns (Vicente, Reference Vicente2011). In primary education, the local councils were responsible for hiring the teachers. There was a high number of schools, many of them being single unit schools with one teacher. The education law of 1970 profoundly reformed the education system. Many rural schools were removed, and a teaching model based on the segmentation of the students by grades, according to their age, was introduced. A logical consequence of this was the concentration of schools in the principal entities of the local councils and the closure of many of these when there were not enough students.Footnote 11 From the beginning of the 1970s, the secondary education schools expanded across the country and access to them increased considerably, with the new schools being located in entities of a certain size. In general, the accessibility to public services was highly uneven between different types of settlement. Moreover, as the process of rural depopulation progressed, some traditional public services, mainly primary education, were concentrated in the principal entities, while the secondary entities lost them (Morales, Reference Morales2013). The children of secondary entities often had to walk for more than one hour every day to the nearest school.
In the case of the population who lived in scattered settlements, their difficulties to access any type of services were remarkable (Hernández, Reference Hernández2008). The population who lived in these nuclei were also logically affected by the collapse of their way of life and traditional economy (Ruiz, Reference Ruíz1998). Access to private services was also, logically, easier in the principal entities (even more so in the provincial capitals and judicial headquarters). This is important because the health services were private until very late. Also, a good part of secondary education was provided by religious entities, which charged for their services and were only located in important entities. On the other hand, as indicated in other studies, economies of agglomeration gained importance for demographic dynamics, particularly when Spain’s industrialisation process intensified, especially after 1960 (Ayuda et al., Reference Ayuda, Collantes and Pinilla2010a and Reference Ayuda, Collantes and Pinilla2010b; Beltrán et al., Reference Beltrán, Díez-Minguela and Martinez-Galarraga2018).
In short, not only was it a disadvantage to live in a small place, at a high altitude or far from the communication networks, the population also assimilated that good access to education, healthcare or other services was decisive when making the decision of where to reside. Therefore, the greater rural exodus affected to a greater extent those settlements that had more unfavourable conditions. This disadvantage was more intense and felt earlier among the dispersed population.
Conclusions
This study sought to fill a gap in our knowledge regarding historical rural depopulation processes experienced by developed countries. Using data corresponding to all of the human settlements that existed in the chosen geographical focus, an approach that is rare in the literature, we have attempted to identify which of their characteristics help us to understand their unequal population declines within the context of territories which have experienced them as a whole.
Our results show that access to public services has played an essential role, particularly when the construction of the welfare state made the population feel that there was a penalty for residing in settlements where there were problems to access them. The provincial capitals benefited the most due to their greater provision of services. The principal entities, headquarters of the municipal administration, also had advantages over the secondary entities. Finally, the population living in scattered homes was the most adversely affected and therefore, that which emigrated to a greater extent, until this form of residence practically disappeared. What happened in Aragón is similar to the events of other regions. In Spain, the cases of Valencia and Andalusia also show a brutal decline of the scattered population and a concentration of the population in the principal entities (Beltrán et al., Reference Beltrán Tapia, Díez Minguela, Fernández Modrego, Gómez Tello, Martinez-Galarraga and Tirado Fabregat2022; Infante-Amate et al., Reference Infante-Amate2016; Infante-Amate, and Martínez de la Fuente, Reference Infante-Amate and Martínez de la Fuente2018).
The advantages of a better geographical location also favoured the settlements that enjoyed them as did the greater proximity to the communication networks. The initial size was also relevant, favouring a greater growth of the larger nuclei or a lower degrowth when this occurred.
Thus, this work has highlighted that when understanding depopulation processes, it is necessary to pay attention not only to economic factors, but also to access to public services or also cultural factors that we have not addressed here. The development of the welfare state increasingly made it possible to different localities to have a differential access to the public services offered by it. This was an additional reason for promoting rural exodus and, consequently, depopulation. People not only migrated to improve their economic situation, but also to be able to offer their families better education or health coverage. Thus, even sharing a similar economic situation, not all human settlements offered the same services. Therefore, depopulation did not affect them in the same way.
These results also show that in the study of depopulation, the analytical scale used is important. National and regional case studies need to be complemented by studies using smaller scales such as municipalities or ideally human settlements.Footnote 12
The article also has relevant policy implications. If access to services was important in explaining rural depopulation in the past, it is still fundamental today to understand the same phenomenon. Although rural emigration is no longer the main cause of depopulation, as negative vegetative growth is now more relevant, decisions on the place of residence of the population are strongly conditioned by access to public services. Adequate coverage of these services is therefore an essential part of any policy against depopulation.
Finally, the trajectory and history of the evolution of the population in the different types of settlement provide important lessons to predict what could occur in the future in developing countries, when their economic growth gives rise to phenomena similar to rural depopulation.
Supplementary material
To view the online supplementary material, please visit: https://doi.org/10.1017/S0956793323000031
Acknowledgements
We thank Guillermo Esteban for providing us with his data on the distance to the railway stations, and Mateu Morillas-Torné and Jordi Martí-Henneberg for the data on the distance to the roads. We are also grateful for the comments received from Luis Antonio Sáez and the participants in conferences ‘Rural Depopulation in Spain’ at the XVII Congress of the Society for the Study of Agrarian History (SEHA) (University of Salamanca, 2021) and Depopulation and Aglglomeration in turbulent times: threat or opportunity? (University Jaume I of Castellon, 2021). We are also grateful for the help and comments received from Fernando Collantes, Guillermo Esteban, Pau Insa, Francisco Marco, Adrián Palacios, Jeronia Pons, Javier Silvestre, Daniel Tirado and Margarita Vilar. The comments of the journal editor and two anonymous reviewers were also very helpful.
Funding
This work was supported by the Ministry of Science and Innovation of the Government of Spain (projects PGC2018-095529-B-I00 and PID2019-106822RB-I00), from the Department of Science, Innovation and Universities of the Government of Aragón (Consolidated Groups S40_20R and S55_20R, and project LMP92_21).


 Open access