


INTRODUCTION
A thorough understanding of the glacial hydrological system is important as it impacts the glacier dynamics (Cuffey and Paterson, Reference Cuffey and Paterson2010). The hydrological system influences glacial sliding (Iken and Bindschadler, Reference Iken and Bindschadler1986; Vincent and Moreau, Reference Vincent and Moreau2016), basal sediment deformation (Hart and others, Reference Hart, Rose and Martinez2011), ice creep (Duval, Reference Duval1977) and glacial erosion (Röthlisberger, Reference Röthlisberger1972). The glacier hydrology system impacts society with respect to hydropower generated from glacial meltwater (Beniston, Reference Beniston2012; Schaefli and others, Reference Schaefli, Manso, Fischer, Huss and Farinotti2019), and by producing glacial outburst floods as a result of accumulated water stored englacially or subglacially (Vincent and others, Reference Vincent2012).
Meltwater is routed to the ice margin through surface streams (supraglacial), through the glacier's interior (englacial) or along the ice/basement interface (subglacial) (Fountain and Walder, Reference Fountain and Walder1998). Englacial conduits route water from the surface to the glacier's bed, which directly impacts glacier sliding velocities and subglacial water pressure (Fountain and others, Reference Fountain, Jacobel, Schlichting and Jansson2005).
Englacial water flow modelling has been described theoretically by Shreve (Reference Shreve1972) and Röthlisberger (Reference Röthlisberger1972), and they state that englacial flow occurs through connected veins between ice crystals as a result of ice deformation. The downward percolation of water, through these connected veins, generates heat by viscous dissipation, therefore, resulting in an increased vein size and the formation of englacial conduits. With continued englacial water flow, an arborescent conduit network forms (Shreve, Reference Shreve1972). This theory is in agreement with the theory from Nye and Frank (Reference Nye and Frank1973), implying ice at the pressure melting point is permeable to water. However, a number of studies have challenged this claim, stating that glacier ice has limited permeability as a result of air bubbles acting as obstacles to englacial intergranular flow (Lliboutry, Reference Lliboutry1971; Raymond and Harrison, Reference Raymond and Harrison1975; Vallon and others, Reference Vallon, Petit and Fabre1976). Gulley (Reference Gulley2009) evaluated the englacial network theory suggesting that single arborescent englacial conduits as predicted by Shreve do not exist. Gulley (Reference Gulley2009) classified the englacial conduit formation in three broad categories; (1) incision and closure of supraglacial streams (‘cut and closure'), (2) exploitation of fractures and crevasses and (3) hydrofracturing. Despite the various englacial flow theories (Röthlisberger, Reference Röthlisberger1972; Shreve, Reference Shreve1972; Gulley, Reference Gulley2009), only a small number of englacial conduit observations exist within the literature; primarily through borehole observations, speleological techniques and geophysical methods (Plewes and Hubbard, Reference Plewes and Hubbard2001; Benn and others, Reference Benn, Gulley, Luckman, Adamek and Glowacki2009; Gulley, Reference Gulley2009).
Geophysical methods can be used to image and characterise the glacier's hydrological system. Active seismic and ground penetrating radar (GPR) surveys offer complementary information on the glacier's interior over large areas (Stuart, Reference Stuart2003; Navarro and others, Reference Navarro, Macheret and Benjumea2005; Irvine-Fynn and others, Reference Irvine-Fynn, Moorman, Williams and Walter2006; Garambois and others, Reference Garambois, Legchenko, Vincent and Thibert2016). Hydrological conditions at the bedrock/ice interface (subglacial flow) have been interpreted from several geophysical analyses in ice below the pressure meeting point, known as cold-ice (Moorman and Michel, Reference Moorman and Michel2000; Peters and others, Reference Peters, Anandakrishnan, Alley and Smith2007, Reference Peters2008). Similar studies were reported from ice conditions near the pressure melting point, known as temperate ice (Irvine-Fynn and others, Reference Irvine-Fynn, Moorman, Williams and Walter2006; Hart and others, Reference Hart, Rose, Clayton and Martinez2015).
Geophysical studies on mapping hydrological conditions within an ice body (englacial flow) are scarcer. A few results have been reported from cold ice bodies (Stuart, Reference Stuart2003; Bælum and Benn, Reference Bælum and Benn2011), but there are no papers from temperate glaciers, where geophysical results could be confirmed by borehole observations. To the best of our knowledge, there are only a few GPR studies on temperate ice (Arcone and Yankielun, Reference Arcone and Yankielun2000; Moorman and Michel, Reference Moorman and Michel2000; Hart and others, Reference Hart, Rose, Clayton and Martinez2015), where the interpretation was ambiguous because ground truth information from boreholes was lacking.
It is generally problematic to confirm englacial conduits through direct geophysical observations from the surface. This is due to their small structure, their short-lived nature and the difficulty in differentiating conduits from other englacial features using geophysical methods. Ice creep closure is governed by Glen's flow law rate factor, and the closure rate is enhanced with increasing ice temperature and increasing ice-water content (Glen, Reference Glen1955; Duval, Reference Duval1977). Therefore, the problem is particularly severe in temperate ice.
Several studies have investigated the glacier's hydrological system using borehole observations. Gulley (Reference Gulley2009) characterised englacial conduits formed along fractures by hydrofracturing and Fountain and others (Reference Fountain, Jacobel, Schlichting and Jansson2005) observed a fracture-dominated englacial hydrological system using a large network of boreholes, where englacial conduits were sparse. In contrast to geophysical measurements, borehole observations fail to obtain a spatially continuous distribution of the system, as they offer only single point measurements.
By combining comprehensive geophysical and borehole datasets we are able to detect and characterise englacial conduit networks. Difficulties arise in identifying and characterising englacial conduits using geophysical studies independently. For example, seismic potentially fails as a result of thin layer effects and GPR potentially fails as a result of scattering and absorption problems. Combined analysis, however, allows for an improved englacial network detection and interpretation. Finally, we can combine our in-situ borehole data with our geophysical data.
In this paper, we investigate an englacial conduit network on a temperate alpine glacier using high-resolution seismic, GPR and borehole observations for determining a conduit network's presence, depth, spatial extent and origin. During the summers of 2012, 2017 and 2018, several field experiments were conducted to image and quantify englacial conduits within the ablation area of the Rhone Glacier, Switzerland. We present seismic imaging results and use seismic amplitude analyses for characterising the englacial conditions. Finally, we discuss the spatial extent of the englacial conduit network from GPR imaging and the englacial conduit's characteristics from the use of borehole observations within the conduit.
SURVEY SITE
The Rhone glacier is a temperate glacier located within the central Swiss Alps at the eastern end of the Rhone valley. It is one of the most intensively studied glaciers in the Swiss Alps, starting with records of frontal observations dating back to the beginning of the 17th century (Mercanton, Reference Mercanton1916) and geodetic measurements dating back to the late 19th century (Stroeven and others, Reference Stroeven, Van de Wal and Oerlemans1989). The glacier flows southwards from 3556 to 2208 m above mean sea level (AMSL) with a total ice volume of 2.11 ± 0.38 km3 (Farinotti and others, Reference Farinotti, Huss, Bauder and Funk2009) and a surface area of 16 km2 (Bauder and others, Reference Bauder2017). A proglacial lake formed in 2005 as a result of the retreating glacier (Tsutaki and others, Reference Tsutaki, Sugiyama, Nishimura and Funk2013), which will continue to increase in size (Church and others, Reference Church, Bauder, Grab, Hellmann and Maurer2018) with the continued retreat of the glacier. The proglacial lake's elevation is held constant at ~2208 m AMSL as a result of a granite riegel damming the lake and there is likely a hydrological interaction between the lake and the glacier's hydrological system. The Rhone Glacier's proglacial lake is a potential candidate for hydropower generation as a result of the expanding lake (Tsutaki and others, Reference Tsutaki, Sugiyama, Nishimura and Funk2013; Church and others, Reference Church, Bauder, Grab, Hellmann and Maurer2018).
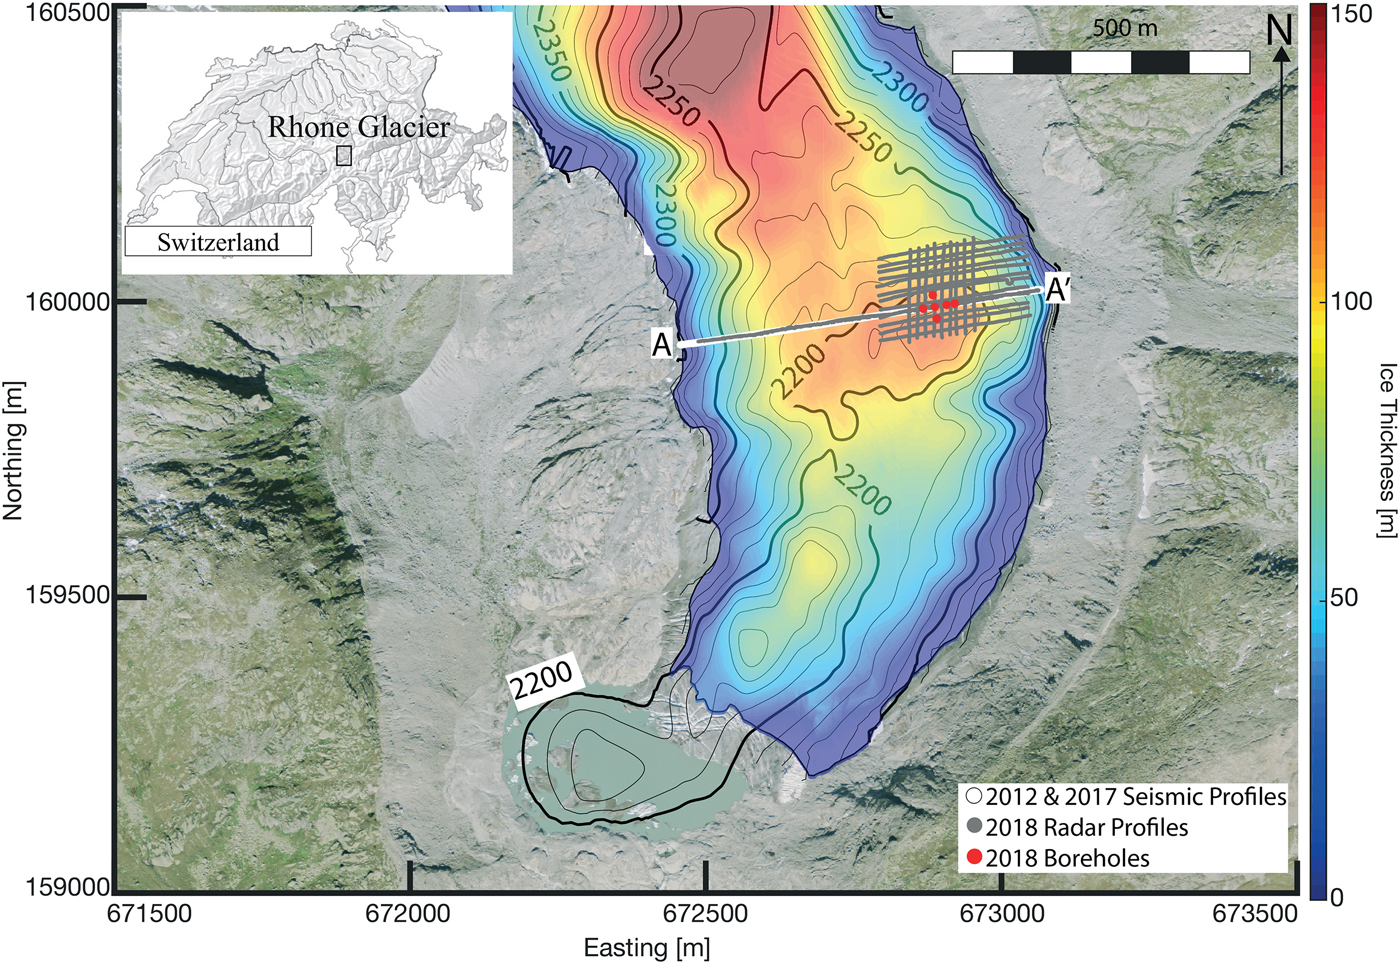
We conducted our investigation within the glacier's ablation zone between 2280 and 2350 m AMSL. A high-resolution basal topography map obtained from helicopter-borne GPR investigations (Church and others, Reference Church, Bauder, Grab, Hellmann and Maurer2018) is shown in Figure 1. It indicates that the survey site is situated within a local glacial overdeepening.
Rhone Glacier ablation area, showing the 2012 and 2017 seismic profiles (labelled A-A'), 2018 ground penetrating radar surveys and the 2018 boreholes. Bedrock topography indicated with contour and ice thickness by colour map, both obtained from heliborne GPR in a previous study by Church and others (Reference Church, Bauder, Grab, Hellmann and Maurer2018).
FIELD MEASUREMENTS
Seismic reflection surveys
In September 2012 we acquired a seismic reflection profile, 624 m long, perpendicular to the ice flow (Fig. 1; white line). In August 2017, we additionally acquired a coincident seismic profile, 591 m in length, to investigate the changes in the ablation zone between the two surveys. The aim of the surveys was to provide high-resolution high-fidelity seismic datasets for imaging both the bedrock and any potential englacial features.
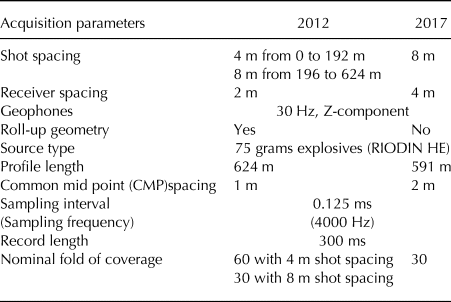
We altered the acquisition in 2017 configuration (Table 1) after the 2012 seismic campaign to increase acquisition efficiency. Difficulties arose planting the single component geophones into the ice and maintaining vertical geophone orientation during both surveys. We addressed these difficulties by acquiring the data during the coldest period of the day (typically 0800--1300), when little surface melt was present, to avoid the geophones toppling within their drilled holes. Additionally, we replanted the geophones throughout the day in order to maintain vertical orientation by using a mechanical drill to drill 3–5 cm deep vertical holes within the ice and with a 5–6 mm diameter. We employed 75 g of explosives as seismic sources and placed them in 1 m deep mechanically drilled holes before backfilling with ice. We have chosen explosives in order to provide a broadband source wavelet (1500 Hz maximum frequency) and to ensure good signal to noise ratios also at large offsets.
Seismic acquisition parameters
Ground penetrating radar acquisition
In July 2018, we acquired GPR profiles over the area of interest within the lower ablation area (Fig. 1; grey lines) using a PulseEKKO Pro system with 25 MHz antennas. We carried the antennas by hand at a constant elevation above the ice surface with 4 m separation between the transmitting and receiving antennas. The antennas were orientated parallel to the flow in order to generate stronger and more coherent bedrock and englacial reflections (Langhammer and others, Reference Langhammer, Rabenstein, Bauder and Maurer2017). A high precision global navigation satellite system (GNSS) continuously recorded the GPR antennas mid-point.
Borehole acquisition
In addition to the geophysical experiments, a borehole campaign was undertaken in July 2018 to penetrate into possible englacial conduit systems. We drilled six boreholes in and around the zone of interest using a hot water drill (Iken and Bindschadler, Reference Iken and Bindschadler1986) on 21 and 22 July 2018 (Fig. 1; red points). The drilling speeds were in the range of 75–100 m h−1 to ensure boreholes were vertical and the borehole diameters were ~0.15 m. We determined the total borehole depth by using a tape measure attached to a weight. The inclination of the boreholes was measured using an inclinometer to ensure the boreholes were vertical. Subsequently, we lowered a GeoVISIONTM Dual-Scan borehole camera from Allegheny Instruments, into the borehole to make direct observations of possible englacial conduit conditions.
DATA ANALYSIS AND RESULTS
Seismic
Seismic processing
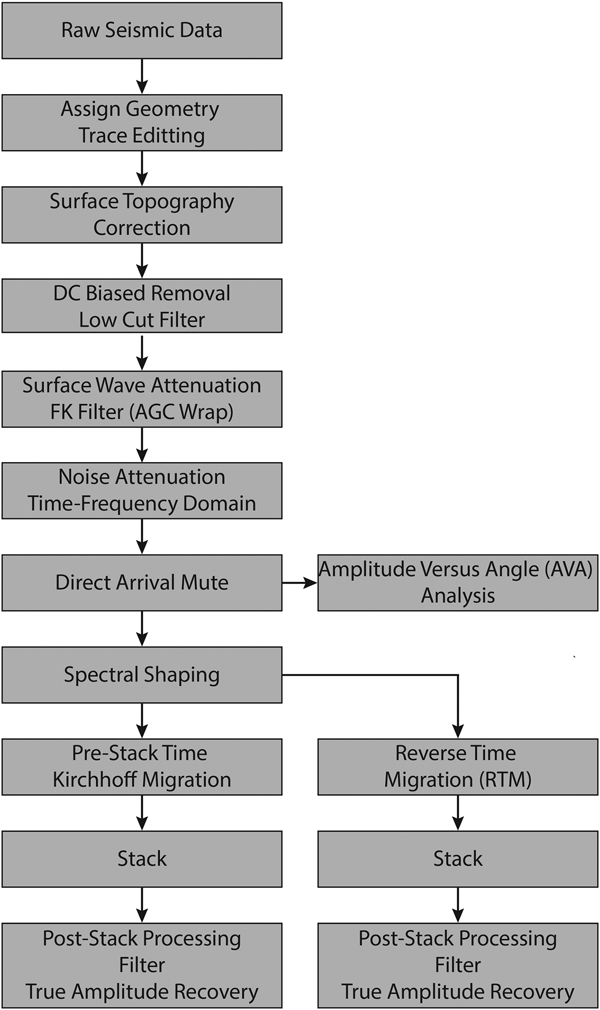
We processed the data for imaging and amplitude analysis using SeisSpace ProMAX 2-D. For both seismic datasets, we employed a processing workflow as shown in Fig. 2. It includes two output datasets: (1) amplitude analysis with minimal data processing applied, and (2) for basal and englacial imaging. The seismic pre-processing included correcting for surface topography, attenuating the various noise types within the data and shaping the frequency spectrum. Noise suppression included trace editing, low cut filtering, surface wave attenuation, time-frequency domain filtering and direct arrival muting. The surface waves were attenuated using a frequency-wavenumber (FK) filter, with an automatic gain control (AGC) applied prior to filtering and removed after the filter application. We applied a 2:1 trace interpolation prior to surface wave attenuation on the 2017 dataset to unwrap the spatially aliased energies as the receiver spacing was increased between the 2012 and 2017 seismic acquisitions. Our choice of velocities was determined through conventional velocity analysis on common midpoints using semblance picking. A constant ice-velocity model of 3700 ms−1 was identified to be appropriate for the migrations.
Seismic processing workflow for 2012 and 2017 datasets.
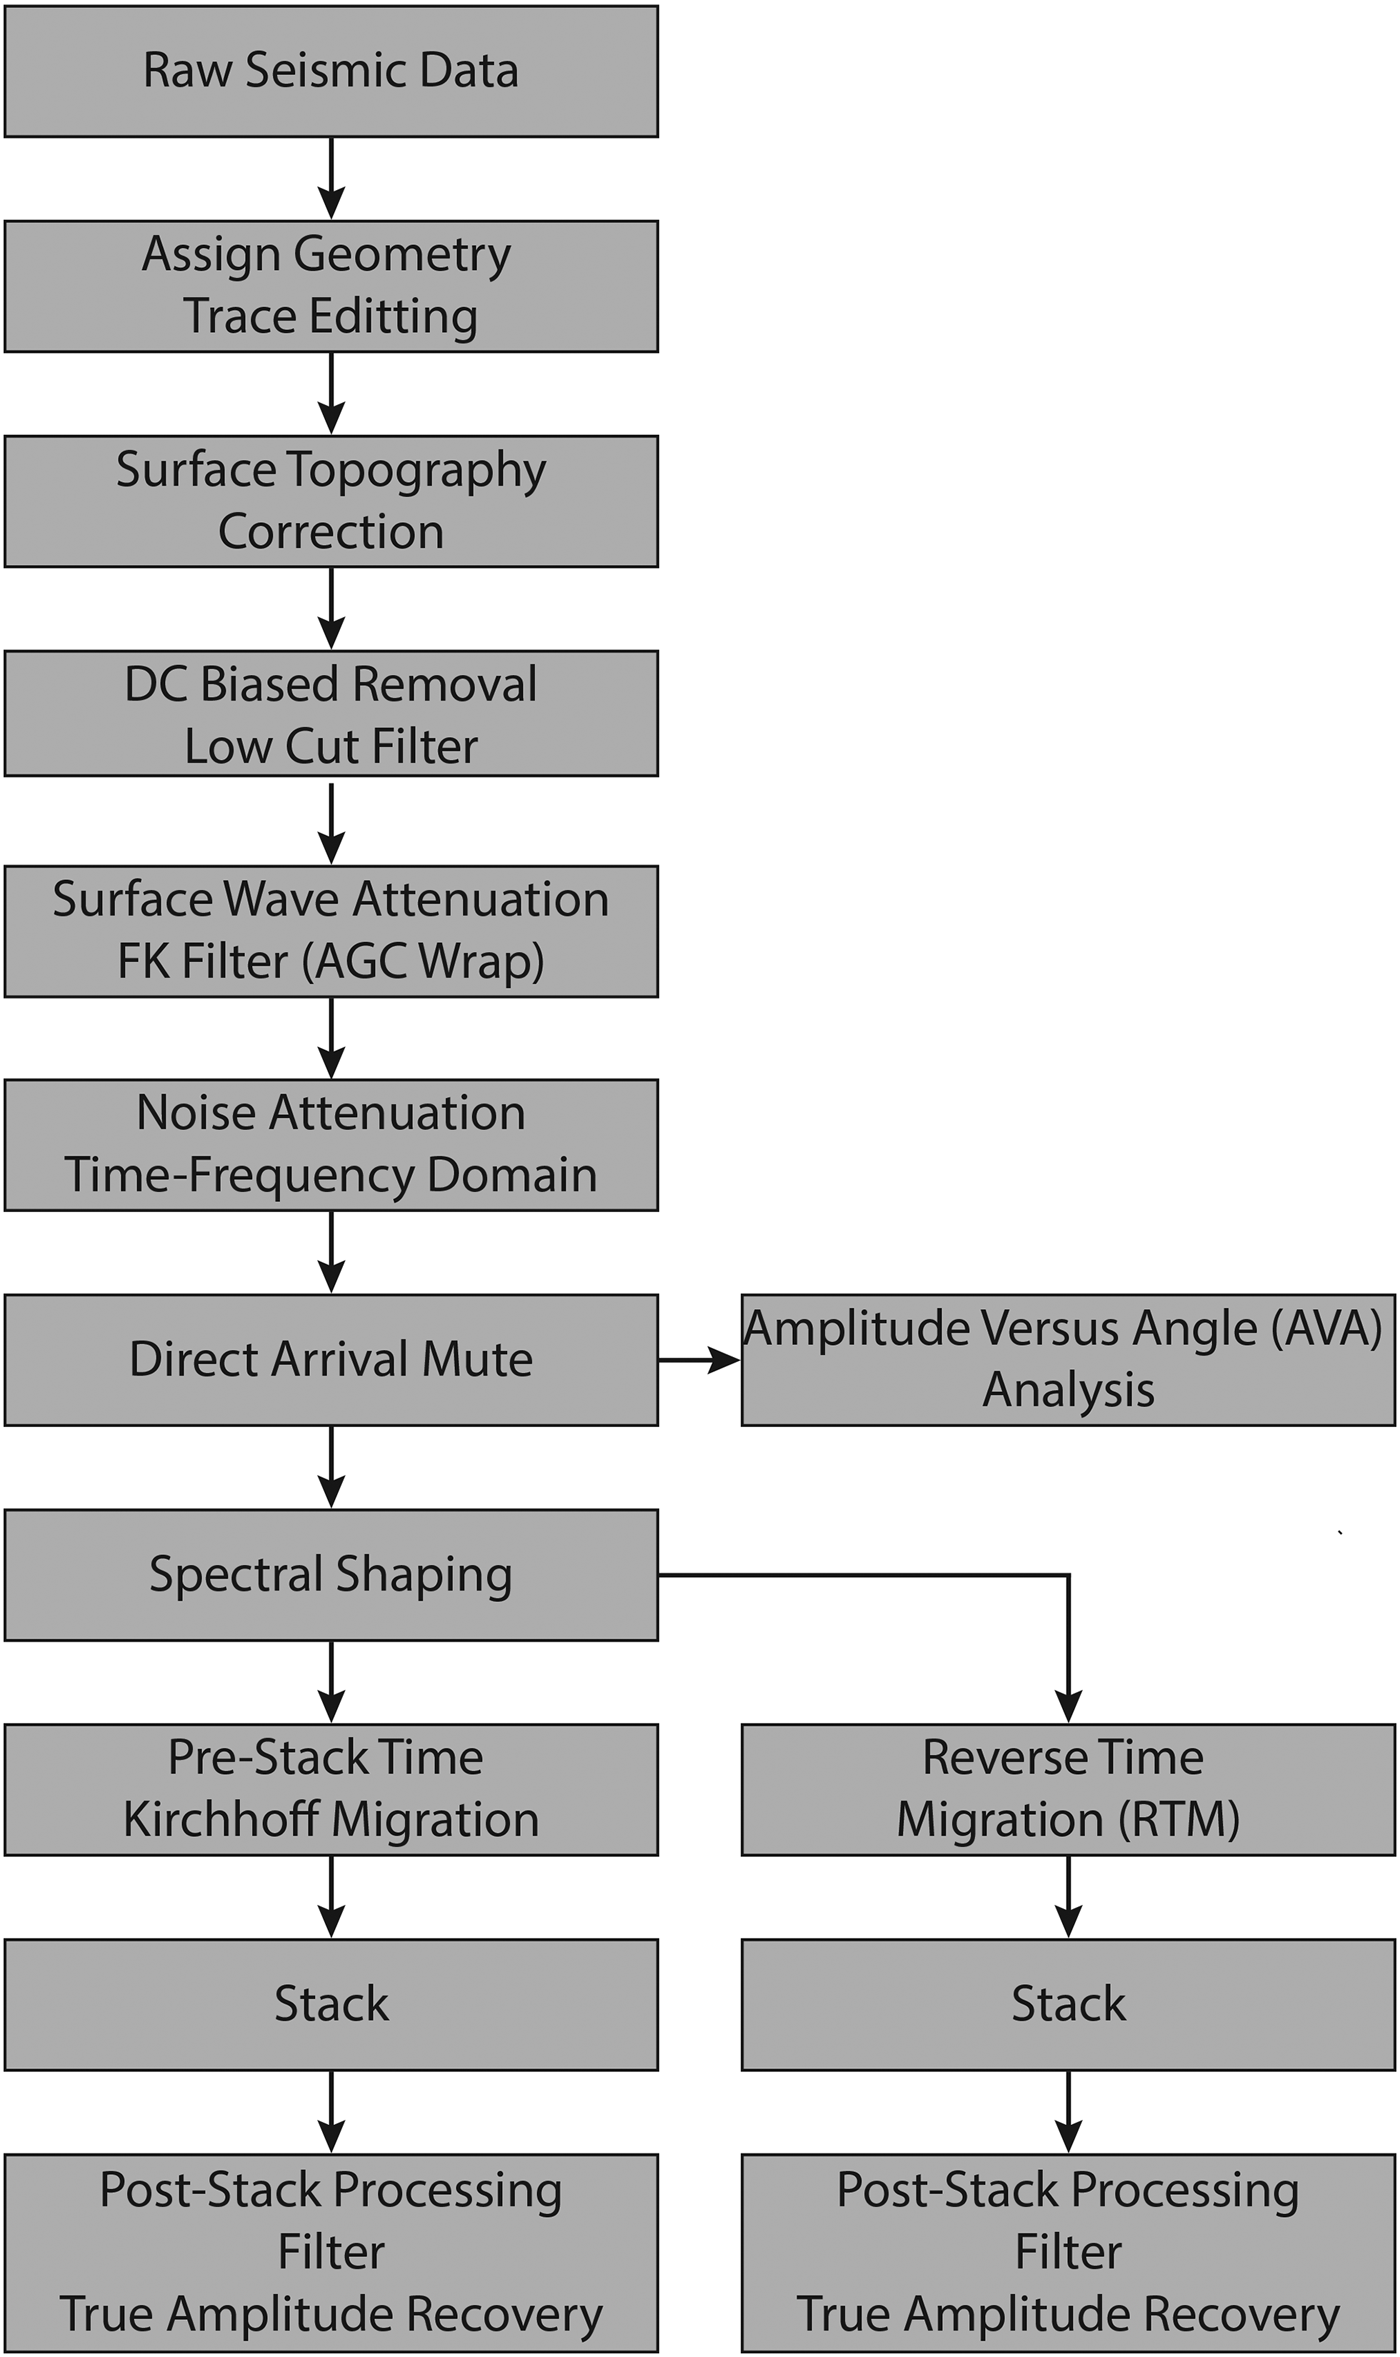
We tested two different migration algorithms, namely Kirchhoff and reverse time migration (RTM), for providing a structural interpretation for englacial and basal reflectors. During post-imaging processing, we applied time-variant filtering to improve the signal-to-noise ratio and an amplitude scaling to balance the sections.
Seismic imaging results
The pre-processed and migrated sections are shown in Fig. 3. Both seismic datasets provide a highly resolved continuous but rugose basal interface (Fig. 3, yellow arrows). These profiles are acquired and migrated in 2D and therefore reflections may originate from slightly out-of-plane. The migrated images for both seismic datasets provide a strong positive amplitude (black) basement reflection indicating, as expected, an increase in acoustic impedance between the glacial ice and bedrock. We expect the bedrock to be granite with a potential thin till layer, as observed from surrounding deglaciated areas and previous borehole studies on Rhone glacier (Sugiyama and others, Reference Sugiyama2008). The reflected basal amplitude varies because of basal topography and heterogeneous basal conditions. There is little change in the basal topography between 2012 and 2017. A lower noise content is observed in 2012 as a result of the higher common depth point (CDP) fold and the thicker ice in 2012 provided less interference between surface waves and the basal reflections. The amplitude spectrum before and after spectral whitening (Figs 3b and f) highlights that there is a similar bandwidth for both seismic datasets. Prior to spectral whitening the data has a dominant frequency of 100 Hz and after spectral whitening the data has similar spectra up to 1000 Hz.
Seismic processing images orientated East-West (A'-A as labelled on Figure 1): (a) 2012 pre-migration stacked image, (b) 2012 Frequency spectrum before and after spectral whitening, (c) 2012 Pre-Stack Kirchhoff migrated stacked image, (d) 2012 Reverse Time Migration stacked imaged. (e)–(h) Corresponding images for the 2017 dataset. Yellow and blue arrows represent the bedrock and englacial interpretations, respectively, and the white horizon represents the glacier surface.
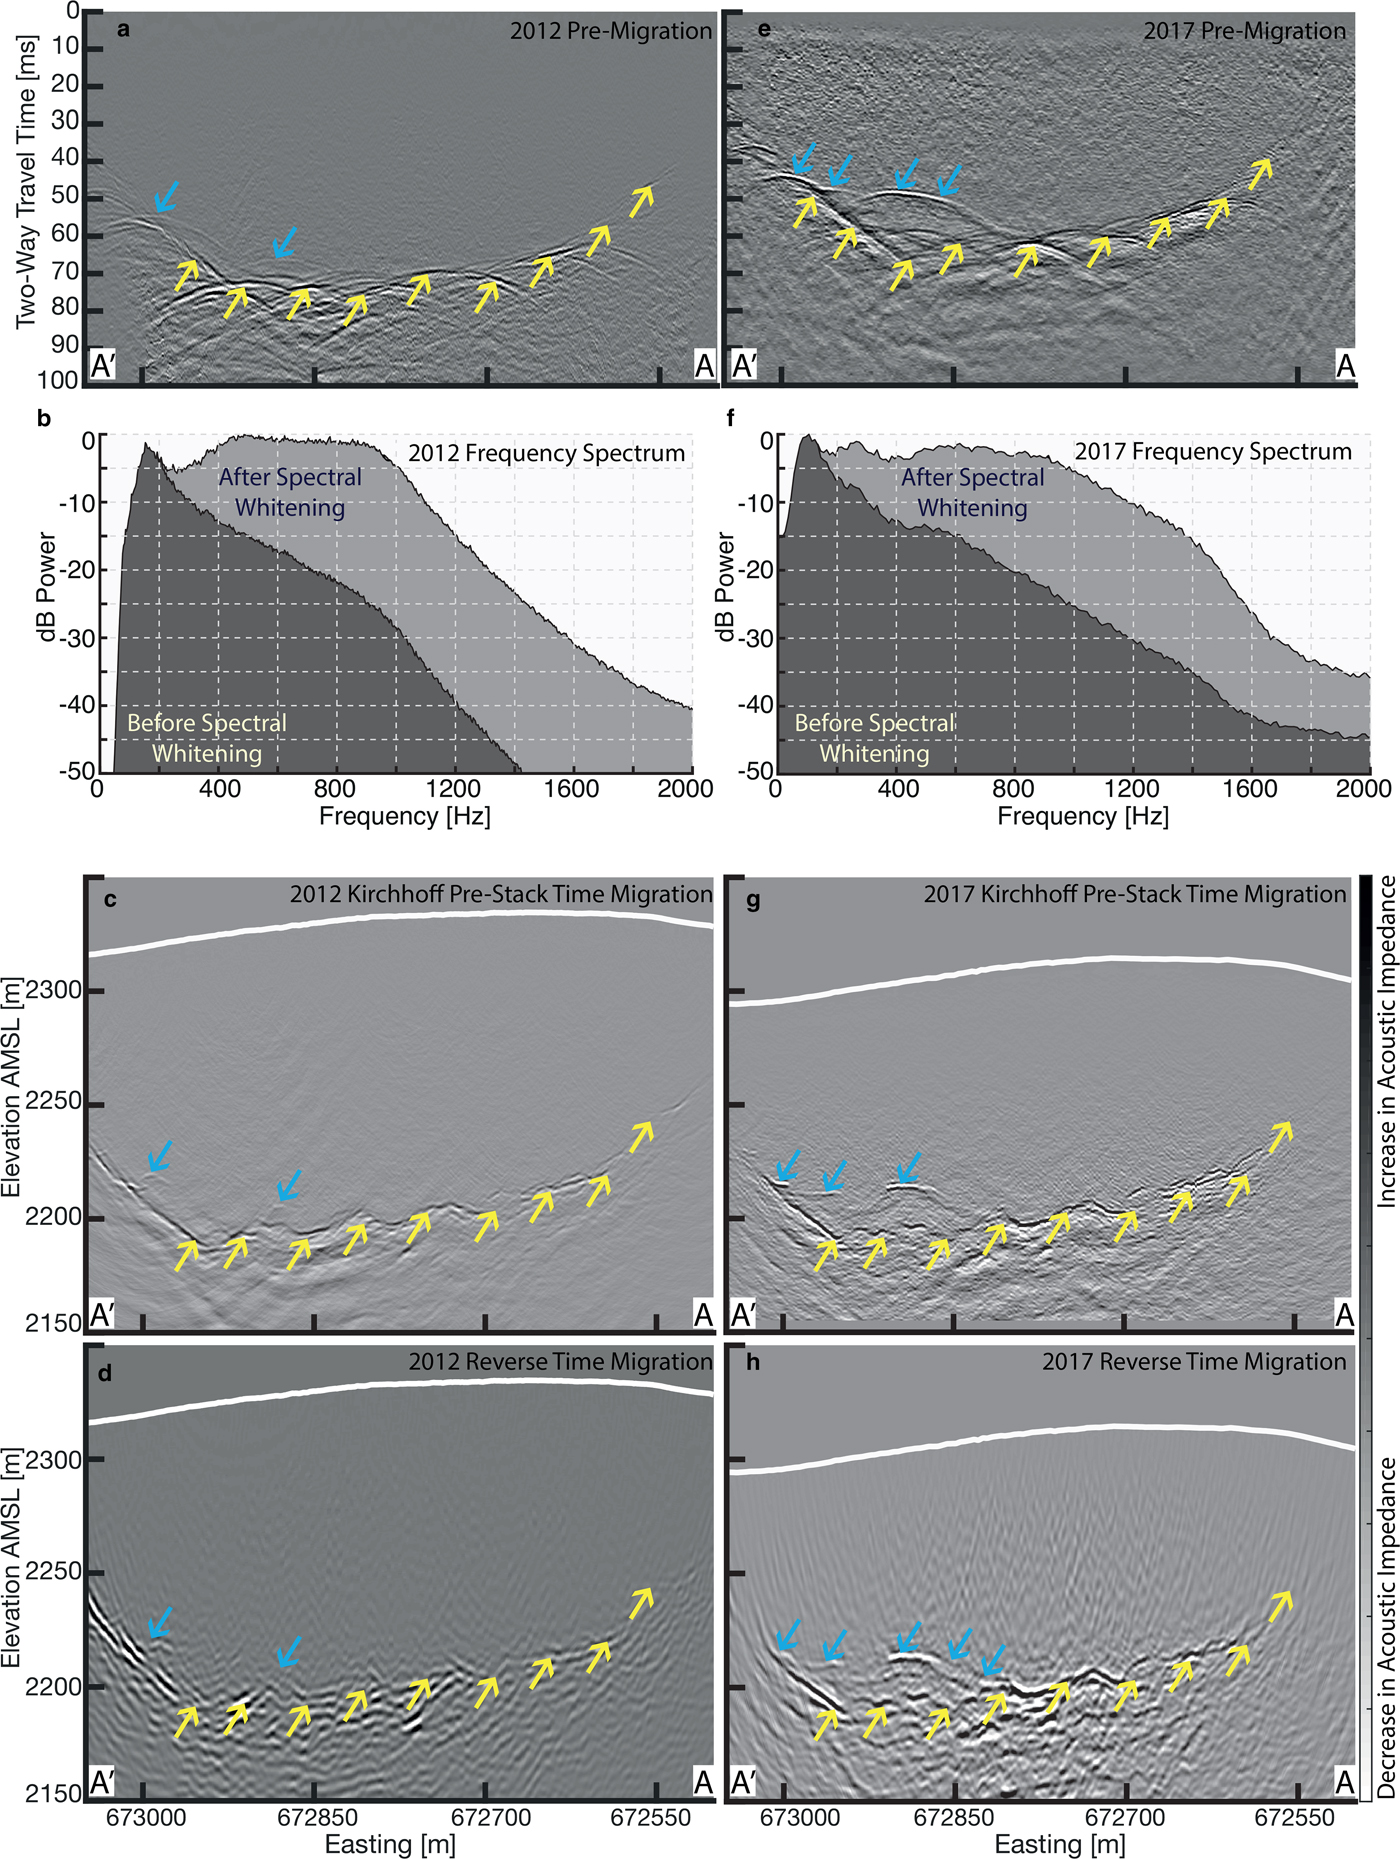
There are some imaging differences between the pre-stack Kirchhoff time migration and the RTM. However, for both 2012 and 2017 the migration algorithms provide similar basal and englacial imaging. The 2012 Kirchhoff imaging provides improved basal continuity in comparison to the RTM, however, an identical basal structure is interpreted using the 2012 RTM. Improvements using the RTM over the Kirchhoff are observed in sub-basal reflectors as a result of the RTM using accurate wave physics in order to reposition the reflectors as opposed to an approximation with the Kirchhoff migration. The 2017 basal reflector has improved continuity using the RTM algorithm in comparison to the Kirchhoff migration. The two migration algorithms complement each other and assist in the interpretation.
Significant differences are observed in the englacial reflectivity between 2012 and 2017 seismic datasets. There is subtle evidence of an englacial reflection in 2012, but the more recent 2017 dataset shows a much stronger negative amplitude englacial reflection (Fig. 3, blue arrows). The seismic reflector increases in amplitude and continuity between the 2012 and 2017 data, implying a significant change in englacial conditions. The stronger amplitudes in 2017 indicate a larger absolute acoustic impedance contrast compared to the 2012 data.
The RTM algorithm provided improved imaging of the englacial feature in 2017 as the englacial reflector can be tracked down to the basal reflector. Englacial seismic and GPR reflections within glaciers have been observed in several field studies and were characterised as a change in c-axis orientation (Horgan and others, Reference Horgan2008; Polom and others, Reference Polom, Hofstede, Diez and Eisen2014), englacial conduits (Stuart, Reference Stuart2003) or engrained sediments (Murray and Booth, Reference Murray and Booth2009). In order to investigate the cause of the englacial reflection, we applied the seismic amplitude variation with angle (AVA) technique to the 2017 seismic data.
Seismic amplitude analysis
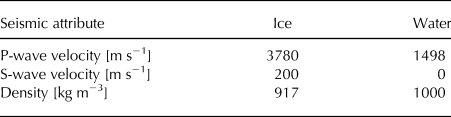
Englacial material properties can be estimated by analysing the seismic amplitude of the reflected waves. The recorded amplitude from the englacially reflected seismic wave is a function of incidence angle and elastic properties (density and seismic wave velocities) of the two media creating the interface. This technique has been successful in classifying basal conditions on Greenland and Antarctic ice sheets (Anandakrishnan, Reference Anandakrishnan2003; Peters and others, Reference Peters2008; Booth and others, Reference Booth2012; Dow and others, Reference Dow2013) and identifying subglacial lakes (Peters and others, Reference Peters2008). The angle-dependent reflectivity can be calculated using the Zoeppritz equations (e.g. Aki and Richards, Reference Aki and Richards2002). Even though temperate glacier ice is anisotropic and heterogeneous, we assume that this has a negligible impact on the reflectivity analysis. Temperate ice elastic properties can be estimated through a literature review (Table 2). Therefore, only the elastic properties from the englacial reflector are unknown. Our aim from the AVA technique is to determine the elastic properties from the englacial reflector using the 2017 seismic data.
Seismic properties of temperate ice and water employed for the AVA analysis (Peters and others, Reference Peters2008; Bradford and others, Reference Bradford, Nichols, Harper and Meierbachtol2013)
The angle-dependent p-wave reflection coefficient R(θ) is a function of the reflected amplitude A r(θ), source amplitude A 0, reflected waves incidence angle θ, ray path length d(θ) and anelastic attenuation coefficient αp. The angle-dependent reflectivity can be expressed as (Peters and others, Reference Peters2008; Dow and others, Reference Dow2013):
 $$ R(\theta) = {{A_{\rm r} (\theta)} \over {A_0 d_{\rm r} (\theta)e^{(\alpha_{\rm p}.d(\theta))}}} $$
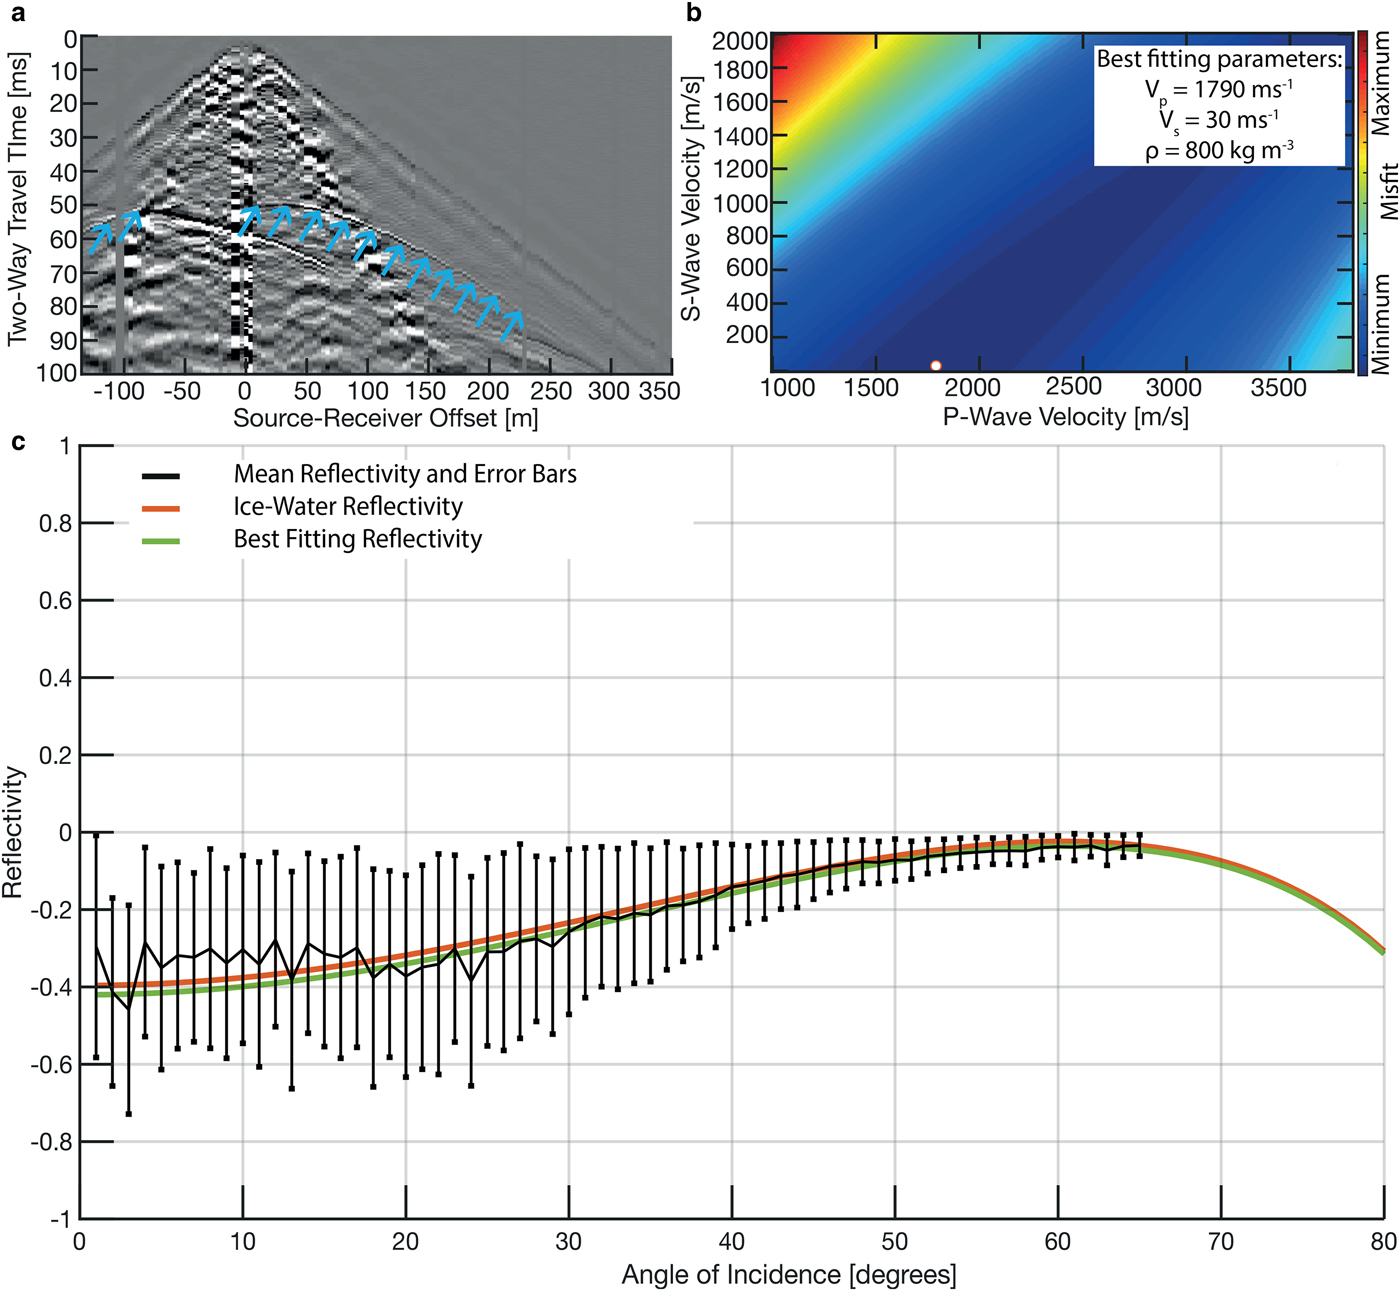
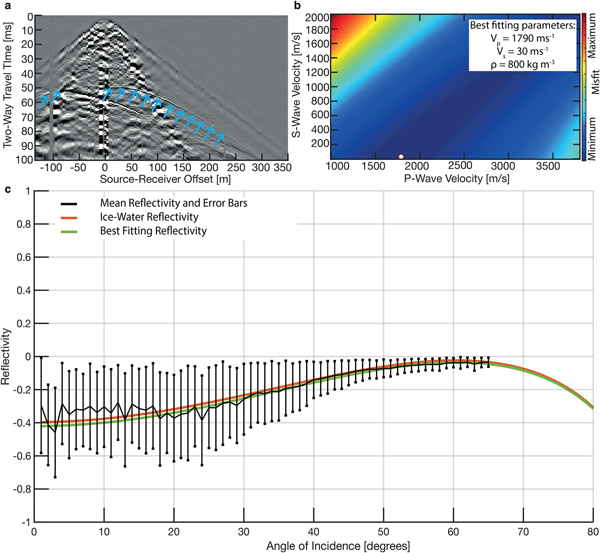
We extracted the reflected amplitude, A r(θ), by picking the englacial reflection on 54 shot gathers, where the englacial reflection was well visible (blue arrows in Fig. 4a). The path length (d(θ)) was estimated based upon the acquisition and englacial reflection geometry assuming straight rays travelling at a constant 3700 m s−1 velocity. The source amplitude can be obtained from the squared primary amplitudes of the englacial reflection and the first order multiple of the englacial reflection at normal incidence (Dow and others, Reference Dow2013):
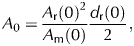 $$ A_0 = {{A_{\rm r} (0)^2} \over {A_{\rm m} (0)}} {{d_{\rm r} (0)} \over {2}}, $$
Amplitude analysis of englacial reflection from 2017 data. (a) Example shot gather showing englacial reflection picking (blue arrows) (b) Misfit function, sum of squared errors, between calculated AVA reflectivity and datapoints. A constant density of 800 kg m−3 is displayed to determine the best fitting AVA curve. (c) Reflectivity versus angle analysis. Black line indicates calculated reflectivity data and the errorbars indicate two standard deviations from the reflectivity data calculated using the Dow and others (Reference Dow2013) inversion methodology, the red curve indicates the theoretical ice-water reflectivity and the green curve indicates the best fitting reflectivity.
where A m is the first order multiple amplitude at normal incidence. The 2017 Rhone Glacier seismic data did not produce a clear first order simple multiple. Therefore, we calculated the angle-dependent reflectivity of the englacial reflection using the methodology described by Dow and others (Reference Dow2013). We calculated simulated reflectivity curves using Eqn (1) for a narrow range of plausible A 0 and attenuation parameters. The source amplitude A 0 was estimated with Eqn (2); using a narrow range of physically plausible A m values from zero to maximum primary amplitude observed at normal incidence.
P-wave anelastic attenuation is often expressed as the seismic quality (Q p), which is inversely proportional to the anelastic attenuation coefficient (αp) (Eqn 3). For obtaining an estimate of Q p, we considered seismic cross-hole measurements performed in the fall 2018 within the ablation area on the Rhone Glacier. The estimated Q p value was 100 ± 20, which is in good agreement with other studies (Westphal, Reference Westphal1965; Peters and others, Reference Peters, Anandakrishnan, Alley and Voigt2012; Babcock and Bradford, Reference Babcock and Bradford2014). We varied the Q p correction between 80 and 120. From these values of Q p we calculated a range of anelastic attenuation coefficients αp using the relationship expressed in Eqn (3) (Gusmeroli and others, Reference Gusmeroli2010; Peters and others, Reference Peters, Anandakrishnan, Alley and Voigt2012).
 $$ Q_{\rm p}= {{\pi f} \over {V_P \alpha(\,f)}} $$
We calculated reflectivity data points using Eqn (1) with the range of αp and A 0 values as described above. We rejected the reflectivity points with values <−1 or >0 (no positive amplitudes were observed during picking). Mean values and standard deviations of the calculated reflectivity data are shown in Fig. 4c. Additionally, we computed the theoretical reflectivity curve for an ice/water interface using the values in Table 2. The theoretical curve lies well in the range of the corrected reflectivity data.
To determine the best fitting elastic parameters, we performed a grid search over a range of elastic parameters (P-wave velocity between 1000 and 3800 m s−1, S-wave velocity between 0 and 2000 m s−1, and density between 700 and 2000 kg m−3). We calculated theoretical AVA curves using the Zoeppritz equations and calculated the misfit to be the sum of squared errors between all the data points and the calculated theoretical AVA curves. The best fitting elastic parameters, where the misfit was minimised, was with a P-wave velocity of 1790 m s−1, S-wave velocity of 30 m s−1 and density of 800 kg m−3. In Fig. 4b, the misfit is shown for different P-wave and S-wave velocities and with a constant 800 kg m−3 density, with the best fitting parameter marked by a white dot. The angle-dependent reflectivity curve using the best fitting englacial elastic parameters is shown by the green curve in Fig. 4c. These elastic parameters indicate the englacial reflection is likely caused by the presence of water.
In addition to the source amplitude and attenuation corrections that we have applied, the seismic angle-dependent reflectivity result can be influenced by other factors, such as FK filter distortions and shot and geophone coupling effects. The FK filter recovered the englacial seismic reflections that were interfering with surface waves. In Fig. 4c, we observe larger standard deviations for low incidence angles. Here, the reflections were possibly contaminated by surface waves and we attribute the large standard deviations to residual surface wave energy. It should be noted that AVA analysis would not have been possible for low incidence angles without the application of the FK filter.
Shot or geophone coupling corrections were not performed as previous studies found this correction to be insensitive to the calculated reflectivity (Zechmann and others, Reference Zechmann2018). Additionally, we anticipated this variation to be relatively small in comparison to the large range of first order multiple amplitude values and p-wave attenuation parameters used in Eqn (1).
The seismic AVA analysis provided clear evidence that the englacial reflection, appearing in the 2017 dataset, is caused by an impedance contrast originating from ice (top)/water (bottom) interface (Fig. 4c). However, the AVA analysis was unable to yield an estimate of the thickness of the water layer, that is, it is unclear if it represents an englacial conduit or a larger subglacial water accumulation.
Subglacial lakes and englacial cavities filled with water have been documented on Glacier de Tête Rousse in the French Alps (Vincent and others, Reference Vincent2012). If the englacial reflection would originate from a subglacial lake or an englacial water-filled cavity, this would result in a significant low-velocity anomaly within the glacier. Since we have employed a constant and identical velocity for the migration of the 2012 and 2017 datasets, one would expect a downward shift of the basal reflector in the 2017 data, if a pronounced low-velocity zone would be present. This is clearly not the case and the basal topography remains at a consistent elevation under the englacial feature. It is therefore highly unlikely that an englacial void or subglacial lake is responsible for the englacial reflection, and it must be interpreted as an englacial conduit. Its thickness must be < ~4 m. Otherwise, one would observe reflections from the upper and lower boundary of the conduit, which is not the case. Based on the minimum layer thickness detectability (Sheriff, Reference Sheriff2002), the conduit's minimum thickness is estimated to be ~0.5 m.
GPR processing and results
We acquired several GPR profiles in July 2018 covering a total length of 6,982 m in the vicinity of the 2017 englacial reflector to determine its spatial extent (Fig. 5c). The GPR data were processed using the in-house MATLAB-based suite called GPRglaz (Rutishauser and others, Reference Rutishauser, Maurer and Bauder2016; Langhammer and others, Reference Langhammer, Rabenstein, Bauder and Maurer2017; Church and others, Reference Church, Bauder, Grab, Hellmann and Maurer2018; Grab and others, Reference Grab2018). The pre-processing involved merging the GNSS data with the GPR data, correcting for time zero, bandpass filtering noise and trace binning accounting for variations in walking speed. The Kirchhoff time migration was implemented using the CREWES MATLAB toolbox (Margrave and Lamoureux, Reference Margrave and Lamoureux2010). For the migration and time-to-depth conversion, a constant ice velocity of 0.169 m ns−1 was assumed, which was found in previous studies (Plewes and Hubbard, Reference Plewes and Hubbard2001).
Spatial extent of englacial feature. (a) 2017 seismic profile. (b) 2018 GPR profile. Both profiles orientated East-West (A'-A as labelled on Figure 1) (c) Spatial extent of englacial feature derived from the GPR data and the height of feature above the basal interface. The black thick lines represent the GPR profiles, the contours represent the bedrock elevation, the red line represents the seismic profiles in 2012 and 2017 and the red points represent the boreholes drilled in 2018.
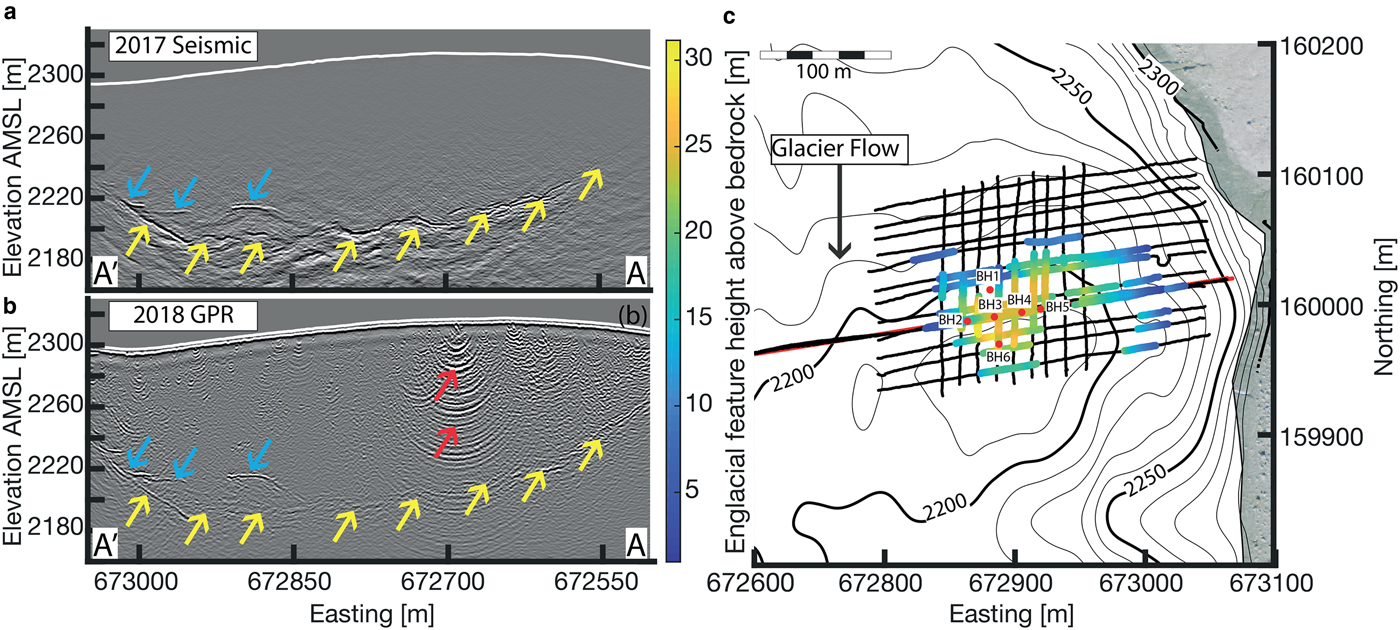
The englacial water feature was still present 11 months after the 2017 seismic observations. Its reflection polarity is identical to the bedrock polarity indicating a decrease in electromagnetic (EM) wave velocity. Additionally, we found the englacial reflection amplitude to be larger than those of the bedrock reflection as a result of a larger EM wave velocity contrast. Both of these observations are consistent with an englacial feature still remaining water filled.
There are strong noise levels within the GPR section (Fig. 5b, red arrows) due to the presence of shallow water pockets (water filled crevasses and cracks) near the glacier's surface. Surface water can cause the EM wavefield to scatter and dampen and result in a higher noise content compared to the seismic data (Smith and Evans, Reference Smith and Evans1972).
The englacial feature is visible on numerous GPR profiles covering a surface area of 14,000 m2 (Fig. 5c), but it remains localised within the overdeepening. It is situated on the up-glacier side of the small overdeepening (Fig. 1) and extends until the middle of the overdeepening where it potentially connects to the glacier bed and a subglacial drainage system. The centre of the conduit network is ~30 m above the bedrock, at an elevation of 2210 m.
Borehole campaign
There exists evidence that the englacial feature could be the result of a water table (defined as the level below which the veins between ice crystals contain water). We will test this as a hypothesis where a water table could be hydrologically connected to the proglacial lake. The proglacial lake level and the sub-horizontal englacial reflections are at a similar elevation (2210 m AMSL), thereby hinting at the possibility that the reflection could represent an englacial water table. The idea of an englacial water table is not new and was already discussed by Nye and Frank (Reference Nye and Frank1973) and inferred by Shreve and others (Reference Shreve, Sharp and Roch1970) on Lower Blue Glacier, USA. In order to analyse this hypothesis, we carried out a borehole drilling campaign in July 2018.
Drilling
After confirming the englacial feature was visible during 2018 from the GPR data and determining the spatial extent, we drilled six boreholes (BH) in and around the englacial feature (Fig. 5; red points). Two boreholes (BH3 and BH4) were drilled directly into the feature at a depth of 88.0 and 87.5 m, respectively, whilst the remaining four boreholes (BH1, BH2, BH5 and BH6) were drilled around the englacial feature down to depths of 97.2, 104.8, 101.7 and 105.4 m, respectively. Both boreholes drilled into the englacial feature (BH3 and BH4), drained immediately upon connection to the englacial feature, and this resulted in an increased tension on the drilling hose. From the remaining four boreholes, only BH5 hit the bed providing depth control during time-to-depth conversions for both the seismic and GPR datasets. The other three boreholes (BH1, BH2, BH6) were terminated ~5 m above the bedrock. BH2, BH5 and BH6 remained water filled throughout the campaign (21 July--22 August), and we infer that they did not pass through any englacial void as a result of the constant hose tension during drilling. BH1 remained water filled for the first 2 weeks of the campaign before draining in the middle of August. We can speculate that the borehole (BH1) made a hydrological connection to the englacial feature through a fracture caused by hydrofracturing as a result of the short-term increase in englacial water pressure (see subsection Borehole Water Pressure)
Borehole camera
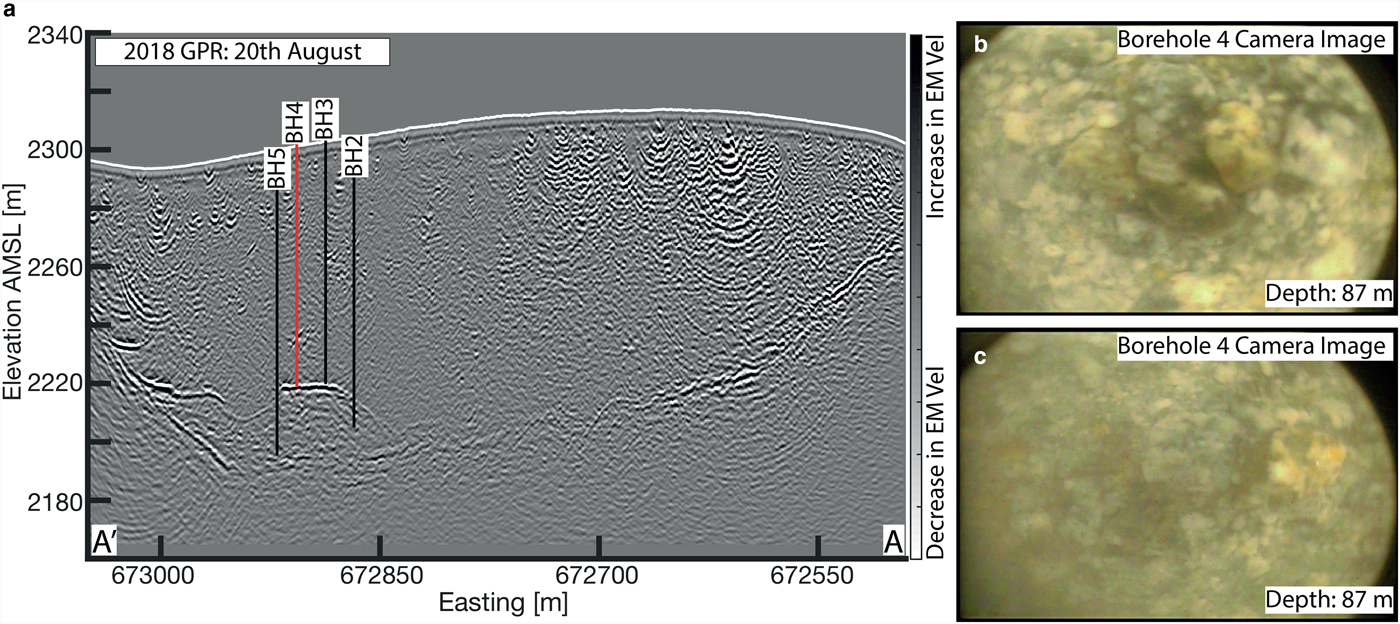
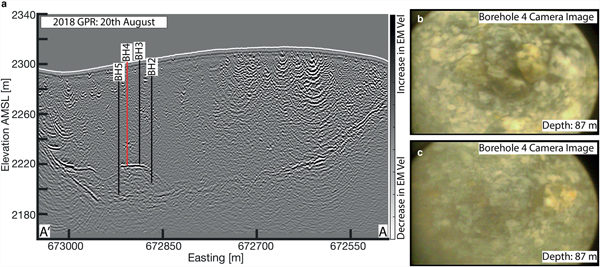
We lowered the camera into BH3, BH4 and BH5 to observe englacial conditions and the basal interface. The basal interface, observed in BH5, was a granite bedrock covered by numerous small rocks and pebbles. Direct englacial observations were unable to be made in borehole BH3 due to turbiditic water reducing visibility. The following observations were made for BH4, which penetrated into the englacial feature:
1. The englacial water was murky and turbiditic, with a visibility ~20–50 cm.
2. At the borehole base, the englacial feature showed large quantities of sediment (Figs 6b and c).
3. The camera shook violently when positioned within the englacial feature and sediment was being transported at the base. Both observations indicate an englacial flow within the feature.
4. The side camera did not provide any information on the size of the feature due to the poor visibility.
Borehole camera observations within englacial feature. (a) GPR survey with boreholes overlaid and their respective depths shown. (b) and (c) Borehole camera images at the base of borehole 4 showing sedimentary debris within englacial feature.
Borehole water pressure
For the majority of the borehole campaign, the englacial water pressure appeared relatively constant during borehole camera recordings. When the camera was placed in BH3 and BH4, the water level was ~1–2 m above the englacial feature and we observed small changes (< 0.5 m) in the borehole water level indicating an englacial flow near atmospheric pressure. Permanent borehole water pressure sensors were not installed and therefore only water pressure observations were taken whilst using the borehole camera. On several occasions, we observed geyser-like events where englacial water was being blown from the top of the borehole for several minutes caused by a short-term increase in englacial water pressure.
Borehole results interpretation
Upon hydraulic connection to the englacial feature, the water within the BH3 and BH4 immediately drained providing evidence that this feature is not a water table. Additionally, we observed flowing water using the borehole camera and therefore it is not possible that such an englacial feature can accumulate water within the glaciers vein network. Based upon the borehole drilling campaign we reject the water table hypothesis and conclude that there is no evidence to suggest that the englacial reflection is caused by a water table.
DISCUSSION
There exists significant evidence from geophysical analysis and direct observations to suggest that the englacial reflection is the result of englacial water flow through a network of englacial conduits. Based on seismic and GPR attributes, the underlying reflector can be interpreted as the bedrock interface (positive acoustic impedance and negative electromagnetic impedance). This is consistent with previous GPR studies over the Rhone glacier (Church and others, Reference Church, Bauder, Grab, Hellmann and Maurer2018).
We have developed two hypotheses for determining the source of the englacial conduit system.
1. Englacial conduit network spanning overdeepening fed by an up-glacier subglacial drainage system.
2. Englacial conduit network spanning overdeepening fed by surface streams and morainal streams through subglacial marginal conduits (subglacial streams along the glacier flank).
Hypothesis 1
It has been proposed in the literature that a subglacial conduit network can flow englacially upon meeting an overdeepening (Cook and Swift, Reference Cook and Swift2012) and result in an efficient englacial conduit network spanning the overdeepening. There is evidence of water traversing overdeepenings via extensive efficient englacial conduit networks (Hooke and Pohjola, Reference Hooke and Pohjola1994; Hock and others, Reference Hock, Iken and Wangler1999). There is uncertainty on an englacial flow's path upon meeting an overdeepened section, however, it has been proposed that a subglacial flow could traverse an overdeepening through an englacial conduit network. We investigate the scenario of a subglacial conduit meeting an overdeepen and flowing englacially through a conduit network on the Rhone Glacier.
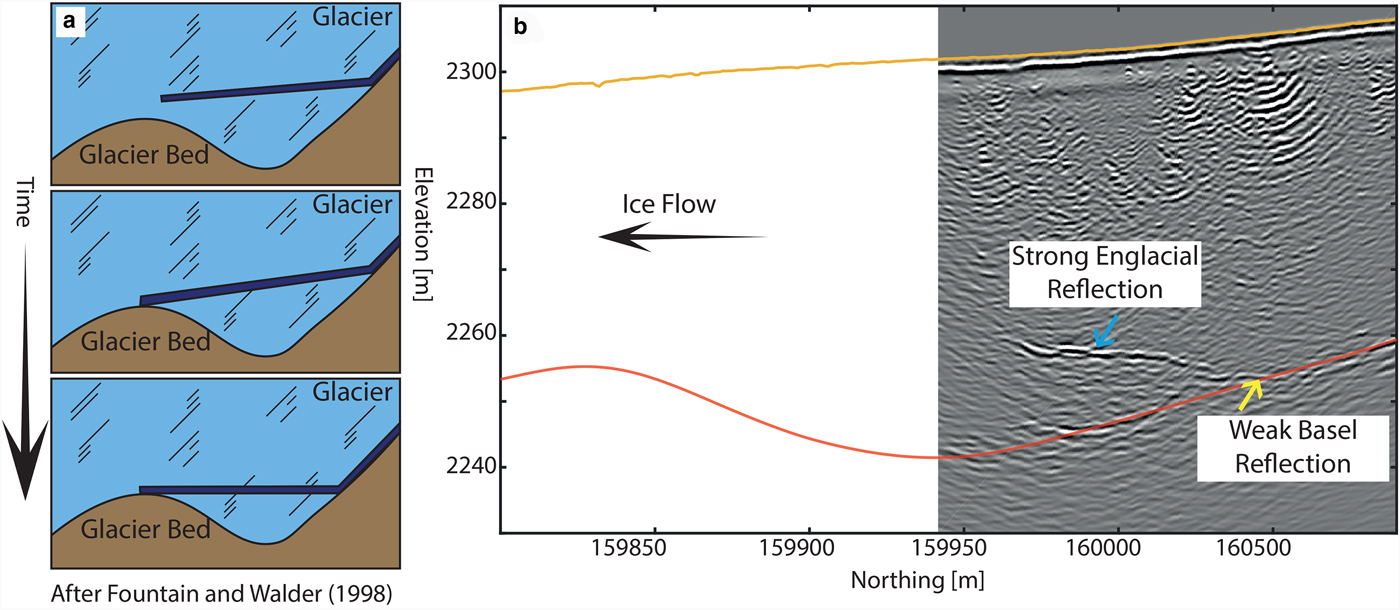
Englacial flow within an overdeepening has been observed to be more efficient than subglacial flow (Fountain, Reference Fountain1994; Hock and others, Reference Hock, Iken and Wangler1999), as it flows at atmospheric pressure. Our borehole camera observations indicated that the englacial flow is approximately at atmospheric pressure (borehole water level 1–2 m above the conduit elevation). Theoretically, englacial conduits spanning overdeepenings should be common, as a result of the flow at atmospheric pressure (Cook and Swift, Reference Cook and Swift2012). They can develop from up-glacier subglacial drainage systems meeting an overdeepening (Fig. 7a), and traverse the overdeepening through an englacial conduit network.
(a) Longitudinal cross section of a theoretical englacial conduit spanning an overdeepening evolving in time to entirely traverse the overdeepening. (b) Rhone glacier longitudinal GPR section (profile marked as red line on Figure 8) where the englacial conduit (blue arrows) partially crosses the overdeepening. Marked surfaces: glacier surface (yellow horizon) and smoothed glacial basement showing the overdeepening from Church and others (Reference Church, Bauder, Grab, Hellmann and Maurer2018) (red horizon).
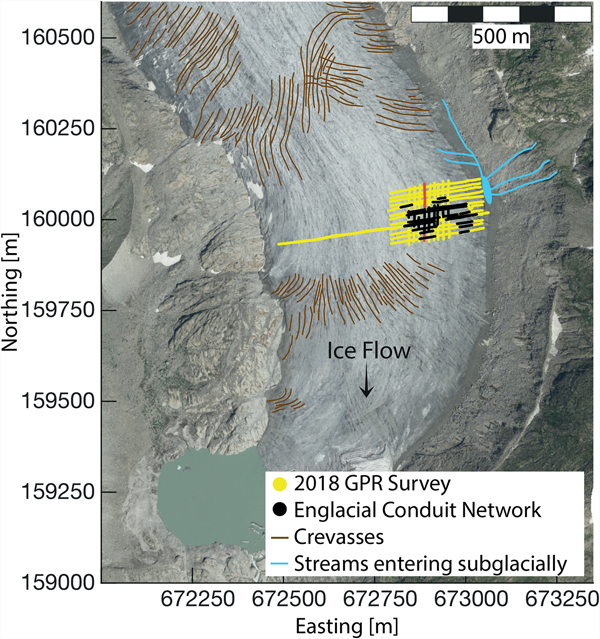
Surface feature interpretation showing crevasses and surface streams pathways before flowing subglacially on the eastern moraine flank. The yellow markers represent the 2018 GPR grid and the red profile is shown in Figure 7.
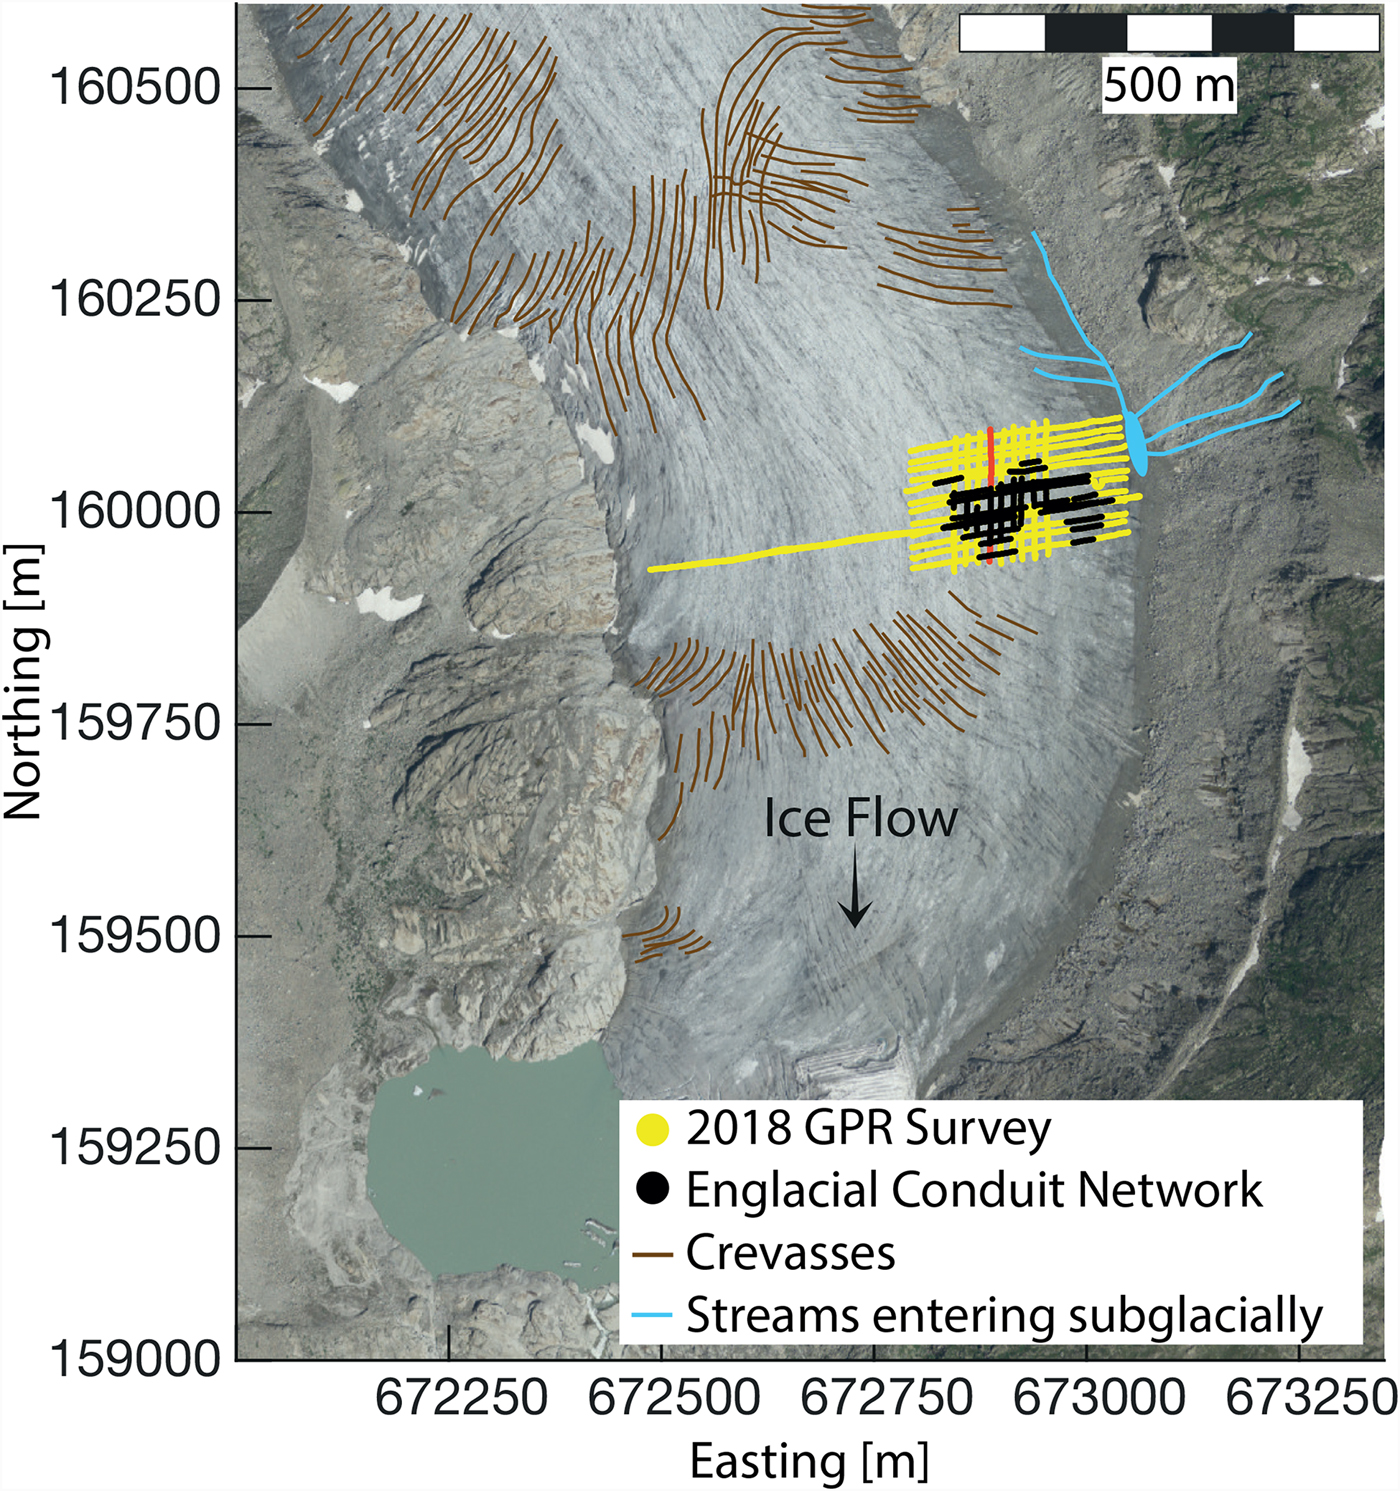
Figure 7b shows one of the GPR profiles that is more or less parallel to the glacier flow and thus mimics the sketches in Fig. 7a. The outline of the overdeepening, obtained from helicopter-borne GPR data (Church et al., 2018), is superimposed. There is a good match with the bedrock reflection in the GPR profile.
It seems that the early time scenario of Fountain and Walder (Reference Fountain and Walder1998) (topmost schematic in Fig. 7a) mimics the observed data best. However, if the englacial water flow would be parallel to the glacier flow, one would expect continuously high-amplitude reflections upstream from the intersection of the englacial and bedrock reflections (due to high impedance contrast between ice and water). As indicated in Fig. 7b, this is not observed. Therefore, hypothesis 1 seems an unlikely scenario.
Hypothesis 2
Within the ablation area of temperate glaciers, the majority of rain and surface meltwater enters englacially through crevasses and moulins (Fountain and Walder, Reference Fountain and Walder1998). The englacial conduit network on the Rhone Glacier is not located near surface crevasses or moulins (Fig. 8). The nearest surface crevasse network is located 100 m away from the englacial feature. The GPR data provided evidence that no hydrological connection between the surface crevasses and the englacial network existed and we can conclude the surface crevasse network is not hydrologically connected to the englacial network. Therefore, the source of the englacial water is unlikely to be from surface crevasses or moulins.
During the 2018 field campaign, we observed surface streams and streams located on the eastern moraine merging together before flowing subglacially (Fig. 8). From the seismic data it is possible to interpret the subglacial water paths along the glacier's flank (left most blue arrow in 2012 and 2017 in Fig. 3b). These subglacial channels eventually connect with the sub-horizontal englacial conduit network. Therefore, these surface streams and streams on the eastern moraine are likely the water source for the englacial conduit network.
The GPR profiles running both parallel (Fig. 5b) and perpendicular (Fig. 7b) to the ice flow show a single continuous englacial reflection indicating the conduit network is likely a single cavity transporting water englacially. Therefore, the conduit network does not conform to the theoretical cylindrical shape described by Röthlisberger (Reference Röthlisberger1972) and Nye and Frank (Reference Nye and Frank1973), or form an arborescent conduit system (Shreve, Reference Shreve1972). We do not have significant evidence to determine the englacial conduit network formation mechanisms. However, we can speculate that the network's origin could be the result of basal fractures along the glacier flank or hydrofracturing, as a result of the observed high englacial water pressure impulses.
Once the water has been routed through the englacial network, it connects to a subglacial drainage network. As shown in Fig. 3h, the englacial reflector merges with the bedrock reflection approximately in the centre of the glacier bed. Therefore, hypothesis 2 seems to be the likely scenario.
CONCLUSION
Englacial networks have not yet been reported in the literature using comprehensive geophysical and borehole analysis, because of their short-lived nature and the difficulty in differentiating englacial conduits to other internal features. By using high-resolution seismic and GPR data, we could detect and image an englacial conduit network within the Rhone Glacier. Comprehensive geophysical and borehole data acquisition has ensured confidence in our characterisation of the englacial network. By using only a single geophysical dataset the interpretation and analysis of englacial structures would have been ambiguous and potentially flawed. Acquiring seismic datasets on the Rhone Glacier was logistically difficult and time-consuming. Additionally, the seismic data acquired suffered from limited spatial distribution and thin layer effects during englacial conduit detection and therefore, additional geophysical data were sought after. Whereas, acquiring GPR datasets were logistically simpler, the GPR data provided better horizontal and vertical resolution and GPR allowed for an increased spatial data coverage. However, the seismic data provided better depth penetration and less attenuation from absorption and scattering within temperate ice. Direct borehole observation further reduced the ambiguity of the englacial hydrological features being erroneously identified using the combined geophysical analysis.
In conclusion, we can summarise our englacial network findings:
1. We have been able to delineate an englacial network within an overdeepening using a gridded GPR dataset and we conclude the conduit network covers ~ 14, 000 m2.
2. By acquiring two active seismic datasets that are separated by 5 years we have been able to observe significant changes to the englacial conduit network. There is subtle evidence that the englacial conduit network was seismically deteactable in 2012, whereas in 2017 it was easily identifiable. We can conclude that in 2012 the englacial conduit network was beginning to develop. In 2017 the englacial conduit network was well established, seismically visible as a strong englacial reflection and with AVA analysis, we positively identified it as a water-filled englacial conduit.
3. Continuous englacial reflections on the GPR data acquired both parallel and perpendicular to the ice flow allowed the shape of the conduit system to be identified. The conduit shape on the Rhone Glacier does not conform to the theoretical cylindrical shape described by Röthlisberger (Reference Röthlisberger1972) and Nye and Frank (Reference Nye and Frank1973).
4. We have been able to identify the source of the englacial network using combined geophysical interpretation. The seismic reflection polarities and impedance contrasts identified the presence of water. Using complimentary analysis from GPR reflection data we investigated several hypotheses on the nature of the system and the water source. The GPR amplitudes were able to distinguish between a marginal channel inflow and an up-glacier subglacial drainage system. From the analysis we can conclude that the englacial network is likely fed by surface streams and morainal streams merging and flowing along the margin of glacier. These streams subsequently flow subglacially through marginal channels along the glacier's flank and then into the englacial conduit network. The englacial water is not sourced by moulins or crevasses.
5. From several years of geophysical data, we can conclude that the englacial conduit network persisted over a longer period and remained active after the 2017 winter season.
6. The borehole camera provided direct observations of the borehole water level and we noted that the water level was only 1–2 m above the flowing englacial conduit indicating it was close to atmospheric pressure. There were englacial pressure fluctuations as we observed geyser-like eruptions where englacial water was being blown from the top of the borehole for several minutes.
7. The borehole camera images provided an insight into englacial conduit conditions. We conclude that the englacial flow within the conduit network was transporting sediment along its base.
8. The geophysical imaging also provided evidence of outflow from the conduit network. The englacial conduit network is connected to a subglacial drainage network. As the englacial network is close to atmospheric pressure, it is likely that the subglacial network is well developed and efficient.
The findings listed above were possible thanks to comprehensive geophysical, borehole and surface observations. Detecting and characterising englacial conduits within temperate glaciers is nontrivial and for future studies we recommend:
1. Both geophysical datasets, GPR and active seismic, as it reduced the ambiguity of the englacial network interpretation.
2. A large GPR network to highlight potential targets for a seismic campaign. GPR acquisition allows large areas of the glacier to be covered and is typically quicker and simpler than seismic acquisition, however, it often suffers from a lack of penetration in temperate ice.
3. High-quality and high-fold (> 30) seismic data to correctly identify englacial using AVA analysis.
4. However, boreholes are not essential to identify and characterise the englacial network. The boreholes provided us ground-truths to remove the ambiguity of our interpretation and they provided us with direct observations into an active englacial conduit network using a borehole camera.
Overall, this study has shown that englacial networks can be detected and characterised using active seismic, GPR and borehole observations within a temperate alpine glacier. Furthermore, we have provided recommendations for future detection and characterisation studies of englacial conduit networks using geophysical methods.
ACKNOWLEDGEMENTS
The Swiss National Science Foundation financed the project (SNF Grant 200021_169329/1). Data acquisition has been provided by the Exploration and Environmental Geophysics (EEG) group and the Laboratory of Hydraulics, Hydrology and Glaciology (VAW) of ETH Zurich. The authors gratefully acknowledge the Landmark Graphics Corporation for providing data processing software through the Landmark University Grant Program. We wish to acknowledge S. Hellmann, D. Gräff, A. Blanchard, C. Bärlocher, P. Giertzuch, C. Petrini and all the other volunteers for their valuable help in organising and participating in the fieldwork.
GC, AB, LR, MG and HR designed the field experiments. GC, SS and LR processed the seismic data and GC created the plots. GC processed the GPR data. GC, AB, MG and HR interpreted the data. GC wrote the manuscript with significant input and critical reviews by AB, HR and MG. We are grateful to D. MacAyeal and two anonymous reviewers whose constructive comments helped to improve the quality of the manuscript.







 Open access

