


In 2023, chronic liver disease, including cirrhosis, is responsible for approximately one million deaths each year. Among the various aetiologies of chronic liver disease, metabolic-associated steatotic liver disease (MASLD) has become a leading global cause(Reference Younossi, Wong and Anstee1). The increasing prevalence of MASLD correlates with rising global rates of obesity, type 2 diabetes and metabolic syndrome, conditions now affecting over one-third of the adult population in 2024(Reference Miao, Targher and Byrne2).
Early identification of liver fibrosis is critical for timely intervention and effective surveillance(Reference Vilar-Gomez, Calzadilla-Bertot and Wong3). Although liver biopsy remains the gold standard for detecting and staging fibrosis, it is invasive, expensive and impractical. Transient elastography offers a reliable, non-invasive alternative, but it also carries significant costs and logistical challenges. In contrast, fibrosis-4 (FIB-4) index – a simple blood-based and cost-effective tool that is recommended for initial fibrosis evaluation and has demonstrated significant prognostic value for assessing morbidity and mortality risk(Reference Karlsen, Sheron and Zelber-Sagi4–Reference Albert and Wood6).
The pathophysiology of MASLD is effectively described by the ‘multiple hit’ theory. Initial TAG accumulation in hepatocytes represents the first ‘hit’, followed by subsequent factors such as inflammatory responses, oxidative stress, genetic predisposition and cellular transformations. These subsequent ‘hits’ contribute to disease progression from fat accumulation to liver fibrosis. Diet and the overall nutrient composition significantly influence this progression(Reference Bessone, Razori and Roma7). Although individual nutrients such as Cu, Zn, Fe and Se have previously been linked to MASLD, comprehensive insights into how overall dietary patterns influence MASLD remain limited(Reference Nemer, Osman and Said8,Reference Romero-Gómez, Zelber-Sagi and Martín9) . Previous studies often narrowly focus on single nutrients or minerals, neglecting the interconnected nature of dietary intake. Thus, a more integrated approach considering dietary components collectively is necessary.
Recently, latent class analysis (LCA) offers a powerful method for investigating complex relationship between nutrition and liver fibrosis(Reference Fernandes, Perazzo and Andrade10). LCA clusters individuals based on their unique nutritional profiles, identifying dietary patterns associated with macronutrients, micronutrients such as vitamins and minerals and facilitates the examination of liver fibrosis severity differences among these clusters. Unlike traditional machine learning approaches, LCA offers improved interpretability, enabling the effective identification of high-risk dietary groups(Reference Jiang, Zhang and Zheng11). Consequently, this approach supports targeted policymaking and personalised dietary recommendations aimed at reducing liver fibrosis risk. This study employs the LCA to evaluate the association between dietary patterns and liver fibrosis severity, as indicated by the FIB-4 score.
Methods
Study design and patient selection
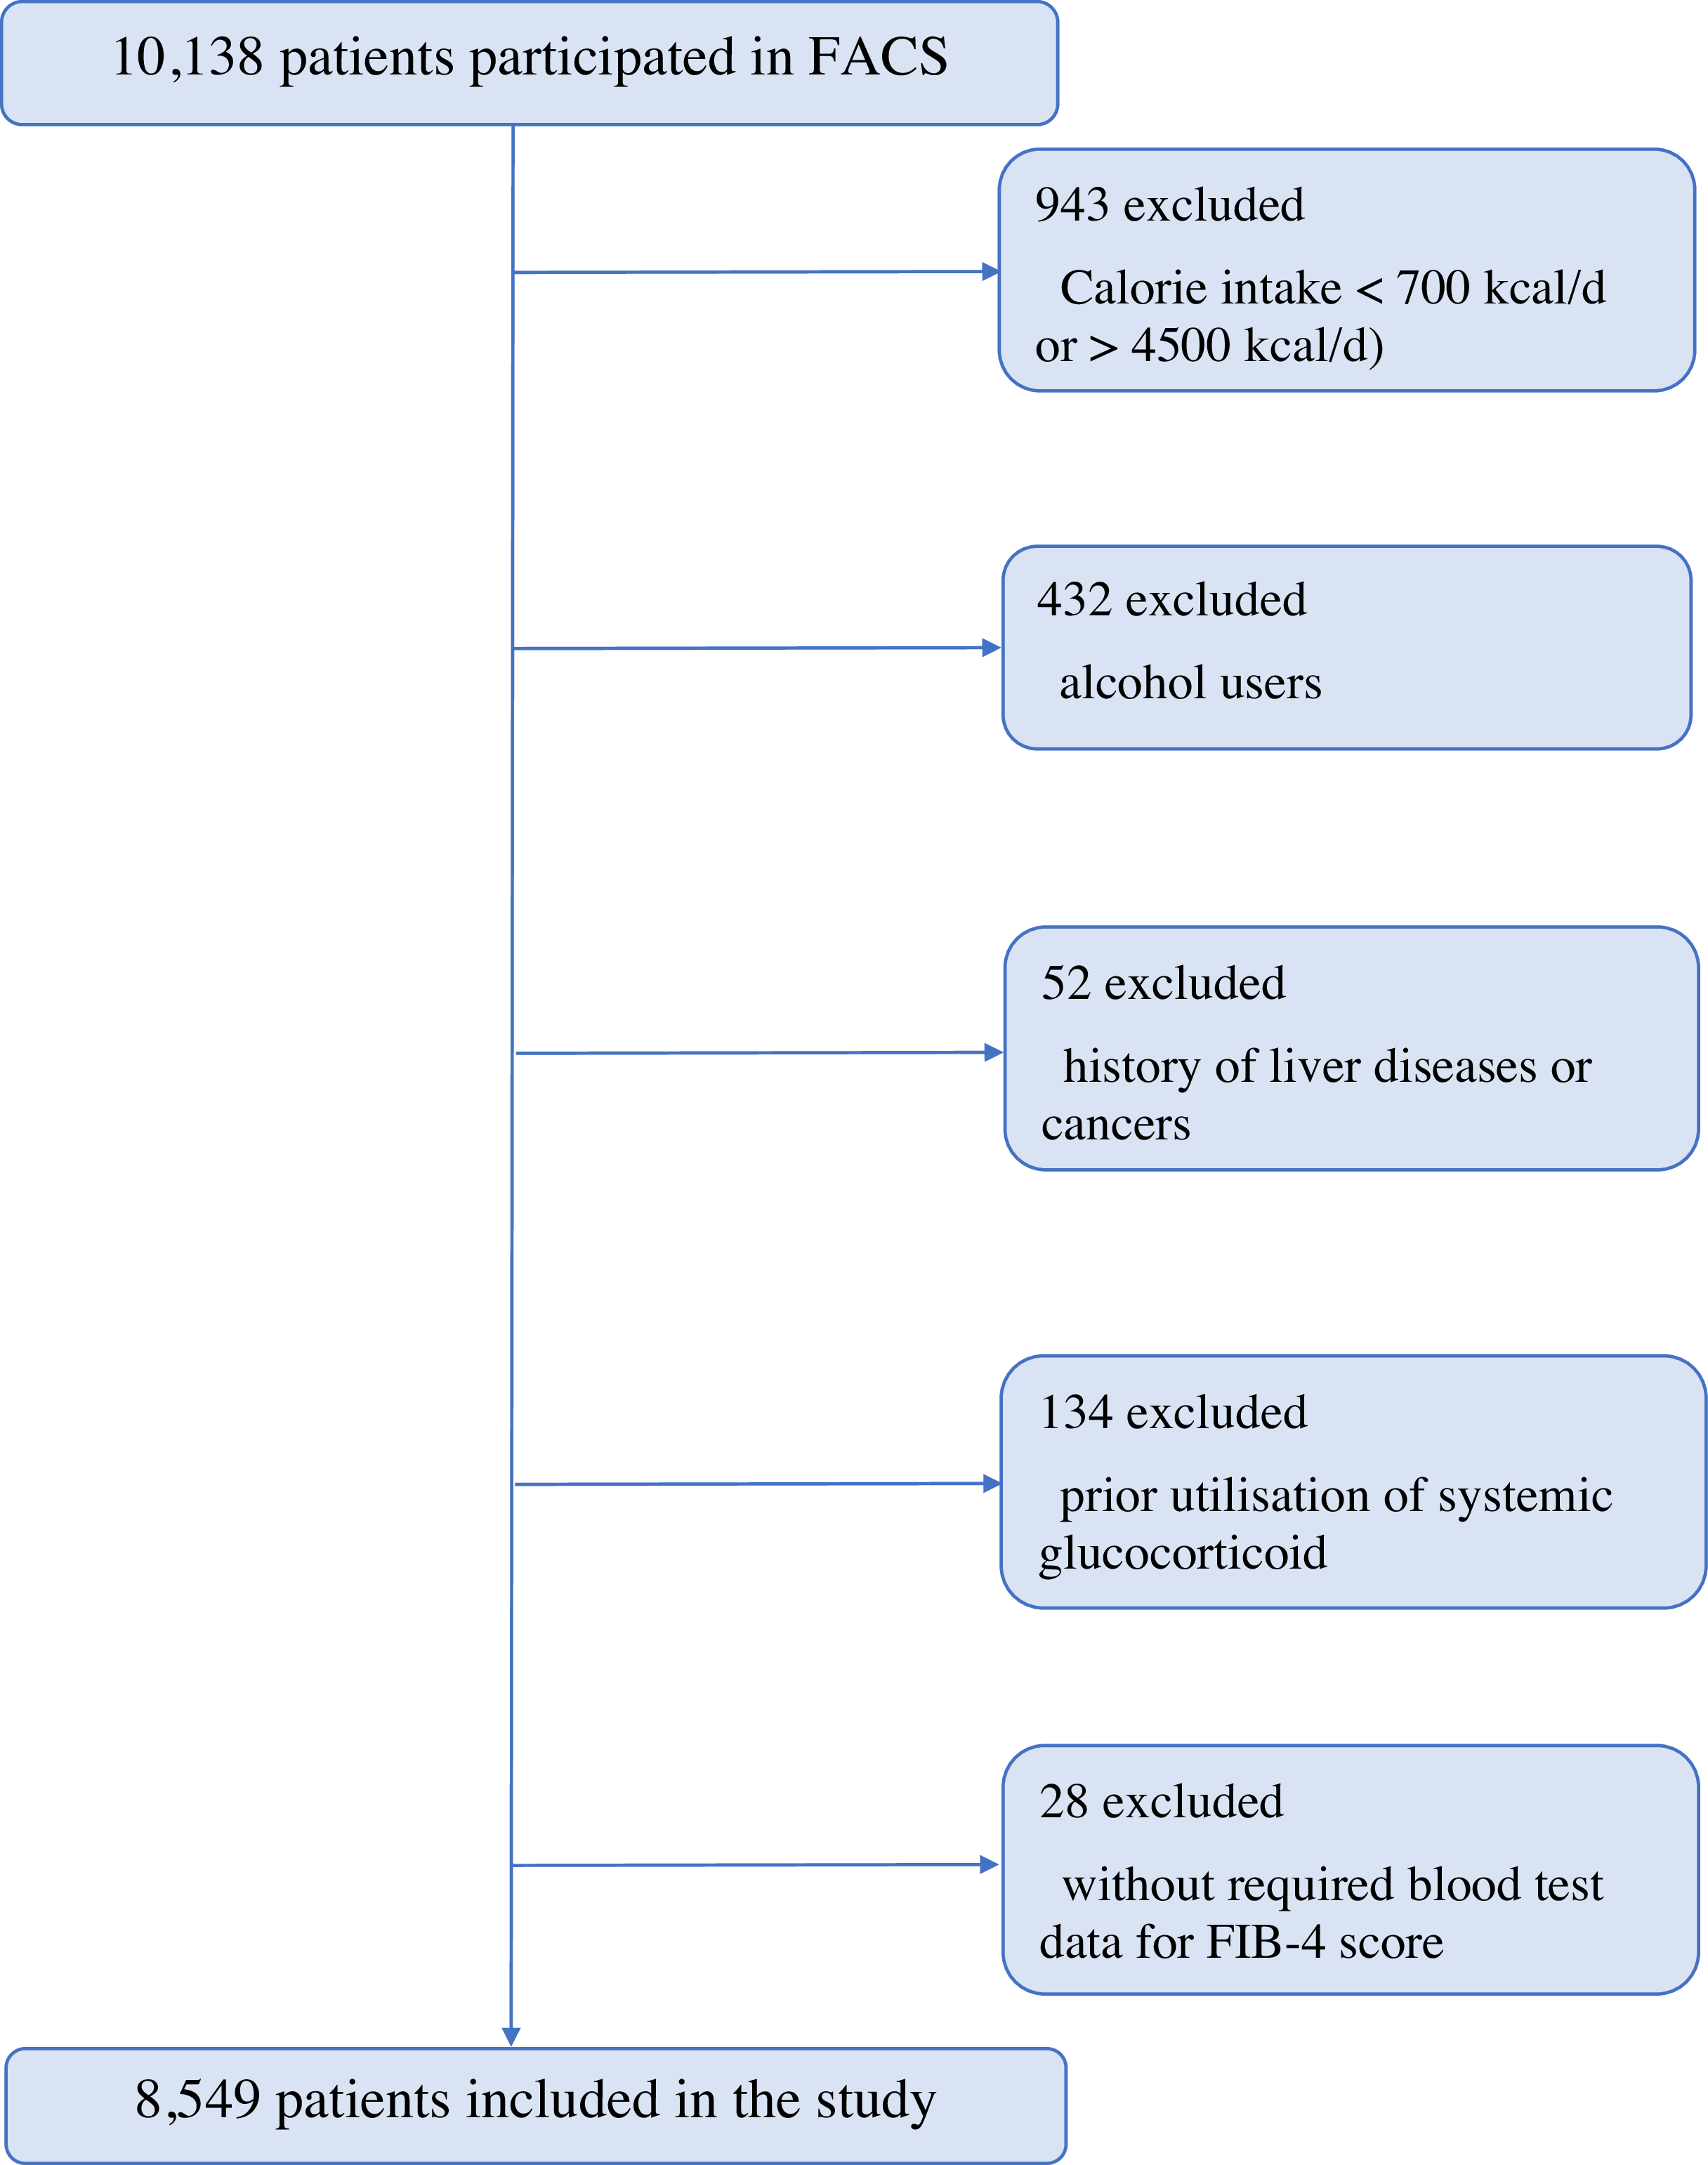
This cross-sectional study utilised data from the Fasa Adults Cohort Study(Reference Farjam, Bahrami and Bahramali12), a large population-based, longitudinal cohort targeting adults aged 35–70 years, residing in Sheshdeh, a suburb of Fasa in southwestern Iran. The study population was precisely refined via a systematic exclusion process to remove confounding factors, and after applying exclusion criteria, a final cohort of 8549 participants was included in the analysis. The selection process is summarised in Figure 1.
Participant selection flow chart and inclusion criteria overview.

Exclusion criteria
Participants were excluded if they met any of the following criteria:
-
1. Significant alcohol consumption, defined as > 20 g/d for women and > 30 g/d for men;
-
2. Secondary causes of hepatic steatosis, including the long-term use (more than 2 weeks within the previous 6 months) of systemic glucocorticoids;
-
3. Chronic liver diseases apart from MASLD, such as chronic hepatitis B or C (confirmed by HBsAg and HCV Ab tests), autoimmune hepatitis, Wilson’s disease or haemochromatosis;
-
4. History of malignancy that could interfere with nutritional status or liver fibrosis assessment.
Data collection
Nutritional assessment
Nutritional data were collected using a validated 125-item semi-quantitative FFQ, modified for the Iranian population(Reference Willett, Sampson and Stampfer13). Trained nutritionists conducted in-person interviews, asking participants to recall their typical food consumption over the past year(Reference Ariya, Shahraki and Farjam14). We requested nutrition experts from the area to investigate the FFQ and add any local FFQ items that were needed, in addition to the usual FFQ items. The local foods were chosen based on either foods that are common in Iran or foods that are high in nutrients and energy and are not already in the FFQ. Food portion sizes were standardised using United States Department of Agriculture (USDA) serving sizes and converted into grams per day for consistency. Nutrient intake was then calculated using Nutritionist IV software (version 7.0), which aggregates daily intake values based on the frequency and portion size of each reported food item(Reference Farjam, Bahrami and Bahramali12). The analysis included a wide range of nutrients categorised into three main groups: (1) Vitamins: A, B1, B2, B3, B6, B12, D, C, K, B5, E and folate; (2) minerals: Na, potassium, Fe, Mg, Ca, Se and Zn) and (3) macronutrients: protein, fibre and fats (including n-3 and n-6). Carbohydrates were removed from the LCA considering their high consumption and significant homogeneity throughout the Iranian population, often representing 60–70 % of total energy intake, as indicated by national surveys(Reference Heidari, Feizi and Azadbakht15). The primary aim was to determine dietary patterns based on components that exhibited considerable variation in intake, meaning that incorporating them would not have improved discriminative power. Nutrient intake levels were classified as sufficient or insufficient based on the recommended dietary allowances established by the Institute of Medicine (USA)(16). Based on the specific physiological requirements at different life stages and for different sexes, an intake that meets or exceeds the recommended dietary allowance was considered to be in ‘sufficient’ state, while an intake that falls short of these standards was considered to be in ‘insufficient’ state.
Covariates
Anthropometric measurements were taken by trained professionals following the guidelines established by the USA National Institutes of Health. Height and weight were measured using an unstretched tape measure (to the nearest 0·1 cm) and a digital scale (to the nearest 0·1 kg. Waist and hip circumferences were measured using an unstretched tape at the midpoint between the iliac crest and lower rib and at the maximal buttock circumference, respectively.
Key variables, including age, sex, socio-economic status (SES) and health behaviours such as smoking, alcohol consumption and physical activity, were collected using standard questionnaires from the Fasa Adults Cohort Study. Physical activity was quantified using the International Physical Activity Questionnaire, which provides a measure of the metabolic equivalent of tasks per day. SES was assessed using an asset-based index, which is commonly used in developing countries like Iran, and was divided into four quintiles, ranging from the poorest (1st quintile) to the richest (4th quintile)(Reference Farjam, Sharafi and Bahramali17).
Liver fibrosis assessment
The fibrosis-4 (FIB-4) index was used as a non-invasive tool to assess liver fibrosis severity. This index uses the following formula(Reference Sterling, Lissen and Clumeck18):
 $${\rm{FIB - }}4\,\, {\rm{ index}} = \left( {{\rm{Age}} \times {\rm{AST}}} \right)/\left( {{\rm{Platelet Count}} \times \surd {\rm{ALT}}} \right)$$
Higher FIB-4 scores correlate with more advanced liver fibrosis, reflecting increased liver damage and reduced platelet production due to progressive liver dysfunction. The scores were divided into three risk groups based on recognised cut-offs for advanced fibrosis: low risk (< 1·30), moderate risk (1·30–2·67) and high risk (> 2·67). An FIB-4 score below 1·30 indicates a high negative predictive value for ruling out advanced fibrosis. We merged intermediate- and high-risk groups (≥ 1·30) into a single group for analysis, identifying patients at higher risk of advanced liver fibrosis.(Reference Xu, Jiang and Wu19).
Statistical analysis
Descriptive statistics
Continuous variables were presented as means and standard deviations, while categorical variables as frequency (percentage). Differences in nutrient intake and clinical variables across dietary patterns were analysed using ANOVA for normally distributed data and the Kruskal–Wallis test for non-normally distributed data. Pairwise comparisons were conducted using the Bonferroni post hoc test for normally distributed data and the Mann–Whitney U test for non-normally distributed data. Categorical differences between latent classes were assessed using the adjusted Pearson χ 2 test.
Latent class analysis for identifying dietary patterns
LCA was employed to identify distinct dietary patterns within the study population, focusing on three main nutrient domains: vitamins, minerals and macronutrients. The optimal number of latent classes was determined using model fit criteria, including the Akaike information criterion, Bayesian information criterion (BIC) and the Lo–Mendell–Rubin adjusted likelihood ratio test (aLMR LR)(Reference Akaike, Petrov and Csaki20–Reference Lo, Mendell and Rubin22). Entropy statistic was used to assess classification quality, with values close to 1 indicating better model fit. The optimal number of classes was selected based on the lowest Akaike information criterion and BIC values and a significant P value < 0·001 for the aLMR LR test(Reference Ferguson, Moore and Hull23). Three distinct dietary patterns were identified for further analysis based on these criteria: the ‘High-volume, high-fibre/mineral-rich pattern,’ the ‘Moderate-volume, low-fibre/high-Na/mineral-poor pattern,’ and the ‘Restricted-volume, nutrient-depleted pattern.’ The participants were categorised into dietary pattern classes based on the highest probability, which were then utilised as the principal independent variable in the liver fibrosis models.
Logistic regression and multivariate analysis
The latent classes identified through LCA were incorporated into a logistic regression model to evaluate the association between dietary patterns and FIB-4 index. A three-step approach was used to assess the predictive ability of the latent classes(Reference Asparouhov and Muthen24,Reference Asparouhov and Muthén25) . Class membership was analysed using multinomial logistic regression, adjusting for covariates such as age, BMI, energy consumption, SES, smoking status, diabetes and hypertension. The Bolck–Croon–Hagenaars (?BCH) method was used to adjust for these covariates while maintaining the integrity of class definitions. In order to reduce the possibility of Type I errors caused by multiple comparisons of several classes and outcomes, we concentrated on findings that had higher levels of significance (P value < 0·01 and P value < 0·001) and examined consistency among the models. Preliminary multivariate analysis included assessments for multicollinearity among predictor variables using the variance inflation factor with acceptable values set at < 3 to reduce bias. Autocorrelation in residuals was evaluated using the Durbin–Watson test, while Cook’s distance was used to detect potential outliers. Residuals were assessed for normality using P-P plots to ensure the validity of model assumptions.
Software and missing data
Statistical analyses were performed using IBM SPSS Statistics version 24, Latent Gold 5.0 and R software version 4.0.2. A significance level of P < 0·05 was used for all analyses. Missing data were minimal (< 1 %), with BMI data showing the highest proportion of missing values (18 out of 8549). Missing values were imputed using the mean for continuous variables and the mode for categorical variables.
Result
Population characteristics
The baseline characteristics of the study population are summarised in online Supplementary Table S1. The mean age of participants was 48·81 (sd 9·49) (n 8549), with females comprising 58·2 % of the sample. The prevalences of diabetes, hypertension and smoking were 12·6 %, 20·4 % and 23·9 %, respectively. According to the FIB-4 score, 86·9 % of the population was classified as low risk for liver fibrosis, 12·4 % at intermediate risk and 0·7 % as high risk.
Latent class analysis findings
Online Supplementary Table S2 presents the Akaike information criterion, BIC, relative entropy values and P values from the aLMR LR test used to evaluate model fit. Based on these model fit statistics and the goal of parsimony, the three-class model was selected as the optimal solution. Additional details regarding these analysis are provided in the online Supplementary S1 Section.
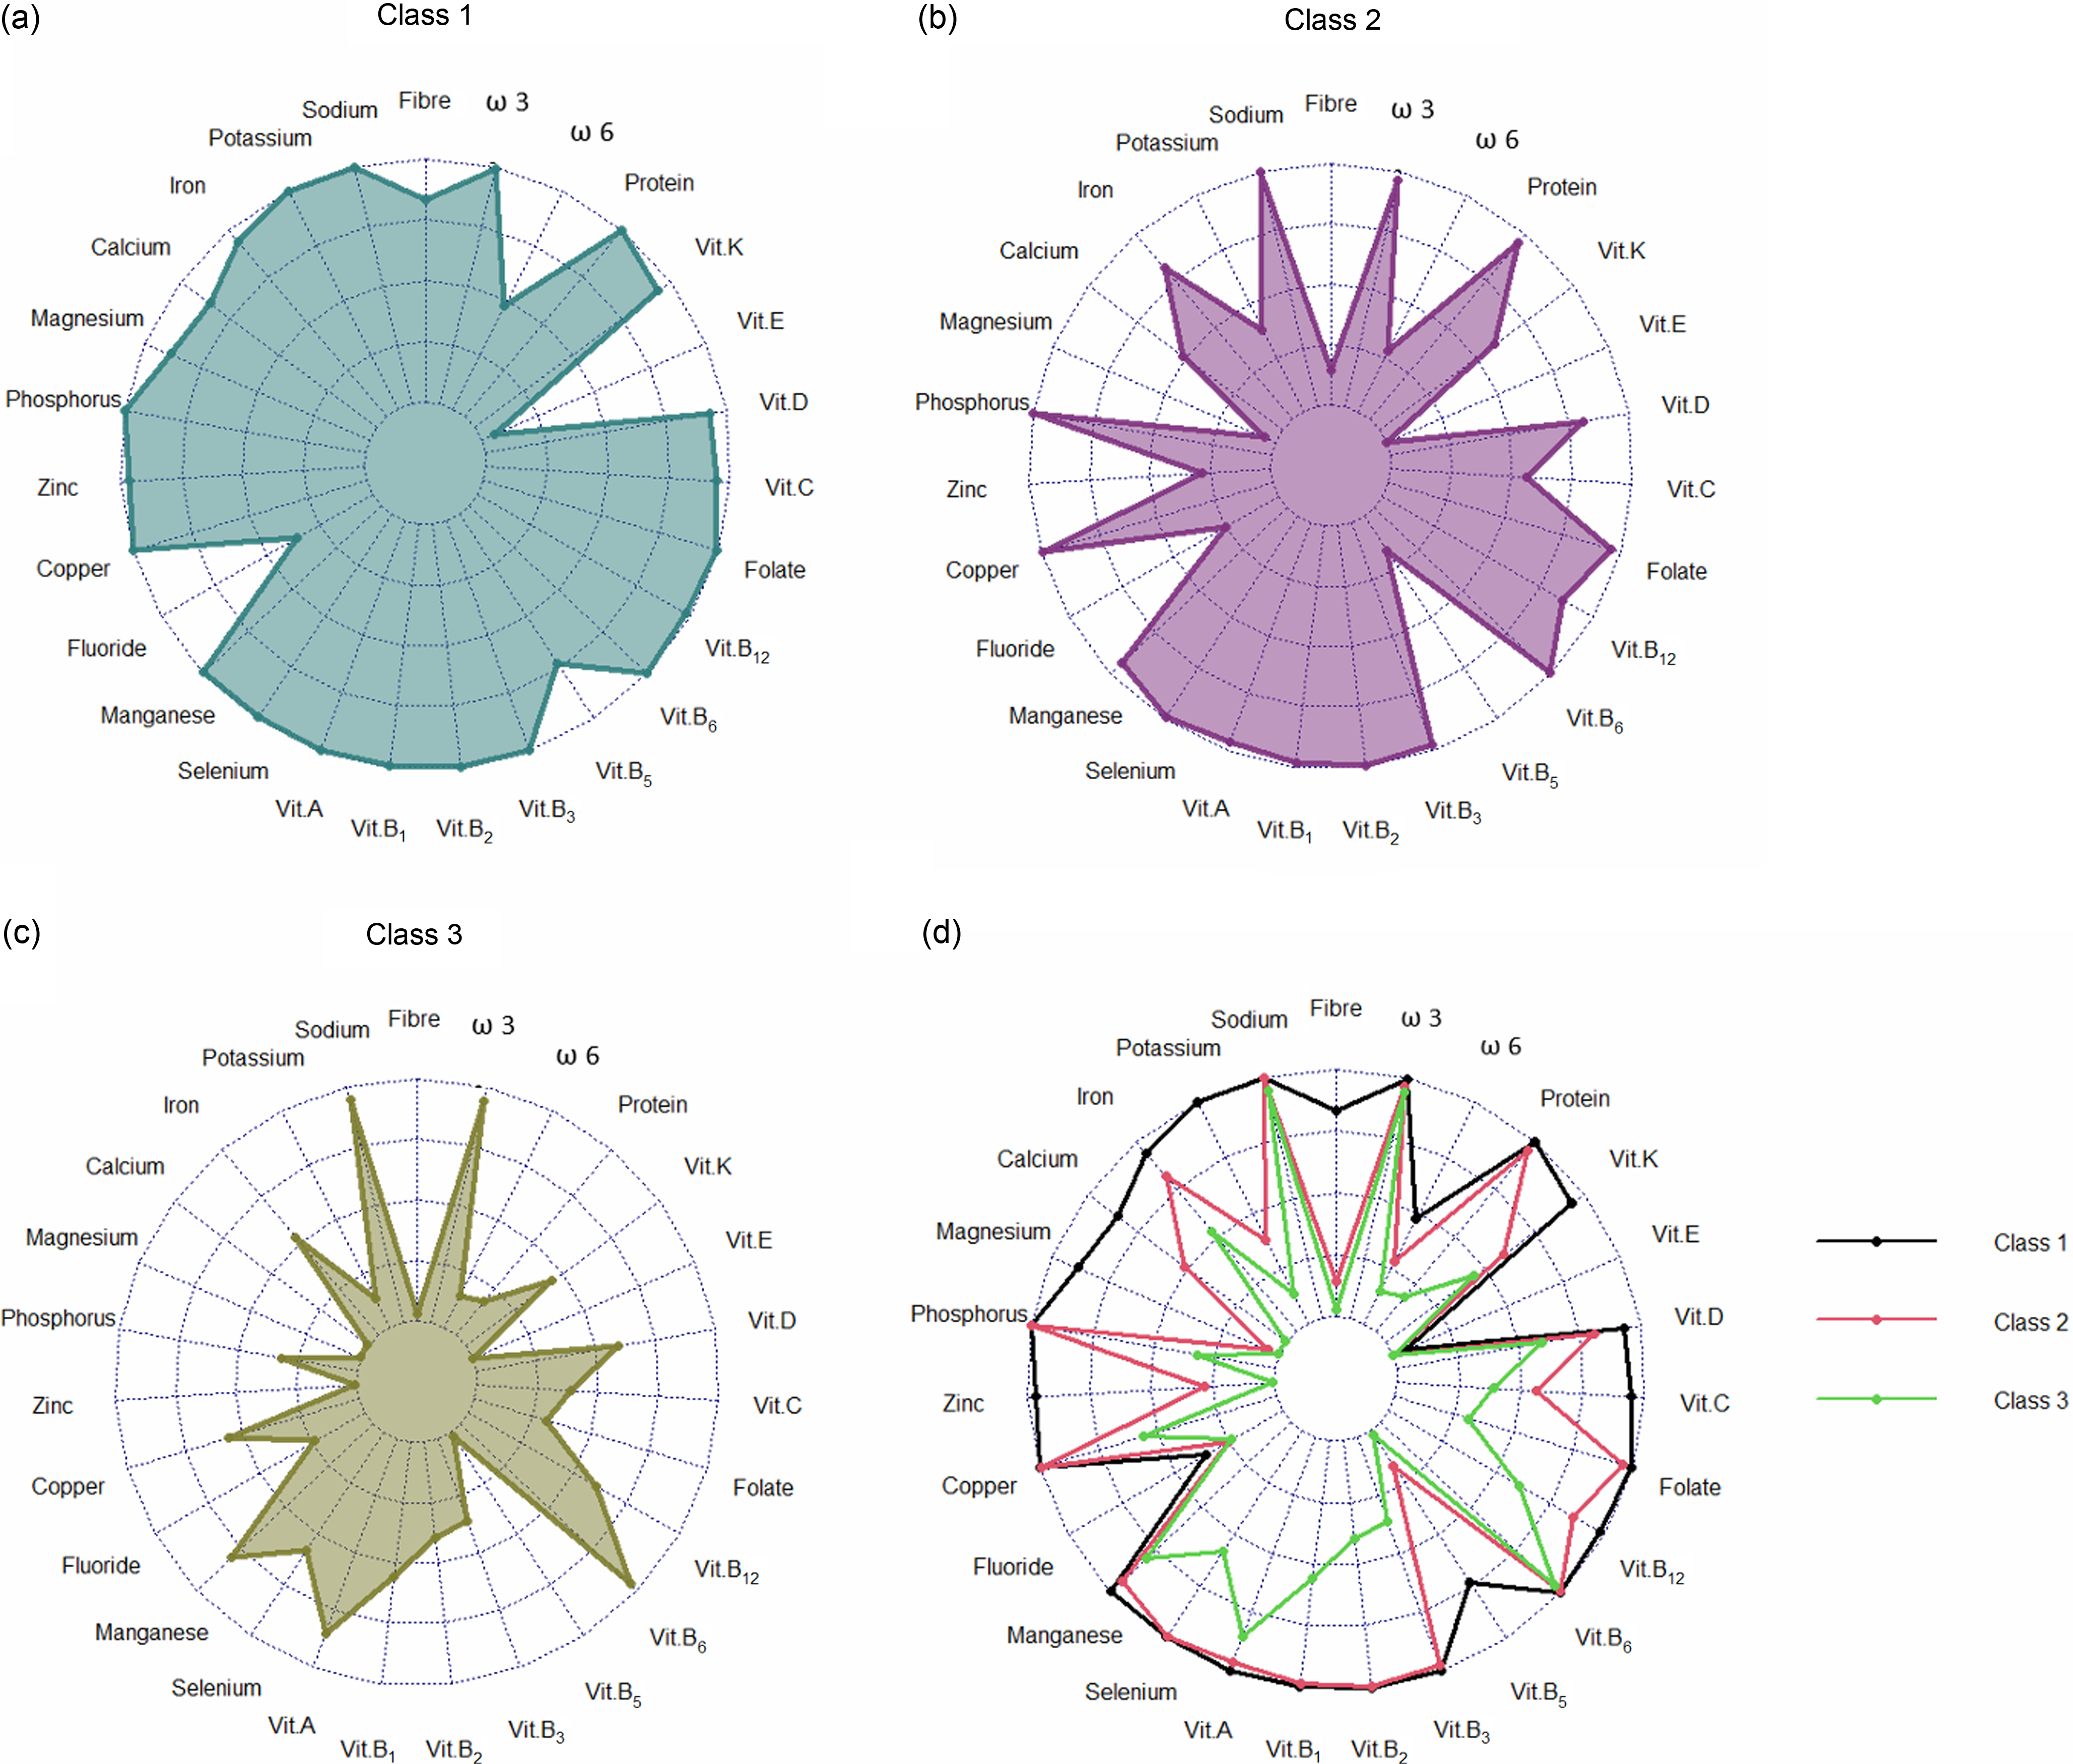
The membership probabilities for each nutrient across the latent classes identified by the LCA model are illustrated in Figure 2. The three identified classes include
-
Class 1 (High-Volume, High-Fibre/Mineral-Rich Pattern): The largest group, comprising 51·93 % of the total sample (n 4454), characterised by a high caloric intake and nutrient-dense dietary profile.
-
Class 2 (Moderate-Volume, Low-Fibre/ High-Na /Mineral-Poor Pattern): Accounting for 39·43 % of the population, characterised by a moderate energy intake and high Na intake in various nutrients, but reduced levels of fibre and certain critical minerals.
-
Class 3 (Restricted-Volume, Nutrient-Depleted Pattern): The smallest group comprising 8·64 % of the population (n 741), characterised by a restricted nutrient profile.
Profile plot of the 3-Class solution: (a) profile plot of Class 1; (b) profile plot of Cass 2; (c) profile plot of Class 3; and (d) profile plot of three classes together. Values indicate the probability of a specific nutrient being detected within an identified class.

Descriptive statistics and average daily servings of various micronutrients across these three classes are presented in online Supplementary Table S3. As shown in online Supplementary Table S4, there were no significant disparities in key demographic variables, such as age and BMI, among the classes. However, Class 1 revealed the highest daily average intake of calories, cholesterol and saturated fatty acids.
Step analysis
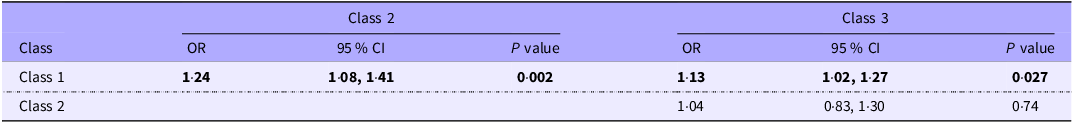
Table 1 shows the correlations between liver fibrosis risk and dietary pattern membership. The results revealed that Class 2 and Class 3 had significantly greater probabilities of moderate-to-high fibrosis risk than Class 1, which served as the reference group. Class 2 had a 24 % greater risk (OR = 1·24; 95 % CI: 1·08, 1·41; P = 0·002), and those who were in Class 3 had a 13 % higher risk (OR = 1·13; 95 % CI: 1·02, 1·27; P = 0·027). However, there was no significant difference in fibrosis risk when comparing Class 3 directly to Class 2 (OR = 1·04; 95 % CI: 0·83, 1·30; P = 0·74).
OR comparison of probable fibrosis between the classes

Results are presented as unadjusted (crude) OR to show the direct associations between latent class membership and fibrosis risk. Outcome is ‘moderate and high risk’ for fibrosis and the class with lower number is considered as reference category for comparisons between each pair of classes. Bold values indicate statistical significance (P < 0.05).
Unique associations between demographic and anthropogenic covariates and class membership
Multinomial logistic regression analysis was performed to assess the unique associations between demographic and anthropogenic covariates and class membership. To ensure the integrity of the model, four variables including sex, cholesterol intake, saturated fatty acids intake and waist circumference were excluded multicollinearity concerns (see online Supplementary S2 Section).
The results of the model highlighted distinct associations between various covariates and class membership when compared with Class 1 (online Supplementary Table S5). Specifically, age, BMI and hypertension did not significantly effects on class membership. In contrast, factors such as moderate to high SES and being a smoker were found to be associated with membership in both Class 2 and Class 3. Additionally, a higher exercise score was positively correlated with Class 2 membership, although this association was not statistically significant for Class 3. Notably, the presence of diabetes and the achievement of the minimum daily calorie intake were significant predictors that reduced the likelihood of belonging to either Class 2 or Class 3.
Class-specific associations between demographic and anthropogenic variables with liver fibrosis score
The findings from the class-specific analysis of demographic and anthropogenic variables in relation to liver fibrosis risk are presented in online Supplementary Table S6. This analysis used multiple linear regression to assess the relationship between various factors and the risk of liver fibrosis within both a class-specific context and an overall sample setting. The results revealed that age (β = 0·54 to 0·56, P < 0·001) was the strongest and most consistent predictor of fibrosis risk across all three dietary patterns. Also, smoking status exhibited significant positive correlations with liver fibrosis scores across all classifications. The most significant correlation was identified in the restricted-volume, nutrient-depleted pattern (Class 3) (β = 0·17, P < 0·001). Conversely, diabetes demonstrated a substantial negative correlation across all groups (β = −0·06 to −0·09, P < 0·01). Hypertension exhibited a comparable inverse trend, attaining high statistical significance in Class 1 (β = −0·05, P < 0·001) and Class 2 (β = −0·09, P < 0·001), yet failing to achieve significance in Class 3. Physical exercise was positively associated with fibrosis scores in both Class 1 and Class 2 (P < 0·01), but not in Class 3. Additionally, BMI and SES did not demonstrate any significant effects on liver fibrosis scores. Furthermore, the results indicated that the predictors employed in this analysis demonstrated class specificity. This was evidenced by the differences observed between the class-specific models and the overall model, validating the necessity of a tailored approach when examining nutrient profiles related to liver fibrosis risk factors. The R2 values for the class-specific models ranged from 0·29 to 0·34, while the R² value for the overall model was 0·30, suggesting these models explained approximately 29–34 % of the variance in liver fibrosis scores.
Discussion
To our knowledge, this study was the first to assess the relationship between the latent profile of dietary intake and liver fibrosis. Our study found that those with lower intakes of several nutrients, including vitamin B5, fibre, Mg, potassium, Zn, vitamin C, Ca and vitamin K, had a 1·24-fold increased risk of liver fibrosis.
In our study, Class 2 has a 24 % higher risk of fibrosis than Class 1, despite Class 2 having fewer diabetics, higher exercise scores, lower saturated fatty acid and cholesterol intake and higher socio-economic status, which are well-known risk factors for liver steatosis and fibrosis(Reference Musso, Gambino and Pacini26,Reference Zelber-Sagi, Ratziu and Oren27) . This suggests that the two groups’ varying levels of Zn, Mg, Ca, potassium, fibre, vitamin K, vitamin C and vitamin B5 play a crucial role, aligning with other studies that demonstrate a correlation between low intakes of specific nutrients and an increased risk of liver fibrosis(Reference Pickett-Blakely, Young and Carr28).
Zolfaghari et al. discovered a similar pattern in NAFLD patients, suggesting that a decrease in the consumption of fibre, folic acid, vitamin D, Zn and potassium may contribute to the advancement of the disease(Reference Zolfaghari, Askari and Siassi29). Another study reported that the likelihood of NAFLD was inversely proportional to a nutrient pattern consisting of fructose, vitamin C, vitamin A, pyridoxine, potassium and fructose, mostly supplied from fruits and vegetables(Reference Salehi-Sahlabadi, Teymoori and Ahmadirad30).
In accordance with our research, a large study with 13 489 participants revealed that increased Mg consumption correlated with an approximately 30 % reduction in the likelihood of fatty liver disease and prediabetes(Reference Li, Zhu and Song31). As Eshraghian et al. conducted in a study of healthy donors who had liver biopsies prior to liver transplants, serum Mg concentration is independently associated with hepatic steatosis and steatohepatitis(Reference Eshraghian, Nikeghbalian and Geramizadeh32). Additionally, the third NEHANS found that the risk of death from liver diseases decreased by 49 % with an increase of 100 mg of Mg intake(Reference Wu, Zhu and Fan33).
The National Health and Nutrition Examination Survey (?NHANES) study with 3571 people consistent with our investigation demonstrated that the Metabolic Dysfunction–Associated Fatty Liver Disease (MAFLD) population revealed lower vitamin K intake compared with the non-MAFLD population, suggesting that vitamin K intake may serve as a protective factor against MAFLD(Reference Wang, Zhang and Huang34). A study in Korean adults showed that the intake of vitamin C, vitamin K, folate, n-3 fatty acids, nuts and seeds and vegetables significantly reduces the risk of NAFLD(Reference Han, Jo and Lee35). Vitamin K influences on lipid metabolism, leading to a reduction in fat accumulation and enhancement of liver function(Reference Bordoloi, Ozah and Bora36,Reference Lin, Sun and Zhang37) . However, there is a deficiency of clinical data regarding vitamin K.
In addition to nutrients, smoking significantly influences class differentiation; Classes two and three have OR of 1·86 and 1·48 relative to class one, respectively. This aligns with existing research indicating a positive correlation between smoking as an independent factor and the development and progression of NAFLD through insulin resistance(Reference Zein, Unalp and Colvin38,Reference Hamabe, Uto and Imamura39) .
Extensive research has highlighted vitamin E as a key component in both the treatment and prevention of NAFLD(Reference Van Tien, Arisawa and Uemura40,Reference Mazidi, Ofori-Asenso and Kengne41) . Noticeably, our findings indicated that only 3·2 % of the population meet the recommended dietary allowance for vitamin E, but the mean was highest at 9·62 mg/d for class one and 6·33 and 4·53 for class two and three, respectively. It is consistent with a result of a study that only 8·0 % of men and 2·4 % of women in the USA met the estimated average requirements for vitamin E intake from foods alone(Reference Maras, Bermudez and Qiao42).
Our results provide valuable insights into the interplay between liver fibrosis and nutritional deficiencies. To the authors’ knowledge, the current research is the first to identify nutrient profiles regarding liver fibrosis through LCA. A notable characteristic of our study is a large sample size (8549) using population-based Fasa Adults Cohort Study data. Additionally, we engaged expert nutritionists during an in-person interview to report food data, utilising a validated and acceptable FFQ for the target population, rather than relying on self-reporting methods. We assessed the comprehensive dietary pattern rather than concentrating on a singular nutrient or a predetermined dietary score, such as the Mediterranean diet. One limitation of our study is the absence of biopsy or imaging-based validation for MASLD diagnosis. Consequently, more investigations are necessary to validate these dietary relationships in patients with a definitive diagnosis of MASLD via liver biopsy, ultrasonography, or transient elastography (FibroScan). Also, due to the study’s design, a cause-and-effect relationship cannot be established; therefore, future longitudinal investigations are necessary for a more precise identification of associations between dietary patterns and liver fibrosis, particularly those with limited clinical research evidence.
Conclusion
We can make a more precise prediction about overall dietary patterns and the prevalence of MASLD through evaluating general dietary patterns rather than focusing on a particular diet or food. This holistic approach assists both individuals in avoiding or better controlling MASLD and health policymakers in reducing the prevalence of chronic disorders like MASLD in society by altering the predominant dietary pattern. Future clinical studies with bigger sample sizes are needed to clarify the connection between MASLD and some specific lacking evidence nutrients, such as vitamin B5 and vitamin K.
Supplementary material
For supplementary material/s referred to in this article, please visit https://doi.org/10.1017/S0007114526106552
Acknowledgements
None.
This research did not receive any specific grant from funding agencies in the public, commercial or not-for-profit sectors.
M. R. and R. T: Conceptualisation, M. R. S. and M. R: Methodology and Visualization, R. T. and A. A: Data curation, M. R. and S. A. M: Writing – Original draft preparation, S. K., R. T., P. K. and M. R: Reviewing and Editing. All authors reviewed and approved the final version of the manuscript.
Authors are required to disclose financial or non-financial interests that are directly or indirectly related to the work submitted for publication.
The datasets analysed during the current study are available upon reasonable request from the corresponding author.
This study was approved by the ethics committee of Fasa University of Medical Science under reference number IR.FUMS.REC.1403.090 adhered to the ethical standards outlined by institutional and national research committees, following the principles of the 1964 Helsinki Declaration and its subsequent amendments or equivalent ethical standards. The written informed consent was acquired in writing from each participant.


 Open access