


Introduction
Social anxiety disorder (SAD) is a debilitating mental disorder with typical onset in late childhood or early adolescence (Beesdo et al., Reference Beesdo, Bittner, Pine, Stein, Höfler, Lieb and Wittchen2007; Stein et al., Reference Stein, Lim, Roest, De Jonge, Aguilar-Gaxiola, Al-Hamzawi, Alonso, Lepine, Navarro-Mateu, Pennell, Torres, Viana, Wojtyniak, Xavier, Kessler and Scott2017). Pediatric SAD is often persistent and increases the risk of other anxiety disorders and depression in adulthood (Beesdo et al., Reference Beesdo, Bittner, Pine, Stein, Höfler, Lieb and Wittchen2007) and is associated with high societal costs (Patel et al., Reference Patel, Knapp, Henderson and Baldwin2002; Stein et al., Reference Stein, Lim, Roest, De Jonge, Aguilar-Gaxiola, Al-Hamzawi, Alonso, Lepine, Navarro-Mateu, Pennell, Torres, Viana, Wojtyniak, Xavier, Kessler and Scott2017) The longitudinal course of pediatric SAD is highly variable, with some individuals spontaneously remitting while others experience severe difficulties across the lifespan (Aune et al., Reference Aune, Nordahl and Beidel2022). Although evidence-based treatments exist (Nordh et al., Reference Nordh, Wahlund, Jolstedt, Sahlin, Bjureberg, Ahlen, Lalouni, Salomonsson, Vigerland, Lavner, Öst, Lenhard, Hesser, Mataix-Cols, Högström and Serlachius2021; Williams et al., Reference Williams, McCaul, Schwarzer, Cipriani, Stein and Ipser2020), a significant proportion of patients do not benefit sufficiently (Evans et al., Reference Evans, Chiu, Clark, Waite and Leigh2021), and prediction of treatment outcome remains challenging. Previous studies have reported worse treatment response to CBT in youth with SAD compared to other anxiety disorders (Evans et al., Reference Evans, Chiu, Clark, Waite and Leigh2021). This relatively lower effectiveness of CBT, combined with the early age of onset and often chronic course of SAD underscore the importance of identifying factors maintaining the symptomatology in pediatric populations. The inclusion of objective markers in treatment research has been advocated (Holmes et al., Reference Holmes, Ghaderi, Harmer, Ramchandani, Cuijpers, Morrison, Roiser, Bockting, O ’connor, Shafran, Moulds and Craske2018).
Information-processing accounts of social anxiety state that altered attention to socially relevant information such as faces contributes to the maintenance, and potentially the etiology of the condition (Hirsch & Clark, Reference Hirsch and Clark2004; Lau & Waters, Reference Lau and Waters2017). According to an influential hypothesis, socially anxious individuals have a bias to attend to cues signaling potential negative social evaluation, which in turn limits the attentional resources needed for social interaction (Wong & Rapee, Reference Wong and Rapee2016).
Visual attention unfolds in a coordinated sequence of rapid eye movements (saccades) and fixations known as a scanpath (Duchowski, Reference Duchowski2017). Since visual information at the center of a fixation is heavily prioritized in all stages of cortical processing, the distribution of the scanpath is one of the key aspects of visual information selection. People with SAD commonly experience direct eye contact and perceived threatening facial expressions as anxiety-evoking (e.g., Schneier et al., Reference Schneier, Pomplun, Sy and Hirsch2011). In an attempt to understand this feature of SAD, several studies have examined how individuals with SAD scan faces. So far, the vast majority of studies were conducted with adults. Most studies examined the total accumulated looking time to images or videos of faces or regions within faces (such as the eyes) during scanpaths spanning from seconds to minutes. A relatively consistent finding from this research is that adults with SAD look less than healthy controls at images of faces with threat-relevant emotional expressions such as anger (Chen et al., Reference Chen, Van Den Bos and Westenberg2020; Günther et al., Reference Günther, Kropidlowski, Schmidt, Koelkebeck, Kersting and Suslow2021). This has been termed attentional avoidance and has been hypothesized to be analogous to the behavioral avoidance strategies used by individuals with SAD to reduce anxiety in everyday life. However, it has been difficult to demonstrate a link between attentional avoidance and real life avoidance behaviors (Price et al., Reference Price, Allen, Silk, Ladouceur, Ryan, Dahl, Forbes and Siegle2016; Van Ryckeghem et al., Reference Van Ryckeghem, Crombez, Goubert, De Houwer, Onraedt and Van Damme2013). Thus, it is possible that attentional avoidance reflects an atypical information processing strategy rather than anxious avoidance. An alternative theory suggests that SAD is associated with a biphasic pattern of attention characterized by initial heightened vigilance to threat-relevant stimuli followed by subsequent avoidance (Boll et al., Reference Boll, Bartholomaeus, Peter, Lupke and Gamer2016; Chen et al., Reference Chen, Thomas, Joseph, Clarke, Hickie and Guastella2015; Horley et al., Reference Horley, Williams, Gonsalvez and Gordon2003). Recent reviews (Chen et al., Reference Chen, Van Den Bos and Westenberg2020; Lisk et al., Reference Lisk, Vaswani, Linetzky, Bar-Haim and Lau2019) concluded that cross-sectional data from adults were more consistent with attentional avoidance than hypervigilance.
The period from late childhood to adolescence is a critical time for the emergence of social anxiety symptoms, with many individuals first meeting diagnostic criteria during these years (Beesdo et al., Reference Beesdo, Bittner, Pine, Stein, Höfler, Lieb and Wittchen2007; Stein et al., Reference Stein, Lim, Roest, De Jonge, Aguilar-Gaxiola, Al-Hamzawi, Alonso, Lepine, Navarro-Mateu, Pennell, Torres, Viana, Wojtyniak, Xavier, Kessler and Scott2017). Examining social attention processes in this age group is therefore essential for understanding the mechanisms that contribute to the onset and maintenance of the disorder. In typical development, differences are seen in emotional face processing between adolescents and adults. For example, adolescents tend to have increase responses to emotional faces in subcortical regions such as the amygdala than adults, but reduced dorsolateral prefrontal activation, a pattern consistent with reduced top-down control (Haller et al., Reference Haller, Cohen Kadosh, Scerif and Lau2015; Pozzi et al., Reference Pozzi, Vijayakumar, Rakesh and Whittle2021). The motivational salience of emotional faces tends to be higher in adolescence (Fombouchet et al., Reference Fombouchet, Pineau, Perchec, Lucenet and Lannegrand2023), which may lead to increase opportunities for social learning (Lau & Waters, Reference Lau and Waters2017).
Research focusing exclusively on adults may miss key features of how social anxiety is expressed earlier in life. However, only a small number of eye-tracking studies have examined visual scanning of faces in children and adolescents with SAD. While the majority of these studies have reported instances of altered social attention, the type and extent of these differences vary considerably. A bias to fixate quicker on angry faces (e.g., vigilance) was found in children with SAD compared to healthy controls when angry faces were presented in pair with neutral faces (Capriola-Hall et al., Reference Capriola-Hall, Ollendick and White2020; Schmidtendorf et al., Reference Schmidtendorf, Wiedau, Asbrand, Tuschen-Caffier and Heinrichs2018; Seefeldt et al., Reference Seefeldt, Krämer, Tuschen-Caffier and Heinrichs2014) but not when paired with happy faces or non-social stimuli (Capriola-Hall et al., Reference Capriola-Hall, Ollendick and White2020; Högström et al., Reference Högström, Nordh, Larson Lindal, Taylor, Serlachius and Lundin Kleberg2019; Schmidtendorf et al., Reference Schmidtendorf, Wiedau, Asbrand, Tuschen-Caffier and Heinrichs2018; Seefeldt et al., Reference Seefeldt, Krämer, Tuschen-Caffier and Heinrichs2014). There is limited evidence that children with SAD look less at threat-related emotional faces (e.g., show attentional avoidance) in lab based tasks (Chen et al., Reference Chen, Van Den Bos and Westenberg2020; Lisk et al., Reference Lisk, Vaswani, Linetzky, Bar-Haim and Lau2019). However, using an innovative design, Lidle & Schmitz (Reference Lidle and Schmitz2024) studied eye movements during a stress-inducing live interaction in children with SAD and found evidence for reduced fixations on the face of a speaking partner during later stages of the experiment, indicating avoidance after stress induction. Studies examining attention to the eye regions specifically found some evidence for quicker orienting to this region (Keil et al., Reference Keil, Hepach, Vierrath, Caffier, Tuschen-Caffier, Klein and Schmitz2018) and delayed disengagement once the eyes were fixated (Kleberg et al., Reference Kleberg, Högström, Sundström, Frick and Serlachius2021). Taken together, while face scanning alterations were reported by several studies, these do not give clear support for the idea of vigilance to, and/or avoidance of specific threat-relevant emotions. Instead, pediatric SAD may be characterized by atypical face scanning across emotional expressions.
Visual attention to faces follows a rapid and relatively uniform scanpath where gaze is first directed to the eye region and subsequently redirected to other inner regions (typically the mouth) (Bombari et al., Reference Bombari, Mast and Lobmaier2009; Eisenbarth & Alpers, Reference Eisenbarth and Alpers2011). Throughout the scanpath, the eye region remains the most fixated part of the face (Falck-Ytter et al., 2023). Most previous studies analyzed either specific steps of the scanpath (e.g., the time to a first fixation on a face) or averaged over the whole scanpath (e.g., the total looking time at a face over several seconds). However, eye tracking technology enables rapid and spatially precise measurement of gaze allocation and is ideal for studies examining how visual attention unfolds in real time. This in turn allows researchers to move beyond a binary classification of attention as either vigilant or avoidant and instead measure the temporal and spatial distribution of the entire scanpath. Previous studies in adults with SAD reported an atypical scanpath distribution, characterized by more wide scanning, potentially reflecting attentional avoidance (Chen et al., Reference Chen, Thomas, Joseph, Clarke, Hickie and Guastella2015; Horley et al., Reference Horley, Williams, Gonsalvez and Gordon2003, Reference Horley, Williams, Gonsalvez and Gordon2004). Interestingly, this pattern may be reversed in children with SAD, where more restricted scanning of faces was found in a study including one of the largest eye tracking studies to date (Kleberg et al., Reference Kleberg, Löwenberg, Lau, Serlachius and Högström2021). In this study, youth with SAD (n = 61), differed from a healthy control group in the distribution of the scanpath, but not in traditional metrics such as the average looking time at the eyes. Furthermore, in contrast to previous studies (Keil et al., Reference Keil, Hepach, Vierrath, Caffier, Tuschen-Caffier, Klein and Schmitz2018; Kleberg et al., Reference Kleberg, Hanqvist, Serlachius and Högström2019), there was no consistent group difference between participants with SAD and controls in autonomic nervous system responses, measured with pupil dilation.
During emotional face perception, the scanpath is flexibly adjusted to factors such as motivation (Sassenrath et al., Reference Sassenrath, Sassenberg, Ray, Scheiter, Jarodzka and Pourtois2014), perceived emotional intensity, learning history (Kleberg et al., Reference Kleberg, Selbing, Lundqvist, Hofvander and Olsson2015), task demand and processing strategy (Bombari et al., Reference Bombari, Mast and Lobmaier2009; Schurgin et al., Reference Schurgin, Nelson, Iida, Ohira, Chiao and Franconeri2014), indicating a functional role in information processing.
Faces are one of the most important means of information transmission in humans, and atypical social attention in childhood may therefore have cascading developmental consequences by reducing opportunities to learn from the outcomes of social interaction (Falck-Ytter et al., Reference Falck-Ytter, Kleberg, Portugal and Thorup2023). Restricted scanpaths could therefore potentially be a risk factor for continuing symptoms. If this is correct, children with wider scanpaths should show greater symptom reduction over time. So far, this has not been examined. Evidence-based psychological treatments for SAD include several components which are likely to be influenced by one’s ability to process facial cues, such as social skills training and learning to interpret others’ emotions in a more adaptive way (Nordh et al., Reference Nordh, Wahlund, Jolstedt, Sahlin, Bjureberg, Ahlen, Lalouni, Salomonsson, Vigerland, Lavner, Öst, Lenhard, Hesser, Mataix-Cols, Högström and Serlachius2021; Scaini et al., Reference Scaini, Belotti, Ogliari and Battaglia2016). Individual differences in face processing could therefore be part of the developmental mechanisms underlying long-term change in social anxiety. If this is correct, symptom reduction during treatment should be associated with changes in social attention. However, this has not yet been tested.
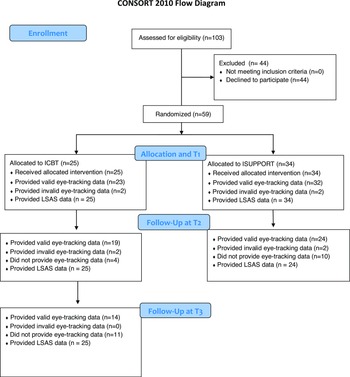
The current study presents a long-term follow-up of children with SAD who participated in a randomized controlled trial (RCT, Nordh et al, Reference Nordh, Wahlund, Jolstedt, Sahlin, Bjureberg, Ahlen, Lalouni, Salomonsson, Vigerland, Lavner, Öst, Lenhard, Hesser, Mataix-Cols, Högström and Serlachius2021). After a baseline assessment, participants were randomized to treatment with either internet-delivered cognitive behavioral therapy (ICBT) or internet-delivered supportive treatment (ISUPPORT) and assessed by a blinded evaluator again three months after treatment. Nordh and colleagues reported symptom reduction after both treatments, but ICBT was superior, reflected in a standardized between treatment groups effect of d = 0.67 (for further details, see (Nordh et al., Reference Nordh, Wahlund, Jolstedt, Sahlin, Bjureberg, Ahlen, Lalouni, Salomonsson, Vigerland, Lavner, Öst, Lenhard, Hesser, Mataix-Cols, Högström and Serlachius2021)). Kleberg et al. (Reference Kleberg, Högström, Sundström, Frick and Serlachius2021) measured scanpaths during emotion recognition at baseline assessment in participants with SAD recruited from Nordh et al. (Reference Nordh, Wahlund, Jolstedt, Sahlin, Bjureberg, Ahlen, Lalouni, Salomonsson, Vigerland, Lavner, Öst, Lenhard, Hesser, Mataix-Cols, Högström and Serlachius2021) and matched healthy controls, and found that the group with SAD was characterized by reduced scanpaths. An example of a wide and a restricted scanpath in data from the first timepoint is shown in Figure 1.
Examples of wide (A) and restricted scanpaths (B) in data from T1. The left panel shows individual fixations as red circles. The right panel shows heatmaps of fixation density of the same data. Wide and restricted scanpaths were defined as values above and below the grand mean +1.75 and –1.75 standard deviations respectively.

We tested the hypothesis that 1) restricted scanpaths at baseline would predict a worse response to treatment and SAD, 2) that scanpath distribution would increase from T1 to T2, and 3) that the level of this hypothesized increase would be positively associated with symptom reduction. The analysis plan was registered at Open Science Framework before the analysis (link: osf.io/sr3qe).
Methods
Study design
Participants were recruited from an RCT comparing the efficacy of ICBT compared to ISUPPORT (Nordh et al., Reference Nordh, Wahlund, Jolstedt, Sahlin, Bjureberg, Ahlen, Lalouni, Salomonsson, Vigerland, Lavner, Öst, Lenhard, Hesser, Mataix-Cols, Högström and Serlachius2021). ICBT included standard CBT components for SAD, including exposure, social skills training, psychoeducation about SAD, and focus shifting. ISUPPORT included psychoeducation about SAD, guidance on interpersonal relationships, strategies for managing challenging social situations and recommendations for maintaining healthy habits. Both treatments lasted 10 weeks and were led by clinical psychologists with CBT training. Eye tracking at T1 was completed within two weeks of treatment allocation and at T2 three months after treatment termination, which was also the primary endpoint of the RCT. Participants completed the eye tracking task together with other clinical measures and other eye tracking tasks not analyzed here. Participants treated with ICBT completed a second follow-up assessment 12 months after treatment (T3). Due to the covid-19 pandemic, on site data collection had to be halted during parts of the study period. As a consequence, only 14/25 participants initially treated with ICBT completed the eye tracking task at T3, whereas 25 had valid LSAS data. Patients receiving ISUPPORT who fulfilled the criteria for SAD at T2 were offered additional treatment with ICBT and were seen again 12 months after ICBT treatment, or 12 months after T2 if they did not cross over to ICBT. Twelve-months follow up data were collected from 14/34 treated with ISUPPORT. Due to the small sample size, high attrition level, and heterogeneous treatment history and follow-up interval of the initial ISUPPORT group, we restricted T3 analyses to the subsample initially treated with ICBT. Only LSAS data was included in these analyses.
Participants
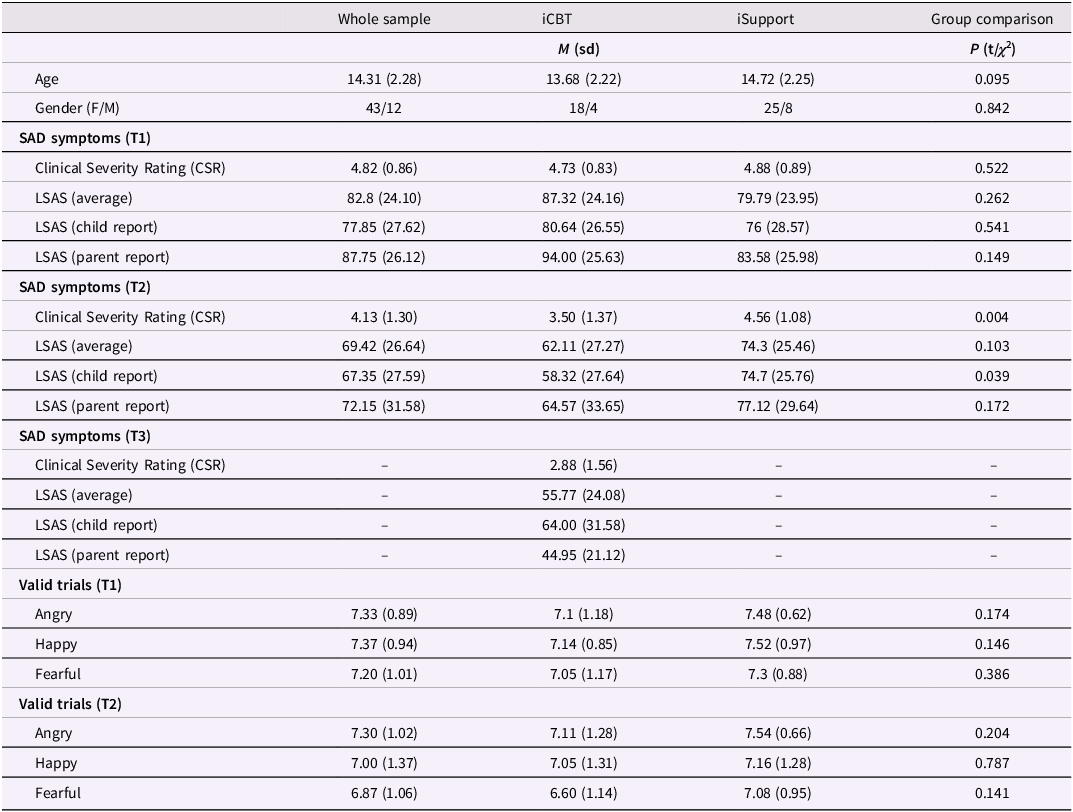
Of 103 RCT participants with SAD, 59 agreed to take part in this study and completed the eye-tracking task at T1 (see flow chart in Figure 2). Participants’ demographic and clinical characteristics are shown in Table 1.
Study flow chart.

Demographics, SAD symptoms and average number of valid trials

Table 1 Long description
The table presents demographic and clinical characteristics of participants in a study on social anxiety disorder (SAD). It includes data for the whole sample and two groups, iCBT and iSupport, with group comparisons. The table has 30 rows and 5 columns. Column headers are Whole sample, iCBT, iSupport, and Group comparison. Row labels include Age, Gender (F/M), SAD symptoms at three time points (T1, T2, T3) with various measures like Clinical Severity Rating (CSR) and LSAS (average, child report, parent report), and Valid trials at T1 and T2 for different emotions (Angry, Happy, Fearful). Each row provides mean values and standard deviations for the whole sample and the two groups, along with p-values for group comparisons. Notable trends include changes in CSR and LSAS scores over time and differences between the iCBT and iSupport groups.
Comorbid diagnoses at T1 were specific phobia (n = 7), generalized anxiety disorder (n = 10), depression (n = 4), attention deficit/hyperactivity disorder (n = 3), separation anxiety (n = 1) and panic disorder (n = 1). Inclusion criteria were a principal diagnosis of SAD, fluency in Swedish, internet access and a parent being able to aid with the treatment. The exclusion criteria were having started (or changed dose of) psychotropic medication within 6 weeks prior to inclusion, a diagnosis of bipolar disorder, autism, or psychosis, severe eating disorder, substance or alcohol abuse or a high suicide risk, or having received CBT for any anxiety disorder during the last 6 months.
Two individuals with SAD medicated with selective serotonin reuptake inhibitors (SSRIs), three with stimulants (lisdexamfetamine), and one with melatonin. At T2, diagnoses other than SAD were specific phobia (n = 7), generalized anxiety disorder (n = 2), depression (n = 3), and body dysmorphic disorder (n = 1). See Figure 2 for a study flow chart.
Participants aged 15–17 and their legal guardians provided written informed consent to participate. Participants aged 10–14 were informed about the study aims and procedure and gave verbal consent to participate, whereas their legal guardians gave written consent. The study was approved by the Stockholm regional research ethics committee (decision number 2017/1142-31/4).
Clinical assessment
A diagnosis of SAD according to DSM-5 criteria (American Psychiatric Association, 2013) was confirmed at T1 through an assessment by a clinical psychologist using the Anxiety Disorders Interview Schedule, Child Version (ADIS-C; Silverman, Reference Silverman and Albano1996). The assessment was repeated at T2 and T3. Assessing clinicians were trained in ADIS-C by experienced instructors. All participants received an ADIS-C Clinical Severity Score (CSR) of 4 or above at T1, confirming clinically significant symptoms. SAD symptoms were measured using the Liebowitz social anxiety scale for children and adolescents (LSAS-CA) and for parents (LSAS-P). The LSAS was initially developed as a clinician rated measure (Masia-Warner et al., Reference Masia-Warner, Storch, Pincus, Klein, Heimberg and Liebowitz2003) but subsequent studies have validated it as a self-report measure (Fresco et al., Reference Fresco, Coles, Heimberg, Liebowitz, Hami, Stein and Goetz2001; Schmits et al., Reference Schmits, Heeren and Quertemont2014) and it has also been used as a parent rated instrument. The LSAS-CA has shown good to excellent psychometric properties (Fresco et al., Reference Fresco, Coles, Heimberg, Liebowitz, Hami, Stein and Goetz2001; Schmits et al., Reference Schmits, Heeren and Quertemont2014)
Participants and their parents were invited to complete LSAS ratings at three time points between T1 and T2 as part of the RCT. Ratings of SAD symptoms were completed online. The percentage of missing data ranged from 0-16% at the six time points from T1 to T3.
In the current study, parent- and self-rated LSAS scores were correlated at T1 at r (62) = .63, p < .001 and at T2 at r (54) = .62, p < .001. Internal consistency (Cronbach’s α) was excellent at all six time points in the current sample (all α >.94).
Eye tracking task
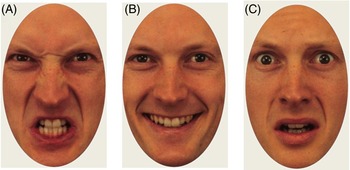
Participants viewed images of emotional faces presented in isolation for four seconds and were subsequently asked to indicate with a mouse click whether the depicted person felt angry, happy, or fearful. Stimuli were evenly distributed between the three emotions (eight trials per emotion). The same actors appeared once with each expression, meaning that the stimulus set contained eight unique actors (50% male, 50% female). Stimulus images were cropped to show only the inner regions of the face (see Figure 3 for examples). Two unique stimulus sets were created (each with eight unique actors displaying the three emotions) with images drawn from the Karolinska Directed Emotional Faces library (Flykt et al., Reference Flykt and Öhman1998). Participants alternated between stimulus sets between timepoints. The order of presentation was counterbalanced between participants.
Example of stimuli from the angry (A), happy (B), and fearful (C) condition.

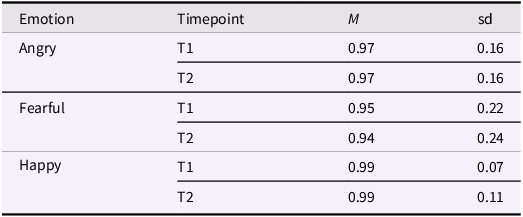
Each trial began with a fixation cross on a uniform gray screen for 2 s, followed by the stimulus for 4 s. This presentation time was chosen to provide enough time for multiple subsequent visual fixations (a scanpath) and for the development of a pupil dilation response. To avoid differences in explicit emotion recognition as a confounder in the eye tracking analyses, stimulus images were selected to be easily recognized. Directly following presentation of each stimulus, participants were instructed to indicate with a mouse click whether the model was angry, happy, or fearful. As can be seen in Table 2, recognition was close to ceiling at both time points. Trials in which the emotion was not correctly recognized were removed from the analysis.
Proportion of correctly identified images

Table 2 Long description
The table presents the proportion of correctly identified images for three emotions: Angry, Fearful, and Happy, at two time points: T1 and T2. The table has three rows and four columns. The columns are labeled Emotion, Timepoint, M, and sd. The rows are grouped by emotion and timepoint. Row 1: Emotion, Angry; Timepoint, T1; M, 0.97; sd, 0.16. Row 2: Emotion, Angry; Timepoint, T2; M, 0.97; sd, 0.16. Row 3: Emotion, Fearful; Timepoint, T1; M, 0.95; sd, 0.22. Row 4: Emotion, Fearful; Timepoint, T2; M, 0.94; sd, 0.24. Row 5: Emotion, Happy; Timepoint, T1; M, 0.99; sd, 0.07. Row 6: Emotion, Happy; Timepoint, T2; M, 0.99; sd, 0.11.
Recording and analysis of eye tracking data
Stimuli were presented on a 17-inch monitor with a screen resolution of 1280 × 1024 pixels. Participants were seated at approximately 60 centimeters distance from the screen. A nine-point manual calibration was completed using the manufacturer software Tobii Studio. The calibration procedure was validated through visualization of recorded gaze points during calibration, and repeated by the test leader if it was not successful. Data were recorded at 120 HZ using a Tobii X-120 corneal reflection eye tracker (Tobii Inc., Danderyd, Sweden).
Following (Kleberg et al., Reference Kleberg, Löwenberg, Lau, Serlachius and Högström2021), fixations were identified with the following steps. First, gaps in the data shorter than 100 milliseconds (ms) were covered by linear interpolation. Subsequently, the raw X and Y coordinates were smoothed using a moving average filter with a window covering 25 ms. Saccades were identified using an I-VT filter with velocity threshold set to 30° of the visual field and fixations were defined as periods between saccades shifts with a minimum duration of 50 ms. Adjacent fixations with a smaller distance than 1° occurring within 75 MS were merged. Trials with less than 1500 ms valid fixation time were discarded. Recordings with less than 4 valid trials were considered as missing data. Four participants (ICBT: n = 2, ISUPPORT, n = 2) had missing eye tracking data.
Here, scanpath distribution was defined as the mean Euclidean distance of all fixations from the mean point of gaze. Higher values therefore indicate a wider distribution of visual attention. This measure was correlated at r = 0.8 with total traveled scanpath distance. All significant results remained when this alternative operationalization was used instead.
As a robustness check, we ran the analyses with the eye-mouth index (EMI) as a covariate. As a supplementary measure of the relative looking time to specific facial regions, we defined areas of interest around the eyes and mouth and calculated the EMI using the following formula (Viktorsson et al., Reference Viktorsson, Portugal, Li, Rudling, Siqueiros Sanchez, Tammimies, Taylor, Ronald and Falck-Ytter2023):
(Fixation time at eyes – Fixation time at mouth)/(Fixation time at eyes + Fixation time at mouth)
Higher values therefore represent a higher relative degree of looking time at the eyes.
Statistical analysis
All variables were scanned for outliers defined as values outside the ± 2.5 median absolute distance (MAD) from the median. Values outside this range calculated within each condition and time point but across all participants were discarded. In a second step, we winsorized outlier values at the level of individual participants (e.g., replacement with the nearest value within the ± 2.5 MAD range). Cronbach’s α was calculated for all eye tracking measures as a test of reliability.
Little’s MCAR test performed was performed separately on data from T1–T2 and data from all timepoints (including only participants in the ICBT group). In both cases, the test was not statistically significant (p > .35), indicating that imputation of missing data was feasible. Data was imputed using a two-level normal model using the R package mice (Buuren & Groothuis-Oudshoorn, Reference Buuren and Groothuis-Oudshoorn2011) with participant id specified as random factor, i.e., accounting for repeated measurements. Missing values in LSAS and scanpath dispersion were imputed, with timepoint, CSR, and age included as additional predictor variables. Following von Hippel (Reference von Hippel2009), derived variables (e.g., interaction terms) were derived from the imputed data sets. For each analysis, 20 data sets were imputed. The hypotheses were tested using generalized linear models (GLMM) on the imputed data sets, with results aggregated using Rubin’s rule. Analyses were conducted in R version 4.3.2 (R Development Core Team, Reference Core Team2023).
To test whether scanpath distribution at T1 predicted change in LSAS beyond the contribution of treatment arm (Hypothesis 1), we fitted models with LSAS as response variable and timepoint (including all five LSAS measurements), scanpath distribution at T1, treatment arm, and treatment arm × timepoint and scanpath distribution × timepoint as fixed effects, and intercepts for participants and random slope of timepoint by participant. This analysis thus models the change in LSAS, while accounting for the hierarchical structure of the data.
The longitudinal change in scanpath distribution (Hypothesis 2) was examined using a GLMM with scanpath as response variable and timepoint as fixed effect and random intercept by participant (random slope was not included as the models failed to converge due to a limited number of data points to estimate participant level slopes). Since eye tracking data was only recorded at three time points, the factor timepoint has two levels in analyses of longitudinal change from T1 to T2, and three levels in analyses of change from T1 to T3.
Hypothesis 3 was tested using a GLMM with LSAS as response variable, timepoint (1-5), Δscanpath, treatment arm, and treatment arm × timepoint and scanpath distribution × timepoint as fixed effects, and intercepts for participants and random slope of timepoint by participant.
The main analysis was conducted across emotions (i.e., using the mean for each individual as the dependent variable) since emotional expression did not modulate results at T1. Separate analyses of angry, happy, and fearful faces are presented in the supplement for comparison. These analyses were conducted with Bonferroni corrected p-values. Visualizations indicated approximately normally distributed residuals of all tested models.
A simulation-based power analysis for mixed effects models was conducted using the package simr (Green & MacLeod, Reference Green and MacLeod2016). This analysis indicated that the study had > 80% power to detect standardized main effects of z = 0.44 or higher and interaction effects corresponding to z = 0.22 and or higher in analyses examining change in LSAS. As a comparison, SD of LSAS at T1 was 23.74 points. Models examining longitudinal change in eye tracking measures had 80% power to detect main effects of z = 0.5, and interaction effects of z = 0.57. Power in the analyses including data from T1 to T3 in patients treated with ICBT was considerably lower (main effects: z = 0.90 – 0.95).
Age and gender were included as a covariates in all models. As a robustness check, we conducted two supplementary analyses. First, we ran all models with the EMI as response variable to examine for the possibility that the hypothesized effects could be explained by individual differences in attention to the eyes versus the mouth. Secondly, we repeated all analyses with self- and parent rated LSAS separately.
Change from planned analyses
Pupil dilation was included as a dependent variable in the analysis plan. However, due to very poor reliability of this measure (see Internal reliability and longitudinal stability of eye tracking measures), these analyses were dropped. As an exploratory analysis, we ran separate analyses with child- and parent rated LSAS as symptom measure. All significant effects remained using parent-rated, but not child-rated symptoms (see Supplement).
Internal reliability and longitudinal stability of eye tracking measures
Cronbach α values were acceptable to excellent (0.75 – 0.97) for scanpath distribution and excellent for EMI (0.91 – 0.97), see Supplement, Table S1. Cronbach’s α for the specific emotions were good to acceptable for EMI but ranged from poor to good for Scanpath distribution, meaning that results from these data should be interpreted with caution. Cronbach’s α for the pupil dilation measures were very poor (ranging from negative values to 0.23). Follow-up analyses reported in the Supplement showed that whereas scanpath distribution remained relatively stable throughout the course of the experiment, a habituation of pupil dilation was seen throughout the task, likely explaining the low internal consistency (see Supplement, Figure S1 ). Because of the low internal consistency, pupil dilation was not analyzed further.
Results
Preliminary analysis: attention to the eyes vs. mouth as a covariate
As a robustness check, all analyses were conducted both with and without EMI as a covariate. This did not change any of the results, and gave highly similar parameter estimates (see Supplement, Tables S2, S5, S7). To facilitate interpretation, EMI was therefore not included as a covariate in the final models.
Hypothesis 1: Does scanpath distribution predict treatment response?
A GLMM with LSAS as response variable showed no main effects of timepoint (b = 5.08, SE = 4.55, t = 1.12, p = .271), treatment arm (b = 8.88, SE = 6.35, t = 1.39, p = .172), scanpath distribution at T1 (b = 27.86, SE = 15.52, t = 1.79, p = 0.079), age (b = 1.72, SE = 1.38, t = 1.24, p = .219), or gender (b = 3.07, SE = 7.08, t = 0.43, 0 = .677). The treatment arm × timepoint interaction was significant, reflecting larger symptom reduction over time in the ICBT than the ISUPPORT group (b = 4,89, SE = 1.33, t = 3.68, p < .001). In support of hypothesis 1, there was an interaction effect between scanpath distribution at T1 and timepoint (b = −9.25, SE = 3.49, t = 2.65, p = .012), reflecting a larger symptom reduction over time in participants with wider scanpaths at T1. The standard deviations of the random intercept and random slope coefficients were 20.74 and 3.31 respectively.
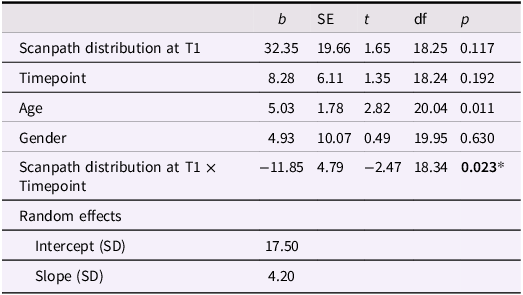
This analysis was repeated with data from all time points from T1 to T3 in participants treated with ICBT. Again, a scanpathT1 x timepoint interaction effect was found, reflecting larger symptom reduction in participants with wider scanpaths at T1 (b = −11.85, SE = 4.79, t = −2.47, p = 0.023, see Table 3 for full model).
Association between LSAS (T1–T3) and scanpath distribution at T1 in participants treated with ICBT

Table 3 Long description
The table presents a statistical analysis of various factors including scanpath distribution at T1, timepoint, age, gender, and their interactions. It has 8 rows and 6 columns. The columns are labeled as b, SE, t, df, and p. The rows are labeled as Scanpath distribution at T1, Timepoint, Age, Gender, Scanpath distribution at T1 x Timepoint, Intercept (SD), and Slope (SD). Each row provides specific values for each column. For example, the row for Scanpath distribution at T1 shows values 32.35, 19.66, 1.65, 18.25, and 0.117. The table captures the interaction effects and random effects in the study.
* p < .05.
In a follow-up analysis, we examined whether scanpath distribution at T1 predicted change in LSAS from T1 to T2 in three emotional expressions separately. After Bonferroni correction, the scanpathT1 x timepoint interaction was not significant for any of the emotions (angry: b = 5.56, se = 3.56, t = 1.56, p = 0.132; fearful: b = 7.28, se = 4.19, t = 1.74, p = 0.095; happy: b = 5.84, se = 3.95, t = 1.44, p = 0.153 see Supplement Table S3). Supplementary analyses conducted separately with LSAS-P and LSAS-C scores found a significant scanpathT1 x timepoint interaction on LSAS-P (b = −10.03, SE = 4.1, t = −2.44, p = .019), but not on LSAS-C (b = −6.51, SE = 5.08, t = −1.28, p = .209). See Supplement, Table S4 for full models.
Hypothesis 2: Does scanpath distribution change after treatment?
A GLMM with scanpath distribution as dependent variable showed no main effects of timepoint (T1–T2, b = 0.01, SE = 0.01, t = 0.73, p = .472), arm (b = 0.01, SE = 0.07, t = 0.01, p = 0.989), age (b = 0.01, SE = 0.01, t = 0.48, p = .635), or gender (b = −0.08, SE = 0.06, t = −1.32, p = 0.194), contradicting hypothesis 2. There was also no significant interaction effect between timepoint and treatment arm (b = −0.01, SE = 0.02, t = −0.68, p = .500). The standard deviation of the random intercept coefficients was 0.01.
Consistently, no evidence for longitudinal change in scanpath distribution from T1 to T2 was found for any of the specific emotions, as evidenced by non-significant effects of timepoint (angry: b = 0.02, SE = 0.02, t = 0.90, p = 0.375; fearful: b = 0.02, SE = 0.02, t = .1.35, p = .190; happy: b = 0.02, SE = 0.02, t = 0.8, p = .431, full models in Supplement, Table S6).
Is change in scanpath distribution associated with treatment response?
Hypothesis 3 was tested using a linear regression model with LSAS as dependent variable and Δscanpath, timepoint, treatment arm and treatment arm × timepoint as predictors. This model showed an effect of timepoint, indicating lower symptom levels over time (b = − 6.68, SE = 1.06, t = −6.28, p < 0.001). A significant timepoint × treatment arm interaction was also found, driven by steeper slope of symptom change in ICBT than ISUPPORT (b = −5.14, SE = 1.39, t = 3.70, p = 0.001). However, no main effect of Δscanpath T1-T2 (b = 11.10, SE = 15.68, t = 0.71, p = 0.484) or interaction between Δscanpath T1-T2 and treatment arm were found (b = 4.57, SE = 3.35, t = 1.36, p = 0.182), indicating that longitudinal change in scanpath distribution did not explain change in LSAS beyond the effect of treatment arm. This did not change when the analysis was run with child- or parent-rated LSAS as dependent variable (Supplement, Table S8). In a supplementary analysis, this analysis was repeated for the three emotions separately. Again, no unique associations between LSAS change and Δscanpath were found (all p > .25, Supplement, Table S9).
Discussion
Treatment response in children with SAD is highly variable and insufficiently explained by clinical and demographic variables. The ability to flexibly attend to and process faces facilitates social interaction in children and adolescents. Conversely, inflexible and maladaptive attention to faces has been hypothesized as a maintaining factor. Here, we examined whether visual attention during facial emotion recognition predicts the treatment outcome in SAD, and whether attention changes with successful treatment. This analysis followed up on results from a previous study which found that youth with SAD scanned faces more restrictively than healthy controls during emotion recognition (Kleberg et al., Reference Kleberg, Högström, Sundström, Frick and Serlachius2021).
We hypothesized that social attention at T1 would predict treatment change. Specifically, we expected that youth patients who scanned faces more restrictively would show smaller treatment gains. This hypothesis was supported. As the human brain is strongly biased to process information at fixated regions, the scanpath is a fundamental aspect of visual information processing. Consequently, variation in scanpath distribution has been found to predict several indices of cognitive processing including long-term memory (Bochynska & Laeng, Reference Bochynska and Laeng2015; Mohammadhasani et al., Reference Mohammadhasani, Caprì, Nucita, Iannizzotto and Fabio2020) and efficient visual search (Wynn et al., Reference Wynn, Bone, Dragan, Hoffman, Buchsbaum and Ryan2016). Restricted scanpaths may therefore reduce the opportunity to learn from social interaction and to challenge cognitions relevant for social anxiety, such as the assumption that one is likely to be scorned and rejected by others. Patients with SAD commonly focus on internal sensations (e.g., sweating), and have difficulties directing their attention towards the external environment (Rapee & Spence, Reference Rapee and Spence2004), and training in shifting attention focus is a component of several psychological treatments (e.g., Nordh et al., Reference Nordh, Wahlund, Jolstedt, Sahlin, Bjureberg, Ahlen, Lalouni, Salomonsson, Vigerland, Lavner, Öst, Lenhard, Hesser, Mataix-Cols, Högström and Serlachius2021). The ability to scan the environment widely and flexibly may make this shift from internal to external attention easier. It should be noted that more research is needed to determine the associations between scanpaths in this lab-based task and everyday behaviors.
We expected that treatment would lead to an increase in scanpath. This hypothesis was not supported. Instead, scanpath distribution was moderately stable. At both time points, high internal consistency (Cronbach’s α) of the scanpath distribution measure was observed, indicating a high degree of similarity between scanpath distribution to different faces. Our results suggest that research on face processing in SAD should move beyond a dichotomous characterization of attention as either biased, or not biased, towards a more fine-grained assessment of visual attention during social information processing and interaction. If successful, this research could aid individualized treatment, for example by helping identify patients likely to benefit from attention training. For example, children with SAD often engage in safety behaviors which either reduce the likelihood of direct eye contact or the perceived risk of giving a bad impression (Evans et al., Reference Evans, Chiu, Clark, Waite and Leigh2021; Halldorsson et al., Reference Halldorsson, Waite, Harvey, Pearcey and Creswell2023). Studies of scanpaths during these safety behaviors could give insights into their mechanisms and consequences. An intriguing possibility is that attention training may be most likely to produce beneficial results if it instructs patients to scan their social environment broadly, rather than to attend to specific regions of the face (e.g., eyes) or emotions.
Limitations and future directions
Participants were seen in a relatively wide age range, covering the typical age of onset of SAD. Although age was not a significant covariate in most of the analyses, the relatively modest sample size precludes conclusions about developmental changes occurring within the studied age range. However, the period from late childhood to adolescence is characterized by profound developmental changes in the social brain (Fox et al., Reference Fox, Henderson, Marshall, Nichols and Ghera2005; Lau & Waters, Reference Lau and Waters2017). Larger, longitudinal studies are needed to examine developmental changes within socially anxious children during this time period. Since no longitudinal assessments of healthy control participants were conducted, comparisons with the normative developmental trajectory of social attention were not possible. At the same time, the study design offers an important strength: it examines social attention in children with SAD as a predictor of treatment gains, whereas most previous studies have focused on adult samples.
The study is also limited by the fact that still images of faces were used. While this ensures good control of presentation timing and stimulus size, it limits the ecological validity. As noted in the introduction, although several studies have reported altered visual attention to face images in anxious populations (Chen et al., Reference Chen, Van Den Bos and Westenberg2020; Günther et al., Reference Günther, Kropidlowski, Schmidt, Koelkebeck, Kersting and Suslow2021), many questions remain about the links between these alterations and everyday behaviors (Price et al., Reference Price, Allen, Silk, Ladouceur, Ryan, Dahl, Forbes and Siegle2016). The current study adds to the literature by showing an association between scanpaths and subsequent symptom reduction during treatment. However, more research is needed to determine the mechanisms underlying this association.
Although the sample size was large in comparison to most previous eye tracking studies of children with SAD, relatively few participants were available in subgroup analyses, meaning that we may had limited statistical power to detect differential associations between eye-tracking measures and treatment response in patients receiving ICBT and ISUPPORT.
It should also be noted that a relatively high proportion of the group initially contacted declined to participate. Despite this, the study was the largest longitudinal eye tracking study of childhood SAD to date, and the first to examine eye tracking metrics as predictors of treatment change across several treatments. Other strengths of the study include the inclusion of clinically well-characterized, treatment-seeking patients, the longitudinal design, and the comparison between two treatments. The finding that more distributed scanpaths predict greater symptom reduction has potential implications for personalized treatment selection and suggests that research should move beyond the vigilance-avoidance model to consider broader aspects of information processing.
Supplementary material
The supplementary material for this article can be found at http://doi.org/10.1017/S0954579425101089.
Data availability statement
The data is from patients and not publicly available due to ethical restrictions. Anonymized data will be shared upon reasonable request consistent with the Swedish research ethics legislation.
Funding statement
This work was supported by the Bank of Sweden Tercentennary Foundation (grant number P18-0068:1_RJ, ES, JH, JLK), The Strategic Research Area Neuroscience (JLK), The Åke Wiberg Foundation (JLK)
Competing interests
The author(s) declare none.
Pre-registration statement
An analysis plan was registered at Open Science Framework before the analysis but after data collection (link: osf.io/sr3qe).
AI statement
Chat GPT (version 4) was used for language editing.


 Open access