


Introduction
Interpretative approaches that rely on categorising archaeological evidence necessarily require the definition of normative types and designations as a way of organising the source material, especially in the absence of high-resolution datasets (Dunnell Reference Dunnell1982, Reference Dunnell and Schiffer1986; Kosiba Reference Kosiba2019; Holland-Lulewicz Reference Holland-Lulewicz2021). Despite significant critique, and wider advances in archaeological science, such heuristic (problem-solving) approaches continue to permeate our explanatory models (Terrell et al. Reference Terrell, Hunt and Gosden1997; O'Brien & Dunnell Reference O'Brien, Dunnell, Dunnell and O'Brien1998: 30; MacEachern Reference MacEachern2000; Jones Reference Jones2002: 106–110; Howey & O'Shea Reference Howey and O'Shea2009; Pestle et al. Reference Pestle, Curet, Ramos and López2013; Henry et al. Reference Henry, Angelbeck and Rizvi2017; Wright Reference Wright2017). Highly accurate AMS dating methods, however, now allow us to document the past at an unprecedented resolution, approaching the human generational scale, and can be used to support theoretical frameworks that conceptualise social change as dynamic and contingent, rather than monolithic and teleological. The latter two characteristics are implied by models that explain the spread of material culture and cultural practices in terms of radial diffusion from a single site or area. Here, we present the Late Archaic Poverty Point culture of the Lower Mississippi Valley (LMV) as an example of how typological approaches to diffusion can obstruct archaeological research and obscure historical narrative. We offer a revised AMS-dated chronology of the Jaketown site, a Late Archaic earthwork complex in western-central Mississippi, as a case study of how to move beyond models of social change that rely on categories while offering an analytically robust interpretation at a regional scale.
Though it has for a long time been central to archaeological theory, critical engagement with cultural diffusion models has receded in recent decades (but see Chami Reference Chami2007; Mills Reference Mills2018). Following diffusionist models, Poverty Point, located in north-eastern Louisiana some 100km south-west of Jaketown (Figure 1), was usually interpreted as the type-site of the Poverty Point culture and the source of a suite of cultural innovations observed at presumably contemporaneous sites in the region (Webb Reference Webb1982). This interpretation employs categories, including that of archaeological culture and type-site, a diffusionist explanation for the spread of cultural traits and a low-resolution regional chronology that makes sites with similar cultural practices appear contemporaneous with and therefore influenced by the type-site. Such approaches and their reliance on radial diffusionist mechanisms to build regional histories are increasingly at odds with the archaeological evidence. In a recent article, we argued that differences in material culture, architecture and foodways between Jaketown and the Poverty Point site indicate the two sites’ related but distinct histories (Ward et al. Reference Ward, Grooms, Schroll and Kidder2022), a theme that we explore further here, focusing on the chronological implications. Recent geoarchaeological and geophysical data from the Poverty Point site reveal a complex construction history and they document architectural features and a material assemblage not fully replicated elsewhere (Hargrave et al. Reference Hargrave, Clay, Dalan and Greenlee2021; Kidder et al. Reference Kidder, Kai, Henry, Grooms and Ervin2021). Based on the evidence of material culture alone, the Poverty Point site therefore appears to be an endpoint, a collective cultural outcome of the convergence of many groups with distinct histories and practices (Sassaman Reference Sassaman2005; Kidder & Sassaman Reference Kidder, Sassaman, Emerson, McElrath and Fortier2009; Kidder Reference Kidder, Sassaman and Holly2011, Reference Kidder and Pauketat2012; Spivey et al. Reference Spivey, Kidder, Ortmann, Arco, Gilmore and O'Donoughue2015).
Location of the Poverty Point and Jaketown sites (figure by S. Grooms).

Chronostratigraphic data from Jaketown show that the site's inhabitants were engaging in practices typically associated with the so-called Poverty Point culture by c. 4500–4000 cal BP. These dates are conservatively 400 years earlier than the oldest dates derived from the Poverty Point site. We do not use the revised chronology of Jaketown presented here to extend the chronology of the Poverty Point culture back in time, however. Instead, Jaketown is used to understand the social processes and histories that led to the creation of the Poverty Point site as a place of cultural convergence with many different histories and practices. We conclude that these practices—including earthwork construction—originated in diverse locations across the LMV and beyond, converging at Poverty Point. Accordingly, except for our historical overview of the term, we avoid using ‘Poverty Point culture’ to describe those living at Jaketown and instead we use the term Late Archaic to situate their actions in the timespan between c. 4500 and 3200 cal BP. Late Archaic is, of course, also a typological designation laden with problematic assumptions. However, its value as a descriptive shorthand to refer to a timespan outweighs the potential risk of reifying the assumptions outlined above; when used to connote time, it is neutral enough not to be conflated with homogeneous cultural groups or to imply teleological change.
Overview of the Poverty Point culture
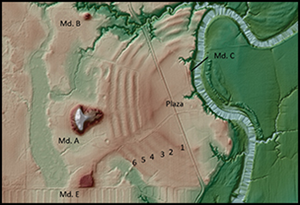
Poverty Point is a sprawling complex of geometric earthworks covering approximately 200ha in north-eastern Louisiana (Figure 2). Its builders moved an estimated 1 000 000m3 of earth to create the monumental landscape (Kidder Reference Kidder, Sassaman and Holly2011). Mound A is among the largest mounds in North America, comprising approximately 238 500m3 of earth, and was built in no more than 90 days (Ortmann & Kidder Reference Ortmann and Kidder2013). Recent work demonstrates that at least one segment of the iconic concentric ridges, Ridge West 3, was also built rapidly (Kidder et al. Reference Kidder, Kai, Henry, Grooms and Ervin2021). Geophysical survey has identified 36 timber post circles up to 62m in diameter in a 25ha area around the anthropogenic plaza, further demonstrating the site's complex construction history (Hargrave et al. Reference Hargrave, Clay, Dalan and Greenlee2021). Forager groups modified the landscape at Poverty Point to fit their social and cultural needs (Grier & Schwadron Reference Grier and Schwadron2017; Randall & Sassaman Reference Randall and Sassaman2017; Gibson Reference Gibson2019: 53–75) and, while some scholars (Earle Reference Earle2021: 80) assume that such coordination would be possible only under a centralised, hierarchical political system, there is no evidence of social hierarchy at Poverty Point (Kidder Reference Kidder and Pauketat2012: 464). The scale of earthmoving at Poverty Point, in addition to the metric tonnes of stone brought there from sources spanning half the North American continent (Gibson Reference Gibson2000: 219–22), suggests forms of social organisation and leadership that contradict traditional models of foraging groups. Consequently, the size and structure of the society centred on Poverty Point is a matter of debate (Sassaman Reference Sassaman2005; Gibson Reference Gibson, Thomas and Sanger2007; Kidder Reference Kidder, Sassaman and Holly2011: 95–119; Spivey et al. Reference Spivey, Kidder, Ortmann, Arco, Gilmore and O'Donoughue2015: 141–59; Stanish Reference Stanish2017: 247–8; Milner Reference Milner2021: 54). As a manifestation of conspicuously complex behaviour by foraging people (Wright & Gokee Reference Wright and Gokee2021), the Poverty Point site and culture offer a striking example of the effects that normative categories and assumed processes can have on our analyses as we attempt to understand the forms of social organisation underlying a singular expression of human creativity.
LiDAR digital elevation model of the Poverty Point site showing mounds, six ridges and a plaza (figure by K. Ervin).
The Poverty Point culture is a culture-historical unit used to describe sites in the LMV by temporal association with the Poverty Point site; it is characterised by the presence of earthworks, the use of baked clay objects called Poverty Point Objects (PPOs), non-local lithic materials, diagnostic projectile points and microlithic tools, a lapidary industry emphasising beads, gorgets (flat, oblong stone artefacts) and plummets (teardrop-shaped weights made from iron-rich stones) and a forager subsistence strategy. Hundreds of sites in the LMV have yielded these material traits to varying degrees but their chronology is poorly documented. Consequently, the temporal relationship of these sites with the Poverty Point site is ambiguous. Yet, these sites are said to have participated in the Poverty Point culture and acquired their cultural identity from the type-site (Webb Reference Webb1982: 14; Gibson Reference Gibson2000: 196). Poor chronological control, coupled with ambiguous criteria used to designate a site as a Poverty Point affiliate, results in an overreliance on the chronology of, and material traits derived from, the type-site to explain Native American history in the American Southeast.
The history of Poverty Point is the opposite of what we should expect if it were a site that marked the beginning of a phenomenon (Kidder Reference Kidder and Pauketat2012: 467). The earthworks were built exceptionally quickly at the end of the site's occupation. But as noted above, Jaketown, the best-dated Archaic site in the LMV and yielded classic Poverty Point material culture pre-dating the earliest component at the type-site by at least 400 years (Ward et al. Reference Ward, Grooms, Schroll and Kidder2022). We argue that assumptions about temporality and cultural diffusion, as currently conceptualised in studies of the LMV, are the primary impediments to achieving a new understanding of the Poverty Point phenomenon outside a culture-historical perspective. The region lacks a secure chronological framework to contextualise the histories of supposed Poverty Point-affiliated sites (Gibson Reference Gibson, Thomas and Sanger2007: 40–41). Consequently, the chronology of the type-site is important for setting the developments at Jaketown in context and assessing diachronic differences.
The chronology of the Poverty Point site
While 80 chronometric dates are available for the Poverty Point site, the chronology of the site is still debated and remains equivocal (Ortmann Reference Ortmann2010). Most chronological models propose similar occupation spans (c. 3600–3000 cal BP) but differ in their proposed pace of earthwork construction (Gibson Reference Gibson2000: 94–96; Connolly Reference Connolly2006; Ortmann Reference Ortmann2010; DOI 2013: 72; Kidder et al. Reference Kidder, Kai, Henry, Grooms and Ervin2021). Kidder et al. (Reference Kidder, Kai, Henry, Grooms and Ervin2021) argue that most earthwork construction was rapid and took place late in the occupation (after c. 3400 cal BP) but others contend that construction progressed more gradually throughout the history of the site (DOI 2013: 30–56; Gibson Reference Gibson2019: 33; Hargrave et al. Reference Hargrave, Clay, Dalan and Greenlee2021). Nonetheless, the trend over the past few decades has been to apply the chronology of the type-site, implicitly or explicitly, to other Poverty Point-affiliated sites. Some have gone as far as to advise that archaeologists should not bother dating such sites because of their assumed contemporaneity with the type-site (Gibson & Melancon Reference Gibson, Melancon, Saunders and Hays2004: 228).
In contrast to the Poverty Point site chronology, our findings show that Jaketown was occupied by people who demonstrated practices traditionally associated with the Poverty Point culture by c. 4500–4000 cal BP and who built mounds by c. 3400 cal BP. These dates run counter to the hypothesis that all Poverty Point culture sites are coeval; in fact, our data indicate that the monumental landscape at the Poverty Point site may be the culmination of deeper and more varied histories, rather than the catalyst for regional cultural change (Sassaman Reference Sassaman2005; Kidder Reference Kidder and Pauketat2012).
The Jaketown site: description and previous research
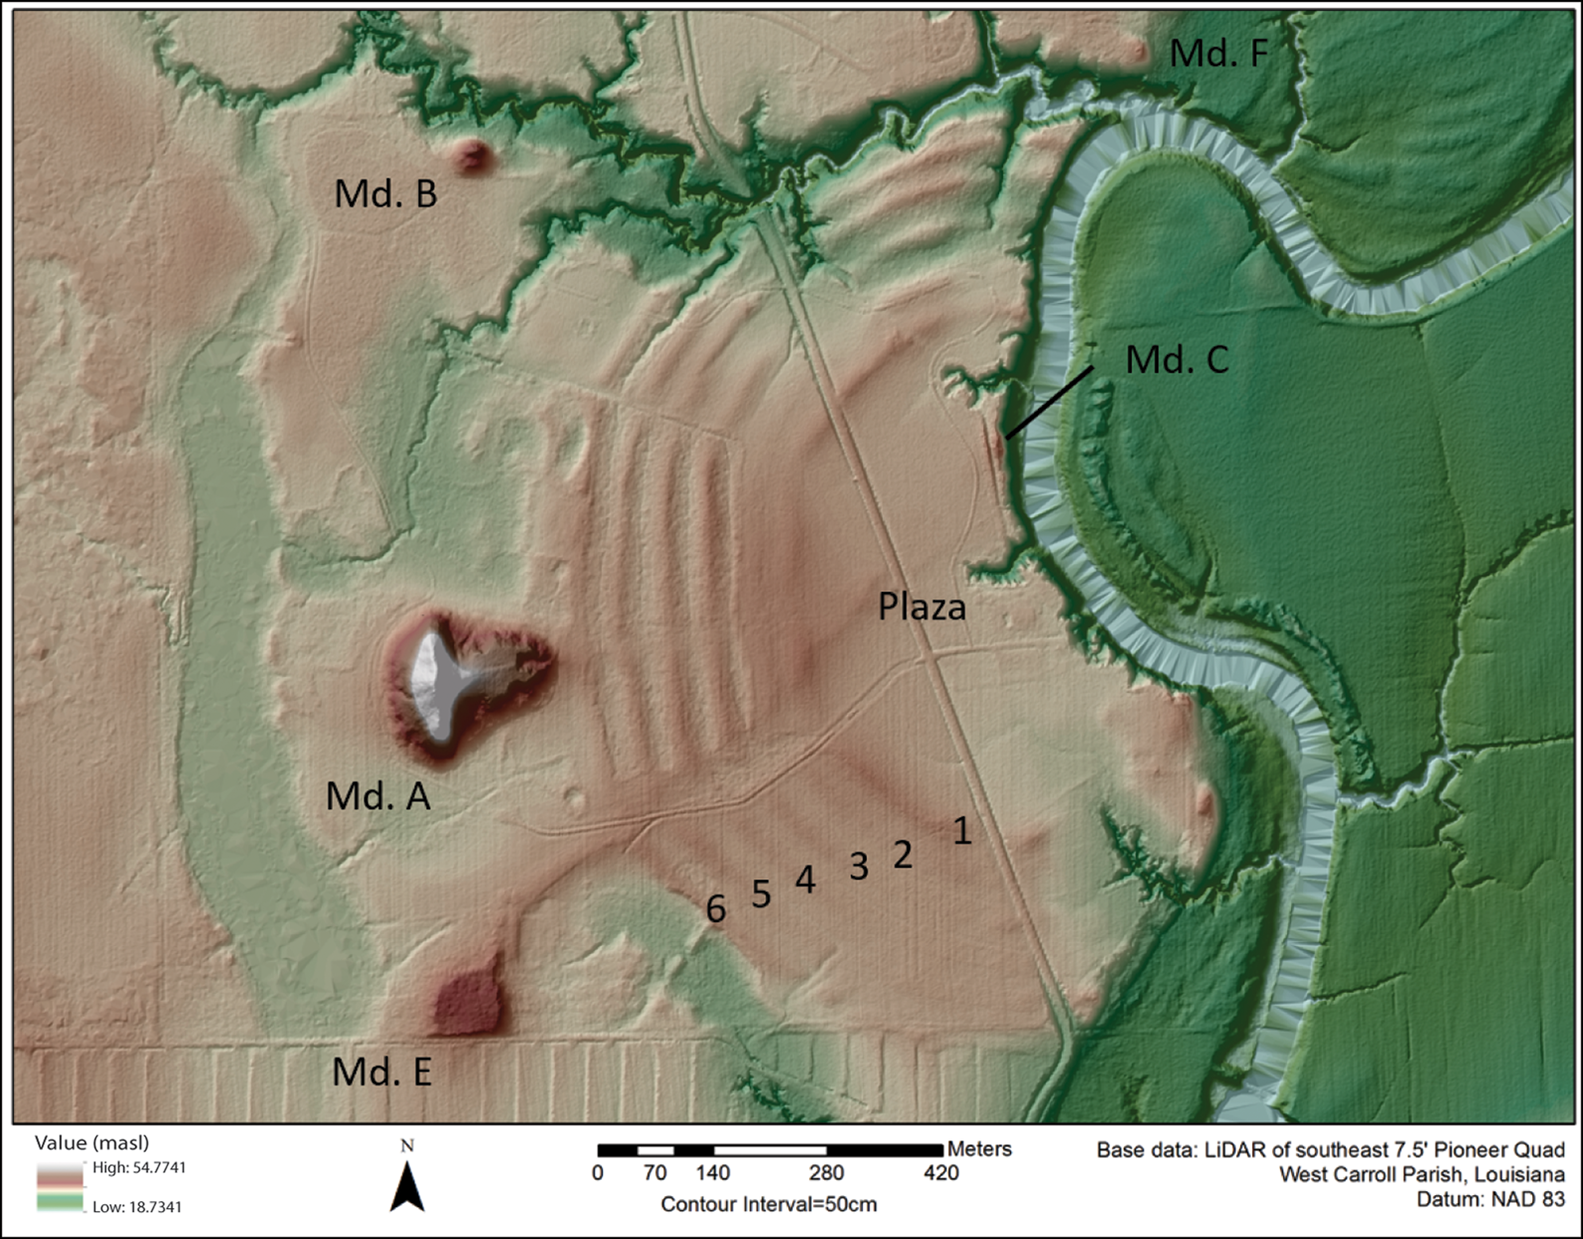
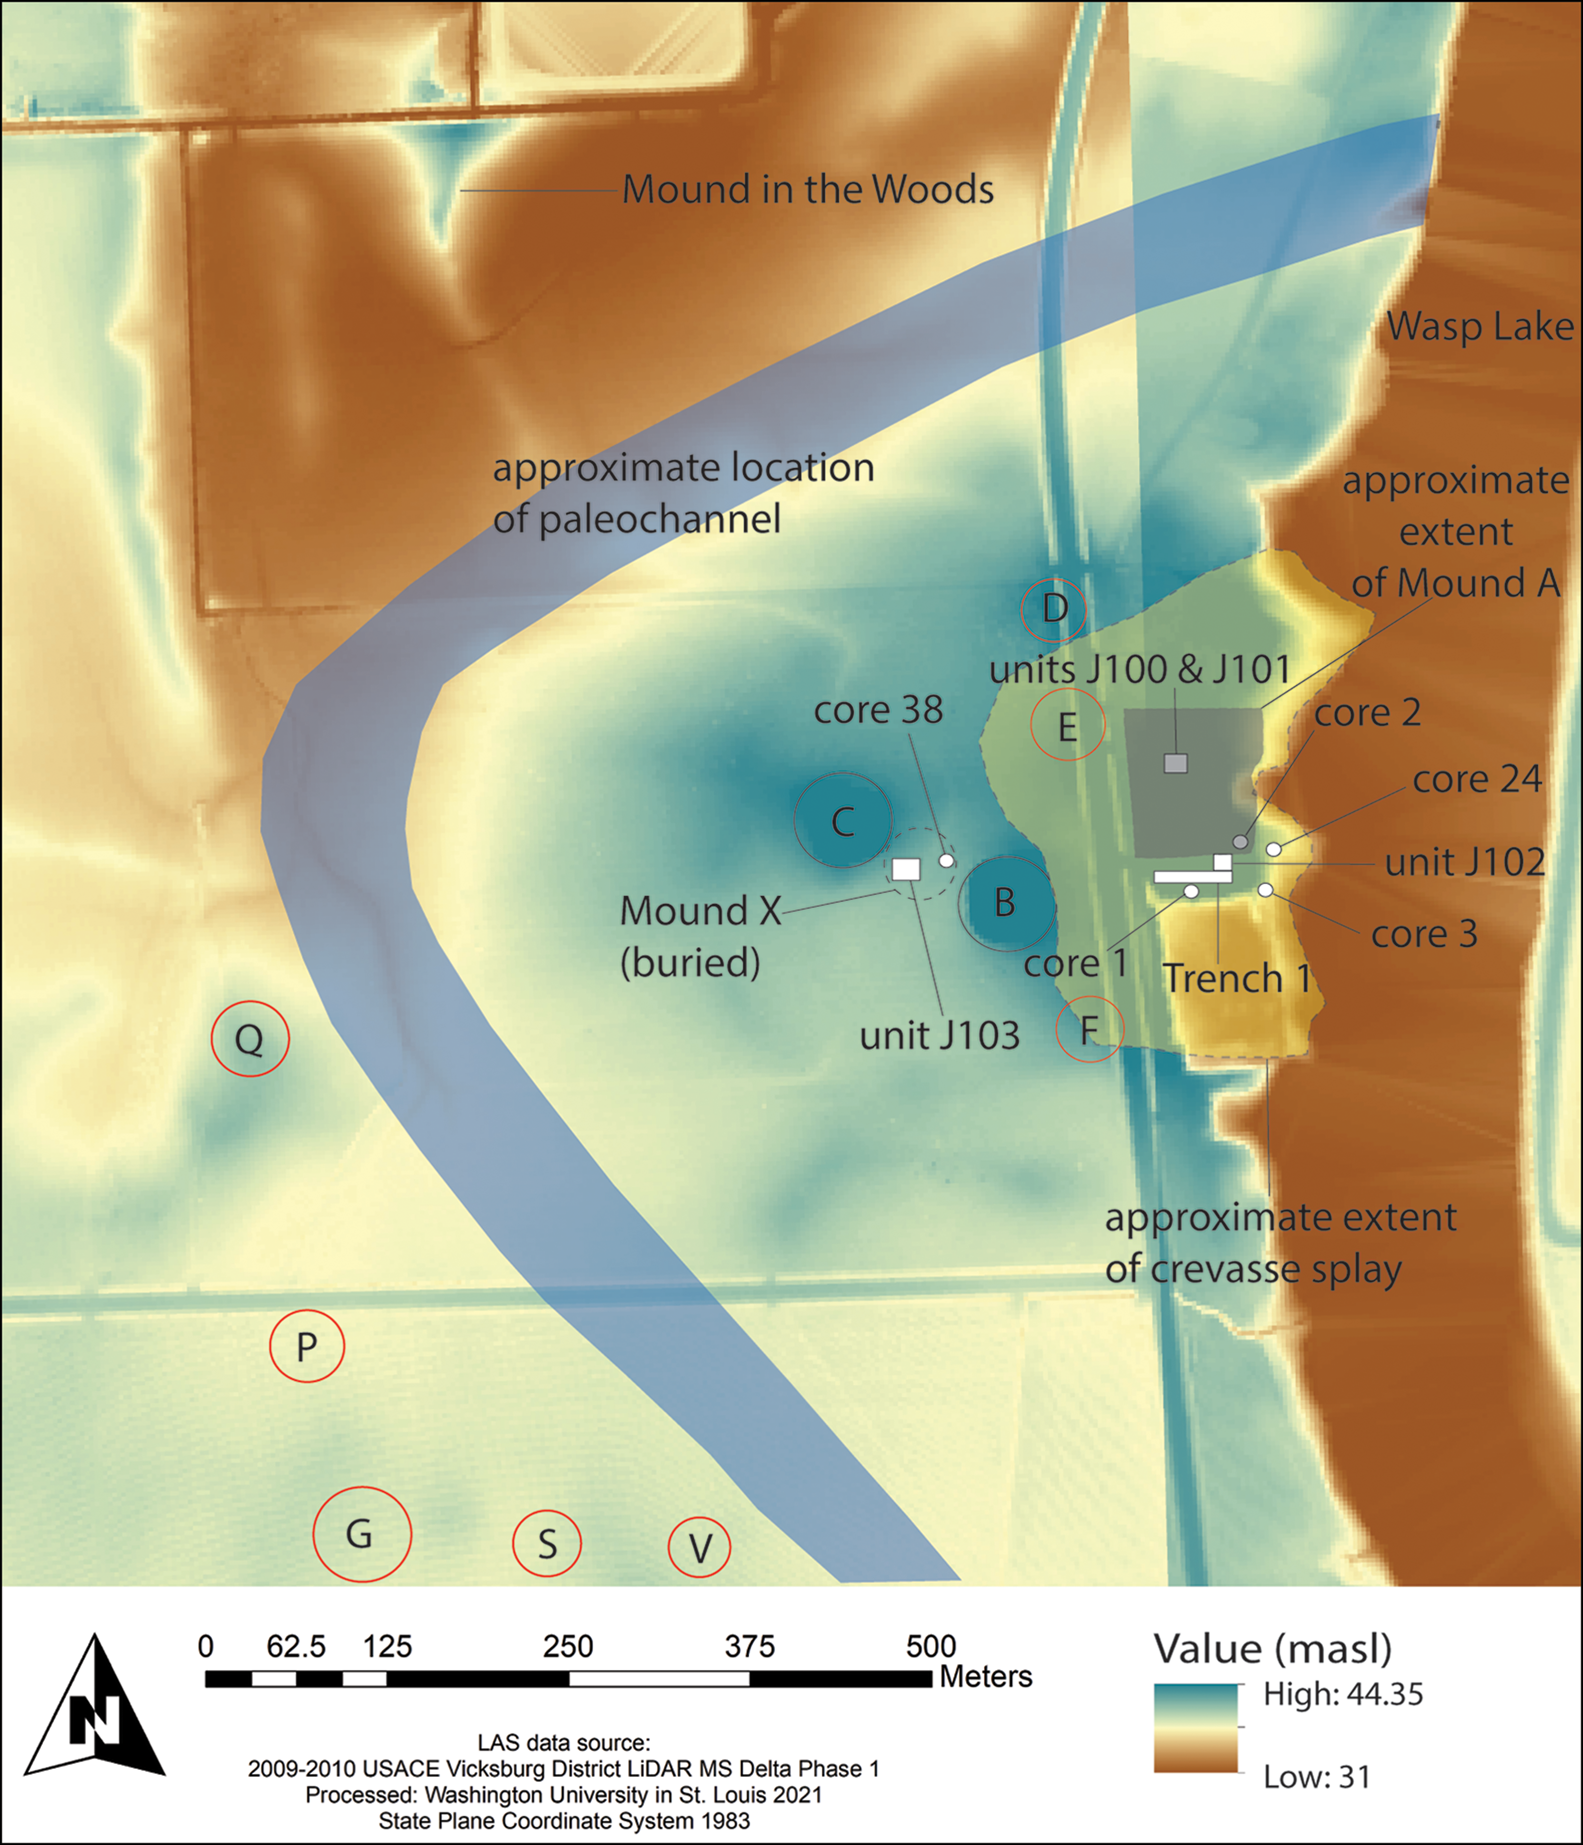
Jaketown, located some 50km east of the Mississippi River and to the west of an oxbow named Wasp Lake, was occupied from c. 4500–4000 cal BP, during the Late Archaic period, and up to late pre-contact times (c. 700 cal BP). The Late Archaic occupation was the most extensive (Lehmann Reference Lehmann1982; Ford et al. Reference Ford, Phillips and Haag1955: 104). Some 15 mounds have been documented at Jaketown, though many more have been destroyed (Figure 3). Of the extant examples, Mounds A, G and X are confirmed as dating to the Late Archaic period. A sandy point bar underlies most of the site at an average of 3–4m below the ground surface. A catastrophic flood sometime between c. 3300 cal BP and 2780 cal BP buried the Late Archaic occupation while depositing a crevasse splay (sedimentary deposits laid down in a breach of a natural levy) that stratigraphically separates the Late Archaic component from subsequent occupations (Kidder et al. Reference Kidder, Henry and Arco2018). The presence of the point bar below the Late Archaic occupation and the crevasse splay deposit above it provide useful termini post quem and ante quem across the site.
LiDAR digital elevation model of Jaketown showing excavation areas, cores discussed in the article and 13 of the 15 mounds (A–G, P, Q, S, V, X, Mound in the Woods). The blue crescent shape marks the approximate location of a palaeochannel. Letters circled in black are visible mounds; those in red are mounds reported by Ford et al. (Reference Ford, Phillips and Haag1955) that are no longer visible (figure by S. Grooms).
Jaketown was designated as a peripheral expression of Poverty Point culture in the mid-twentieth century (Ford et al. Reference Ford, Phillips and Haag1955: 151; Phillips Reference Phillips1970: 10, 15, 524–32; Phillips et al. Reference Phillips, Ford and Griffin2003 [1951]: 279–81). Using early radiocarbon dating technology, excavators in the 1950s used five radiometric samples to establish the age of the Poverty Point component at Jaketown (see Table S1 in the online supplementary material (OSM)). These samples span 3820–1830 cal BP (Ford & Webb Reference Ford and Webb1956: 121), allowing the Poverty Point-affiliated occupation at Jaketown to be placed either relatively early (c. 3800 cal BP) in the Late Archaic era or very late (c. 1800 cal BP). More recently, Saunders and Allen (Reference Saunders and Allen2003) extracted three soil cores to obtain new radiocarbon samples to corroborate the dates reported by Ford and colleagues. The stratigraphy in the cores matched that of prior excavations and produced dates ranging from 4230 to 3230 cal BP. This sampling indicated that the initial component at Jaketown was early (c. 4200 cal BP) compared with the Poverty Point site (c. 3600 cal BP).
Methods
Field methods
In 2018 and 2019, we re-excavated four units investigated previously (J100 and J101 in Mound A, J103 in Mound X, and a portion of Trench 1. See Figure 3). We used a mechanical excavator to remove most backfill (consisting of previously excavated contexts) and exposed intact stratigraphic profiles by hand.
Chronological modelling methods
In total, 32 radiocarbon samples have been collected from the Jaketown site (Table S1 in OSM). We use OxCal 4.4 software (Bronk Ramsey Reference Bronk Ramsey2009a) to create a chronological model, calibrating measurements using the IntCal20 calibration curve (Reimer et al. Reference Reimer2020). We omit six radiocarbon measurements, including one AMS date, and all five of Ford and Webb's (Reference Ford and Webb1956) radiometric dates (our justifications for omitting these are detailed in the OSM). These omissions are based on established outlier detection and omission protocols (Bronk Ramsey Reference Bronk Ramsey2009b). All posterior density estimates (modelled age ranges) are rounded to the nearest five years, italicised (Bayliss et al. Reference Bayliss, Bronk Ramsey, Van der Plicht and Whittle2007: 5) and reported at the 95.4% confidence (2 σ) level unless otherwise noted. Unmodelled calibrated dates are rounded to the nearest five years, reported at the 2σ level unless otherwise noted, and are not italicised.
Chronostratigraphy at Jaketown
Based on our chronological model, we distinguish four phases of occupation at Jaketown (Figure 4).
Chronological model in multi-plot view. For table view see Table S2 in OSM (figure by S. Grooms).

Phase 1: initial occupation
Start: 4570–3820 cal BP | End: 3820–3455 cal BP (2 σ)
Start: 4440–4000 cal BP | End: 3755–3535 cal BP (1 σ)
The initial occupation is represented by a pit dug into the point bar beneath Mound A (Figure 5, J100 north section, bottom left). The pit was originally excavated in 2008 and yielded a radiocarbon date of 4145–3870 cal BP (B-253774) (Kidder et al. Reference Kidder, Henry and Arco2018). We processed a second radiocarbon sample from the pit that returned a date of 4525–4100 cal BP (UGA-41847). The AMS dates are associated with a large biconical PPO, numerous other PPO fragments, and some non-local lithic flakes (Figure 6); based on visual inspection, seven of the nine chipped stone pieces recovered from the pit are novaculite sourced to central Arkansas (Lehmann Reference Lehmann1982: 14). The dates obtained, along with associated artefacts, indicate that people at Jaketown were involved in exchange networks and adopted technologies manifest at the Poverty Point site roughly a millennium later.
North, east and south profiles of unit J100 in Mound A, with the stratigraphic contexts on which the chronological model is based. For example, radiocarbon samples from the Initial Phase context in J100 north comprise the Initial Phase in the model shown in Figure 4. The numbers along the right side of each profile are stratigraphic units (figure by S. Grooms).

Selected artefacts from the pit beneath Mound A. A) fired clay, probably a PPO fragment; B) chert flake; C & D) novaculite flakes; E) biconical PPO fragment (figure by authors).

Phase 2: intensive occupation
Start: 3585–3395 cal BP | End: 3445–3380 cal BP (2 σ)
Start: 3505–3425 cal BP | End: 3440–3400 cal BP (1 σ)
The intensive occupation of Phase 2 is represented by strata and features in Trench 1, a midden east of Mound A, and midden that was later used for mound fill during the subsequent earthwork construction phase. In Trench 1, we encountered two organically enriched strata on top of the point bar (Figure 7). We documented four large postholes (approximately 0.3m wide) originating from the top stratum in the north profile (Ward et al. Reference Ward, Grooms, Schroll and Kidder2022: Figures 3 & 4). Similar-sized postholes are documented in unit J102 about 13m east of the Trench 1 postholes, and the two sets may form one large feature. In Trench 1, carbon from the upper stratum flotation sample returned a date of 3450–3370 cal BP (OS-159306), and carbon from the lower stratum sample returned a date of 3450–3350 cal BP (OS-160358).
Trench 1 north and east profiles, with the stratigraphic contexts on which the chronological model is based. The numbers along the right side of each profile are stratigraphic units (figure by S. Grooms).

Deposits representing this phase were mined and redeposited in Mounds A and X. In Mound A, the stratigraphic boundaries of the redeposited midden fill are abrupt; chunks of unfired clay and PPO fragments are incorporated throughout, indicating that the midden was mixed with clay and other materials before being used as mound fill.
Stratum 4 in Mound X consists of repurposed midden fill (Figure 8). Two radiocarbon measurements (B-555137 and AA-83902) from this zone are out of stratigraphic order indicating that midden fill was redeposited. Sample B-555137 consisted of carbon residue from a soapstone sherd recovered from the midden fill; it returned a date of 3565–3395 cal BP, indicating that the Late Archaic occupants of Jaketown were acquiring soapstone—not local to the LMV—during the period of intensive occupation and before earthwork construction.
West, north and east profiles of unit J103 in Mound X, with the stratigraphic contexts on which the chronological model is based. The dashed portion of the mound surface in the west and north walls is an extrapolation from the preserved mound surface, Stratum 6, in the east wall. Numbers represent stratigraphic units (figure by S. Grooms).

There are many isolated postholes and deep middens east of Mound A. Saunders and Allen (Reference Saunders and Allen2003) date the basal midden from this context to 3690–3465 cal BP (B-157421). Thus, the midden deposits on the bank of Wasp Lake represent the intensive phase or possibly a mix of initial and intensive phase deposits. In either scenario, these deposits pre-date the construction of Mound A.
Phase 3: earthwork construction
Start: 3425–3365 cal BP | End: 3390–3325 cal BP (2 σ)
Start: 3405–3375 cal BP | End: 3380–3350 cal BP (1 σ)
Mounds A and X were built quickly c. 3400 cal BP. In both mounds, radiocarbon measurements from the initial mound deposits overlap with those from the mound surfaces. The abrupt stratigraphic boundaries between mound fill deposits and the absence of pedogenesis in the mound fill layers or at interfaces also indicate rapid construction.
Two large post features (approximately 0.9m wide) were cut from the surface of Mound X (Figure 8: features 1 and 2). They suggest a sequence of building, post removal, reconstruction and capping: a first post was set in place, removed and replaced by a second post, itself eventually removed, and both pits were filled with a homogeneous silty clay loam (Stratum 7) that levelled the area and capped the earthwork. Stratum 2 was an organically enriched anthropogenic layer that lies beneath the first obvious Mound X deposit, Stratum 3. Stratum 2 contains two intact PPO concentrations, two hearths and the long bones of mammals likely to be deer, orientated in a way that suggests a single deposition. Based on this assemblage and macrobotanical remains recovered from this context, we interpret Stratum 2 as a feast or rapid sequence of feasts held sometime between September and November (Ward et al. Reference Ward, Grooms, Schroll and Kidder2022: 769). The radiocarbon measurements from Stratum 2 (B-264059, UGA-41848 and OS-151671) overlap with those from the mound surface (B-263420 and AA-83903). Consequently, we interpret the feast and resultant deposit (Stratum 2) as the first event in the complex construction sequence of the earthwork.
The formation of Strata 2 and 4 in Trench 1 is associated with the preceding intensive occupation. We suspect that the postholes (features 2–5) cut into Stratum 4 are related to mound building; they are unlikely to have been part of a domestic structure because of the spacing and size of the posts (approximately 0.3m in diameter). In this respect, they closely resemble the timber circles documented at the Poverty Point site (Haag Reference Haag1990; Hargrave et al. Reference Hargrave, Clay, Dalan and Greenlee2021).
Phase 4: post-flood occupation
Start: 3245–2455 cal BP | End: 2705–2100 cal BP (2 σ)
Start: 2860–2530 cal BP | End: 2665–2390 cal BP (1 σ)
Between c. 3300 cal BP and 2780 cal BP, the LMV experienced more frequent and intense flood events linked to global climatic changes and attendant fluvial reorganisation of the Mississippi River. The crevasse splay deposit at Jaketown is the result of such fluvial reorganisation, probably the shift from the Mississippi stage 2 course to the current stage 1 course (Kidder et al. Reference Kidder, Henry and Arco2018). The post-flood cultural deposits at Jaketown are found on top of the crevasse splay and represent people using a distinct material culture from that of the population before the flood.
Discussion
Our research suggests the following historical sequence. People first occupied Jaketown by 4570–3820 cal BP (2σ) and probably by 4440–4000 cal BP (1σ), well before the initial occupation of Poverty Point at c. 3600 cal BP. This early community engaged in practices later evident at Poverty Point. They used biconical PPOs and non-local novaculite, the latter connecting them to the Ouachita Mountains in west-central Arkansas approximately 280km away from Jaketown. Long-distance lithic exchange was rare before the peak of the Poverty Point site (Gibson Reference Gibson and Gibson1994a), suggesting that this context is an early manifestation of exchanges that later become socially significant in the region.
The occupation became both more intensive and extensive by 3585–3395 cal BP (2σ) and probably by 3505–3425 cal BP (1σ). This phase is represented by deeper middens, ubiquitous postholes, and other features on the bank of Wasp Lake and by the substantial amount of midden mined and used as mound fill in the subsequent earthwork construction phase. During this intensive phase, people at Jaketown were acquiring non-local lithics, including soapstone originating in southern Appalachia (Gibson Reference Gibson and Gibson1994b) by c. 3500 cal BP.
Mound building began at Jaketown by 3425–3365 cal BP (2σ) and probably by 3405–3375 cal BP (1σ), a century or so before the construction of Mound A and the ridges at Poverty Point (Ortmann & Kidder Reference Ortmann and Kidder2013: 74–75; Kidder et al. Reference Kidder, Kai, Henry, Grooms and Ervin2021). This represents a revival of earthen monumentality in the LMV after a millennium-long hiatus (Saunders et al. Reference Saunders2005; Gibson Reference Gibson2006; Saunders Reference Saunders, Thomas and Sanger2010, Reference Saunders, Burger and Rosenswig2012). Significantly, our chronological model suggests that this revival is not necessarily linked to the creation of the monumental landscape at Poverty Point, and thus that the earthworks at Jaketown are not the result of diffusion from Poverty Point. Rapid earthwork construction at both Jaketown and Poverty Point suggests similar methods of construction. Large postholes documented in Trench 1 and Mound X may represent ceremonial infrastructure like the timber circles documented in the plaza at Poverty Point, although the temporal relationship among these features remains unclear. Despite these similarities, the monumental landscape at Poverty Point is unprecedented; the shape, configuration and enormous scale of the earthworks are novel to Native North America. These unique characteristics reflect the creation of a new group identity at Poverty Point, to which multiple groups contributed (Sassaman Reference Sassaman2005).
Future directions
Chronological modelling at Jaketown allows us to study change as a historical process by establishing chronological control over variation in material culture, the presence or absence of particular traditions (sensu Feinman & Neitzel Reference Feinman and Neitzel2020), the pace of occupation and mound building, the consistency of subsistence strategies (Ward et al. Reference Ward, Grooms, Schroll and Kidder2022: 770–72) and the ebb and flow of exchange networks. Our analysis contributes to the growing body of literature focused on moving beyond categorisation and related causal mechanisms in archaeology, including radial diffusion. One way to advance archaeological explanations for cultural phenomena such as Poverty Point is to build absolute chronologies at the local scale without perpetuating assumptions such as cultural homogeneity, technological uniformity and teleology, or the radial diffusion of traits (Pestle et al. Reference Pestle, Curet, Ramos and López2013). Our work at Jaketown shows that it is possible to construct an understanding of cultural change from the bottom up and dramatically change regional histories by embracing and documenting variation rather than reifying antiquated taxonomic frameworks.
Conclusion
Uncritical use of “‘heuristic’ crutches” (Holland-Lulewicz Reference Holland-Lulewicz2021: 538) results in the perpetuation of empirically inaccurate interpretations. In the case of Poverty Point, the assumption that traits diffused from the type-site obscures a regional history in which diverse practices arose among communities across the Late Archaic LMV and converged at an important place at a particular historical juncture. These uneven cultural expressions are best conceptualised as individual strands of Native American history (sensu Sassaman Reference Sassaman2005: 336). Jaketown represents a locus of innovation and tradition ultimately recapitulated at Poverty Point, a strand that, along with others, culminates at Poverty Point rather than radiating out from the latter.
Despite this new causal understanding, a central question remains: what was the relationship between the convergence of multiple communities and the social structure at Poverty Point? The enormity of earthwork construction at the site suggests some form of organisation to direct those efforts, yet there is no obvious evidence of hierarchy. Models of diffusion have historically been employed to assert that external forces are responsible for cultural innovations. When such a model is inverted, as we recommend for Poverty Point, how can we conceptualise innovation and resulting social change? Where does it come from if not a ‘centre’? These are fundamental questions that make Poverty Point globally significant, on par with sites such as Stonehenge or Göbekli Tepe. There is still much to be learned about Poverty Point and Late Archaic histories in the region. Before we can explain the complexity of social organisation and cultural expression evident at Poverty Point, we must put events, innovations and key sites in their proper historical order. Part of that process consists of critically examining research traditions that may no longer be appropriate and recognising how they continue to bias our interpretations.
Acknowledgements
We are indebted to two anonymous reviewers as well as colleagues at Washington University, most notably Matthew Abel, for their invaluable insights. Andrew Schroll contributed significant help and technical expertise in the field, and Kelly Ervin provided the map in Figure 2. We would also like to thank Dr Kenneth Sassaman and the Hyatt and Cici Brown Endowment for Florida Archaeology at the University of Florida for AMS sample B-555137.
Funding statement
This work was funded by the NSF GRFP (DGE-2139839 and DGE-1745038), NSF DDRI (#2032257 and #1953636), the Society for Economic Botany, and the Edward S. and Tedi Macias Fund at Washington University in St. Louis.
Supplementary material
To view supplementary material for this article, please visit https://doi.org/10.15184/aqy.2023.155.


 Open access