


1. Introduction
Jets created from collapsing cavities can be observed in a wide range of situations from the cavities left when a rain drop lands on a pond to the effervescence of Champagne. Indeed, the collapsing cavity can be formed by different processes, such as drop impacts on a liquid pool creating the cavity or bubble bursting at a free surface. The investigation of bursting bubbles has received significant attention due to its wide range of applications from the effervescence of carbonated beverages (Liger-Belair Reference Liger-Belair2014; Séon & Liger-Belair Reference Séon and Liger-Belair2017) to the role of breaking waves in the regulation of ocean–atmosphere interactions, through the formation of aerosols (Deike et al. Reference Deike, Ghabache, Liger-Belair, Das, Zaleski, Popinet and Séon2018; Deike Reference Deike2022; Gañán-Calvo Reference Gañán-Calvo2023) in particular. While drop impacts on solid substrates or a thin liquid film encapsulate a bubble that eventually bursts (Ribeiro et al. Reference Ribeiro, Panão, Barata and Silva2023), open cavities are formed when drops impact on a liquid pool (Michon, Josserand & Séon Reference Michon, Josserand and Séon2017). Similarly, solid objects entering a water pool leave voids behind whose collapse forms jets (Bergmann et al. Reference Bergmann, van der Meer, Stijnman, Sandtke, Prosperetti and Lohse2006; Duclaux et al. Reference Duclaux, Caillé, Duez, Ybert, Bocquet and Clanet2007; Aristoff et al. Reference Aristoff, Truscott, Techet and Bush2008; Aristoff & Bush Reference Aristoff and Bush2009; Bergmann et al. Reference Bergmann, Van Der Meer, Gekle, Van Der Bos and Lohse2009; Gekle et al. Reference Gekle, Gordillo, van der Meer and Lohse2009; Aristoff et al. Reference Aristoff, Truscott, Techet and Bush2010).
While the jet is formed by the collapse of the cavity, different regimes have been identified, depending on the collapse dynamics. On the one hand, and for most cases, capillary waves collide at the bottom of the cavity forming a liquid jet from which drops detach and are emitted to the surrounding atmosphere. We call them here spherical collapses and different scaling laws have been deduced for the liquid jet velocity (Ghabache & Séon Reference Ghabache and Séon2016), as well as for the radial and axial cavity lengths, as a function of the liquid properties, highlighting in particular the effects of gravity (Ghabache & Séon Reference Ghabache and Séon2016; Gañán-Calvo Reference Gañán-Calvo2017, Reference Gañán-Calvo2018; Deike et al. Reference Deike, Ghabache, Liger-Belair, Das, Zaleski, Popinet and Séon2018). Remarkably, while it is expected from scaling analysis that the emerging jet velocity varies monotonically with the physical parameters such as the liquid properties and the cavity geometry, a very thin and rapid jet can be observed for specific values of these parameters, making the evolution of the jet velocity with the physical and geometrical parameters highly nonlinear (Zeff et al. Reference Zeff, Kleber, Fineberg and Lathrop2000; Duchemin et al. Reference Duchemin, Popinet, Josserand and Zaleski2002; Bartolo, Josserand & Bonn Reference Bartolo, Josserand and Bonn2006; Ghabache & Séon Reference Ghabache and Séon2016; Michon et al. Reference Michon, Josserand and Séon2017). It has been demonstrated that, in general, the occurrence of these fast thin jets coincide with a transition between a bubble entrapment regime, where a small dimple forms at the base of the cavity so that a bubble is trapped in the bulk fluid below the base of the jet on the one side, and a simple jet formation from the base, without entrapment of a bubble on the other side. At the transition, the collapse of the cavity exhibits the well-known capillary-inertial self-similar spherical dynamics (Keller & Miksis Reference Keller and Miksis1983), where the lengths of the cavity obey the scaling laws with time $(t_c-t)^{2/3}$
when
$(t_c-t)^{2/3}$
when $t \rightarrow t_c$
, where
$t \rightarrow t_c$
, where $t_c$
is the time of collapse, as has previously been observed (Zeff et al. Reference Zeff, Kleber, Fineberg and Lathrop2000; Duchemin et al. Reference Duchemin, Popinet, Josserand and Zaleski2002; Bartolo et al. Reference Bartolo, Josserand and Bonn2006; Ghabache & Séon Reference Ghabache and Séon2016; Michon et al. Reference Michon, Josserand and Séon2017).
$t_c$
is the time of collapse, as has previously been observed (Zeff et al. Reference Zeff, Kleber, Fineberg and Lathrop2000; Duchemin et al. Reference Duchemin, Popinet, Josserand and Zaleski2002; Bartolo et al. Reference Bartolo, Josserand and Bonn2006; Ghabache & Séon Reference Ghabache and Séon2016; Michon et al. Reference Michon, Josserand and Séon2017).
However, cylindrical geometries have also been observed in collapsing cavities, for instance, when a solid body impacts rapidly the free surface of a liquid reservoir (Bergmann et al. Reference Bergmann, van der Meer, Stijnman, Sandtke, Prosperetti and Lohse2006; Duclaux et al. Reference Duclaux, Caillé, Duez, Ybert, Bocquet and Clanet2007; Bergmann et al. Reference Bergmann, Van Der Meer, Gekle, Van Der Bos and Lohse2009; Gekle et al. Reference Gekle, Gordillo, van der Meer and Lohse2009), for the impact of a hydrophobic sphere at low bond numbers (Aristoff et al. Reference Aristoff, Truscott, Techet and Bush2008; Aristoff & Bush Reference Aristoff and Bush2009) or when a drop impacts a superhydrophic substrate (Bartolo et al. Reference Bartolo, Josserand and Bonn2006). In these cases, the collapse appears as the cylindrical pinch-off of the gas–liquid interface (Burton, Waldrep & Taborek Reference Burton, Waldrep and Taborek2005) leading also to very thin and high-velocity jets. Here, the balance between capillary and inertial forces leads to a $(t_c-t)^{1/2}$
scaling for the cylinder radius when
$(t_c-t)^{1/2}$
scaling for the cylinder radius when $t \rightarrow t_c$
, with a logarithmic correction (Burton et al. Reference Burton, Waldrep and Taborek2005; Eggers et al. Reference Eggers, Fontelos, Leppinen and Snoeijer2007).
$t \rightarrow t_c$
, with a logarithmic correction (Burton et al. Reference Burton, Waldrep and Taborek2005; Eggers et al. Reference Eggers, Fontelos, Leppinen and Snoeijer2007).
Therefore, mainly two different types of self-similar dynamics, spherical or cylindrical, can be observed when a cavity collapses, depending on the physical and geometrical parameters, with different self-similar dynamics expanding almost towards the jet formation. Of course, for both dynamics, the self-similar singularity is regularised close to $t_c$
by viscous effects in particular, leading, however, to very thin and high-velocity jets, so that they are often named quasi-singularities. Finally, although the two self-similar dynamics can be observed in the same experiments for different values of the control parameters, they rarely appear simultaneously (Bartolo et al. Reference Bartolo, Josserand and Bonn2006).
$t_c$
by viscous effects in particular, leading, however, to very thin and high-velocity jets, so that they are often named quasi-singularities. Finally, although the two self-similar dynamics can be observed in the same experiments for different values of the control parameters, they rarely appear simultaneously (Bartolo et al. Reference Bartolo, Josserand and Bonn2006).
To the best of our knowledge, all the experiments performed until now were done in the presence of gravity, so that the initial shape of the cavity was influenced by it, leading to specific initial geometrical shape and collapse. This is in fact controlled by the capillary length $l_c= \sqrt {\gamma /\rho g}$
with the surface tension
$l_c= \sqrt {\gamma /\rho g}$
with the surface tension $\gamma$
and the liquid density
$\gamma$
and the liquid density $\rho$
, and we can consider that the collapse is capillary dominated for an initial cavity size below
$\rho$
, and we can consider that the collapse is capillary dominated for an initial cavity size below $l_c$
, while gravity influences it for larger cavities, for water in a terrestrial environment, with
$l_c$
, while gravity influences it for larger cavities, for water in a terrestrial environment, with $g_0={9.81}\,\textrm {m s}^{-2}$
,
$g_0={9.81}\,\textrm {m s}^{-2}$
, $l_{c0}={2.7}\,\textrm {mm}$
. In the present paper, using a drop tower apparatus, we are thus able to investigate capillary collapse over a large range of length scale, much larger than before. Indeed, our drop tower experiment environment provides apparent gravity of
$l_{c0}={2.7}\,\textrm {mm}$
. In the present paper, using a drop tower apparatus, we are thus able to investigate capillary collapse over a large range of length scale, much larger than before. Indeed, our drop tower experiment environment provides apparent gravity of $10^{-4}g_0$
increasing the capillary length for water to
$10^{-4}g_0$
increasing the capillary length for water to $l_c=$
27 cm. Here, the influence of the initial shape of the cavity on the characteristics of the resulting liquid jet is studied, as well as the evolution of the cavity shape. Numerical simulations without gravity are also performed to enlarge the geometrical range of our study. We show in particular that both spherical and cylindrical quasi-singular jets can be observed, and that the two self-similar dynamics can coexist within the same collapse, selecting the type of jets emerging from the collapse.
$l_c=$
27 cm. Here, the influence of the initial shape of the cavity on the characteristics of the resulting liquid jet is studied, as well as the evolution of the cavity shape. Numerical simulations without gravity are also performed to enlarge the geometrical range of our study. We show in particular that both spherical and cylindrical quasi-singular jets can be observed, and that the two self-similar dynamics can coexist within the same collapse, selecting the type of jets emerging from the collapse.
2. Methods
We consider the collapse of an initially stationary axisymmetric air cavity in water with typical radius $R$
and height
$R$
and height $H$
. The initial geometry is thus characterised by its aspect ratio
$H$
. The initial geometry is thus characterised by its aspect ratio $R/H$
and, neglecting the air inertia and viscosity, two typical length scales can be constructed, the capillary one
$R/H$
and, neglecting the air inertia and viscosity, two typical length scales can be constructed, the capillary one $l_c$
and the visco-capillary one
$l_c$
and the visco-capillary one $l_\mu =\mu ^2/\rho \gamma$
, where
$l_\mu =\mu ^2/\rho \gamma$
, where $\mu$
is the liquid dynamic viscosity, so that two additional dimensionless numbers determine the problem – the Bond number
$\mu$
is the liquid dynamic viscosity, so that two additional dimensionless numbers determine the problem – the Bond number $\textit {Bo}\equiv R/l_c=\rho g R^2/\gamma$
(balancing gravity and surface tension) and the Laplace number
$\textit {Bo}\equiv R/l_c=\rho g R^2/\gamma$
(balancing gravity and surface tension) and the Laplace number $\textit {La}\equiv R/l_\mu =\rho \gamma R/\mu ^2$
that can be replaced by the Ohnesorge number
$\textit {La}\equiv R/l_\mu =\rho \gamma R/\mu ^2$
that can be replaced by the Ohnesorge number $\textit {Oh}\equiv 1/\sqrt {\textit {La}}$
(balancing surface tension with viscosity). Therefore, when gravity is absent or can be neglected, that is, when the sizes of the cavity are much smaller than the capillary length, our problem depends only on the Laplace/Ohnesorge number and the aspect ratio
$\textit {Oh}\equiv 1/\sqrt {\textit {La}}$
(balancing surface tension with viscosity). Therefore, when gravity is absent or can be neglected, that is, when the sizes of the cavity are much smaller than the capillary length, our problem depends only on the Laplace/Ohnesorge number and the aspect ratio $H{/}R$
.
$H{/}R$
.
2.1. Experiment
Experiments are performed at the Dryden Drop Tower facility at Portland State University (figure 1). The unique low-gravity environment of this drop tower has been used for a variety of fluid mechanics experiments in the past (Cardin et al. Reference Cardin, Josserand and Cal2023, Reference Cardin, Cabrera-Booman and Cal2024). The experiment apparatus for generating the cavity is mounted to a ‘drop rig’ along with a high-speed camera and backlight. For each drop tower test, the apparatus experiences 22 m of free-fall providing 2.1 s of relative low-gravity $g \lt 10^{-4}g_0$
. The high-speed camera records the dynamics of the cavity formation and collapse which occurs during this 2.1 s free-fall period.
$g \lt 10^{-4}g_0$
. The high-speed camera records the dynamics of the cavity formation and collapse which occurs during this 2.1 s free-fall period.
The air cavity is created by an air jet impacting the free surface of a liquid reservoir. Before each test, a fixed volume of air is added to a pressure vessel connected to the air jet nozzle. The velocity of the jet can be varied by adjusting the volume of air added to the pressure vessel. A micro controller in combination with an accelerometer are used to actuate the solenoid valve open in response to the step reduction in gravity at the start of the drop tower test. The air jet impinges the water surface forming an elongated cavity. After the cavity is formed, the solenoid is closed to stop the air flow and the cavity collapse process ensues. The open time of the solenoid valve was between 50 and 100 ms for all tests. At the end of the drop tower test, after free-fall, residual pressure in the system was released by actuating the valve open so that the pressure vessel reaches atmospheric pressure.
The nozzle was an 8 gauge stainless dispensing needle with an inner diameter of $d_{\textit{nozzle}}=$
3.43 mm. The velocity of the air jet can be approximated by applying Bernoulli’s equation, and considering the stagnation point at the base of the cavity and a point along the jet centreline
$d_{\textit{nozzle}}=$
3.43 mm. The velocity of the air jet can be approximated by applying Bernoulli’s equation, and considering the stagnation point at the base of the cavity and a point along the jet centreline
 \begin{equation} \frac {1}{2}\rho _{\textit{gas}}v_{\textit{gas}}^2=\frac {2\gamma }{R}, \end{equation}
such an expression was used in the previous studies of impingement of gases on liquid surfaces (Aydelott & Labus Reference Aydelott and Labus1971). The jet velocity was not directly measured in experiments, but, considering a typical cavity radius $R=0.5$
cm observed in experiments, (2.1) yields
$R=0.5$
cm observed in experiments, (2.1) yields $v_{\textit{gas}}\approx 7$
m s−1 and thus
$v_{\textit{gas}}\approx 7$
m s−1 and thus $\textit {Re}=\rho _{\textit{gas}}v_{\textit{gas}}d_{\textit{nozzle}}/\mu _{\textit{gas}}\approx 1600$
. The nozzle can be translated vertically to adjust the distance between the nozzle exit and the water surface. By tuning these three parameters (jet velocity, jet duration and nozzle height), a variety of cavity aspect ratios were achieved.
$\textit {Re}=\rho _{\textit{gas}}v_{\textit{gas}}d_{\textit{nozzle}}/\mu _{\textit{gas}}\approx 1600$
. The nozzle can be translated vertically to adjust the distance between the nozzle exit and the water surface. By tuning these three parameters (jet velocity, jet duration and nozzle height), a variety of cavity aspect ratios were achieved.
(a) Photo of the five story Dryden drop tower and (b) sketch of the main components of the experimental apparatus.

A clear cylindrical fluid tank with diameter 100 mm was used. Throughout the experiments, the initial liquid height in the tank was maintained above 80 mm. Water with density ${1000}\,\rm {kg \,m}^{-3}$
, viscosity 1 mPa s and surface tension
${1000}\,\rm {kg \,m}^{-3}$
, viscosity 1 mPa s and surface tension ${72}\,\textrm {mN m}^{-1}$
is used as the working fluid. To decrease optical distortion, the cylindrical tank was placed inside a square tank and the gap between the two tanks was filled with the working fluid. The liquid tank was large enough so that the waves generate by the cavity collapse did not interact with the walls of the container before the cavity collapse had occurred. Cavity aspect ratios up to
${72}\,\textrm {mN m}^{-1}$
is used as the working fluid. To decrease optical distortion, the cylindrical tank was placed inside a square tank and the gap between the two tanks was filled with the working fluid. The liquid tank was large enough so that the waves generate by the cavity collapse did not interact with the walls of the container before the cavity collapse had occurred. Cavity aspect ratios up to $H{/}R=4.5$
were achieved.
$H{/}R=4.5$
were achieved.
The experiment is backlit with a diffuse led panel. Images are captured at 1000–2500 f.p.s. using a high-speed camera (Chronos 2.1-HD). The spatial resolution was ${47}\,{\unicode{x03BC}} \textrm {m}$
per pixel. The height and width of the cavity were measured at their maximum values. Jet drop positions were measured by fitting an ellipse to the droplet and taking the centroid of the ellipse as the drop centroid. Image analysis was performed using ImageJ software (Schindelin et al. Reference Schindelin2012).
${47}\,{\unicode{x03BC}} \textrm {m}$
per pixel. The height and width of the cavity were measured at their maximum values. Jet drop positions were measured by fitting an ellipse to the droplet and taking the centroid of the ellipse as the drop centroid. Image analysis was performed using ImageJ software (Schindelin et al. Reference Schindelin2012).
2.2. Simulation
Direct numerical simulations are employed to study the cavity collapse. The free software Basilisk (Popinet Reference Popinet2003, Reference Popinet2009, Reference Popinet2018) is used to solve the two-dimensional axisymmetric, incompressible two-phase Navier–Stokes equations with surface tension. The collapse of cavity of radius $R$
, height
$R$
, height $H$
, gas density
$H$
, gas density $\rho _{\textit{gas}}$
and dynamic viscosity
$\rho _{\textit{gas}}$
and dynamic viscosity $\mu _{\textit{gas}}$
surrounded by liquid of density
$\mu _{\textit{gas}}$
surrounded by liquid of density $\rho _{\textit{liq}}$
, dynamic viscosity
$\rho _{\textit{liq}}$
, dynamic viscosity $\mu _{\textit{liq}}$
and surface tension
$\mu _{\textit{liq}}$
and surface tension $\gamma$
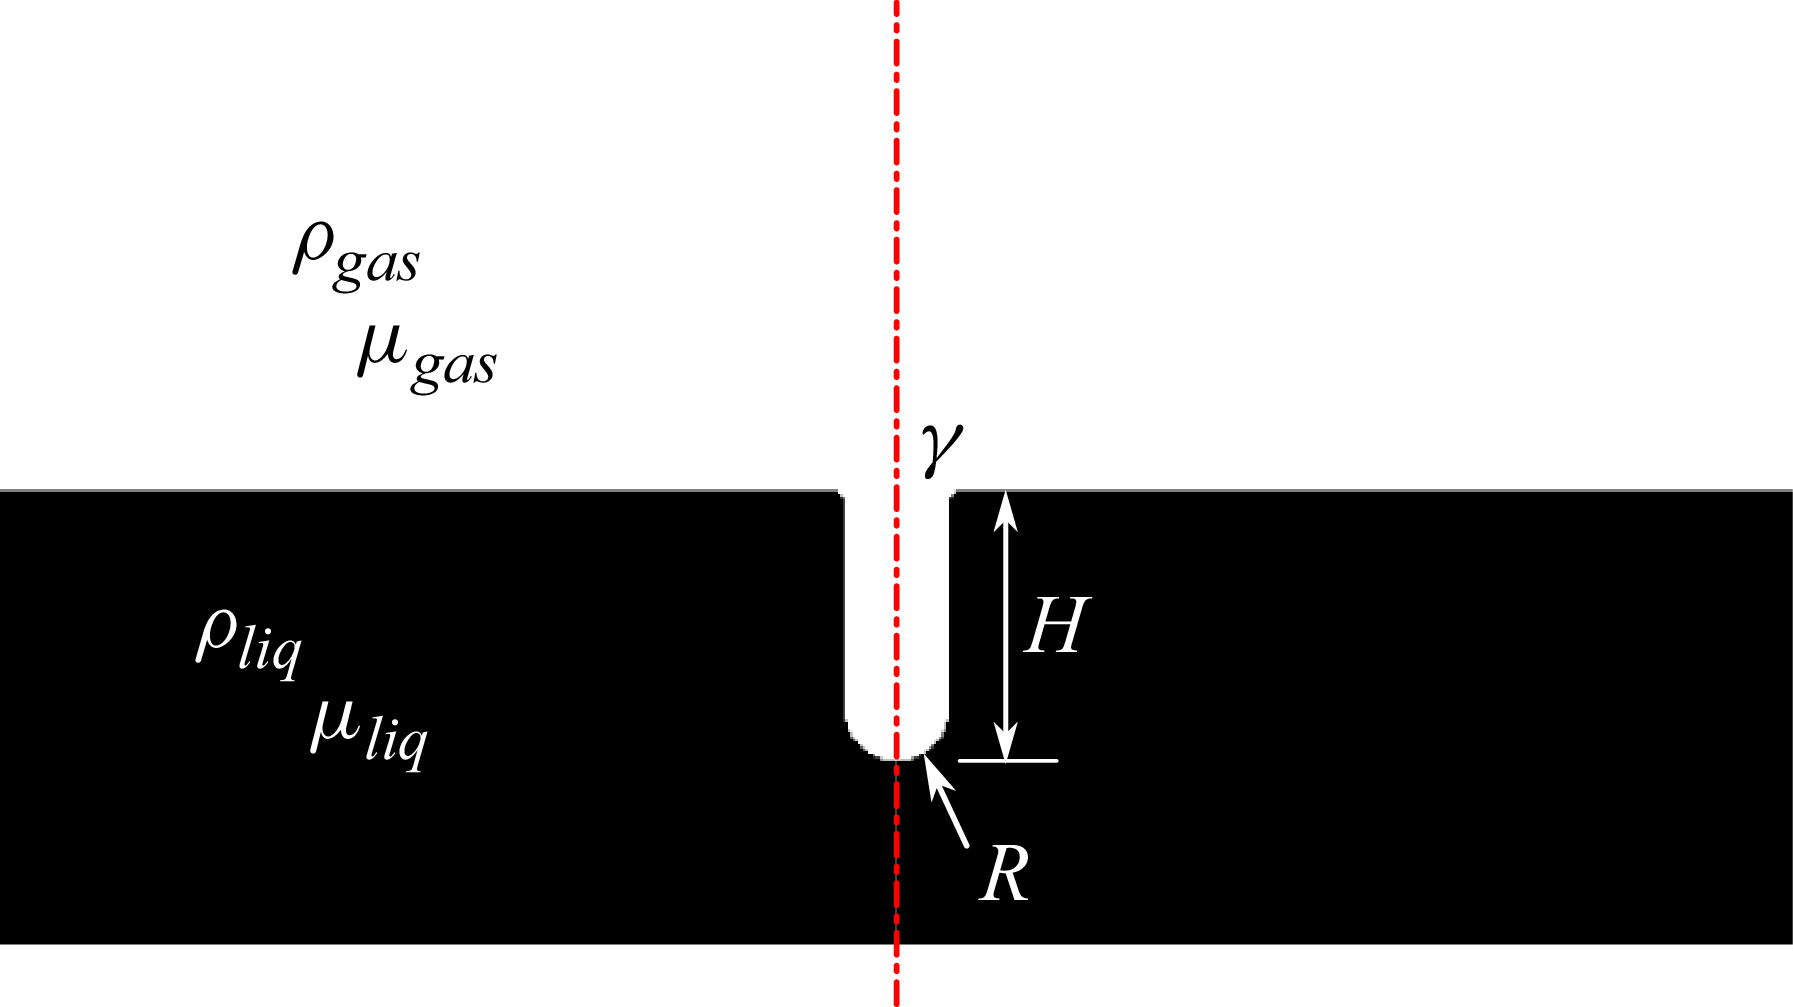
is considered for zero-gravity, see figure 2. From these parameters, four dimensionless groups are constructed which describe the phenomena. First, the fluid ratios, density
$\gamma$
is considered for zero-gravity, see figure 2. From these parameters, four dimensionless groups are constructed which describe the phenomena. First, the fluid ratios, density $\tilde {\rho }=\rho _{\textit{gas}}/\rho _{\textit{liq}}$
and viscosity
$\tilde {\rho }=\rho _{\textit{gas}}/\rho _{\textit{liq}}$
and viscosity $\tilde {\mu }=\mu _{\textit{gas}}/\mu _{\textit{liq}}$
. Since they are usually fixed by the choice of the liquid used, the two control parameters are the geometrical aspect ratio of the cavity
$\tilde {\mu }=\mu _{\textit{gas}}/\mu _{\textit{liq}}$
. Since they are usually fixed by the choice of the liquid used, the two control parameters are the geometrical aspect ratio of the cavity $H{/}R$
and the Laplace number
$H{/}R$
and the Laplace number $\textit {La}\equiv \rho _{\textit{liq}}\gamma R/\mu _{\textit{liq}}^2$
that balances surface tension and liquid viscosity.
$\textit {La}\equiv \rho _{\textit{liq}}\gamma R/\mu _{\textit{liq}}^2$
that balances surface tension and liquid viscosity.
Simulation domain and relevant parameters. Total domain size is $15R\times 15 R$
. The dashed red line represents the rotational axis.
$15R\times 15 R$
. The dashed red line represents the rotational axis.

All lengths are non-dimensionalised by the cavity radius $R$
. The velocity field and time are non-dimensionalised with the inertio-capillary velocity,
$R$
. The velocity field and time are non-dimensionalised with the inertio-capillary velocity, $v_\gamma =(\gamma /(\rho _{\textit{liq}} R))^{1/2}$
, and time,
$v_\gamma =(\gamma /(\rho _{\textit{liq}} R))^{1/2}$
, and time, $t_c=(\rho _{\textit{liq}} R^3/\gamma )^{1/2}$
, respectively. The pressure is non-dimensionalised with the capillary pressure,
$t_c=(\rho _{\textit{liq}} R^3/\gamma )^{1/2}$
, respectively. The pressure is non-dimensionalised with the capillary pressure, $ p_\gamma = \gamma /R$
. The resulting incompressible two-phase Navier–Stokes equations with surface tension can be written in the classical one-fluid formulation (Kataoka Reference Kataoka1986):
$ p_\gamma = \gamma /R$
. The resulting incompressible two-phase Navier–Stokes equations with surface tension can be written in the classical one-fluid formulation (Kataoka Reference Kataoka1986):
 \begin{equation} \frac {\partial \bar {\boldsymbol{u}}}{\partial \bar {t}}+\bar {\boldsymbol{\nabla }}\boldsymbol{\cdot }(\bar {\boldsymbol{u}}\bar {\boldsymbol{u}}) = \frac {1}{\bar {\rho }}\left [-\bar {\boldsymbol{\nabla }}\! \bar {p} + \frac {1}{\sqrt {\textit {La}}} \bar {\mu }\bar {\boldsymbol{\nabla }}\boldsymbol{\cdot }\big(\bar {\boldsymbol{\nabla }}\bar {\boldsymbol{u}}+\big(\bar {\boldsymbol{\nabla }}\bar {\boldsymbol{u}}\big )^T\big )+ \bar {\kappa }\bar {\delta _s}\boldsymbol{n}\right ]\!, \end{equation}
 \begin{eqnarray} \frac {\partial c}{\partial \bar {t}}+\bar {\boldsymbol{u}}\boldsymbol{\cdot }\bar {\boldsymbol{\nabla }}c=0, \end{eqnarray}
 \begin{equation} \bar {\boldsymbol{\nabla }}\boldsymbol{\cdot }\bar {\boldsymbol{u}}=0, \end{equation}
where the dimensionless density and viscosity are $\bar {\rho }=c+(1-c)\tilde {\rho }$
and
$\bar {\rho }=c+(1-c)\tilde {\rho }$
and $\bar {\mu }=c+(1-c)\tilde {\mu }$
. Here,
$\bar {\mu }=c+(1-c)\tilde {\mu }$
. Here, $c$
is the volume of fluid (VoF) tracer (
$c$
is the volume of fluid (VoF) tracer ( $c=1$
in the liquid and
$c=1$
in the liquid and $c=0$
outside the liquid). The domain size is a square sized
$c=0$
outside the liquid). The domain size is a square sized $15R\times 15R$
. The maximum resolution was
$15R\times 15R$
. The maximum resolution was $2^{14}\times 2^{14}$
cells with 1092 grid points across the cavity radius. The free surface of the fluid surrounding the void is in the middle of the domain. The edge where the flat free surface meets the cavity is smoothed with a radius of
$2^{14}\times 2^{14}$
cells with 1092 grid points across the cavity radius. The free surface of the fluid surrounding the void is in the middle of the domain. The edge where the flat free surface meets the cavity is smoothed with a radius of $0.1R$
. All boundary condition are symmetric except the top of the domain which is free outflow to allow drops to exit. The grid resolution was increased until the collapse time converged, and then further increased to balance resolution and simulation time.
$0.1R$
. All boundary condition are symmetric except the top of the domain which is free outflow to allow drops to exit. The grid resolution was increased until the collapse time converged, and then further increased to balance resolution and simulation time.
Throughout the simulation, the number, size and velocity of droplets generated from the collapse are tracked, as well as the cavity profiles. The adaptive mesh refinement allows the code to efficiently resolve the different scales of the problem. Despite a maximum resolution of $4^{14}$
cells, the simulation takes only
$4^{14}$
cells, the simulation takes only ${\sim}48$
h running on 8 cores.
${\sim}48$
h running on 8 cores.
3. Results
3.1. Microgravity experiments
In the experiment, an air jet momentarily impinges on the free surface of a water reservoir in a microgravity environment and creates an approximately cylindrical cavity. Once the cavity is formed, the air jet is turned off and the cavity is allowed to collapse due to surface tension. The cavities generated in the drop tower tests had a characteristic diameter of $\sim$
1 cm corresponding to
$\sim$
1 cm corresponding to $\textit {La}\sim 360\,000$
, with aspect ratios up to
$\textit {La}\sim 360\,000$
, with aspect ratios up to $H{/}R$
= 4.5. Such aspect ratios were achieved by varying the height of the cavity
$H{/}R$
= 4.5. Such aspect ratios were achieved by varying the height of the cavity $H$
primarily through the velocity of the air jet as a result of the initial pressures in the pressure vessel and the open time of the solenoid. For aspect ratios
$H$
primarily through the velocity of the air jet as a result of the initial pressures in the pressure vessel and the open time of the solenoid. For aspect ratios $H{/}R\lt 3.7$
, no jet was generated from the cavity collapse. The temporal development of the collapse of three different cavities is therefore displayed in figure 3(a–c) for
$H{/}R\lt 3.7$
, no jet was generated from the cavity collapse. The temporal development of the collapse of three different cavities is therefore displayed in figure 3(a–c) for $H{/}R=3.7,3.9$
and 4.5.
$H{/}R=3.7,3.9$
and 4.5.
Image montages showing the microgravity collapse of three different air cavities in water. $H{/}R$
= (a) 3.7, (b) 3.9 and (c) 4.5. Jet droplets and trapped bubble are circled in red. Frames are 2.4 ms apart.
$H{/}R$
= (a) 3.7, (b) 3.9 and (c) 4.5. Jet droplets and trapped bubble are circled in red. Frames are 2.4 ms apart.

In the more shallow cavity of figure 3(a), $H{/}R=3.7$
, the collapse of the waves generated at the cavity rims is subdued by interactions between the bottom of the cavity and the collapsing walls. The collapse generates a large droplet
$H{/}R=3.7$
, the collapse of the waves generated at the cavity rims is subdued by interactions between the bottom of the cavity and the collapsing walls. The collapse generates a large droplet $R_d/R=0.3$
with velocity
$R_d/R=0.3$
with velocity ${0.3}\,\rm{m\,s}^{-1}$
. In figure 3(b), the collapse of a slightly higher aspect ratio cavity,
${0.3}\,\rm{m\,s}^{-1}$
. In figure 3(b), the collapse of a slightly higher aspect ratio cavity, $H{/}R$
= 3.9, shows notably different dynamics, generating a more slender jet with first jet drop
$H{/}R$
= 3.9, shows notably different dynamics, generating a more slender jet with first jet drop $R_d/R=0.2$
with higher velocity
$R_d/R=0.2$
with higher velocity ${1.7}\,\rm {m\,s}^{-1}$
. In this case, multiple droplets are generated in contrast to the single jet drop in the test shown in figure 3(a). Furthermore, figure 3(c) shows the collapse of a cavity with
${1.7}\,\rm {m\,s}^{-1}$
. In this case, multiple droplets are generated in contrast to the single jet drop in the test shown in figure 3(a). Furthermore, figure 3(c) shows the collapse of a cavity with $H{/}R=4.5$
which leads to an extremely thin and fast jet. Additionally, a bubble being trapped along the cavity axis is observed. The droplet size is
$H{/}R=4.5$
which leads to an extremely thin and fast jet. Additionally, a bubble being trapped along the cavity axis is observed. The droplet size is $R_d/R=0.04$
and the velocity is
$R_d/R=0.04$
and the velocity is $v={5.0}\,\rm {m\,s}^{-1}$
. For this drop, the initial jet droplets are barely visible at the 2500 f.p.s recording speed and it is likely that the velocity is measured for a drop which is not the smallest or fastest drop.
$v={5.0}\,\rm {m\,s}^{-1}$
. For this drop, the initial jet droplets are barely visible at the 2500 f.p.s recording speed and it is likely that the velocity is measured for a drop which is not the smallest or fastest drop.
A regime which does not result in a jet and two jetting regimes has been outlined already. First, for aspect ratios below 3.7, the cavity relaxation occurs without giving rise to a jet. For aspect ratios $3.7\lt H{/}R\lt 4.5$
, a regime is observed where the jet emerges following the collision of capillary waves at the base of the cavity. This regime can give rise to a variety of jets from very thick and slow for smaller aspect ratios, to very thin and fast for larger aspect rations. For
$3.7\lt H{/}R\lt 4.5$
, a regime is observed where the jet emerges following the collision of capillary waves at the base of the cavity. This regime can give rise to a variety of jets from very thick and slow for smaller aspect ratios, to very thin and fast for larger aspect rations. For $H{/}R \sim 4.5$
, a second jetting regime is observed where a very thin and fast jet appears to emerge before the capillary waves collide at the base of the cavity (figure 3
c). Due to limitations in the experimental apparatus, larger aspect ratios were not observed. To further investigate the phenomena, numerical tools are employed.
$H{/}R \sim 4.5$
, a second jetting regime is observed where a very thin and fast jet appears to emerge before the capillary waves collide at the base of the cavity (figure 3
c). Due to limitations in the experimental apparatus, larger aspect ratios were not observed. To further investigate the phenomena, numerical tools are employed.
3.2. Numerical study
To further investigate the apparent jet behaviour, a parametric numerical study is conducted of the cavity aspect ratio $H{/}R=3.5{-}5.0$
by varying
$H{/}R=3.5{-}5.0$
by varying $H$
only, at zero gravity, with a Laplace number for the whole simulation fixed at
$H$
only, at zero gravity, with a Laplace number for the whole simulation fixed at $\textit {La}=10\,000$
. This value is smaller than the experimental one, corresponding to an increase viscosity for both phases of approximately 6 times. Such an increase in viscosity avoids the formation of high velocities that would increase dramatically the computational costs, while it has only little influence in the interface dynamics of interest here. Following these remarks, the relevant dimensionless groups for the simulation were taken as
$\textit {La}=10\,000$
. This value is smaller than the experimental one, corresponding to an increase viscosity for both phases of approximately 6 times. Such an increase in viscosity avoids the formation of high velocities that would increase dramatically the computational costs, while it has only little influence in the interface dynamics of interest here. Following these remarks, the relevant dimensionless groups for the simulation were taken as $\tilde {\rho }=\rho _g/\rho =1/998$
,
$\tilde {\rho }=\rho _g/\rho =1/998$
, $\tilde {\mu }=\mu _g/\mu =1/55$
, where
$\tilde {\mu }=\mu _g/\mu =1/55$
, where $\rho _g$
and
$\rho _g$
and $\mu _g$
are the density and viscosity of the gas.
$\mu _g$
are the density and viscosity of the gas.
Comparison between experiment and numerical simulations (blue line) for $H{/}R=3.7$
at times
$H{/}R=3.7$
at times $t= 0$
(initial condition for the simulation and larger experimental cavity expansion),
$t= 0$
(initial condition for the simulation and larger experimental cavity expansion), $32$
and
$32$
and $59$
ms.
$59$
ms.

Figure 4 provides a direct comparison between experiment and the numerical simulations (blue line) for $H{/}R=3.7$
. It shows a good qualitative agreement and a correct quantitative agreement despite the fact that the initial condition is simplified with respect to the experimental cavity profile.
$H{/}R=3.7$
. It shows a good qualitative agreement and a correct quantitative agreement despite the fact that the initial condition is simplified with respect to the experimental cavity profile.
As $H{/}R$
varies, the two jetting regimes observed in experiments are also observed in simulations and one additional third jetting regime, at high aspect ratios, is also revealed, as illustrated in figure 5. First, figure 5(a) shows profiles extracted from the simulations for
$H{/}R$
varies, the two jetting regimes observed in experiments are also observed in simulations and one additional third jetting regime, at high aspect ratios, is also revealed, as illustrated in figure 5. First, figure 5(a) shows profiles extracted from the simulations for $H{/}R=3.8$
. It clearly shows that a jet emerges from the bottom of the cavity; we call it the no-dimple regime. However, for
$H{/}R=3.8$
. It clearly shows that a jet emerges from the bottom of the cavity; we call it the no-dimple regime. However, for $H{/}R=4.5$
(figure 5
b), a small dimple is formed at the bottom of the cavity by the capillary waves, leading to the entrapment of a small bubble and to a high-speed jet (we call it the dimple regime). Finally, figure 5(c) show profiles extracted from simulations for
$H{/}R=4.5$
(figure 5
b), a small dimple is formed at the bottom of the cavity by the capillary waves, leading to the entrapment of a small bubble and to a high-speed jet (we call it the dimple regime). Finally, figure 5(c) show profiles extracted from simulations for $H{/}R=4.7$
: a large bubble is entrapped due to the collapse of the cavity wall before the cavity has retracted, the cavity wall regime. These three set of profiles clearly show that the origin of the jet can be different: for the first two cases, it comes from the bottom of the cavity, with eventually a thin/high-speed jet configuration created by the collapse of the dimple, entrapping a bubble. For the latter case, however (figure 5
c), the jet emerges from the collapse of the cavity walls. It is important to emphasise here that the collapsing topology changes rapidly as the aspect ratio varies near the transition between different regimes.
$H{/}R=4.7$
: a large bubble is entrapped due to the collapse of the cavity wall before the cavity has retracted, the cavity wall regime. These three set of profiles clearly show that the origin of the jet can be different: for the first two cases, it comes from the bottom of the cavity, with eventually a thin/high-speed jet configuration created by the collapse of the dimple, entrapping a bubble. For the latter case, however (figure 5
c), the jet emerges from the collapse of the cavity walls. It is important to emphasise here that the collapsing topology changes rapidly as the aspect ratio varies near the transition between different regimes.
An illustration for each jetting regime is provided and the region from which the jet emerges is circled. Profile simulations showing the cavity evolution in the (a) no-dimple, $H{/}R=3.8$
, (b) dimple,
$H{/}R=3.8$
, (b) dimple, $H{/}R=4.5$
, and (c) cavity wall,
$H{/}R=4.5$
, and (c) cavity wall, $H{/}R=4.7$
, regimes.
$H{/}R=4.7$
, regimes.

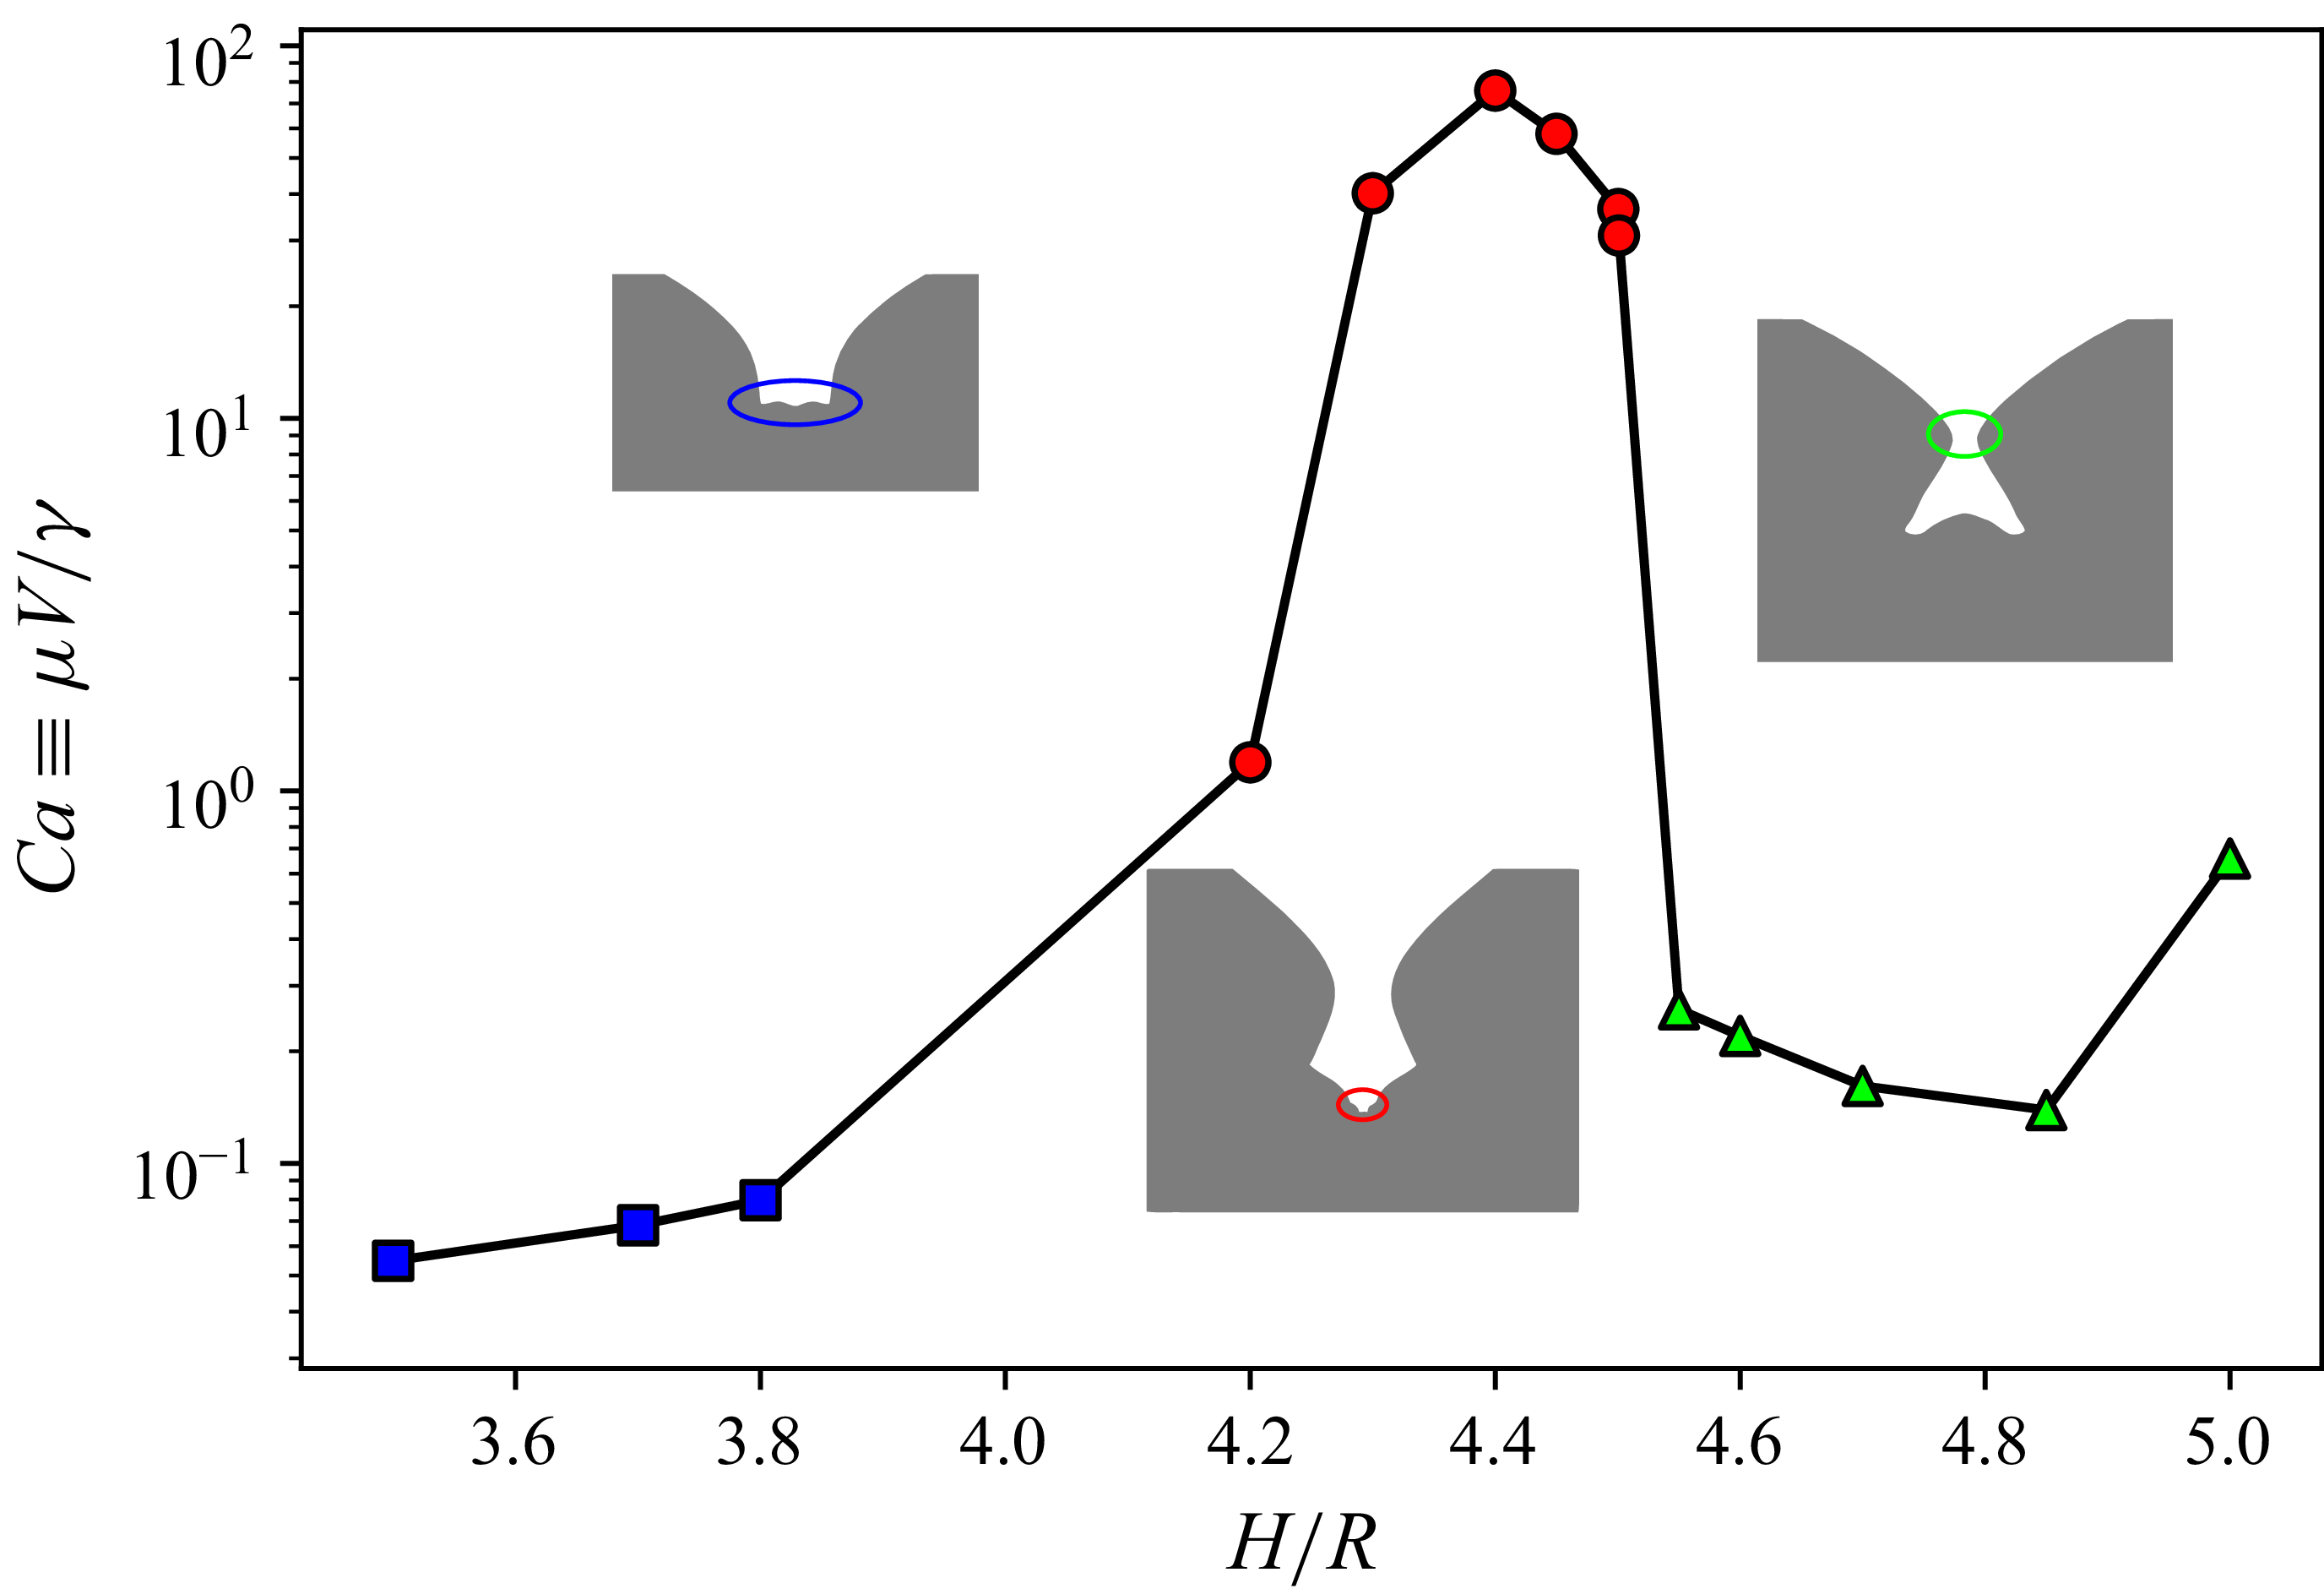
Using data from simulations, a closer look at the dynamics of the jetting regimes can be provided through the analysis of the maximum velocity of the jet drop $V$
, plotted against the cavity aspect ratio in figure 6. The velocity has been made dimensionless leading to the jet drop Capillary number defined as
$V$
, plotted against the cavity aspect ratio in figure 6. The velocity has been made dimensionless leading to the jet drop Capillary number defined as $\textit{Ca}=\mu V{/}\gamma$
. The three jetting regimes are identified as indicated by the point markers and illustrated schematically: the no-dimple regime at low aspect ration (
$\textit{Ca}=\mu V{/}\gamma$
. The three jetting regimes are identified as indicated by the point markers and illustrated schematically: the no-dimple regime at low aspect ration ( $H{/}R \lt 4$
blue square); at intermediate aspect ratio (
$H{/}R \lt 4$
blue square); at intermediate aspect ratio ( $4\lt H{/}R\lt 4.501$
red circles), the dimple regime; for larger aspect ratio (
$4\lt H{/}R\lt 4.501$
red circles), the dimple regime; for larger aspect ratio ( $H{/}R\gt 4.501$
green triangle), the cavity wall regime. Figure 6 shows the abrupt increase in the velocity of the top jet drop for an aspect ratio of
$H{/}R\gt 4.501$
green triangle), the cavity wall regime. Figure 6 shows the abrupt increase in the velocity of the top jet drop for an aspect ratio of $4.2$
. A maximum value of
$4.2$
. A maximum value of $\textit{Ca}\sim 50$
is even observed for
$\textit{Ca}\sim 50$
is even observed for $H{/}R \sim 4.4$
, with high values of the velocity all over the dimple regime. The magnitude of these peaks is similar to previous studies (Duchemin et al. Reference Duchemin, Popinet, Josserand and Zaleski2002; Bartolo et al. Reference Bartolo, Josserand and Bonn2006; Deike et al. Reference Deike, Ghabache, Liger-Belair, Das, Zaleski, Popinet and Séon2018) and they coincide with the transition towards a small bubble entrapment regime. Finally, we observe that as the aspect ratio increases, the jetting regimes are traversed in the order: no dimple, dimple and cavity wall collapse.
$H{/}R \sim 4.4$
, with high values of the velocity all over the dimple regime. The magnitude of these peaks is similar to previous studies (Duchemin et al. Reference Duchemin, Popinet, Josserand and Zaleski2002; Bartolo et al. Reference Bartolo, Josserand and Bonn2006; Deike et al. Reference Deike, Ghabache, Liger-Belair, Das, Zaleski, Popinet and Séon2018) and they coincide with the transition towards a small bubble entrapment regime. Finally, we observe that as the aspect ratio increases, the jetting regimes are traversed in the order: no dimple, dimple and cavity wall collapse.
Capillary number of the jet top droplet for $H{/}R=$
3.5, 3.7, 3.8, 4.2, 4.3, 4.4, 4.45, 4.5005, 4.501, 4.55, 4.60, 4.7, 4.85, 5 and
$H{/}R=$
3.5, 3.7, 3.8, 4.2, 4.3, 4.4, 4.45, 4.5005, 4.501, 4.55, 4.60, 4.7, 4.85, 5 and $\textit {La}=10\,000$
obtained by numerical simulations. At
$\textit {La}=10\,000$
obtained by numerical simulations. At $H{/}R=4.2$
, an abrupt increase in drop velocity coincides with the initial trapping of a bubble. Three distinct regimes are observed:
$H{/}R=4.2$
, an abrupt increase in drop velocity coincides with the initial trapping of a bubble. Three distinct regimes are observed: ![]() , no-dimple;
, no-dimple; ![]() , dimple;
, dimple; ![]() , cavity wall.
, cavity wall.

(a) Profiles extracted from simulation with $H{/}R=4.5$
at times
$H{/}R=4.5$
at times $t_c-t$
= (17.0, 15.0, 13.0, 11.0, 8.0, 6.0, 4.0, 1.0) ms. Red circles identify the cusp of the profile. (b) Red circles identify the cusp of the profile.
$t_c-t$
= (17.0, 15.0, 13.0, 11.0, 8.0, 6.0, 4.0, 1.0) ms. Red circles identify the cusp of the profile. (b) Red circles identify the cusp of the profile. $R^2$
is plotted against time. The collapse time is determined from the linear fit as
$R^2$
is plotted against time. The collapse time is determined from the linear fit as $t_c=40.19$
ms. The cusp radius is measured at
$t_c=40.19$
ms. The cusp radius is measured at $t_c-t$
= (17.0, 15.0, 13.0, 11.0, 8.0, 6.0, 4.0, 1.0) ms. (c) Profiles scaled by
$t_c-t$
= (17.0, 15.0, 13.0, 11.0, 8.0, 6.0, 4.0, 1.0) ms. (c) Profiles scaled by $(t_c-t)^{1/2}$
at times
$(t_c-t)^{1/2}$
at times $t_c-t$
= (17.0, 15.0, 13.0, 11.0, 8.0, 6.0, 4.0, 1.0) ms. Red circles identify the cusp of the profile.
$t_c-t$
= (17.0, 15.0, 13.0, 11.0, 8.0, 6.0, 4.0, 1.0) ms. Red circles identify the cusp of the profile.

3.3. Cavity dynamics at the dimple–cavity transition
We will focus now on the dynamics of the collapse near the frontier between the dimple and the cavity wall regimes: simulations are performed for a cavity with $H{/}R$
= 4.5 and cavity profiles are exported every 0.04 ms. Cavity profiles are shown in figure 7(a), as we are approaching the collapse. The minimum radius of the cavity wall
$H{/}R$
= 4.5 and cavity profiles are exported every 0.04 ms. Cavity profiles are shown in figure 7(a), as we are approaching the collapse. The minimum radius of the cavity wall $R_{\textit{min}}$
is identified and tracked through time, as indicated by the red dots on the figure. The square of this radius
$R_{\textit{min}}$
is identified and tracked through time, as indicated by the red dots on the figure. The square of this radius $R_{\textit{min}}^2$
is plotted in figure 7(b) as a function of time, showing a good agreement to a cylindrical collapse
$R_{\textit{min}}^2$
is plotted in figure 7(b) as a function of time, showing a good agreement to a cylindrical collapse $R_{\textit{min}} \propto (t_c-t)^{1/2}$
, with
$R_{\textit{min}} \propto (t_c-t)^{1/2}$
, with $t_{c}=40.19$
ms (a best fit giving
$t_{c}=40.19$
ms (a best fit giving $(t_c-t)^{0.546}$
). This is consistent with previous experimental and numerical studies where cylindrical collapse dynamics was observed (Bartolo et al. Reference Bartolo, Josserand and Bonn2006; Keim et al. Reference Keim, Møller, Zhang and Nagel2006; Eggers et al. Reference Eggers, Fontelos, Leppinen and Snoeijer2007; Thoroddsen, Etoh & Takehara Reference Thoroddsen, Etoh and Takehara2007).
$(t_c-t)^{0.546}$
). This is consistent with previous experimental and numerical studies where cylindrical collapse dynamics was observed (Bartolo et al. Reference Bartolo, Josserand and Bonn2006; Keim et al. Reference Keim, Møller, Zhang and Nagel2006; Eggers et al. Reference Eggers, Fontelos, Leppinen and Snoeijer2007; Thoroddsen, Etoh & Takehara Reference Thoroddsen, Etoh and Takehara2007).
To characterise the self-similar collapse, the cavity profiles scaled by $(t_c-t)^{1/2}$
are presented in figure 7(c). The scaled profiles are shifted vertically so that the neck of the cavity is aligned through time. While the collapse of the profile near the neck of the wall (all the red dots are almost at the same position) is very good, the overall shape of the cavity is not self-similar through the time range considered. This is especially apparent at the bottom of the cavity, since the curvature at the bottom of the cavity is initially concave and switches to convex as the cavity collapses. The relatively fast motion of the base of the cavity relative to the walls creates a notch (figure 7
a). For aspect ratios
$(t_c-t)^{1/2}$
are presented in figure 7(c). The scaled profiles are shifted vertically so that the neck of the cavity is aligned through time. While the collapse of the profile near the neck of the wall (all the red dots are almost at the same position) is very good, the overall shape of the cavity is not self-similar through the time range considered. This is especially apparent at the bottom of the cavity, since the curvature at the bottom of the cavity is initially concave and switches to convex as the cavity collapses. The relatively fast motion of the base of the cavity relative to the walls creates a notch (figure 7
a). For aspect ratios $H{/}R\gt 4.5$
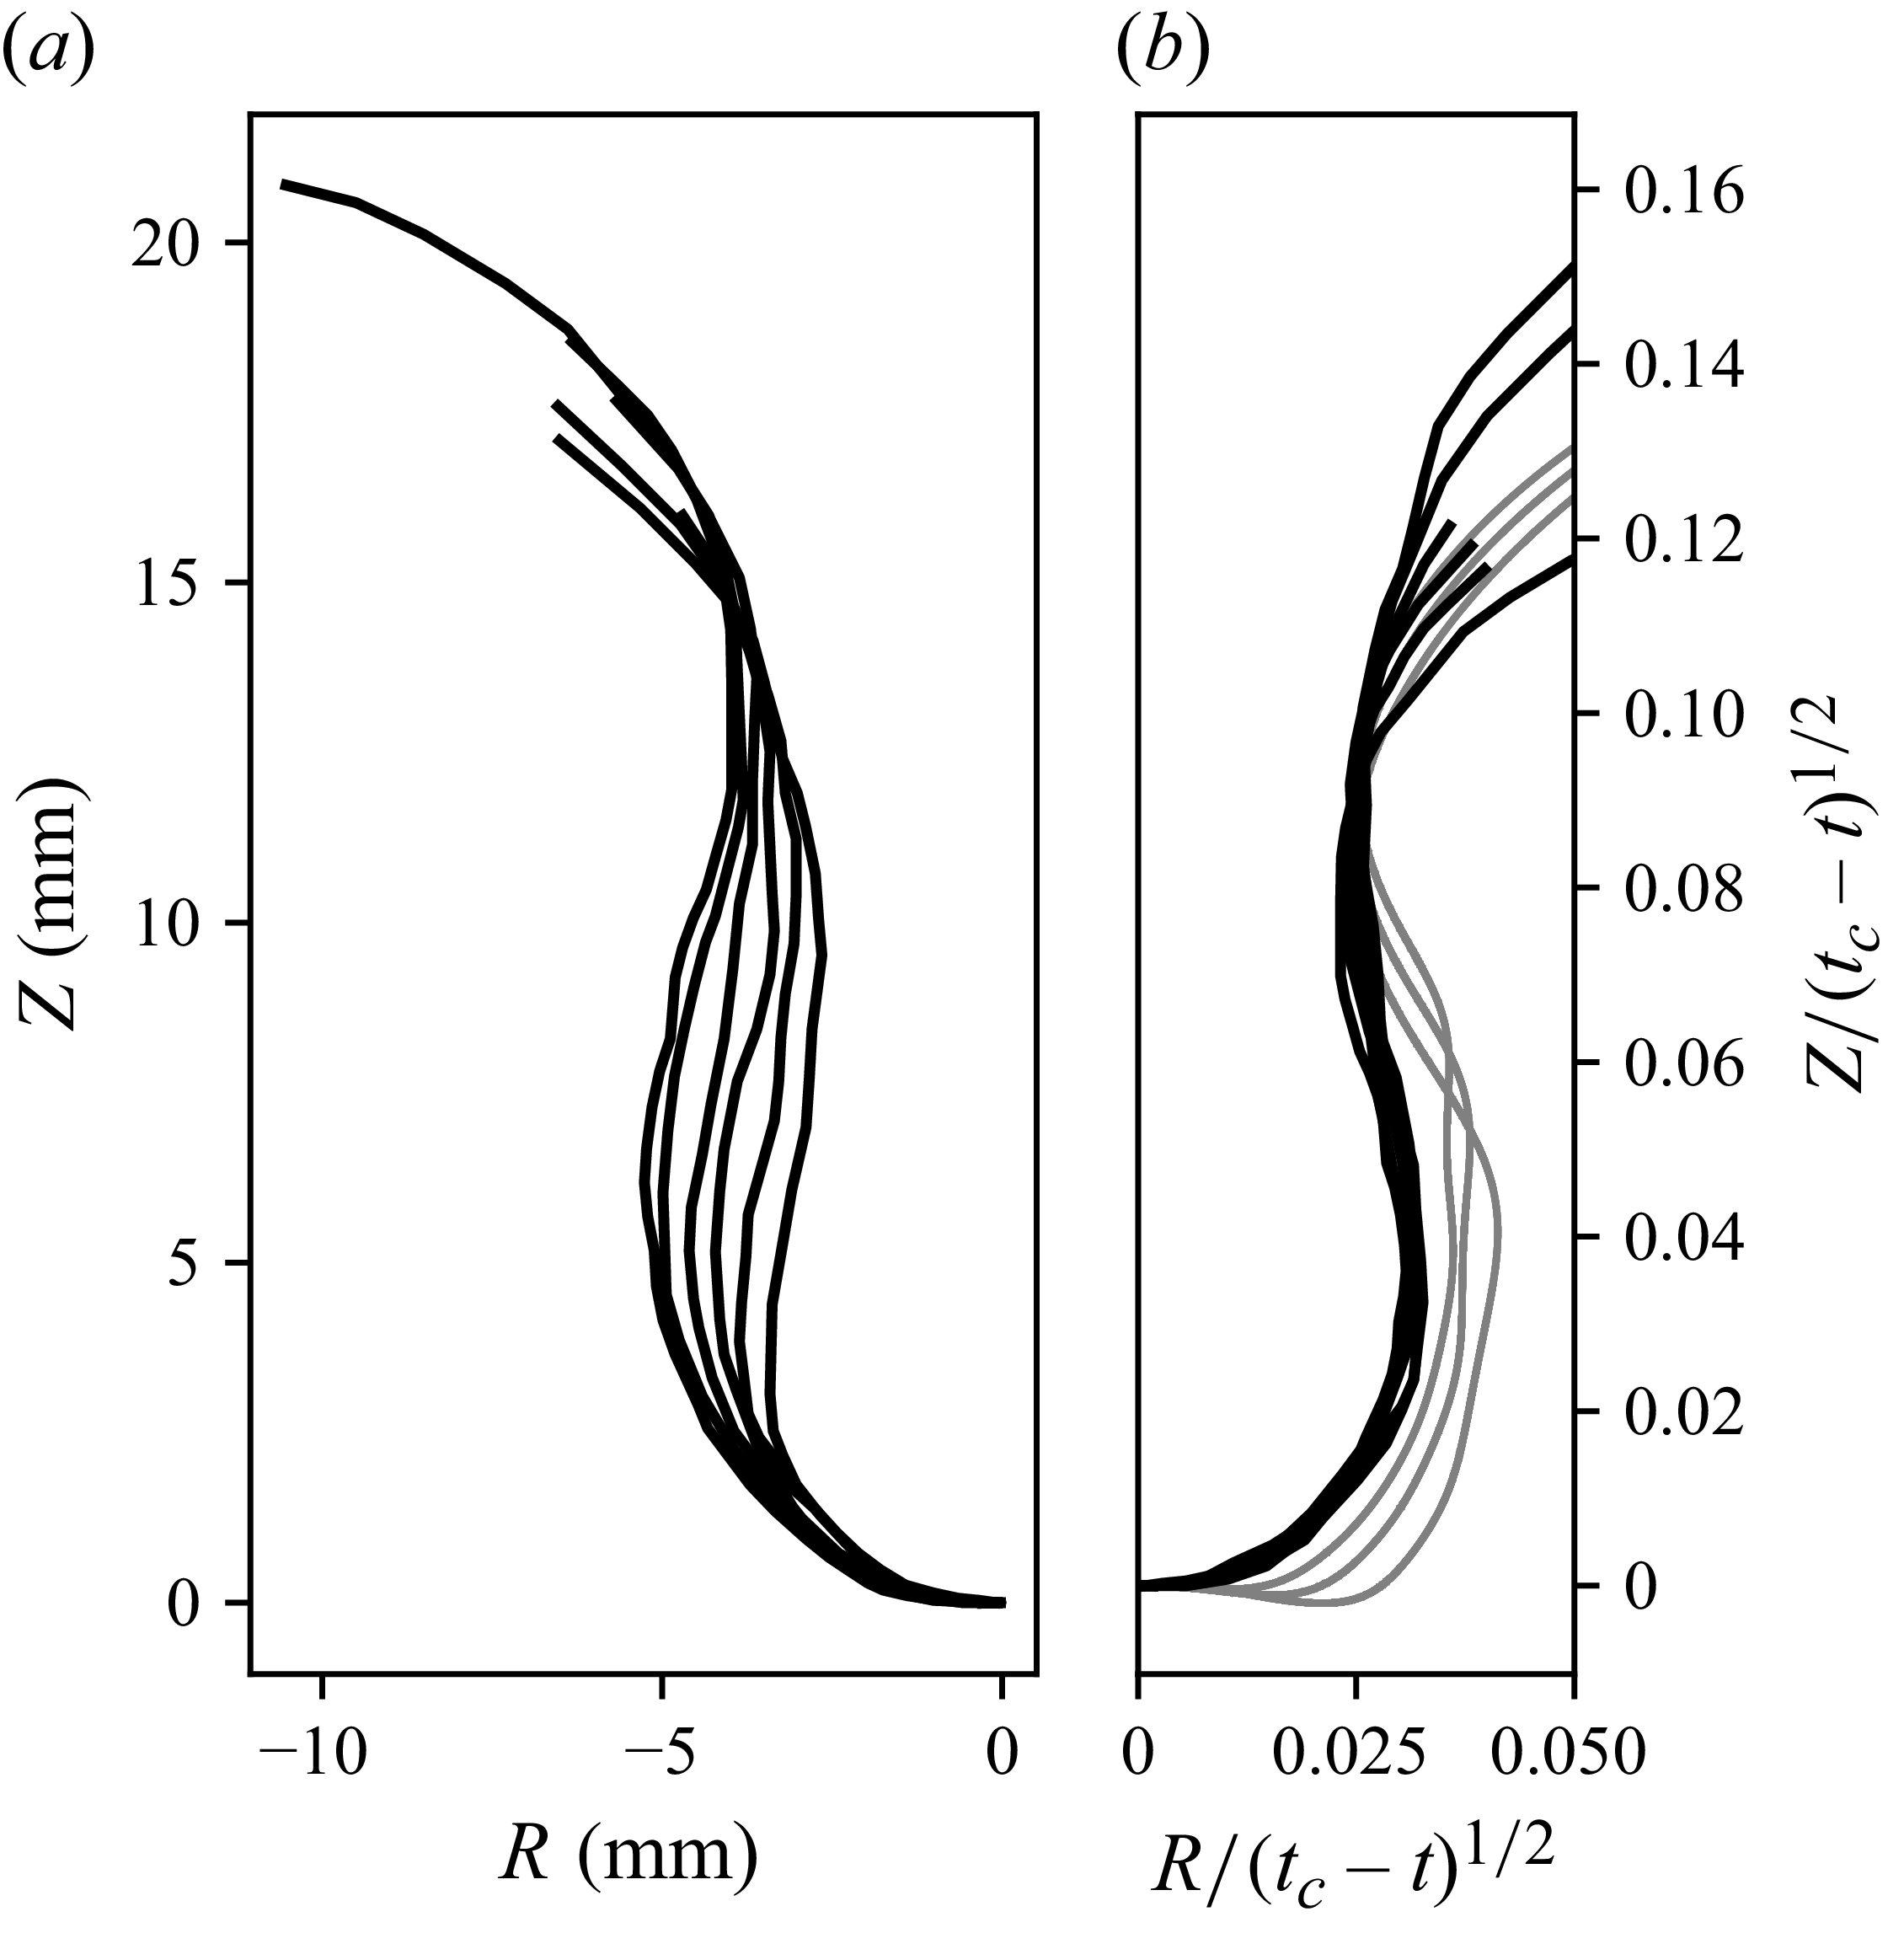
, this notch contributes in fact to the volume of the large trapped bubble. Remarkably, this self-similar dynamics of the cavity neck can also be observed in the experiments, using the cavity profiles extracted from images captured during drop tower tests, as shown in figure 8. Panel (a) shows the experimental cavity profiles as time evolves, while panel (b) exhibits the same profile rescaled according to
$H{/}R\gt 4.5$
, this notch contributes in fact to the volume of the large trapped bubble. Remarkably, this self-similar dynamics of the cavity neck can also be observed in the experiments, using the cavity profiles extracted from images captured during drop tower tests, as shown in figure 8. Panel (a) shows the experimental cavity profiles as time evolves, while panel (b) exhibits the same profile rescaled according to $(t_c-t)^{1/2}$
as well as profiles from figure 7(c) at similar times
$(t_c-t)^{1/2}$
as well as profiles from figure 7(c) at similar times $(t_c-t)$
. The collapse time
$(t_c-t)$
. The collapse time $t_c=30$
ms is determined from the experimental data by fitting two rescaled profiles over each other. The experimental and simulated profiles show reasonable agreement, though not a perfect collapse between them. A possible source of this difference is the simplified initial cavity shape implemented in the simulation. Good collapse of the profiles is also observed near the neck with this rescaling. Unfortunately, the camera resolution prevents capturing profiles closer to the collapse time.
$t_c=30$
ms is determined from the experimental data by fitting two rescaled profiles over each other. The experimental and simulated profiles show reasonable agreement, though not a perfect collapse between them. A possible source of this difference is the simplified initial cavity shape implemented in the simulation. Good collapse of the profiles is also observed near the neck with this rescaling. Unfortunately, the camera resolution prevents capturing profiles closer to the collapse time.
Cavity profiles extracted from drop tower experiment with $H{/}R=4.5$
(a) at times
$H{/}R=4.5$
(a) at times $t_c-t$
= (32, 28, 25, 20, 17, 14) ms and (b) scaled by
$t_c-t$
= (32, 28, 25, 20, 17, 14) ms and (b) scaled by $(t_c-t)^{1/2}$
. Scaled curves from the simulation at times
$(t_c-t)^{1/2}$
. Scaled curves from the simulation at times $t_c-t$
= (17.0, 15.0, 13.0) ms are also included for comparison.
$t_c-t$
= (17.0, 15.0, 13.0) ms are also included for comparison.

While the neck of the cavity obeys the expected cylindrical self-similar dynamics, it is tempting to further investigate the dynamics that follows the dimple region, characterised here by the notched geometry. In fact, if we approach the collapse even closer, a dimple forms at the base of the cavity that travels faster than the cavity walls, as is shown in figure 9(a), where the time scale of the profile evolution is much shorter. The cusp of the dimple wall is tracked through time and figure 9(b) shows the walls at the base of cavity evolves at $R\propto (t_c'-t)^{2/3}$
, where
$R\propto (t_c'-t)^{2/3}$
, where $t_c'=40.07$
ms is the new collapse time corresponding to the base of the cavity. Profiles scaled according to
$t_c'=40.07$
ms is the new collapse time corresponding to the base of the cavity. Profiles scaled according to $(t_c'-t)^{2/3}$
are provided in figure 9(c), showing a good collapse of the notches, while however the cavity walls are not collapsing together. The self-similar collapse of this smaller cavity leading to a high-speed slender jet is similar to previous observations for the case of a bursting bubble (Duchemin et al. Reference Duchemin, Popinet, Josserand and Zaleski2002), Faraday waves (Zeff et al. Reference Zeff, Kleber, Fineberg and Lathrop2000) and drop impact cavities (Michon et al. Reference Michon, Josserand and Séon2017). This case demonstrates that the two different self-similar regimes (cavity wall and the dimple collapse) can be present during the same bubble collapse and can happen almost simultaneously (the difference between the two collapse times is
$(t_c'-t)^{2/3}$
are provided in figure 9(c), showing a good collapse of the notches, while however the cavity walls are not collapsing together. The self-similar collapse of this smaller cavity leading to a high-speed slender jet is similar to previous observations for the case of a bursting bubble (Duchemin et al. Reference Duchemin, Popinet, Josserand and Zaleski2002), Faraday waves (Zeff et al. Reference Zeff, Kleber, Fineberg and Lathrop2000) and drop impact cavities (Michon et al. Reference Michon, Josserand and Séon2017). This case demonstrates that the two different self-similar regimes (cavity wall and the dimple collapse) can be present during the same bubble collapse and can happen almost simultaneously (the difference between the two collapse times is $\Delta t_c=0.12$
ms for
$\Delta t_c=0.12$
ms for $H{/}R=4.5$
). In the present case of
$H{/}R=4.5$
). In the present case of $H{/}R=4.5$
, the dimple regime is just ahead of the cavity wall one so that the observed jet is due to the dimple, leading to a small jet. For slightly higher value (
$H{/}R=4.5$
, the dimple regime is just ahead of the cavity wall one so that the observed jet is due to the dimple, leading to a small jet. For slightly higher value ( $H{/}R=4.6$
for instance), the cavity wall collapse happens earlier leading to different jet features and a larger bubble entrapment. In between, a critical value of
$H{/}R=4.6$
for instance), the cavity wall collapse happens earlier leading to different jet features and a larger bubble entrapment. In between, a critical value of $H{/}R$
(very close to 4.5) is expected for which the two collapses may happen simultaneously. Despite numerous attempts, we have not been able to exactly track these almost singular dynamics, but
$H{/}R$
(very close to 4.5) is expected for which the two collapses may happen simultaneously. Despite numerous attempts, we have not been able to exactly track these almost singular dynamics, but $H{/}R=4.5$
is considered to be sufficiently close for this study. In fact, the concurrence of the two singularities at the same time,
$H{/}R=4.5$
is considered to be sufficiently close for this study. In fact, the concurrence of the two singularities at the same time, $t_c=t_c'$
, might not be reachable by varying only
$t_c=t_c'$
, might not be reachable by varying only $H{/}R$
since it should demand specific values in the global parameter space (including varying the liquid physical parameters). Indeed, when
$H{/}R$
since it should demand specific values in the global parameter space (including varying the liquid physical parameters). Indeed, when $t_c=t_c'$
, one might expect the two singularities to happen at the same time and the same location, thus at the intersection between the two singularity varieties in the parameter space, so a priori for specific liquid density and surface tension only (Eggers & Fontelos Reference Eggers and Fontelos2015). Therefore, the fact that we do not observe in our numerics the concurrence of the two singularities indicates that
$t_c=t_c'$
, one might expect the two singularities to happen at the same time and the same location, thus at the intersection between the two singularity varieties in the parameter space, so a priori for specific liquid density and surface tension only (Eggers & Fontelos Reference Eggers and Fontelos2015). Therefore, the fact that we do not observe in our numerics the concurrence of the two singularities indicates that $\Delta t_c$
exhibits a finite jump (from positive to a negative value) when the appearance of the two singularity inverts, as varying
$\Delta t_c$
exhibits a finite jump (from positive to a negative value) when the appearance of the two singularity inverts, as varying $H{/}R$
only. Nevertheless, we want to emphasise here that, to the best of our knowledge, this is the first time that the two self-similar regimes are observed and identified during the same collapsing dynamics, showing that these two singular regimes can coexist.
$H{/}R$
only. Nevertheless, we want to emphasise here that, to the best of our knowledge, this is the first time that the two self-similar regimes are observed and identified during the same collapsing dynamics, showing that these two singular regimes can coexist.
(a) Profiles extracted from simulation with the same initial cavity geometry as figure 7, $H{/}R=4.5$
, at times
$H{/}R=4.5$
, at times $t_c'-t$
= 0.48, 0.43, 0.39, 0.35, 0.31, 0.27, 0.23, 0.18, 0.14, 0.1, 0.06, 0.02 ms. Red circles identify the cusp of the trough profile. (b)
$t_c'-t$
= 0.48, 0.43, 0.39, 0.35, 0.31, 0.27, 0.23, 0.18, 0.14, 0.1, 0.06, 0.02 ms. Red circles identify the cusp of the trough profile. (b) $R^{3/2}$
is plotted against time for the identified points. The collapse time is determined from the linear fit as
$R^{3/2}$
is plotted against time for the identified points. The collapse time is determined from the linear fit as $t_c'=40.07$
ms. (c) Profiles in panel (a) scaled by
$t_c'=40.07$
ms. (c) Profiles in panel (a) scaled by $(t_c'-t)^{2/3}$
. The profile at
$(t_c'-t)^{2/3}$
. The profile at $t_c'-t$
= 0.02 ms is removed for clarity.
$t_c'-t$
= 0.02 ms is removed for clarity.

4. Conclusion
Slender cavities have been created in a microgravity environment by momentarily impinging a free liquid surface with an air jet. Drop tower experiments show the collapse of a high aspect ratio cavity can lead to very different jet formation. Holding the fluid properties constant, jets can generate huge slow-moving droplets or very small high-velocity droplets depending on the initial cavity geometry. Previously work showed that singular jet behaviour could be achieved from the same initial geometry of a bursting bubble by altering the Laplace number. In brief remarks, it was also predicted that a singularity might be achieved by changing the shape of the bursting bubble, but not shown experimentally nor numerically (Duchemin et al. Reference Duchemin, Popinet, Josserand and Zaleski2002).
Here, it shown for the first time that quasi-singular jet behaviour can be achieved by altering the initial geometry of the collapsing cavity. A parametric study using simulations shows the dependence of the jet velocity on the initial cavity geometry. A region with high jet speed is observed for $4.2 \leq H{/}R \lessapprox 4.5$
: there, the high-speed jet emerges from a small dimple which collapses at the base of the cavity before the main walls of the cavity collide. Drop tower tests also show high jet velocities for similar aspect ratio. Dedicated numerical simulations reveal how this dimple collapse regime disappears around
$4.2 \leq H{/}R \lessapprox 4.5$
: there, the high-speed jet emerges from a small dimple which collapses at the base of the cavity before the main walls of the cavity collide. Drop tower tests also show high jet velocities for similar aspect ratio. Dedicated numerical simulations reveal how this dimple collapse regime disappears around $H{/}R \simeq 4.5$
; while below this critical value, the main cavity walls that evolve like
$H{/}R \simeq 4.5$
; while below this critical value, the main cavity walls that evolve like $(t_c-t)^{1/2}$
are outpaced by the dimple walls that evolve with
$(t_c-t)^{1/2}$
are outpaced by the dimple walls that evolve with $(t_c'-t)^{2/3}$
, meaning that
$(t_c'-t)^{2/3}$
, meaning that $t'_c\lt t_c$
. In the opposite situation (
$t'_c\lt t_c$
. In the opposite situation ( $t_c\lt t'_c$
) for
$t_c\lt t'_c$
) for $H{/}R \geq 4.5$
, the jet emerges due to the cavity wall collapse, leading to a slower and thicker jet. Remarkably, in this latter regime, the dimple jet can still emerge, but it is absorbed by the cavity wall that has collapsed earlier, indicating that the two self-similar regimes can coexist during the same collapse.
$H{/}R \geq 4.5$
, the jet emerges due to the cavity wall collapse, leading to a slower and thicker jet. Remarkably, in this latter regime, the dimple jet can still emerge, but it is absorbed by the cavity wall that has collapsed earlier, indicating that the two self-similar regimes can coexist during the same collapse.
Finally, for $t_c=t'_c$
, a peculiar regime is expected where the two jets, one from the dimple, the other from the walls, should emerge simultaneously. This specific regime, where the two singularities would arise at the same time and location, was not observed here by only varying
$t_c=t'_c$
, a peculiar regime is expected where the two jets, one from the dimple, the other from the walls, should emerge simultaneously. This specific regime, where the two singularities would arise at the same time and location, was not observed here by only varying $H{/}R$
, suggesting that it can only be observed for peculiar liquid parameters. It is hoped that additional experimental data and theoretical developments will provide further perspectives on the regimes presented here and illuminate such additional regimes.
$H{/}R$
, suggesting that it can only be observed for peculiar liquid parameters. It is hoped that additional experimental data and theoretical developments will provide further perspectives on the regimes presented here and illuminate such additional regimes.
Declaration of interests
The authors report no conflict of interest.


 Open access