


A limited intake of certain dietary sugars is recommended due to their potential association with adverse health effects(Reference Turck and Bohn1). There is currently a lot of attention on free or added sugars, but recommendations from different authorities use different terminology, definitions and numerical guidelines. Free sugars are commonly defined according to the WHO as ‘monosaccharides and disaccharides added to foods and beverages by the manufacturer, cook or consumer, and sugars naturally present in honey, syrups, fruit juices and fruit juice concentrates’(2). The shared focus on either sugars classification is targeting sugars added to foods and beverages during food processing or preparation, with the fundamental difference between free and added sugars being the inclusion of fruit juice within the definition of free sugars(Reference Turck and Bohn1–Reference Blomhoff, Andersen and Arnesen3). Recommendations often advise limiting intakes of free or added sugars to below 10 % of total energy (E%)(2–4). While the relationship between high intakes of sugars and dental caries is well established, evidence for relationships between obesity and metabolic diseases is moderate to low(Reference Turck and Bohn1). A common rationale for recommendations on limiting sugars intake is that elevated intakes may contribute to excess energy intake(2,4,5) and compromise the intake of micronutrients and dietary fibre(2–4). Moreover, it is emphasised as especially important for those with low energy intake to limit the intake of added and free sugars and thereby increase the nutrient density of the diet(Reference Sonestedt and Øverby6).
A growing body of literature has examined associations between added or free sugars intake and nutrient intake or diet quality in various populations(Reference Cara, Fan and Chiu7,Reference Louie and Tapsell8) . Overall, most studies indicate generally unfavourable associations, linking higher free or added sugars intake to poorer diet quality or reduced nutrient density (e.g. (Reference González-Padilla, A Dias and Ramne9–Reference Wong, Mok and Ahmad15)). However, these relationships are not consistent across nutrients or intake levels. Some studies report heterogeneous or non-linear patterns, indicating that associations do not always follow a simple inverse gradient(Reference Fujiwara, Okada and Okada10,Reference Gibson, Francis and Newens12,Reference Maunder, Nel and Steyn14) . Comparisons across intake levels further suggest that very low free or added sugars intake does not consistently correspond to the most favourable nutrient profiles. In some analyses, moderate intake levels have been associated with similar or higher absolute micronutrient intakes or comparable nutrient adequacy depending on the nutrients examined(Reference Fujiwara, Okada and Okada10,Reference Fulgoni, Gaine and Scott11,Reference MacIntyre, Venter and Kruger13) . Together, this indicates that the relationship between free or added sugars consumption and nutrient intake or overall dietary quality cannot be characterised by a single pattern and may depend on population characteristics and dietary patterns as well as assessment approaches. Research on the association between the intake of free or added sugars and food and nutrient intake within Europe is limited, even scarcer within the Nordic countries and, to our knowledge, non-existent among Swedish adolescents.
Children and adolescents have been reported to have higher intakes of free and added sugars both globally(Reference Walton, Bell and Re16) and in Europe(Reference Azaïs-Braesco, Sluik and Maillot17) compared with adults. This elevated consumption is particularly concerning during these formative years, as it may not only impact direct nutritional adequacy but also contribute to the establishment of dietary patterns that often persist into adulthood. Food habits developed in childhood and adolescence may track over time(Reference Craigie, Lake and Kelly18–Reference Chong20), making these young years critical for establishing healthy eating behaviours. Understanding and addressing intakes of free and added sugars during this period in life are crucial for promoting long-term health and preventing diet-related chronic metabolic diseases.
In the Nordic countries, the definition used in sugars recommendations has recently shifted from added sugars to free sugars(Reference Blomhoff, Andersen and Arnesen3), with the fundamental difference in consumption being that sugars from fruit juice are included in the current definition of free sugars(Reference Wanselius, Lindroos and Moraeus21). Among Swedish adolescents, the median intake of free sugars is 12 E%(Reference Wanselius, Axelsson and Moraeus22), demonstrating that more than half of this population exceeds the recommended maximum of 10 E%(Reference Blomhoff, Andersen and Arnesen3). The main contributors to free sugars intakes are nutrient-poor foods, where sugars-sweetened beverages (SSB), sweets and chocolates contribute to about half of the adolescent intake(Reference Wanselius, Lindroos and Moraeus21). However, the impact of Swedish adolescents’ intake of free sugars on nutrient and food group intakes is at present unknown.
Despite dietary guidelines recommending a limited sugars intake, consumption remains high among adolescents in Sweden. Understanding the impact of free sugars on nutrient and food intake is essential for communicating appropriate health messages. The main objective of this study was to investigate associations between free sugars intake and nutrient intake, adherence to nutrient reference values, and food consumption in a nationally representative sample of Swedish adolescents. Additionally, analyses were conducted on added sugars intake to assess the impact of the different definitions.
Methods
Study design and population
This study utilised data from Riksmaten Adolescents 2016–2017, a cross-sectional dietary survey conducted by the Swedish Food Agency to assess dietary intake among adolescents in Sweden(Reference Moraeus, Warensjö Lemming and Koivisto Hursti23). The survey targeted a nationally representative sample of students in school years 5, 8 and 11, with mean ages of 12, 15 and 18 years, respectively. The sampling process, carried out by Statistics Sweden, involved a random selection of 619 schools stratified by geographic location, municipality type and school size to ensure national representativeness. Each school municipality was classified based on the Swedish Association of Local Authorities and Regions criteria(24). Out of 5145 adolescents initially invited, 3477 adolescents participated (68 %). A non-participation analysis showed that the sample may be considered representative of the population regarding the socio-economic background and school organisation(Reference Moraeus, Warensjö Lemming and Koivisto Hursti23). Data collection occurred class-wise, with approximately half of the students participating in each academic semester over the 2016–2017 school year. Trained personnel from the Swedish Food Agency visited the recruited classes during the first data collection day to instruct the adolescents on how to report their dietary intake in a web-based system and to collect anthropometric data. Height and weight were measured on-site using standardised equipment, with BMI status later determined according to International Obesity Task Force cutoffs(Reference Cole and Lobstein25). Additionally, both students and their legal guardians completed questionnaires covering background information. In the present study, 3099 participants with complete dietary data from two retrospective days of registration were included.
Dietary assessment
Dietary intake was assessed using a web-based dietary assessment tool, RiksmatenFlexDiet, a method based on the 24-h recall approach and biomarker validated for reliable estimates of energy, fruit, vegetable and whole grain intakes(Reference Lindroos, Petrelius Sipinen and Axelsson26). With RiksmatenFlexDiet, the participants reported their food and beverage intake using a customised food list tailored for Swedish adolescents, based on food items from the Swedish food composition database (version Riksmaten Adolescents 2016–2017). The Swedish food composition database is regularly updated to reflect foods currently available on the market. The food list included 778 foods, dishes and beverages with detailed nutritional information, including fortification, as present in commercially available products. Participants registered their food intake retrospectively on two non-consecutive days. The first day of recall was conducted during the school visit, while the second day of recall was randomly scheduled to occur 2–10 d later and could be completed from any location. Intake amounts were specified by using portion sizes, pieces, household measurements or portion pictures. Throughout the recall process, automatic reminders encouraged the adolescents to register often missed items like beverages and condiments, and after entering all foods, they reviewed their entries and responded to follow-up reminders about easily forgotten items. The registration of a single day’s intake typically took 15–30 min, depending on the participant’s age. Energy and nutrient calculations were performed automatically by the system based on the recorded food intake. Free and added sugars intake was calculated from total mono- and disaccharides following the systematic method described by Wanselius et al. (Reference Wanselius, Axelsson and Moraeus22). Free sugars were defined as sugars from all food items containing added sugars, as well as sugars naturally present in honey, syrups, fruit juice and fruit juice concentrate, according to the WHO definition(2). Added sugars were defined in line with the definitions from the Nordic Nutrition Recommendations (NNR) and European Food Safety Authority (EFSA)(Reference Turck and Bohn1,Reference Blomhoff, Andersen and Arnesen27) as sugars from all foods and beverages where refined sugars have been added during cooking or manufacturing, not including honey or unsweetened fruit or vegetable juices.
The dietary data collection spanned from September to May, with recall days distributed across the week to capture dietary variation. In addition, the adolescents completed non-quantitative food propensity questionnaires to complement the dietary recall and improve the accuracy of usual dietary intake estimations.
Data analysis
Dietary data obtained from the 3099 adolescents over 2 d formed the basis of this analysis. A broad selection of nutrients and food groups was included to provide a comprehensive assessment of dietary patterns associated with free sugars intake, allowing the characterisation of both macronutrient and micronutrient profiles across different levels of free sugars intake. To improve readability, some nutrients of less concern from a public health perspective are presented in the supplements.
Usual dietary intake was estimated for all nutrients and food groups with the multiple source method (MSM)(Reference Harttig, Haubrock and Knuppel28,Reference Haubrock, Nothlings and Volatier29) , with separate estimates conducted for each combined sex and school year. Total food intake from the food groups vegetables, fruits and berries, meat (red, poultry, processed) and fish and shellfish was categorised accordingly, with composite foods disaggregated into their individual ingredients for accurate assignment. The other food groups were based on the intake of foods at the food level. Food propensity questionnaire information collected per individual was used to classify participants as consumers or not for intakes of red meat, poultry and fish, which were included in the MSM transformation. For other dietary variables, all were assumed to be consumers. Throughout this paper, when referring to intakes, we specifically mean usual intakes.
Participants were categorised into quintiles (n ∼ 620 in each) based on their E% intake from free sugars to account for differences in energy intake/requirements. Pearson’s χ 2 test was performed to determine the differences in characteristics between the intake quintiles.
Logistic regression analysis was conducted using the first quintile of free sugars intake as the reference group to assess the OR for meeting nutrient reference values according to the NNR 2023(Reference Blomhoff, Andersen and Arnesen3) with each incremental increase in the quintile of free sugars intake (E%). Additionally, the p for trend (P trend) in OR was calculated using logistic regression across the quintiles of free sugars intake. For illustrative purposes, participants were also divided into deciles based on their free sugars intake to visualise compliance with nutrient requirements and recommendations across the intake spectrum. Micronutrient intakes were compared with reference values from the NNR 2023(Reference Blomhoff, Andersen and Arnesen3) using age- and sex-specific values for a selection of micronutrients: ten vitamins and seven minerals. In all possible cases, the average requirement (AR) was used as the reference measure. For micronutrients without established AR, the provisional AR in the NNR 2023 was used as the reference. Intake of macronutrients was compared with recommended intake levels from the NNR 2023. Participants in school year 5 were assigned reference values for the ages of 11–12 years, those in school year 8 were assigned values for the ages of 14–15 years and those in school year 11 were assigned values for the ages of 17–18 years. In instances where two reference values were available for a given age range, the lower value was used.
To assess trends between free sugars intake and nutrient and food group intake across sugars intake quintiles, linear associations were tested for with linear regression by treating the median free sugars value of each quintile as a continuous variable in the model. The regression analyses were controlled for sex and school year. As intake distributions are skewed, intakes are expressed in medians (p50) and interquartile ranges (p25–p75). Because free sugars intake is expressed as a percentage of total energy intake (E%), nutrient and food group intakes are presented both per day and per unit of energy (per MJ) to capture both total intake and overall dietary composition.
Sensitivity analyses were performed, accounting for potential misreporting of energy intake. Energy intake plausibility was assessed using the methods of Goldberg and Black(Reference Goldberg, Black and Jebb30,Reference Black31) . The plausibility of estimated energy intake (from the dietary assessment) was evaluated using the ratio of estimated energy intake to estimated total energy expenditure, with a CI set to ±1 sd, as described in(Reference Warensjö Lemming, Moraeus and Petrelius Sipinen32). Participants’ estimated energy intake was classified as either under-reported, plausible or over-reported based on these criteria and is here referred to as energy reporting status. Sensitivity analyses were performed in two ways: first, by including energy reporting status as a covariate in the regression analyses to control for potential biases, and second, by rerunning the analyses only including participants with plausible energy intakes.
Additionally, all analyses were repeated using quintiles based on added sugars intake, with full results presented in the supplements.
All statistical analyses were performed with Stata version 18.0. (StataCorp. 2023. Stata Statistical Software: Release 18. StataCorp LLC). A P-value of < 0·05 was considered statistically significant.
Results
Participant characteristics
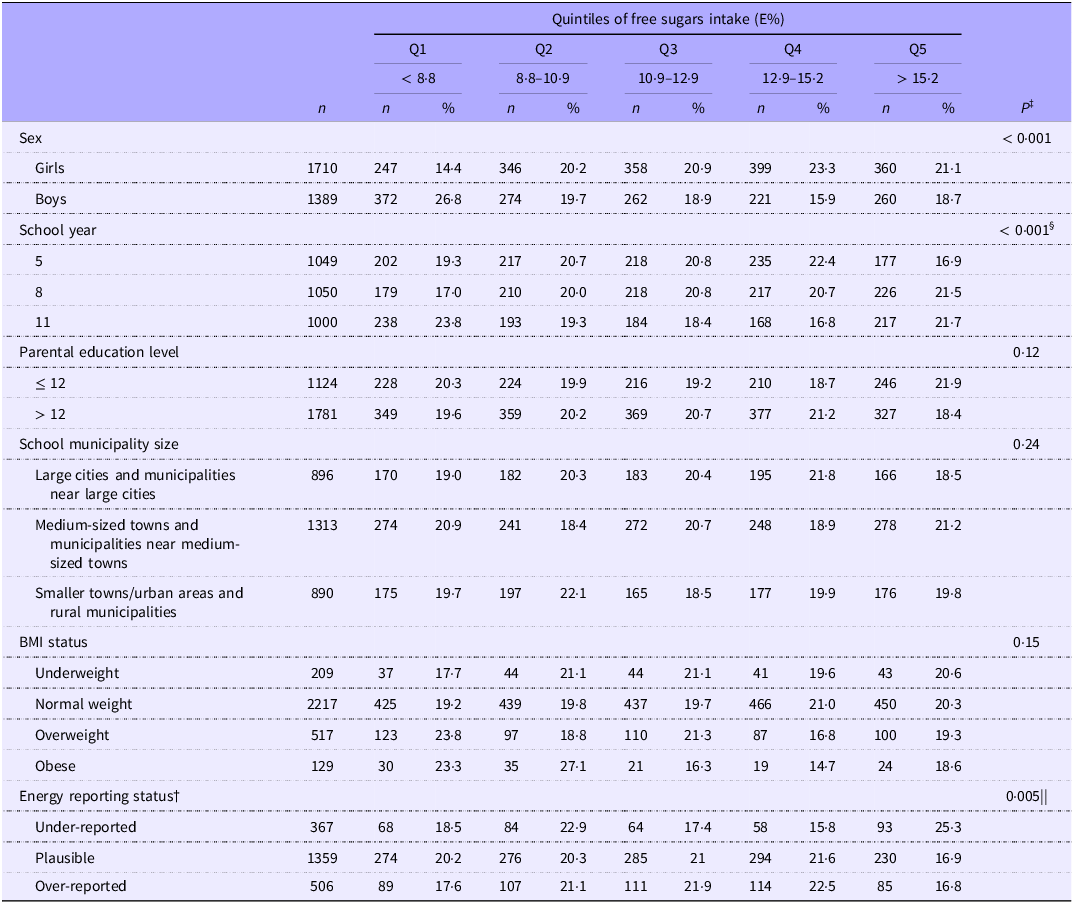
Participant characteristics by level of free sugars intake quintiles are presented in Table 1. The 3099 adolescents included in this study were almost equally distributed across the school years, with slight underrepresentation in school year 11, and 55 % were girls. Of the total sample, 72 % had a normal weight, and 61 % had parents with an education level > 12 years. Most adolescents resided in medium-sized towns and municipalities near medium-sized towns (42 %), compared with 29 % in both larger cities and smaller towns/rural areas. The majority had reported their energy intake as plausible relative to their estimated energy expenditure (61 %); however, many had missing values for this comparison due to incomplete assessment of physical activity.
Sample characteristics (n 3099*) by quintiles of usual free sugars intake, n (%)

E%, percent of total energy intake, estimated with the multiple source method.
* Missing participants were observed in the following groups: parental education level (194 participants, 6 %), BMI status (27 participants, 1 %) and energy reporting status (867 participants, 28 %). These discrepancies were due to missing questionnaires, missing body height or weight data and incomplete accelerometer measurements. Missing participation was comparable across quintiles; however, energy reporting status had slightly more missing in the 1st and 5th quintiles.
† Energy intake was considered implausible if the energy intake to expenditure ratio was outside ±1 sd.
‡ Assessed using Pearson’s χ 2 test.
§ Post hoc analysis with Bonferroni correction revealed significant differences between school year 5 and 11 and school year 8 and 11 across the free sugars intake quintiles.
|| Post hoc analysis with Bonferroni correction revealed significant differences between under-reporters and plausible reporters and between under-reporters and over-reporters across the free sugars intake quintiles.
Among all adolescents, 69 % had free sugars intake exceeding 10 E%. Participants in the lowest quintile had a free sugars intake of < 8·8 E%, those in the middle quintile had an intake of 10·9–12·9 E% and those in the highest quintile had an intake of > 15·2 E% (Table 1). There were significant differences in the distribution of participants across quintiles of free sugars intake between girls and boys (P < 0·001), between school years (P < 0·001) and between energy reporting status (P = 0·005). Boys had lower free sugars intake than girls relative to total energy intake and were overrepresented in the lowest quintile of free sugars intake, while girls were more prevalent in the higher quintiles. The distribution across quintiles differed by school year. Among adolescents in the oldest school year, a larger proportion were classified in the lowest quintile (23·8 %), fewer were observed in the middle quintiles (16·8–19·3 %) and a higher proportion again appeared in the highest quintile (21·7 %). In contrast, adolescents in the younger school years showed a more even distribution across quintiles, with proportions ranging from 16·9 to 22·4 % in the youngest group and from 17·0 to 21·5 % in school year 8. Adolescents who under-reported their energy intake relative to their estimated energy expenditure were distributed differently across intake quintiles compared with plausible reporters and over-reporters. A higher proportion of under-reporters was observed in the highest quintile (25·3 % of those who under-reported their energy intake) compared with 16·9 % of plausible reporters and 16·8 % of over-reporters. No differences in the distribution of participants across the quintiles of free sugars intake were observed regarding the parental education level, school municipality size or BMI status.
Associations between free sugars intake and adherence to nutrient reference values
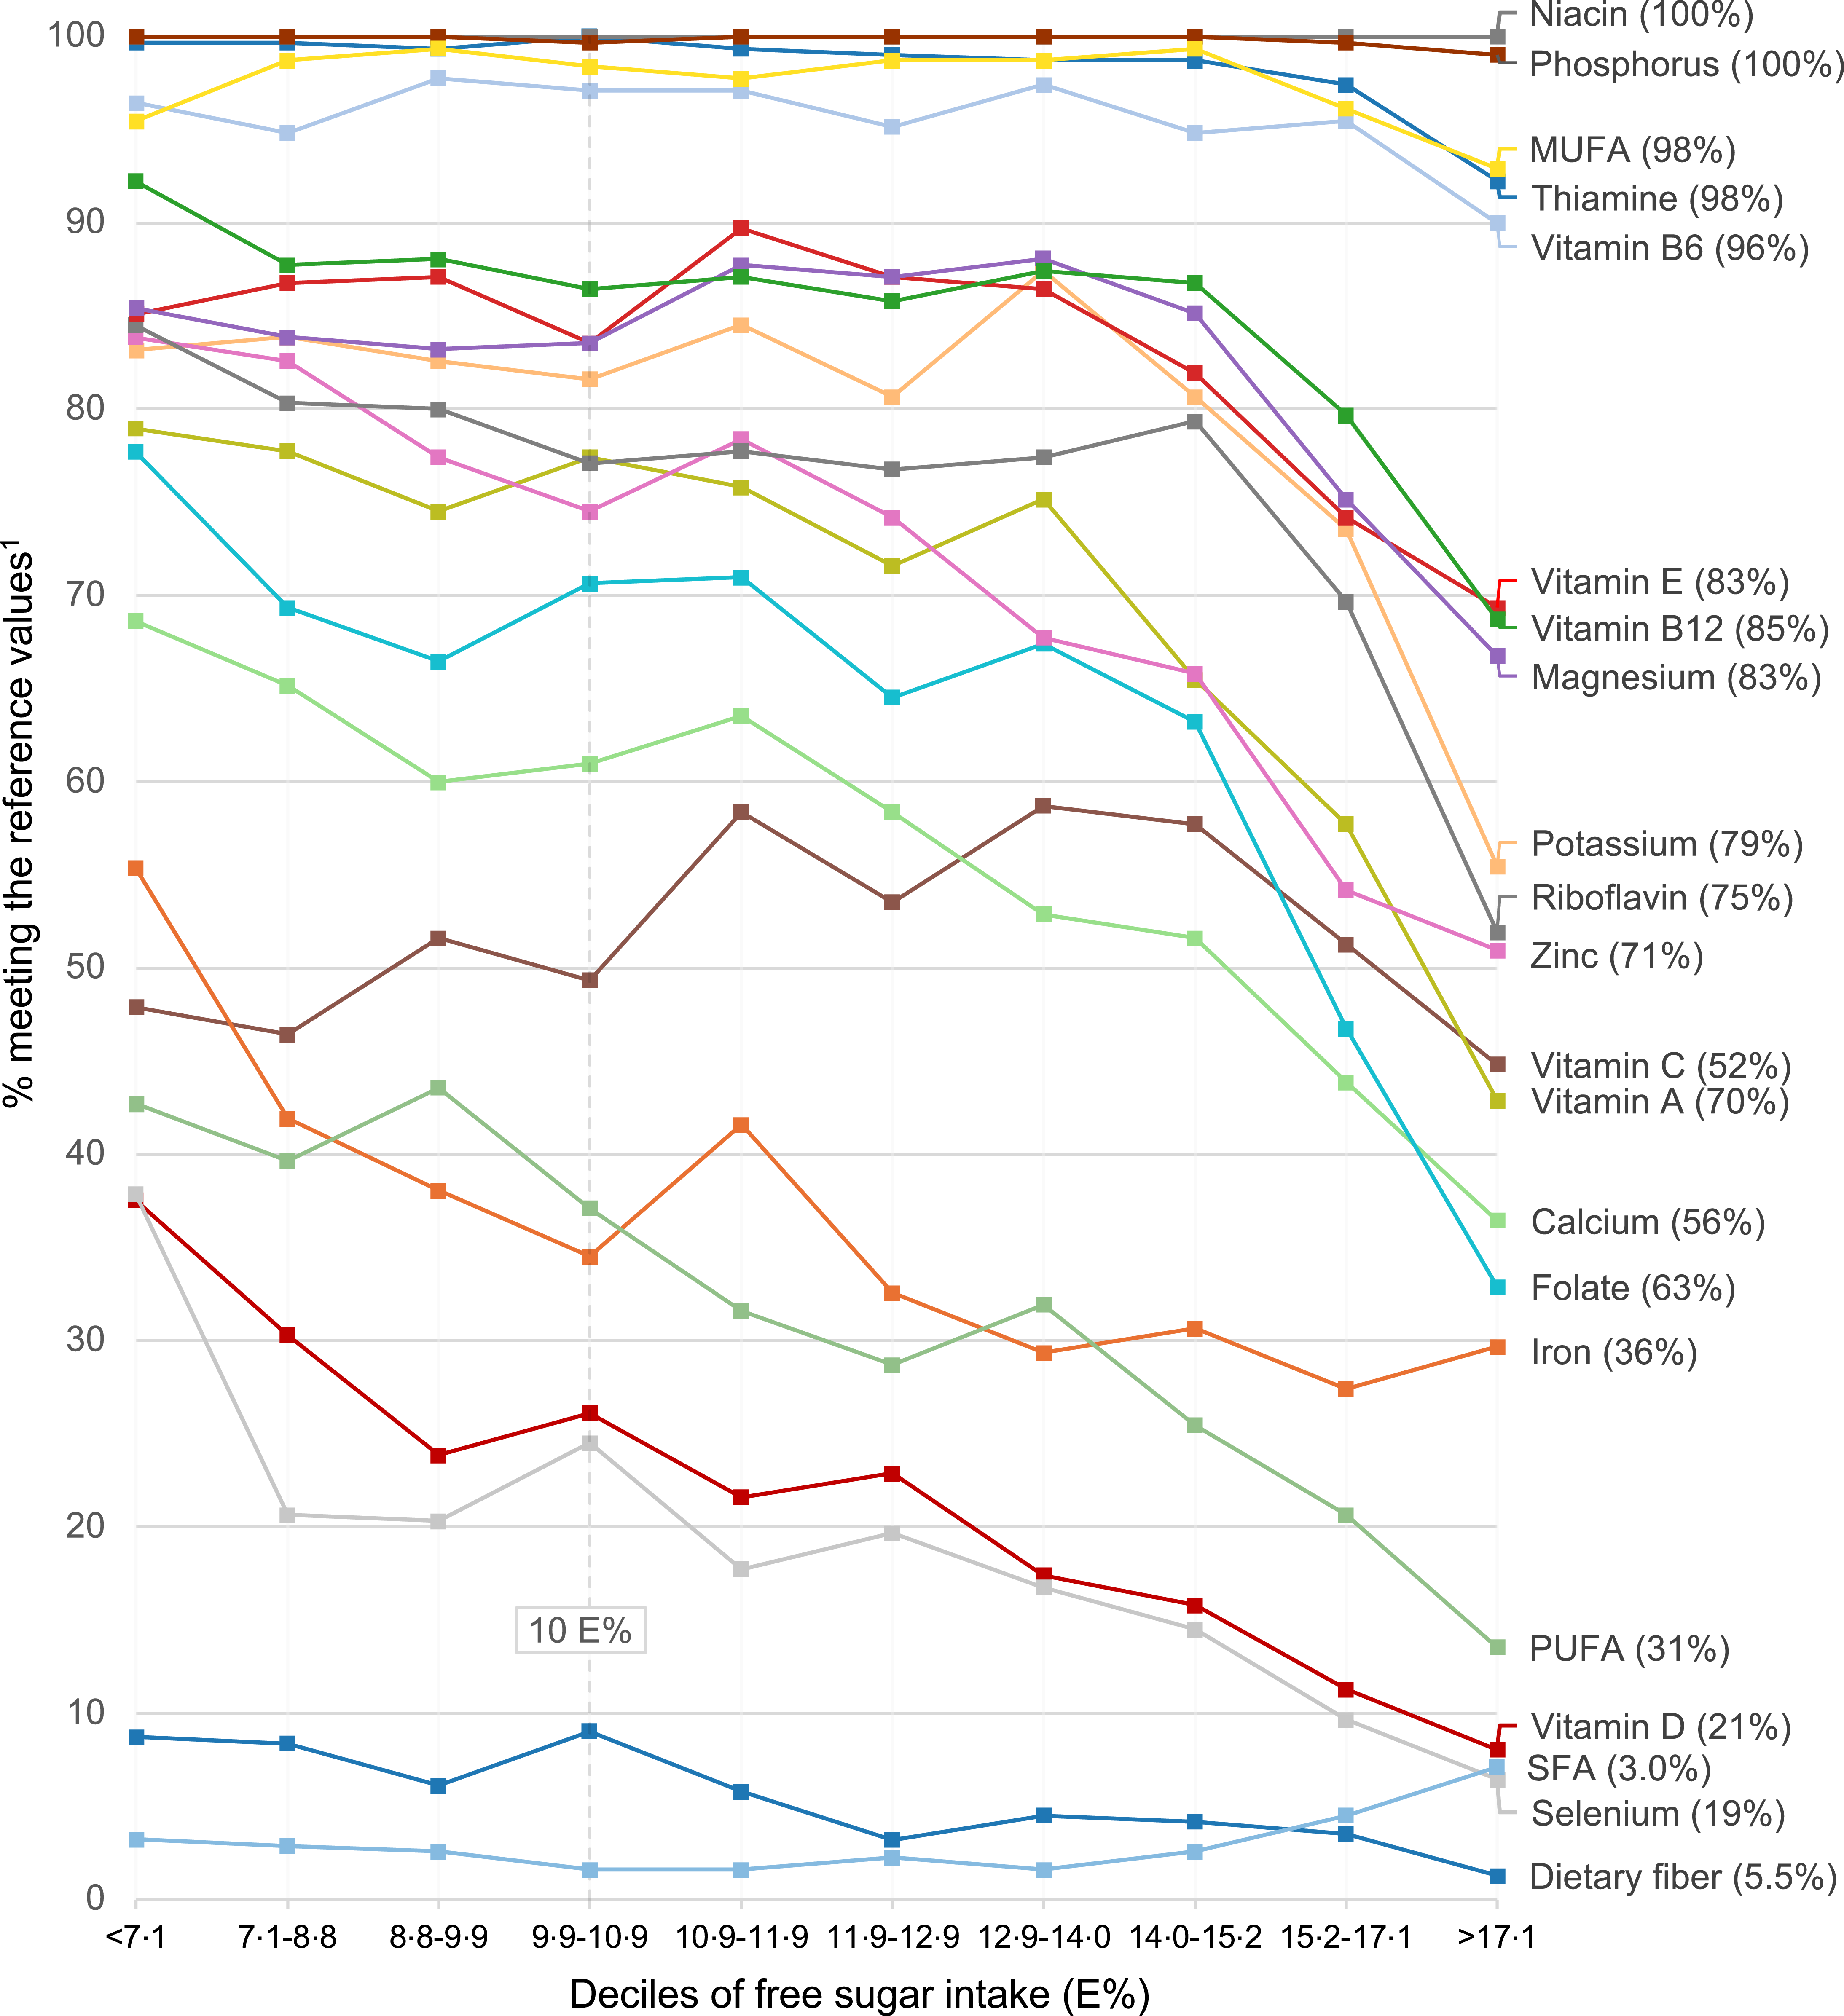
The proportion of adolescents meeting NNR 2023 AR or nutrient recommendations by deciles of free sugars intake is illustrated in Figure 1, and the OR and 95 % CI for meeting these nutrient reference values across the free sugars intake quintiles are presented in Table 2.
Percent of adolescents meeting macronutrient recommendations or average micronutrient requirements across deciles of usual free sugars intake. Numbers in parentheses are proportions of all adolescents meeting nutrient reference values. E%, percent of total energy intake. Intakes above age- and sex-specific average requirement values were considered as meeting the average requirements for folate, riboflavin, vitamin A, vitamin B6, vitamin C, Ca, Fe, thiamine and Zn and above age- and sex-specific provisional average requirement values for vitamin B12, vitamin E, potassium, Mg and Se. Intakes between 5 and 10 E% for PUFA, < 10 E% for SFA and above 3 g/MJ for dietary fibre were considered as meeting recommendations. All reference values were retrieved from the Nordic Nutrition Recommendations 2023. Usual intakes were estimated with the multiple source method.

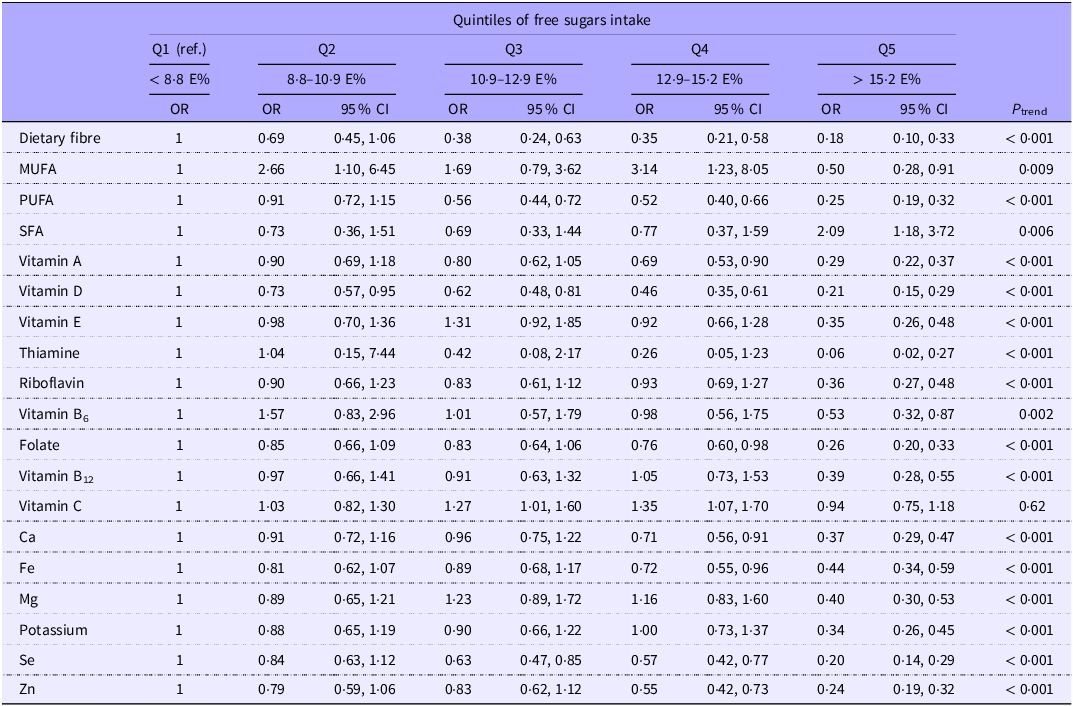
OR of meeting macronutrient recommendations or average micronutrient requirements according to quintiles of usual free sugars intake

E%, percent of total energy intake.
OR (95 % CI) and P trend were assessed with logistic regression, adjusting for sex and school year. Intakes above age- and sex-specific average requirement values were considered as meeting the average requirements for folate, riboflavin, vitamin A, vitamin B6, vitamin C, Ca, Fe, thiamine and Zn and above age- and sex-specific provisional average requirement values for vitamin B12, vitamin E, potassium, Mg and Se. Intakes between 5 and 10 E% for PUFA, < 10 E% for SFA and above 3 g/MJ for dietary fibre were considered as meeting recommendations. All reference values were retrieved from the Nordic Nutrition Recommendations 2023. Niacin and phosphorus were excluded from this analysis due to insufficient variation as 99–100 % of the sample met requirements. Usual intakes were estimated with the multiple source method.
Using the first free sugars intake quintile (Q1) as the reference group, adolescents in the highest consumption group (Q5; > 15·2 E% from free sugars) had significantly lower OR of meeting the dietary reference values for all but two of the nutrients tested. The exception was SFA, where adolescents in Q5 had significantly higher OR of meeting recommendations than in Q1 (i.e. lowered intakes), and vitamin C, where no significant differences between these quintiles were observed. Many nutrients also reached statistical significance at the fourth quintile (> 12·9 E%); however, few differences were observed between the first intake quintile and the second and third quintiles. Notably, for vitamin D, Se, dietary fibre and PUFA, significant differences were observed from the third quintile and onward.
As free sugars intake increased, the likelihood of meeting the nutrient reference values generally decreased, revealing a clear trend of reduced nutrient adequacy associated with higher levels of free sugars intake. All nutrients tested showed inverse trends across the intake quintiles (P trend < 0·01), except for no significant trend for vitamin C, and again, the intake of SFA showed a reversed relationship (P trend < 0·01).
The associations between free sugars intake and dietary reference values remained when adjusting for energy reporting status in the logistic regression model (n 2231). However, when the analysis was restricted to plausible reporters only, the previously observed intake trends between free sugars and vitamin B6, SFA and MUFA were no longer significant (n 1359) (data not shown). It should be noted that there was little variation in the proportion of adolescents meeting the nutrient reference values across the free sugars intake quintiles for these three nutrients, with the majority meeting AR for vitamin B6 (96 %) and recommendations for MUFA (98 %) and a minority conforming to recommendations on SFA intake (3 %).
Associations between free sugars intake and energy and nutrient intake
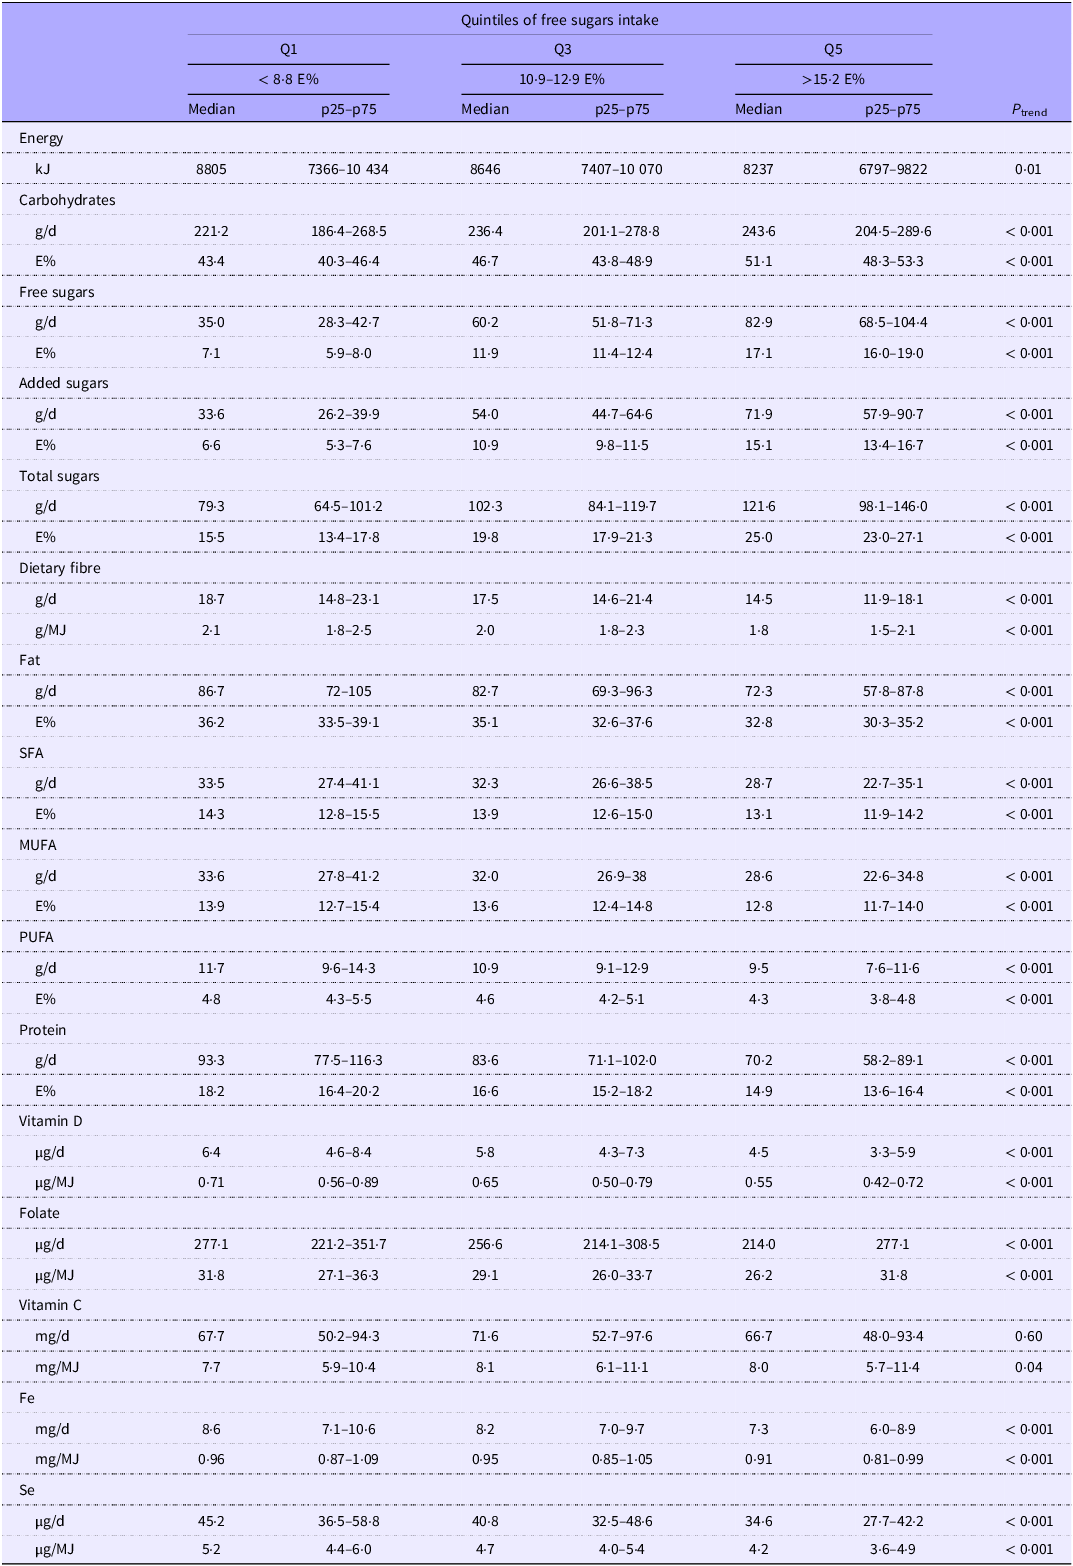
The median intake, along with the 25th and 75th percentiles (p25 and p75), of energy and nutrients according to the intake quintiles of free sugars is shown in Table 3 (full results in online Supplementary Table 1), expressed in absolute intakes per day and relative to energy intake.
Intake of energy and nutrients in Swedish adolescents (n 3099) across quintiles of usual free sugars intake, expressed as usual intake per day and relative to energy intake

E%, percent of total energy intake.
P trend across the free sugars intake quintiles were tested with linear regression using the free sugars intake quintile medians as continuous independent variables. The analysis was adjusted for sex and school year. Usual intakes were estimated with the multiple source method. Quintiles 2 and 4 are not presented as associations were largely linear across quintiles.
Free sugars intake was negatively associated with energy intake (P trend = 0·012) and with most macronutrients, including protein, fats and dietary fibre (P trend < 0·001) but positively associated with total carbohydrates (P trend < 0·001). Inverse linear associations were also observed between free sugars intake and micronutrient intakes (P trend < 0·001), except for vitamin C, where no association was seen in absolute intake, and a positive association was seen relative to energy intake (P trend = 0·038). Apart from vitamin C, the highest median micronutrient intakes were consistently observed among adolescents in the lowest quintile of free sugars consumption, regarding both absolute intakes and intakes relative to energy intake. This highlights a marked reduction in micronutrient intake relative to energy intake among those with the highest consumption of free sugars. The associations between nutrient intake and free sugars intake remained when adjusting for energy reporting status in the regression model (n 2231) and when the analysis was restricted to plausible reporters only (n 1359); however, the previously observed negative trend in energy intake was not evident among plausible energy reporters only (data not shown).
Associations between free sugars intake and food intake
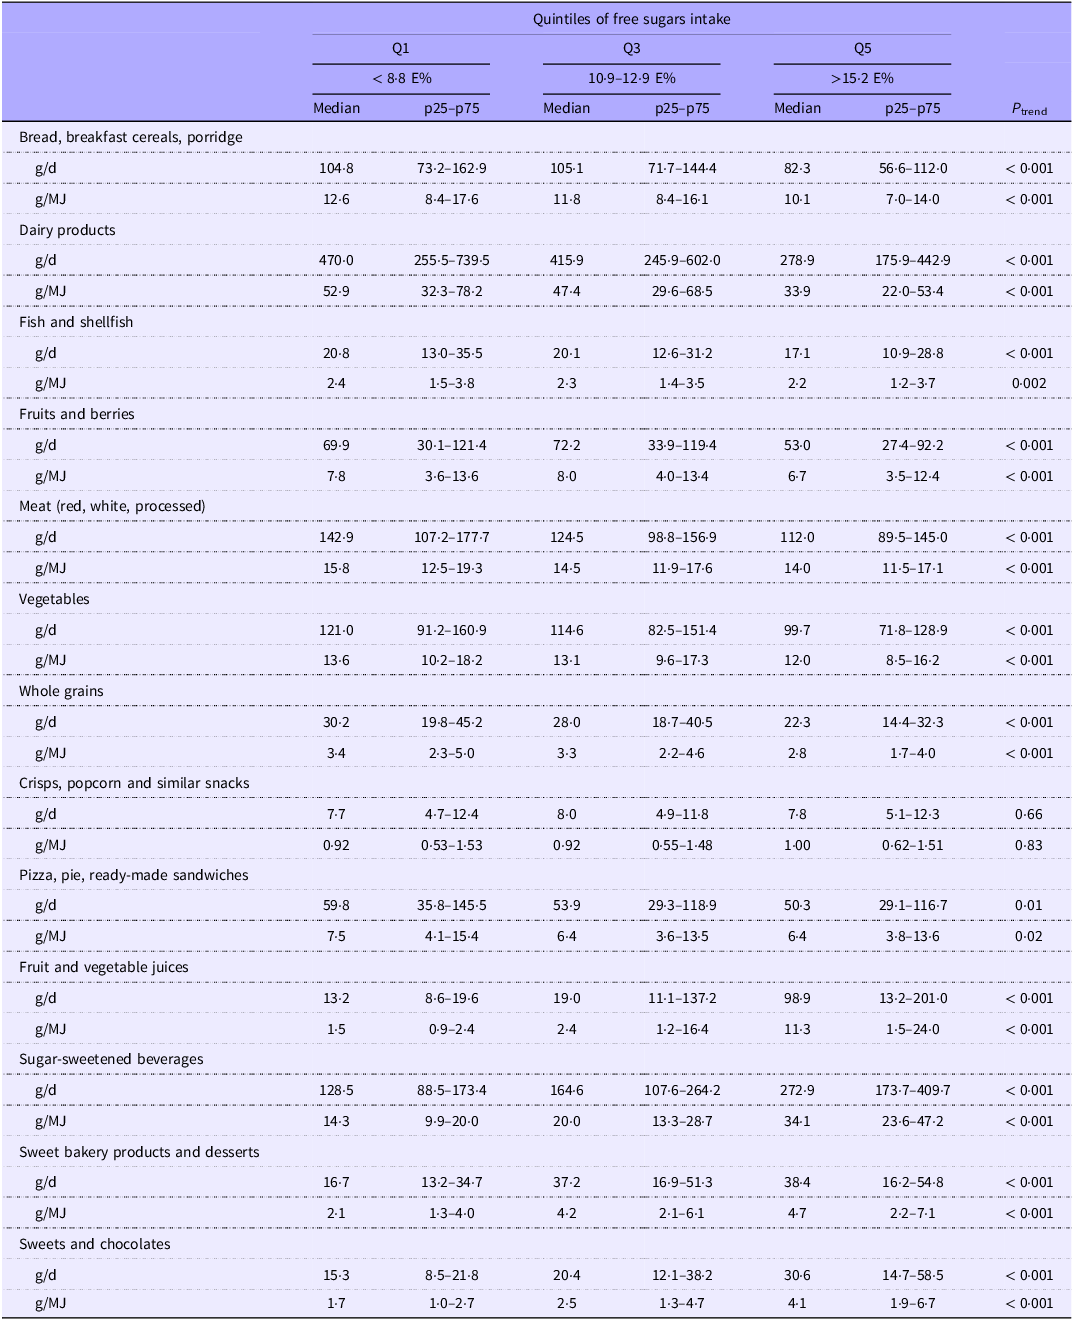
The median intake, along with p25 and p75 of food groups, according to the intake quintiles of free sugars, is shown in Table 4, expressed in absolute intakes per day and relative to the energy intake. A higher intake of free sugars was negatively associated with foods included in analysis that typically are considered as part of a healthy diverse diet; vegetables, fruits and berries, fish and shellfish, meat, whole grains, dairy products, bread, breakfast cereals and porridge (P trend < 0·001). Also, increasing free sugars intake was associated with lower intake of pizza, pie and ready-made sandwiches (P trend < 0·05); however, there were no significant relationships with crisps, popcorn and similar snacks. Generally, intakes of these food groups were highest in adolescents within the lowest quintile of free sugars intake. Conversely, as expected, the sugars-rich food groups included had positive relationships with free sugars intake, with fruit and vegetable juices, SSB, sweets and chocolates and sweet bakery products and desserts showing positive associations (P trend < 0·001). The associations between food intake and free sugars intake remained when adjusting for energy reporting status in the regression model (n 2231) and when the analysis was restricted to plausible reporters only (n 1359) (data not shown).
Food group intake in Swedish adolescents (n 3099) across quintiles of usual free sugars intake, expressed as usual intake per day and relative to energy intake

E%, percent of total energy intake.
P trend across the free sugars intake quintiles were tested with linear regression using the free sugars intake quintile medians as continuous independent variables. The analysis was adjusted for sex and school year. Usual intakes were estimated with the multiple source method. Quintiles 2 and 4 are not presented as associations were largely linear across quintiles.
Added sugars intake associations
Overall trends in associations with nutrient reference values, nutrient intake and food consumption across quintiles of added sugars followed patterns similar to those observed for free sugars, with the exceptions of vitamin C and juice intakes. Consistent with our findings for free sugars intake, there were lower odds of meeting dietary reference values for many nutrients from the 4th intake quintile of added sugars (> 11·3 E%) as compared with the 1st quintile (< 7·6 E%) (online Supplementary Table 2). However, significant differences in vitamin D, Se, dietary fibre, PUFA and vitamin C were observed at lower intake levels, with the association for vitamin C being specific for added sugars intake. The proportion of adolescents meeting dietary reference values is presented across deciles of added sugars intake in online Supplementary Figure 1. While the trends observed were generally like those for free sugars intake (except for vitamin C), a visual inspection suggests that fewer adolescents in the lowest decile of added sugars intake met dietary reference values than in the second decile for some nutrients, a pattern not observed with free sugars intake.
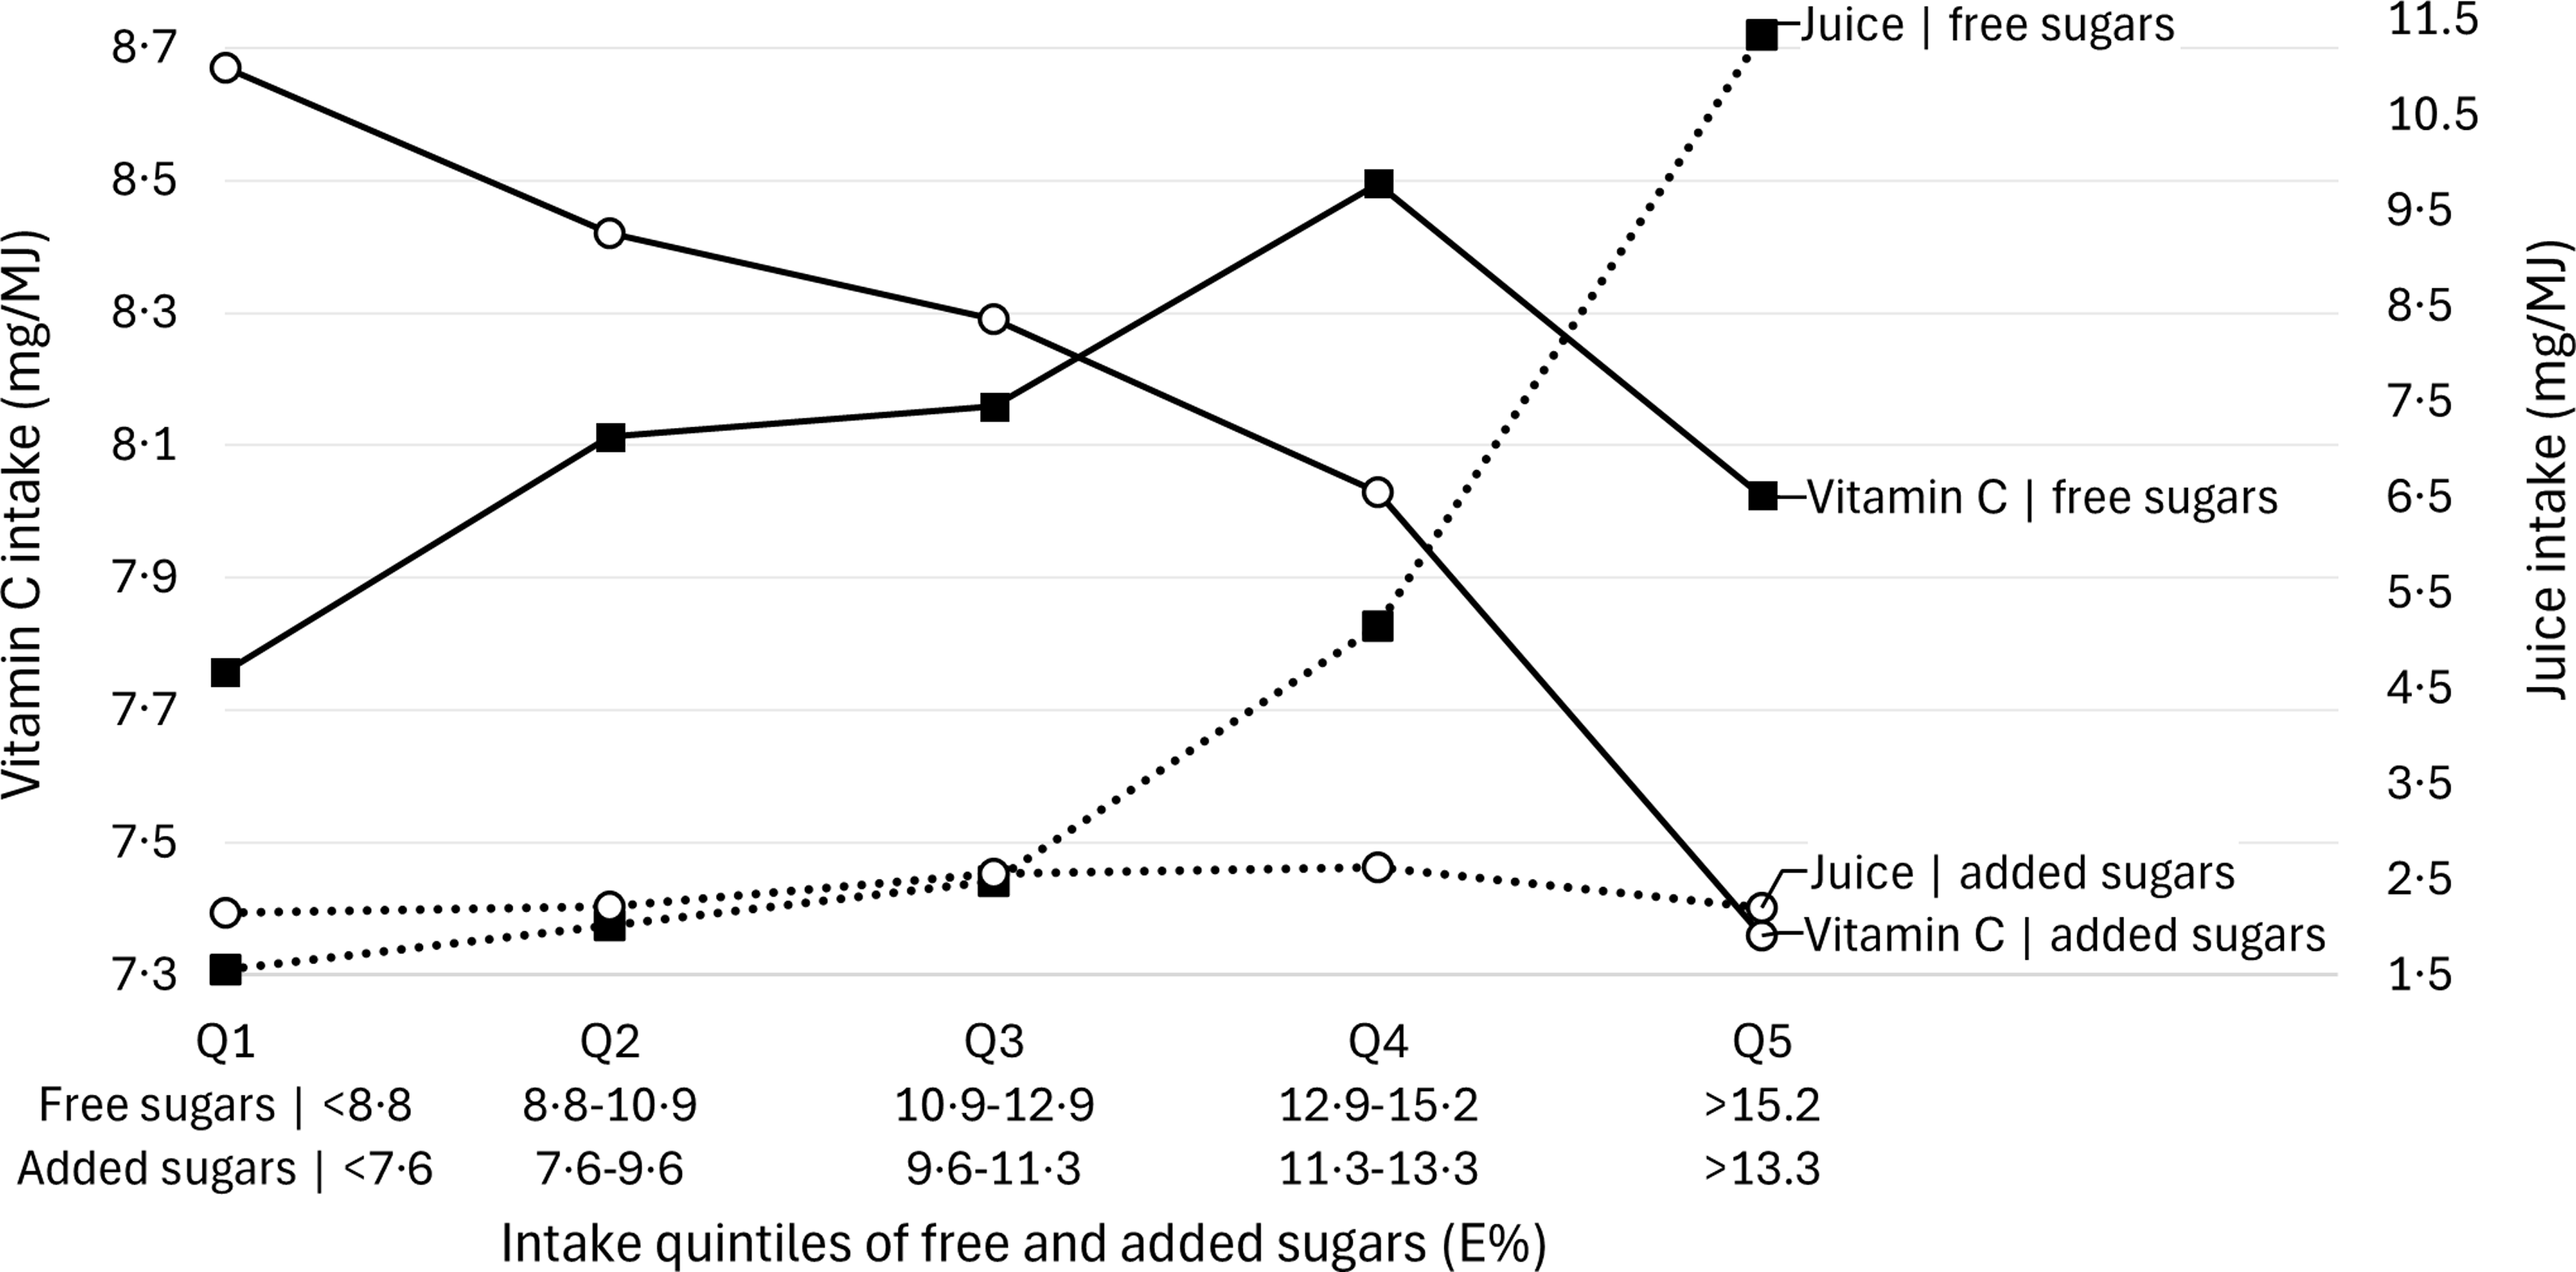
Figure 2 presents median intakes of vitamin C and juice (mg/MJ) across quintiles of free and added sugars intake (E%). Vitamin C intake decreased in parallel with increasing added sugars intake, showing a significant negative trend in both absolute and relative terms (P trend < 0·001; online Supplementary Table 3), whereas a different pattern was seen across free sugars intake quintiles (Table 2). A small, yet statistically significant, negative trend in juice intake was also observed with increasing added sugars consumption, both in absolute and relative values (P trend < 0·05; online Supplementary Table 4), where for free sugars intake, a positive association was observed (Table 2). However, the inverse associations between added sugars and juice intake were not present in the sensitivity analyses (data not shown).
Median intake of vitamin C and juice in Swedish adolescents (n 3099) across quintiles of free and added sugars intake (median intake per quintile). Intakes are expressed as usual intakes relative to energy intake. E%, percent of total energy intake. Usual intakes were estimated with the multiple source method.

Discussion
To the best of our knowledge, this is the first study to investigate the association between free or added sugars intake and energy, nutrient and food intake in Swedish adolescents. Higher free and added sugars intake was linked to progressively less favourable nutrient and food intakes, including reduced nutrient adequacy, in this nationally representative sample. While many of these patterns are broadly consistent with previous research, the strength and direction of associations vary across populations. By providing data specific to Swedish adolescents, this study contributes to the understanding of free and added sugars intake during adolescence.
Dietary guidelines recommend limiting free or added sugars intake partly to support overall energy intake(2,4,5) ; however, the present study does not support the idea that higher free or added sugars intake is associated with higher energy intake. Interestingly, a negative trend between free sugars intake and energy intake in the full sample was observed, although the magnitude was relatively small. This finding contradicts results from earlier studies in adolescents, where mostly positive relationships between free or added sugars intake and energy intake have been observed(Reference Gibson, Francis and Newens12,Reference Fujiwara, Okada and Okada33–Reference Lai, Hutchinson and Evans35) , which could reflect different dietary patterns within different populations. However, when restricting our analysis to adolescents classified as plausible reporters, this trend was not significant. This suggests that the observed relationship between free sugars intake and lower energy intake may be influenced by misreporting of energy intake. In our sample, potential under-reporting of energy was more prevalent among adolescents who had the highest free sugars intake, which could partially explain the initial significance. By restricting the analysis to plausible reporters, we reduced the variability caused by potential misreporting, and we also reduced the sample size and potentially the statistical power to detect a significant trend. The loss of significance in the sensitivity analysis on plausible energy reporters only may indicate that the negative trend observed in the full sample is driven by reporting bias rather than a true association, which highlights the importance of accounting for energy misreporting when analysing dietary data to avoid misleading conclusions.
Our findings of overall negative associations between free sugars intake and micronutrient intake align with studies on free or added sugars conducted in other adolescent populations, including in Norway(Reference Øverby, Lillegaard and Johansson36), the UK(Reference Gibson, Francis and Newens12), Australia(Reference Wong, Mok and Ahmad15,Reference Louie and Tapsell34) and Japan(Reference Fujiwara, Okada and Okada33), as well as in Swedish adults(Reference González-Padilla, A Dias and Ramne9). In our sample, considerably impaired nutrient adequacy was observed at the 4th free sugars intake quintile (12·9–15·2 E%), with significantly lower odds of meeting dietary reference values for about half of the analysed nutrients compared with Q1. Dramatic declines in adolescents falling below the AR were observed for many micronutrients between the 4th and 5th free sugars intake quintile (> 15·2 E%), with significantly fewer adolescents meeting reference values for almost all nutrients. These findings correspond to previous research demonstrating that intakes of free and added sugars are negatively associated with nutrient adequacy in adolescents, though thresholds and ranges for these effects may vary across different populations and dietary contexts. Nutrient inadequacy has been linked to free sugars intake exceeding 13 E% in UK children and adolescents(Reference Gibson, Francis and Newens12), 20 E% in Australian children and adolescents(Reference Wong, Mok and Ahmad15) and added sugars intake exceeding 19 E% in American children and adolescents(Reference Fulgoni, Gaine and Scott11). Similarly, micronutrient intakes have been shown to be lowest among adolescents consuming > 20 E% from non-milk extrinsic sugars (the UK term similar to free sugars), as well as among those with the lowest intakes (≤ 5 E%), with optimal intakes observed between 10 and 15 E%(Reference Lai, Hutchinson and Evans35). Conforming to these results, we also observed substantially reduced nutrient adequacy at free sugars intake in mid-to-high consumers, starting from 12·9 E%. However, we did not observe compromised intakes among adolescents in the lowest quintile of free sugars intake. In fact, those consuming the least generally had the highest nutrient intakes and highest proportions meeting reference values. While there were substantial declines in the number of adolescents meeting nutrient reference values from the 4th free sugars intake quintile (> 12·9 E%) in our sample, critical nutrients within the diet of Swedish adolescents such as dietary fibre, PUFA, vitamin D and Se were markedly reduced even in lower quintiles. These findings suggest that an intake of no more than 10 E% from free sugars, or potentially lower, would be beneficial to support nutrient adequacy in Swedish adolescents.
In the present study, higher intakes of free sugars were associated with a shift in overall dietary patterns, characterised by lower consumption of nutrient-dense foods and higher consumption of sugars-rich processed foods, such as SSB, as well as greater intake of fruit juice. The increased consumption of juice, an important source of free sugars among Swedish adolescents(Reference Wanselius, Lindroos and Moraeus21), led to the maintained or improved intake of vitamin C, with similar results observed in other adolescent populations(Reference Wong, Mok and Ahmad15,Reference Fujiwara, Okada and Okada33,Reference Lai, Hutchinson and Evans35) . The inverse association between free or added sugars and diet quality in adolescents has also been observed in other populations, although studies have approached the topic differently and with varying degrees of detail. For example, with increasing free or added sugars intake, intakes of less vegetables(Reference Wong, Mok and Ahmad15,Reference Fujiwara, Okada and Okada33,Reference Louie and Tapsell34,Reference Øverby, Lillegaard and Johansson36) , fruits(Reference Wong, Mok and Ahmad15,Reference Louie and Tapsell34,Reference Øverby, Lillegaard and Johansson36) , dairy products(Reference Wong, Mok and Ahmad15,Reference Fujiwara, Okada and Okada33) , fish(Reference Wong, Mok and Ahmad15,Reference Louie and Tapsell34) and meat(Reference Wong, Mok and Ahmad15,Reference Fujiwara, Okada and Okada33,Reference Louie and Tapsell34) have been reported, as well as obvious increased intakes of sugars-rich discretionary foods, such as SSB and confectionery(Reference Wong, Mok and Ahmad15,Reference Fujiwara, Okada and Okada33–Reference Lai, Hutchinson and Evans35) . Furthermore, positive associations between free or added sugars and other high-energy, low-nutrient foods have been observed in adolescents in other populations. For example, associations between increased free sugars intake and increased consumption of savoury snacks such as crisps(Reference Wong, Mok and Ahmad15,Reference Louie and Tapsell34,Reference Lai, Hutchinson and Evans35) have been observed. Additionally, positive associations have been observed with discretionary cereal-based products such as pizza and other fast foods(Reference Wong, Mok and Ahmad15,Reference Louie and Tapsell34) . In contrast, our results did not confirm these relationships. We found a negative relationship between free sugars intake and the fast-food category, including pizza, pie and ready-made sandwiches, and no relationship between crisps and snacks. Again, this could indicate potential differences in dietary patterns between adolescent populations, unless this is a result of food categorisation differences across studies. In our study, it appears that sugars-rich foods are commonly consumed together or on their own by those who have the highest intakes of free sugars rather than with different types of fast foods and savoury snacks.
All significant food group intake trends for the food groups were significant for both absolute intake and intake relative to energy consumption. This indicates that as free sugars intake increases in Swedish adolescents, there is a shift towards less nutrient-dense foods. This shift suggests that higher free sugars intakes are associated with dietary patterns with less nutritious food options. Thus, the excess free sugars intake among Swedish adolescents does not appear to be eaten in addition to other healthy foods but rather displaces healthy foods. The improved intake levels relative to recommendations for SFA, along with the impaired intake of unsaturated fatty acids, can, just as the overall decreases in other micronutrient levels, be explained by the same factor. As the free sugars intake increases in the diet of Swedish adolescents, the adolescents are replacing these everyday foods with high sugars-containing low-nutrient foods, which are also lower in fats.
There is some criticism on the focus of limiting free sugars, as negative health effects appear to be source-dependent rather than attributable to free sugars in general. Ultra-processed beverages such as SSB appear to contribute to poorer diet quality and adverse health outcomes, whereas sugars from whole fruits or fruit juices may have different, and in some cases neutral or beneficial, associations due to accompanying nutrients and bioactive compounds(Reference Yan, Chan and Louie37,Reference Gonzalez38) . Furthermore, it has been argued that free sugars should not be studied in isolation, as it can be misleading, as it fails to capture the full picture of dietary impacts(Reference Emmett39). Research mostly associates intakes of high free and added sugars with poor health outcomes and dietary intakes, but it most often overlooks the different sources, which can have distinct effects. For example, one recent study in American children and adolescents found varying relationships between micronutrient adequacy and different beverage sources of free sugars(Reference Ricciuto, Fulgoni and Gaine40). In our study, we only investigated associations with intakes of free and added sugars, but it would be valuable to explore various sources of sugars to gain deeper insights. From our analyses, we can observe a potential displacement effect; however, exploring associations with sugars sources could help clarify whether certain sources more clearly contribute to poor diet quality or nutrient inadequacy. Especially considering that some sources may be eaten together with more nutrient-dense foods. Focusing on the sources of free or added sugars, rather than the total intake, could provide valuable insights into improving diet quality and refining public health strategies.
This study has not only several strengths but also some inherent limitations. A key strength lies in the use of a systematic procedure to estimate the free and added sugars content in food items(Reference Wanselius, Axelsson and Moraeus22), which were sourced from the Swedish food composition database, with high-precision nutrient values. The use of an up-to-date food list, specifically designed for this study population, ensures a high degree of accuracy and relevance in the dietary data. Another strength is the use of a nationally representative sample of Swedish adolescents(Reference Moraeus, Warensjö Lemming and Koivisto Hursti23), which allows for broader generalisation of our findings to this population. Furthermore, it is relatively uncommon to have this detailed dietary data in larger studies, which makes this study particularly valuable, as few previous studies have examined the associations between free or added sugars intake and broader patterns of both nutrient and food consumption in adolescents. A further methodological strength was the application of the MSM(Reference Harttig, Haubrock and Knuppel28,Reference Haubrock, Nothlings and Volatier29) , which was used to transform the 2-d dietary intake data into estimated usual intake. This statistical approach accounts for day-to-day variability in individual dietary intake, improving the reliability and validity of intake estimates at both the individual and population levels. Additionally, data collection across a representative distribution of weekdays and weekend days improves the representativeness of the observed dietary patterns and minimises biases related to specific eating habits during weekdays or weekends. Despite these strengths, this study has limitations that must be considered. As with other dietary studies, misreporting of food intake is a probable issue, influenced by factors such as participants’ unawareness of their food intake and social desirability bias. These reporting errors may introduce biases into the findings and potentially lead to an under-reporting of foods high in sugars. However, it is noteworthy that a relatively high proportion of participants in this study reported plausible energy intakes, and group-level energy reporting was found to be highly plausible(Reference Warensjö Lemming, Moraeus and Petrelius Sipinen32). As the dietary assessment was performed during the school semesters, the lack of inclusion of summer months might have further excluded the consumption of seasonal foods. Dietary intake in this study was assessed using two 24-h recalls per participant, which is not enough to capture individual usual intake due to natural variations in eating habits; however, the MSM transformation enabled usual intakes. Nevertheless, even with this adjustment, some differences between the reported and actual usual intake at the individual level may still exist, as the MSM cannot eliminate all variability. Despite this limitation, the primary focus of this study on trends on the population level reduces sensitivity to these individual-level inaccuracies, and it is unlikely that these limitations have significantly impacted the overall findings or conclusions of this study.
Furthermore, a challenge lies in comparing our findings with those from other studies. Variations in the definitions and measurements of dietary sugars (e.g. total, added or free sugars) and diet quality, often assessed using different dietary indexes and nutrient scores, complicate cross-study comparisons. Additionally, differences in dietary assessment methods, ranging from one-day to multiple-day dietary records, FFQ and estimates of usual intake, further add to the complexity. As food habits are not static and may vary between populations and over time, it is crucial to study different populations as this can inform recommendations, identify risk groups and design population-specific interventions.
In conclusion, we observed inverse associations between free and added sugars intakes and overall nutrient intake, alongside gradually decreased intake of nutrient-dense foods with increasing free and added sugars intakes in a representative sample of Swedish adolescents. Nutrient adequacy was significantly compromised for many nutrients at intake levels above 12·9 E% for free sugars and 11·3 E% for added sugars. However, for critical nutrients within the diet of Swedish adolescents (e.g. vitamin D, Se, dietary fibre and PUFA), lower odds of meeting dietary reference values were observed even at lower intake levels of free and added sugars. Our results indicate that, with increasing intakes of free and added sugars, Swedish adolescents appear to displace nutrient-dense foods with sugars-rich foods. These results imply a difference in dietary patterns between those with lower v. higher intakes of free and added sugars.
Supplementary material
For supplementary material/s referred to in this article, please visit https://doi.org/10.1017/S000711452610693X.
Acknowledgements
We wish to thank all the study participants, participating schools and our colleagues who worked in all parts of the data collection in Riksmaten Adolescents 2016–2017.
No funding was received to assist with the preparation of this manuscript.
Conceptualisation, J. W.; data curation, A. K. L., L. M. and E. P.; formal analysis, J. W.; methodology, J. W., A. K. L., L. M., E. P., C. B. and C. L.; supervision, C. B. and C. L.; visualisation, J. W.; writing – original draft, J. W.; writing – review & editing, J. W., A. K. L., L. M., E. P., C. B. and C. L.
All authors read and approved the final version of the manuscript.
The authors have no relevant financial or non-financial interests to disclose.
The Riksmaten Adolescents 2016–2017 survey adhered to the principles outlined in the Declaration of Helsinki, and all procedures involving research participants were approved by the Regional Ethical Review Board of Uppsala (registration no. 2015/190). Participants and their legal guardians were informed about the study one month before it commenced and were free to withdraw at any time without providing a reason. Informed consent, either written or verbal, was obtained from all participants.


 Open access