


Since the appearance of opinion polls in the United States, various theories have been put forth to explain voting patterns. From social and psychological theories of voting (Campbell et al., Reference Campbell, Converse, Miller and Stokes1960; Lazarsfeld et al., Reference Lazarsfeld, Berelson and Gaudet1944) to spatial models (Downs, Reference Downs1957), competing approaches have tried to not only predict, but also explain why voters vote the way they do. However, over the last decades, sociological explanations of voting have been widely challenged. The relevance of the relationship between social cleavages and party systems has been revisited, and many scholars have questioned the—once robust—effects of social structure on political cleavages (Dalton, Reference Dalton1984, Reference Dalton2000; Franklin, Reference Franklin1992). The pattern of stability in Western democracies has been replaced by a more volatile electorate, suggesting that more importance is now given to short-term forces factors such as issues, performance judgments, and candidate image in the balance of vote choice (Carmines and Stimson, Reference Carmines and Stimson1980; Clarke et al., Reference Clarke, Jenson, Leduc and Pammett1996; Clarke et al., Reference Clarke, Scotto and Kornberg2011).
In this context, scholars have suggested a shift from electoral decision-making based on social group and/or party cues to a more individualized and inwardly oriented style of political choice (Dalton and Wattenberg, Reference Dalton and Wattenberg1993; Dalton, Reference Dalton2000). Based on this evidence, socio-structural categories would only play a weak role in explaining contemporary politics. However, the decline of traditional cleavages in predicting political views does not necessarily mean that meaningful group membership for detecting political behaviour does not exist. Based on this premise, this article considers the role of lifestyle in delineating politically meaningful social groups. To do so, this analysis sets out to (1) measure lifestyle characteristics’ contribution when predicting vote choice among Quebecers; (2) explore how different lifestyle characteristics relate to voting intentions; (3) identify clusters of those lifestyle characteristics and examine to what extent they are homogeneous in terms of sociodemographic characteristics and political views. More generally, the present research aims to reassess the importance of social and psychological factors in explaining and understanding our political world.
The Transformation of Social Cleavages Politics
One of the most acknowledged stabilizing factors of party systems has been the strong impact of social characteristics on voting. This was established early by Lazarsfeld et al.’s (Reference Lazarsfeld, Berelson and Gaudet1944) famous assertion that that “a person thinks, politically, as he is, socially” (Reference Lazarsfeld, Berelson and Gaudet1944: 27). Since then, the relationship between social cleavages and party systems has been a pivotal question for political comparativists (Bartolini and Mair, Reference Bartolini and Mair1990; Lipset and Rokkan, Reference Lipset, Rokkan, Lipset and Rokkan1967). For decades, electoral behaviour researchers have illustrated how these historically rooted societal differences—predominantly class, religious denomination, and territory—have molded groups of individuals with shared interests, which in turn are reflected in party loyalties and electoral support. Such dynamics have been explored both in the United States and elsewhere (Campbell et al., Reference Campbell, Converse, Miller and Stokes1960; Gidengil et al., Reference Gidengil, Nevitte, Blais, Everitt and Fournier2012; Lijphart, Reference Lijphart1979). In Canada, attempts to test this model have yielded mixed results (see Kanji and Archer, Reference Kanji, Archer, Everitt and O’Neill2002), including the enduring importance of regional, national and religious cleavages, and the corresponding weakness of class cleavages (Gidengil, Reference Gidengil1992; Lijphart, Reference Lijphart1979; Meisel, Reference Meisel1963). For example, class voting has been described as virtually non-existent in Canada, or as heavily conditioned by variables such as region or province (Gidengil, Reference Gidengil1989; Johnston et al., Reference Johnston, Blais, Brady and Crête1992). Overall, in most Western democracies, a few traditional group memberships were useful in explaining a significant proportion of the variance in political choices.
In recent decades, the relevance of the cleavage-party nexus has been revisited, with many scholars concluding that voters’ choices in Western democracies are becoming less predictable on a cleavage basis. For instance, different cross-national and over-time analyses in Western industrialized nations found evidence of a decline in class voting from the 1980’s (Inglehart, Reference Inglehart1990; Lipset, Reference Lipset1981; Listhaug, Reference Listhaug, Strom and Svasand1997). In Canada, Henderson (Reference Henderson2003) suggests that interprovincial cleavages are either stable or declining. After a careful examination of the relationship between changing social structures and electoral behaviour within and across 14 Western democracies. Franklin (Reference Franklin1984, Reference Franklin1992) also provides empirical evidence for the progressive decline of the effects of social structures on individual partisanship. This transformation of traditional cleavages has been reinforced by scholars who argue that the once stable pattern has given way to a more volatile electorate, leading to less stable party systems (Dalton, Reference Dalton1984, Reference Dalton2000; Franklin, Reference Franklin1992).
However, recent research has also argued that while weak, class remains a tangible cleavage in Canadian politics (Andersen, Reference Andersen, De Graaf and Evans2013), with its impact comparable to factors like gender and age (Kay and Perrella, Reference Kay, Perrella, Kanji, Bilodeau and Scotto2012). For instance, while there is empirical evidence about the working-class’s preference for the New Democratic Party in past decades (e.g., Archer, Reference Archer1990; Andersen, Reference Andersen, De Graaf and Evans2013), more recent evidence indicates a shift from the NDP towards the Conservatives (Polacko et al., Reference Polacko, Kiss and Graefe2022; Westlake et al., Reference Westlake, Savage and Butovsky2025). Concurrently, contemporary studies have broadened their conceptualization of social class, moving beyond mere demographic or economic-based variables (Rubin et al., Reference Rubin, Denson, Kilpatrick, Matthews, Stehlik and Zyngier2014; Rubin et al., Reference Rubin, Evans, McGuffog, Jetten and Peters2019). This shift places a growing emphasis on education, especially higher education, as a key determinant of social class (Kraus and Stephen, Reference Kraus and Stephens2012; Snibbe and Markus, Reference Snibbe and Markus2005). In this context, an increasing number of scholars in electoral behaviour studies have favored a class-as-education approach, revealing significant political divides along these lines (Attewell, Reference Attewell2022; Berinsky and Lenz, Reference Berinsky and Lenz2011; Harris, Reference Harris2022). Furthermore, the traditional Catholics–Protestant cleavage, prominent between the 1950s and the 1980s (Lijphart, Reference Lijphart1979), has evolved to be based more on levels of religiosity (Wilkins-Laflamme, Reference Wilkins-Laflamme2016). Simultaneously, some scholars underscore the enduring importance of social cleavages along regional, gender or racial lines in the Canadian context (Besco, Reference Besco2015; Henderson, Reference Henderson2003; Johnston, Reference Johnston2017). These studies suggest a transformation in the impact of social membership on voting, rather than a simple decline.
While the attenuation of traditional social cleavages remains a topic of scholarly debate, one can easily observe that social groups, defined by traditional boundaries like social class or religion, have become more heterogeneous than they were a few decades ago—and this phenomenon applies to various Western democracies, including Canada. For example, there has been a notable shift to the right among voters who traditionally supported left-wing parties, evidenced by the support garnered by Jason Kenney’s United Conservative Party from Alberta’s working-class neighborhoods in 2019 and Doug Ford’s Progressive Conservative Party’s appeal to labor groups in Ontario since 2018. The historical alignment between Catholics and the Liberal Party has also weakened, and now depends more on the degree of religious devotion (Wilkins-Laflamme, Reference Wilkins-Laflamme2016). Alongside ongoing instances of electoral volatility (Clarke et al., Reference Clarke, Jenson, LeDuc and Pammett2019; Dalton, Reference Dalton2000), there is a shift toward new forms of group affiliations, like those based on consumer habits (Micheletti and Stolle, Reference Micheletti and Stolle2012). Amidst this debate, there is a growing consensus in the academic community that traditional structural cleavages may not hold the same predictive power as they once did, prompting researchers to explore alternative boundaries for delineating social groups.
Fragmented, But How Much?
These global transformations are generally explained by the rising of the post-industrial society and the fragmentation that followed. The increasing prosperity that accompanies post-modernism along with the enhancement of manual workers’ conditions and the enlargement of the middle class would have resulted in increasing individualization. Individuals therefore not only behave according to their class, but also according to their personal values and interests in life (Giddens, Reference Giddens1991; Inglehart and Baker, Reference Inglehart and Baker2000; Van Acker, Reference Van Acker2015). The prevalence of mass media and the diversification of communication channels also produced a cultural fragmentation, influencing pluralism of choice in different ways (Giddens, Reference Giddens1991; Meyrowitz, Reference Meyrowitz1986). Individuals are not restricted to uniform political agendas anymore and are consequently becoming less united around common political beliefs and behaviours (Prior, Reference Prior2007). This fragmented media landscape therefore favors the expression of sub-interests in which consumers seek out information that is in line with their preferences (Bishop, Reference Bishop2008; Festinger, Reference Festinger1957; Fischer and Mattson, Reference Fischer and Mattson2009; Freedman and Sears, Reference Freedman, Sears and Berkowitz1965).
Most scholars agree that significant value changes have taken place with the rising of advanced industrialism (Tilly, Reference Tilly1988). The most important features of these shifts concern an increasing preoccupation for aesthetic and intellectual needs or postmaterialist orientations (Inglehart, Reference Inglehart1990), transformed attitudes towards conformity, authority and religiosity (Flanagan, Reference Flanagan1982; Nevitte, Reference Nevitte1996) and an increasingly sophisticated electorate (Clark and Rempel, Reference Clark and Rempel1997; Dalton, Reference Dalton1988). In this context, people mobilize around single issues: new social issues such as gay rights or environmental concerns are becoming particularly salient (Miller and Levitin, Reference Miller and Levitin1976). These changes challenge the structuring effect of social groups on behaviour, and some researchers have come to favor an attitudinal approach rather than the traditional identity approach in order to study partisanship (Bartle and Bellucci, Reference Bartle and Bellucci2014).
However, the increasing individualism that accompanies post-modernity does not necessarily mean that individuals’ actions become completely detached from any kind of structural or social forces. If sociological explanations of voting have been criticized for being socially deterministic (Campbell et al., Reference Campbell, Converse, Miller and Stokes1960; Downs, Reference Downs1957; Key, Reference Key1966), the individualization thesis may also be misleading in overstating the unpredictable character of politics. Indeed, the erosion—or the transformation—of the old long-term influences on political choice does not entail that new cleavages are not politically significant (see Cavazza and Corbetta, Reference Cavazza and Corbetta2016 for a similar argument).
In this context, social scientists have devoted increasing attention to the possible creation of new social identities. For instance, as a response to those anticipating emotional isolation from social and cultural fragmentation, Pool (Reference Pool1990) predicted quite the opposite: “There will be operas and opera news available for opera lovers, microbiology information bases and exchanges available for microbiologists” (261). Similarly, some scholars argue that crisscrossing lines of division are now splitting the American society into multiplying “cultural subgroups,” or “lifestyle enclaves” (Bellah et al., Reference Bellah, Madsen, Sullivan, Swidler and Tipton1985; Bishop, Reference Bishop2008; Florida, Reference Florida2008). Cleavages still exist, but their contours need to be redefined. Yet recent studies provide empirical evidence for the clustering of population across different lifestyle dimensions, ranging from coffee to aesthetic preferences (Cavazza and Corbetta, Reference Cavazza and Corbetta2016; Della Posta et al., Reference Della Posta, Shi and Macy2015; Flemmen et al., Reference Flemmen, Jarness and Rosenlund2022; Mutz and Rao, Reference Mutz and Rao2018; Vyncke, Reference Vyncke2002). In this context, Fischer and Mattson (Reference Fischer and Mattson2009) conclude that “the number of new, discrete, and separated social worlds increased between 1970 and 2005” (446). Therefore, social contexts are still politically consequential—it may only be that boundaries of relevant subgroups need to be redefined. Additionally, in this highly fragmented world, it is plausible that the units of aggregation are smaller than they once were. Now, a critical task for social scientists is to uncover these boundaries and make sense of these new subgroups (see also Cavazza and Corbetta, Reference Cavazza and Corbetta2016).
Lifestyle and Vote Choice
Pierre Bourdieu was the first to theorize the political consequences of lifestyle over 40 years ago (Bourdieu, Reference Bourdieu1979). According to Bourdieu, people similarly situated within the class structure internalize a common practical comprehension of social space, or habitus. This habitus manifests through shared cultural inclinations, activities, and even political choices, such as voting, which together epitomize a lifestyle. Bourdieu argued that lifestyle is deeply entrenched in the socioeconomic conditions of one’s life. However, the growing complexity of individual lives and experiences has challenged Bourdieu’s structuralist viewpoint, with lifestyles now evolving into niches that diverge from traditional class boundaries (Cavazza and Corbetta, Reference Cavazza and Corbetta2016; Flemmen et al., Reference Flemmen, Jarness and Rosenlund2022; Ganzeboom, Reference Ganzeboom1998).
What, then, explains the relationship between lifestyle and political preferences? Until now, many studies have attempted to unravel this intricate relationship but often fall short in providing a compelling or comprehensive explanation. While the concept of “political consumerism” offers one framework for understanding the relationship between lifestyle characteristics and political preferences—this perspective basically suggests that individuals may deliberately purchase or boycott products as a form of political, social, or ethical expression (De Moor and Balsiger, Reference De Moor, Balsiger, Micheletti, Boström and Oosterveer2019; De Moor, Reference De Moor2017; Micheletti and Stolle, Reference Micheletti and Stolle2012; Mutz and Rao, Reference Mutz and Rao2018; Shah et al., Reference Shah, McLeod, Kim, Lee, Gotlieb, Ho and Breivik2007)—it does not fully encapsulate the breadth of lifestyle components. Political consumerism aptly explains deliberate choices such as using public transit to promote environmental sustainability or adopting a vegetarian diet for ethical reasons. Yet, many lifestyle characteristics, such as hobbies or material consumption, often reflect cultural or personal predilections that are not intended as political statements. Others use a psychological perspective, explaining that the food we eat, the music we listen to, or the car we drive reveal individual attributes such as a certain vision of the world (Hetherington and Weiler, Reference Hetherington and Weiler2018) or personality traits (Carney et al., Reference Carney, Jost, Gosling and Potter2008). But again, why should we be interested in lifestyles if it is nothing more than a proxy for something that we already measure in conventional surveys?
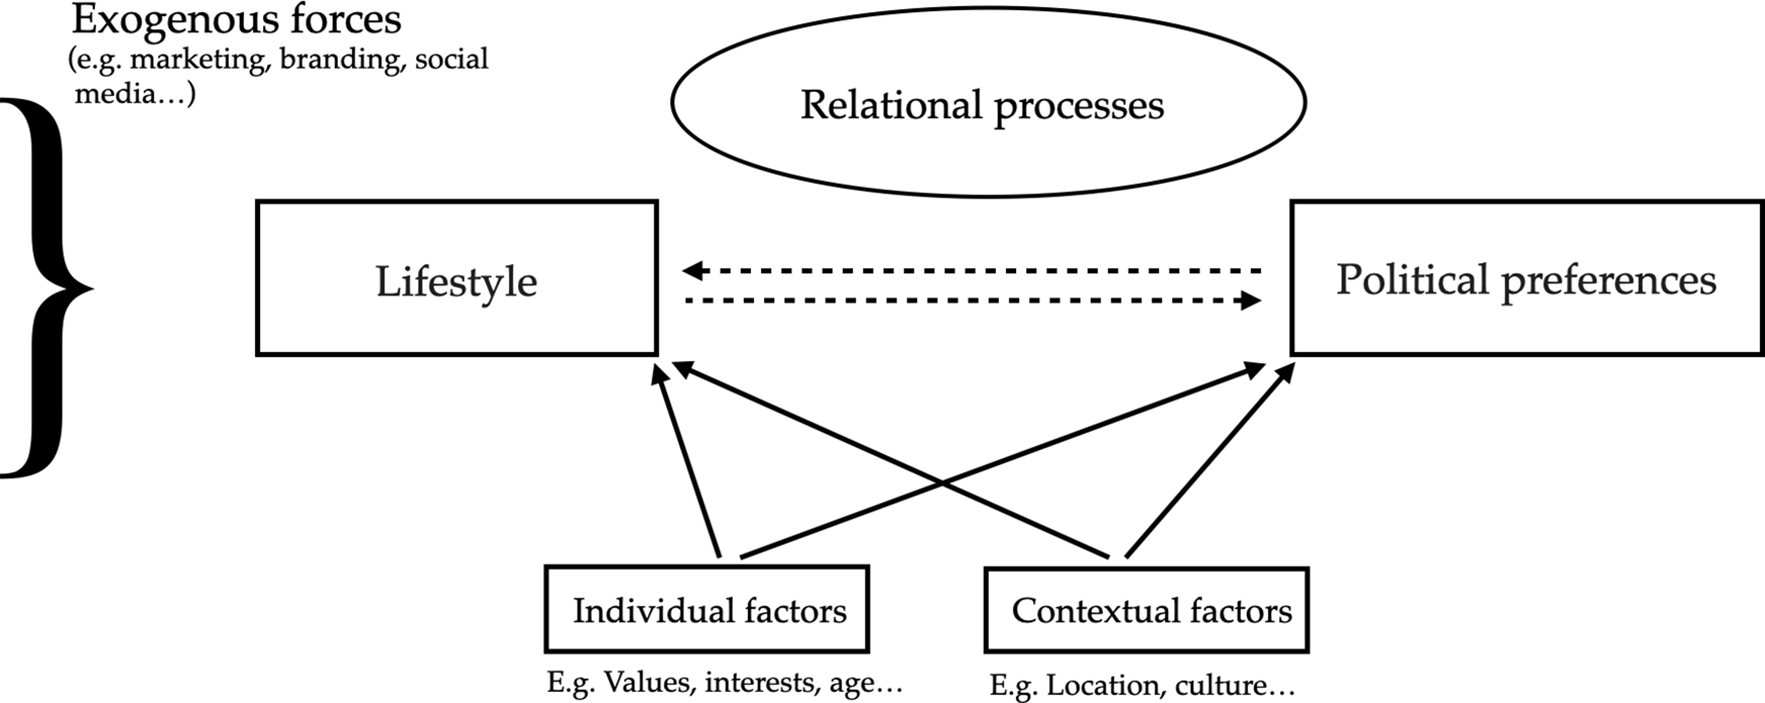
Humans tend to gravitate toward those who resemble them and share common characteristics such as personality traits (Laakasuo et al., Reference Laakasuo, Rotkirch, Van Duijn, Berg, Jokela, Tamas, Miettinen, Pearce and Dunbar2020), socio-demographic background, or other behavioral patterns—a phenomenon known as homophily (Kandel, Reference Kandel1978). This tendency extends to observable lifestyles, as individuals seek alignment with people and groups who share common attributes (Boer et al., Reference Boer, Fischer, Strack, Bond, Lo and Lam2011; Pezzuti and Leonhardt, Reference Pezzuti and Leonhardt2018; Wood, Reference Wood2005). This dynamic structures network ties of every type, including marriage, friendship, work and other types of relationships (McPherson et al., Reference McPherson, Smith-Lovin and Cook2001), resulting in the creation of networks that are highly homogeneous in many ways. In this sense, homophily plays a significant role in creating the “lifestyle enclaves” discussed above. This inclination then fosters an auto-reinforcing effect of social influence: by spending time with like-minded individuals, people develop a more or less common worldview, which in turn influences political beliefs. Although making a causal claim is beyond the purpose of this article, we argue that the explanation for the relationship between lifestyle and politics is relational (see Figure 1) (see also Della Posta et al., Reference Della Posta, Shi and Macy2015; Scaduto et al., Reference Scaduto, Negri and Decadri2025). That is, the link between lifestyle and politics lies less in individual traits than in the networks and affinities through which everyday habits acquire political meaning.
Conceptual Framework of Lifestyle and Political Preferences.

Method and Data
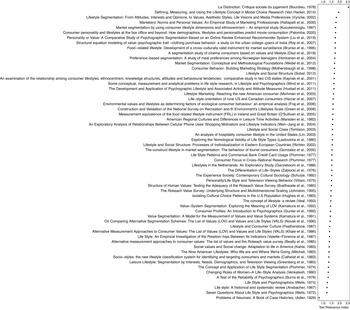
The concept of lifestyle defies any definitional and operational consensus. There is no agreement on what lifestyle actually means, and the concept is used on different levels of analysis (Jensen, Reference Jensen2007). If the term has a more restricted sociological meaning in reference to the distinctive style of life of certain status groups (Sobel, Reference Sobel2013; Weber, Reference Weber1968), within contemporary consumer culture the term also signifies individuality, self-expression and a stylistic self-consciousness (Featherstone, Reference Featherstone1987; Vyncke, Reference Vyncke2002). At the individual level, some understand lifestyle as the sum of health-related factors (e.g., alcohol consumption or exercise habits) (Bolt, Reference Bolt2002; Cockerham, Reference Cockerham2002). Other social scientists suggest that it refers to what you consume (Connolly and Prothero, Reference Connolly and Prothero2003; Poster, Reference Poster2004). One reason that might explain the lack of theoretical and empirical consistency surrounding the conceptualization of lifestyle is that most definitions come from the marketing literature, where the ultimate goal is not to explain lifestyle, but to retrieve market sectors (Van Acker, Reference Van Acker2015). To measure lifestyle, we began with a systematic review of the literature on lifestyle measurement. We then created a Text Relevance Index, which ranks the most important papers on the measurement of lifestyle based on publication year, number of citations, author(s), type of publication, and a relevance score assigned by the authors (see Figure 2 in the Appendix).Footnote 1 This systematic approach allows for the ranking of key sources on lifestyle measurement, helping to define the boundaries of lifestyle measurement.
We understand lifestyle as the result of both individual and contextual factors. On one side of the continuum, scholars such as Bourdieu (Reference Bourdieu1978) emphasize how social factors (e.g., class) shape lifestyle choices. On the other end of the continuum, others emphasize a more cultural or value-based “politics of life choices,” where agency is supplanting structural determinants as the primary source of self-identity and political preferences (Giddens, Reference Giddens1991). We suggest that the reality lies between both perspectives: lifestyle is the manifestation of personality within a given context (including both environmental and cultural components) and can only be inferred from observable manifestations such as leisure activities, consumption patterns or cultural practices. Finally—and it is precisely why lifestyle speaks about one’s political preference—lifestyle is a marker of one’s identity (Cavazza and Corbetta, Reference Cavazza and Corbetta2016; Giddens, Reference Giddens1991; Ouellet and Tremblay-Antoine, Reference Ouellet and Tremblay-Antoine2024). Consequently, lifestyle features should not be studied in isolation, since habits tend to cluster into coherent patterns (Giddens, Reference Giddens1991). That being said, we do not claim to measure lifestyle in its entirety. But following prior research, we treat lifestyle as an aggregation of observable behaviours—such as consumption habits, leisure activities, and cultural practices—that tend to cluster together (Cavazza and Corbetta, Reference Cavazza and Corbetta2016; Flemmen et al., Reference Flemmen, Jarness and Rosenlund2022; Vyncke, Reference Vyncke2002). Our operationalization relies on these indicators while acknowledging that the construct we are interested in cannot be captured exhaustively.
Assessing the added-value of lifestyle variables
The first part of the design uses Datagotchi’s unique and massive database. Datagotchi (www.datagotchi.com) is a data collection tool that predicts vote choice based on lifestyle characteristics. As the respondent answers questions about their lifestyle, a personalized avatar is created. For this study, we draw on the deployment of Datagotchi during the 2022 Quebec General Elections (n = 93,609), conducted in partnership with the Canadian Press. Datagotchi operates on a voluntary participation model, meaning respondents self-select into the dataset by visiting the website and completing the application on their own. Generalizing empirical research usually calls for a probability-based random sample, seen as the gold standard. Data from opt-in surveys like Datagotchi, however, pose unique challenges as they diverge from the traditional random sampling methods elucidated in classic survey theory (Couper, Reference Couper2008). However, contemporary methodologies provide ways to mitigate these biases (see Couper, Reference Couper2008; Schneider and Harknett, Reference Schneider and Harknett2022; Wang et al., Reference Wang, Rothschild, Goel and Gelman2015), and data have therefore been weighted according to census dataFootnote 2 to ensure that the sample’s composition reflects that of the actual population. Besides, post-stratified samples are increasingly considered as legitimate sources of data to examine public opinion (Gelman et al., Reference Gelman, Rothschild and Wang2017; Wang et al., Reference Wang, Rothschild, Goel and Gelman2015).
The Datagotchi survey was created based on existing measures from the Text Relevance Index. To assess the contribution of lifestyle—beyond conventional sociodemographic variables—in predicting Quebecers’ vote choice, the database was randomly split into a training set (75%) and a testing set (25%). The training set was used to train the model, while the testing set provided an independent evaluation of its predictive accuracy—i.e., the model’s ability to correctly classify individuals’ vote choice in the 2022 Quebec general election, and therefore to estimate the error rate on data not used in model training.
This procedure was applied to the models of each of the five main political parties: Coalition Avenir Québec (CAQ), Quebec Liberal Party (QLP), Parti Québécois (PQ), Québec Solidaire (QS) and Conservative Party of Quebec (CPQ). For each model, we extracted the accuracy level, which indicates the proportion of correct predictions of the model. This procedure was first applied with sociodemographic variables only, and then with both sociodemographic and lifestyle characteristics together.Footnote 3 The objective here is to determine to what extent the algorithm could accurately predict vote choice when based solely on sociodemographic variables, and then when based on both sociodemographic and lifestyle characteristics combined.
The use of lifestyle to delineate meaningful social groups
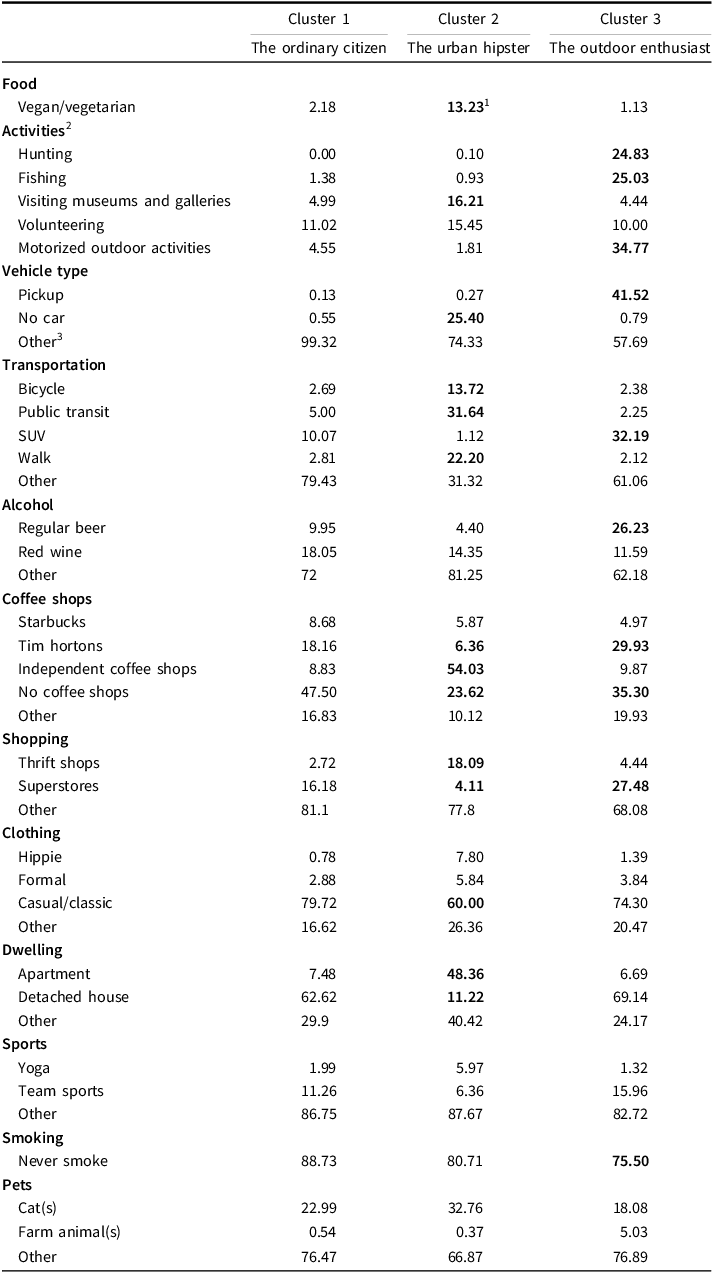
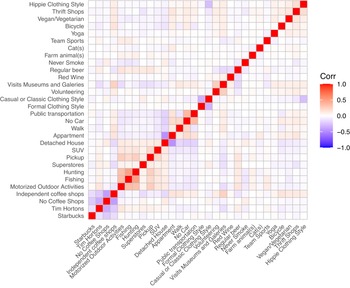
Having established the predictive contribution of lifestyle variables beyond sociodemographic variables, we next turn to their classificatory potential. In this second step, the aim is not prediction of vote choice, but to examine whether lifestyles themselves can be used to delineate coherent social groups within the electorate. To do so, we conducted a clustering analysis on a balanced subsample of 15,000 respondents (3000 per main party), ensuring equal representation of the main political parties. Indeed, given that the original dataset is skewed toward some parties (specifically CAQ and QS voters), using the entire sample would have made the resulting clusters disproportionately reflect the lifestyle of majority party voters rather than capturing meaningful distinctions across the electorate.Footnote 4 Clustering was conducted to identify a typology of lifestyle subgroups using K-means in R (cluster package), with a random set for reproducibility. We selected K-means over hierarchical clustering due to its computational efficiency with large datasets (n = 15,000) and its ability to handle binary lifestyle variables after normalization. For this segment, we retained lifestyle variables that displayed sufficient variation across respondents to reflect clear contrasts in everyday practices and preferences—for instance, differences in preferred vehicle type or leisure activities (see Table 1). Data have been normalized (i.e., adjusted to a scale ranging from 0 to 1) to ensure comparability across different lifestyle measures and a correlation matrixFootnote 5 was computed to identify relationships between lifestyle characteristics. The matrix is symmetric, and each element (i, j) corresponds to the Pearson correlation coefficient between i and j (see Figure 3 in the Appendix).
Description of each Cluster (Percentages for all Lifestyle Variables)

1 Percentages in bold indicate values that differ by at least 10 percentage points from Cluster 1 (The Ordinary Citizen), the reference category.
2 For activity variables, percentages represent the proportion of respondents who answered “Often” or “Very Often” (instead of either “Never,” “Almost Never,” or “Sometimes”).
3 “Other” represents the percentage of respondents in all remaining categories (see Table 3 in the Appendix for details) and these values are not bolded.
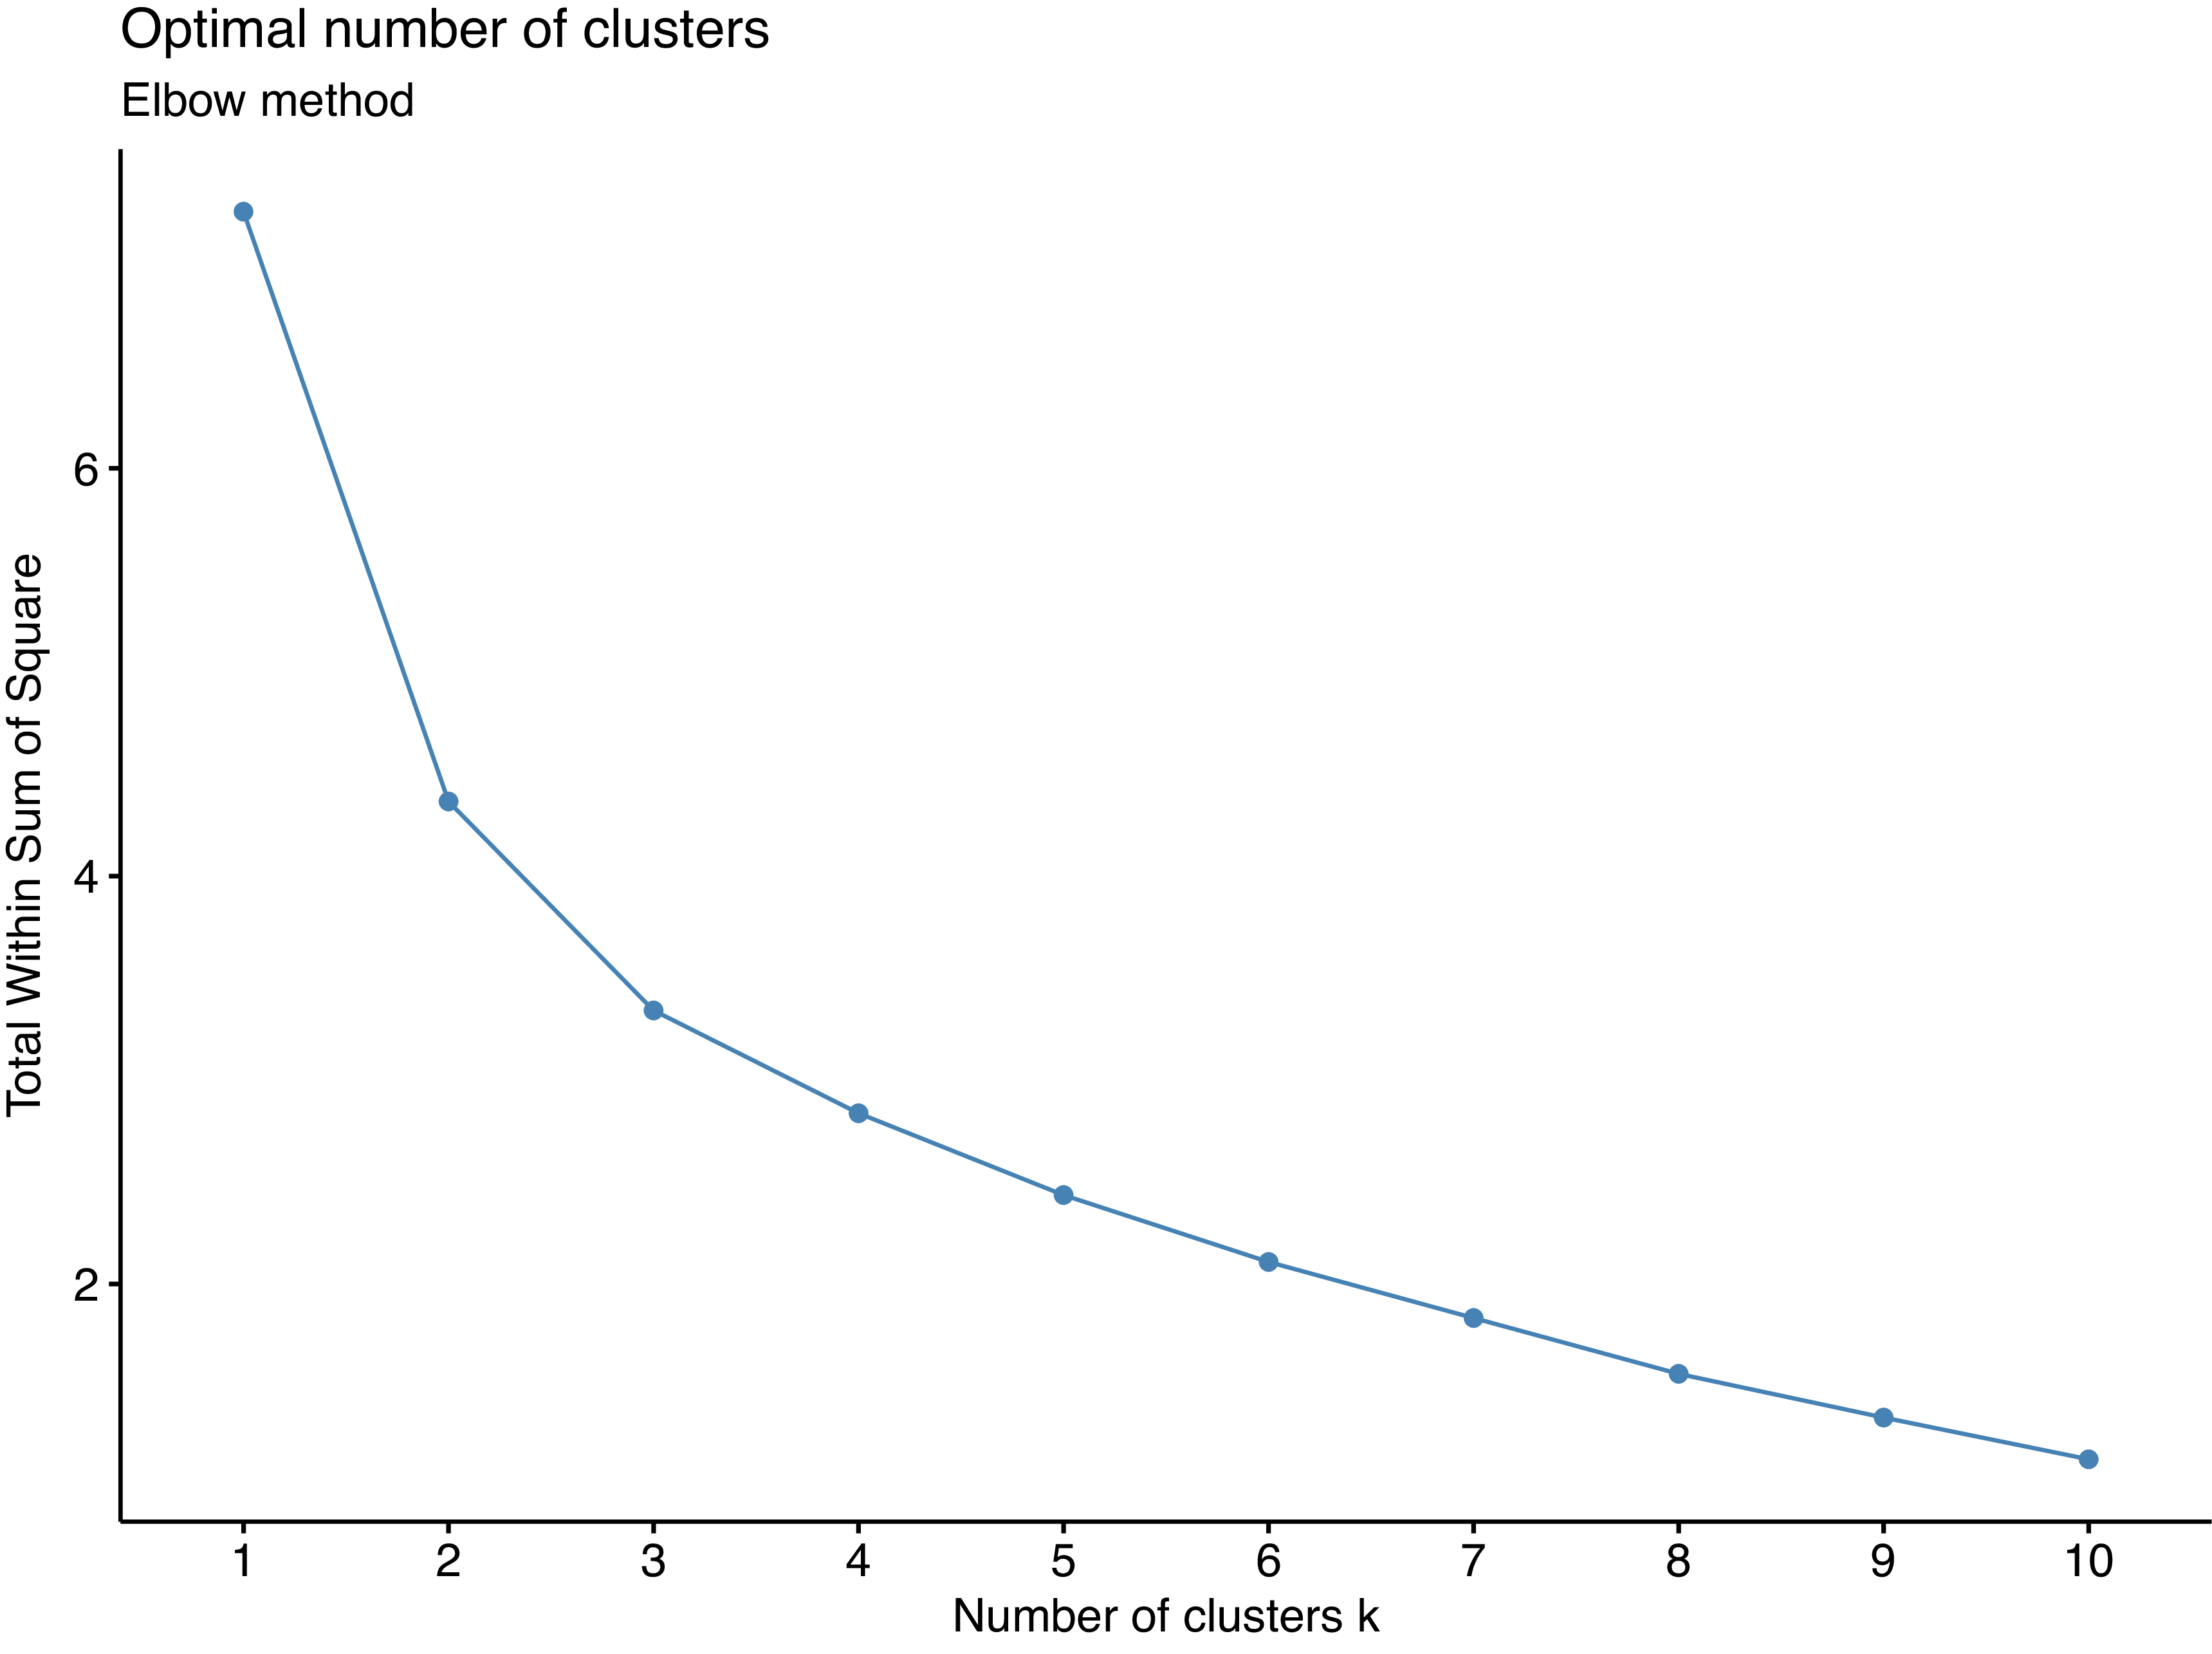
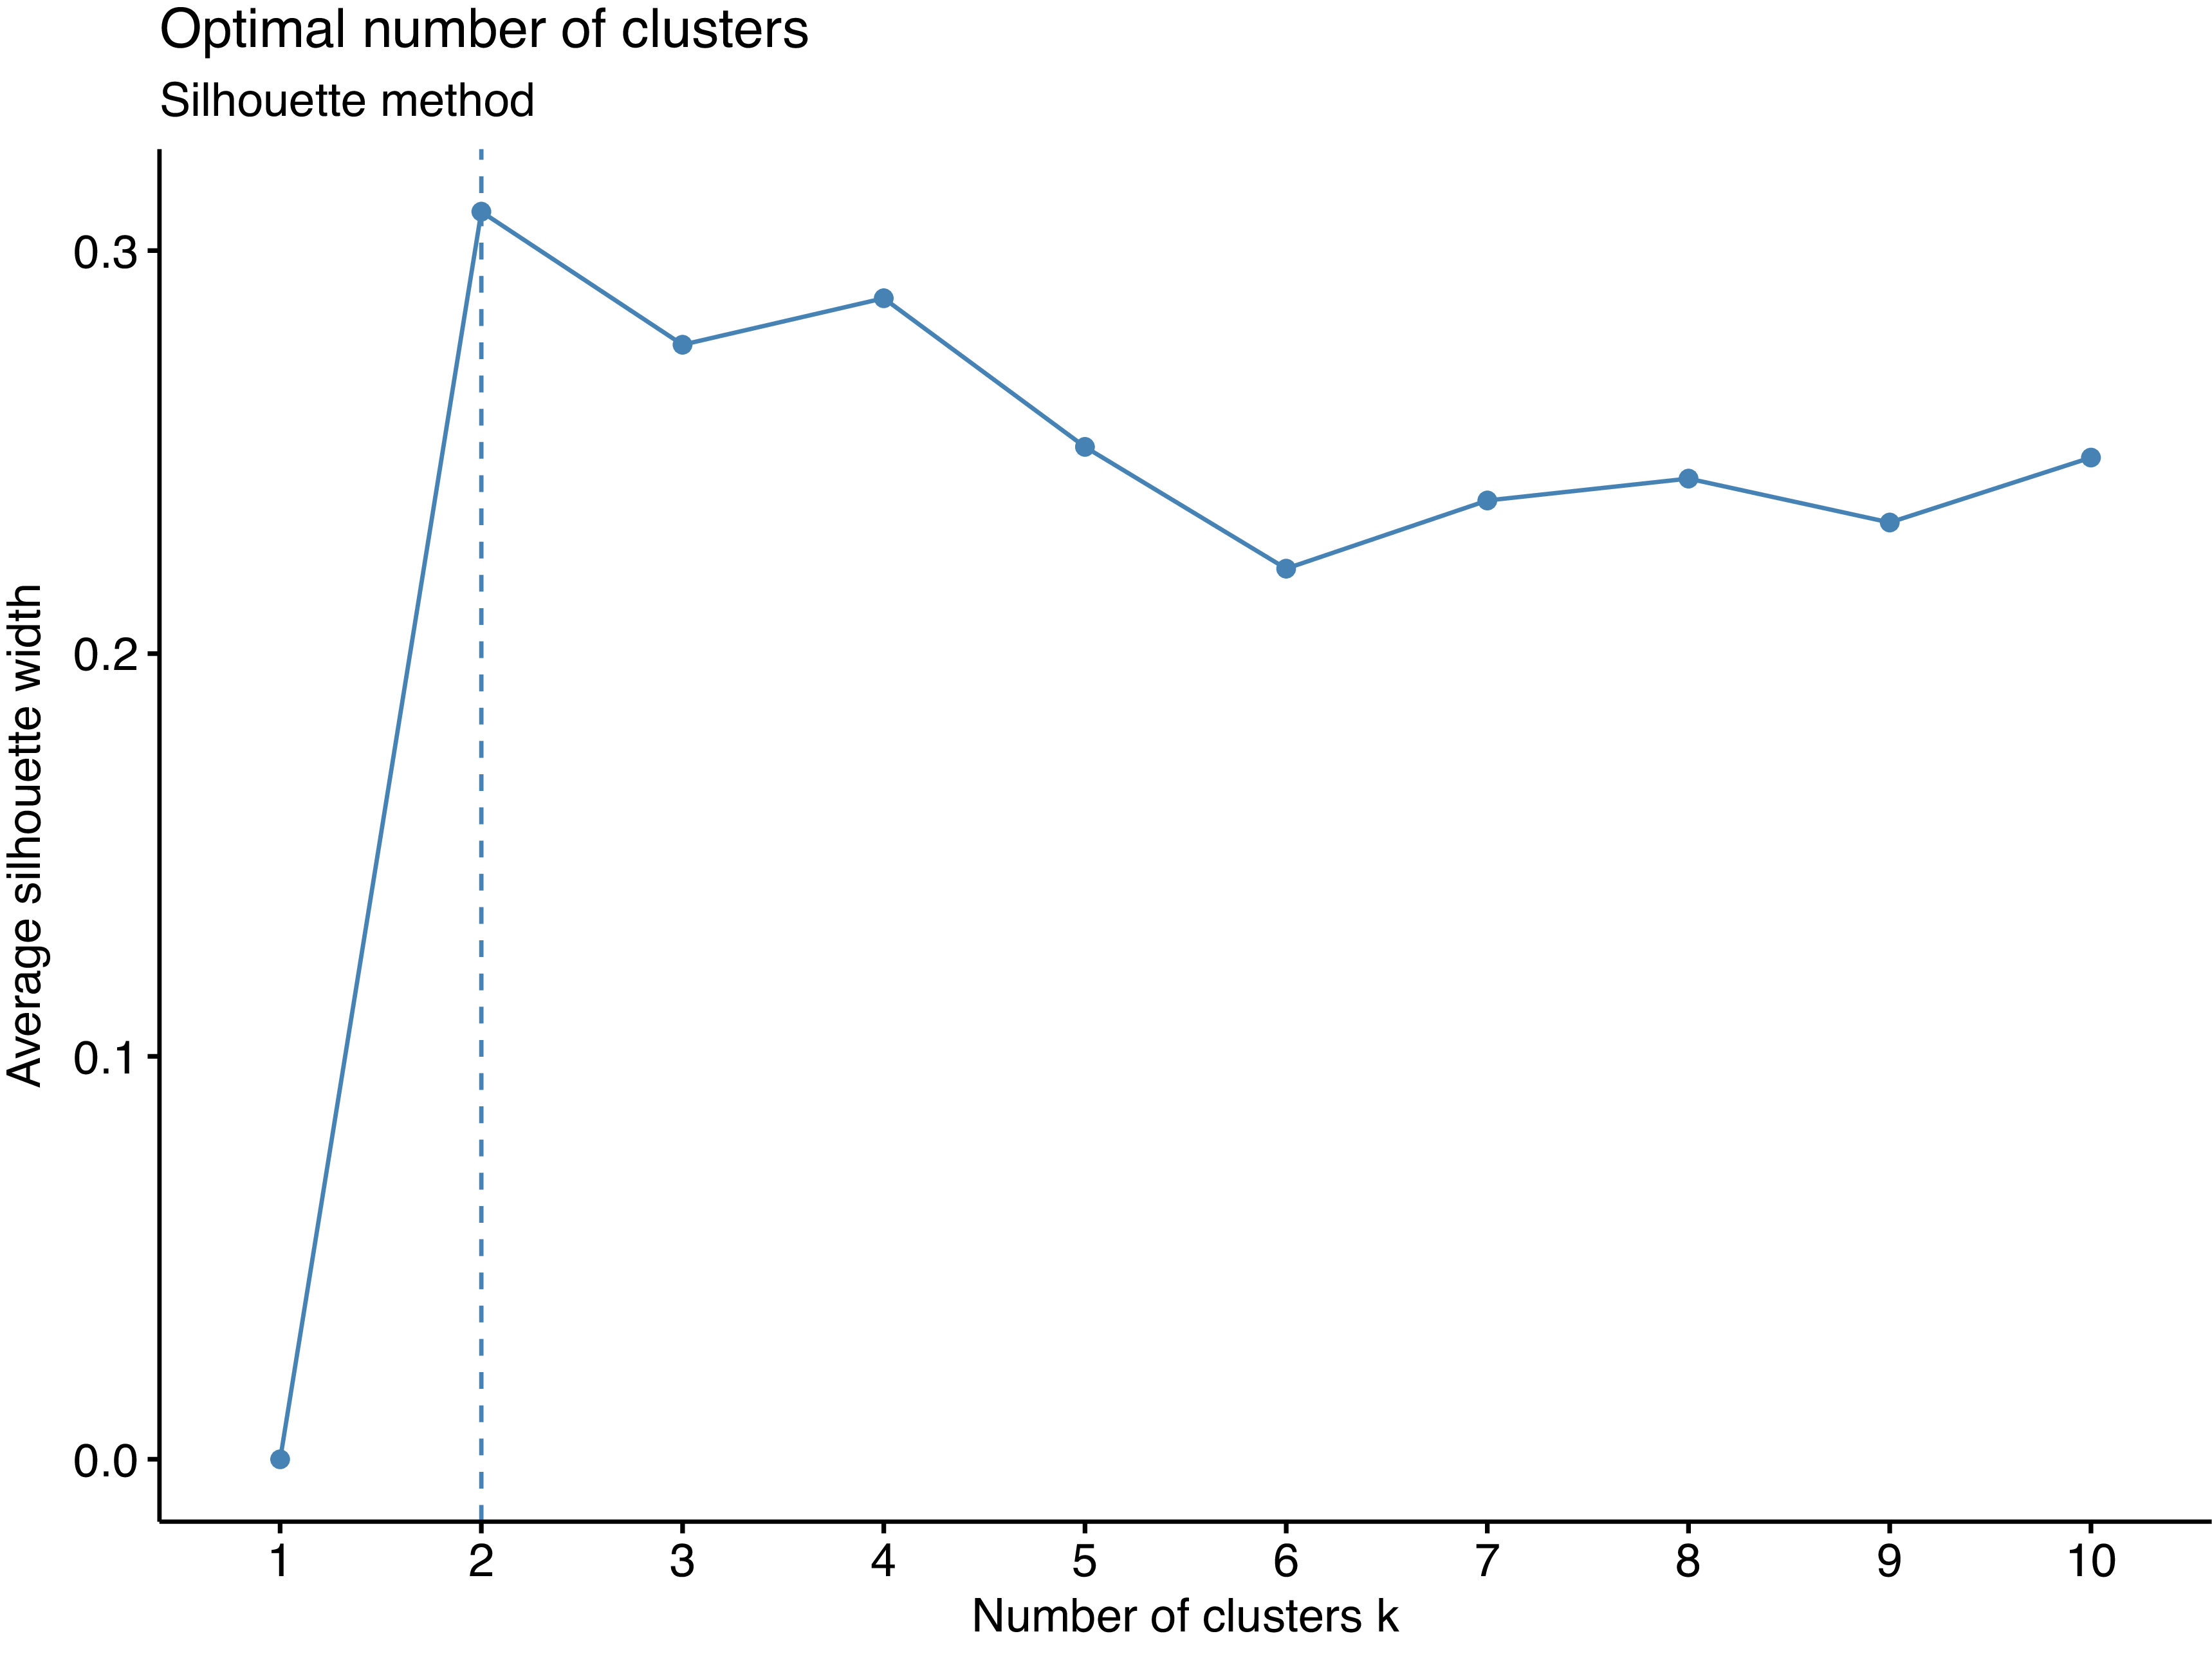
Using lifestyle variables alone for clustering is a stricter —but ultimately better— test of lifestyle’s relevance in delineating meaningful social groups, as it prevents the clusters from being driven by sociodemographic variables. The aim of cluster analysis is to assign individuals to groups based on shared characteristics in order to produce groupings as homogeneous as possible. One assumption behind this method is that the analysis will be more reliable and parsimonious if focused on the explanation of one latent variable—here, lifestyle—rather than on separate explanations for each single lifestyle characteristic (Yamaguchi, Reference Yamaguchi2000: 1706). This technique is therefore particularly suited for the purpose of this article. The optimal number of clusters was determined using multiple diagnostics for robustness. The elbow method, which evaluates compactness based on within-cluster sum of squares (WSS), suggested k = 2, with a secondary, less pronounced inflection around k = 3, while the silhouette analysis also peaks at k = 2 (see Figures 4 and 5 in the Appendix), indicating that two clusters provide the most statistically compact solution. However, following standard practice in exploratory clustering (e.g., Huang et al., Reference Huang, Liu, Hayes, Nobel, Marron, Hennig, Hennig, Meila, Murtagh and Rocci2015), we did not rely exclusively on statistical fit indices but considered them alongside interpretability and theoretical coherence. A two-cluster solution essentially collapses distinct lifestyle ecologies into a residual group, which obscures sociologically meaningful contrasts that are central to our argument. By contrast, a three-cluster solution captures distinct, interpretable lifestyle constellations that align with Quebec’s political sociology and produce clear distinct patterns in voting behaviour. We also evaluated higher-k solutions (k = 4, k = 5), but these primality split existing clusters into smaller fragments without adding interpretability or stability.Footnote 6 As emphasized in the clustering literature (Huang et al., Reference Huang, Liu, Hayes, Nobel, Marron, Hennig, Hennig, Meila, Murtagh and Rocci2015), there is no single “true” number of clusters inherent in the data; the appropriate choice depends on the purpose of the analysis. Here, our goal was to recover lifestyle constellations with substantive relevance to political behaviour, making k = 3 the most theoretically meaningful and empirically robust solution despite its slightly lower compactness.
Once identified, each cluster was cross-tabulated with vote choice. Chi-squared tests were carried out to test the statistical differences among clusters on each variable. Separate binomial logistic regression models were estimated for each party (party vote vs. all others) rather than a single multinomial model, as our focus was on identifying the unique lifestyle characteristics associated with each party’s electorate. These models were first performed including only the sociodemographic predictors. The clusters’ variables were then added in the models, allowing us to test if lifestyle is significantly and autonomously associated with Quebecers’ vote choice.
Results
The contribution of lifestyle to predictive models
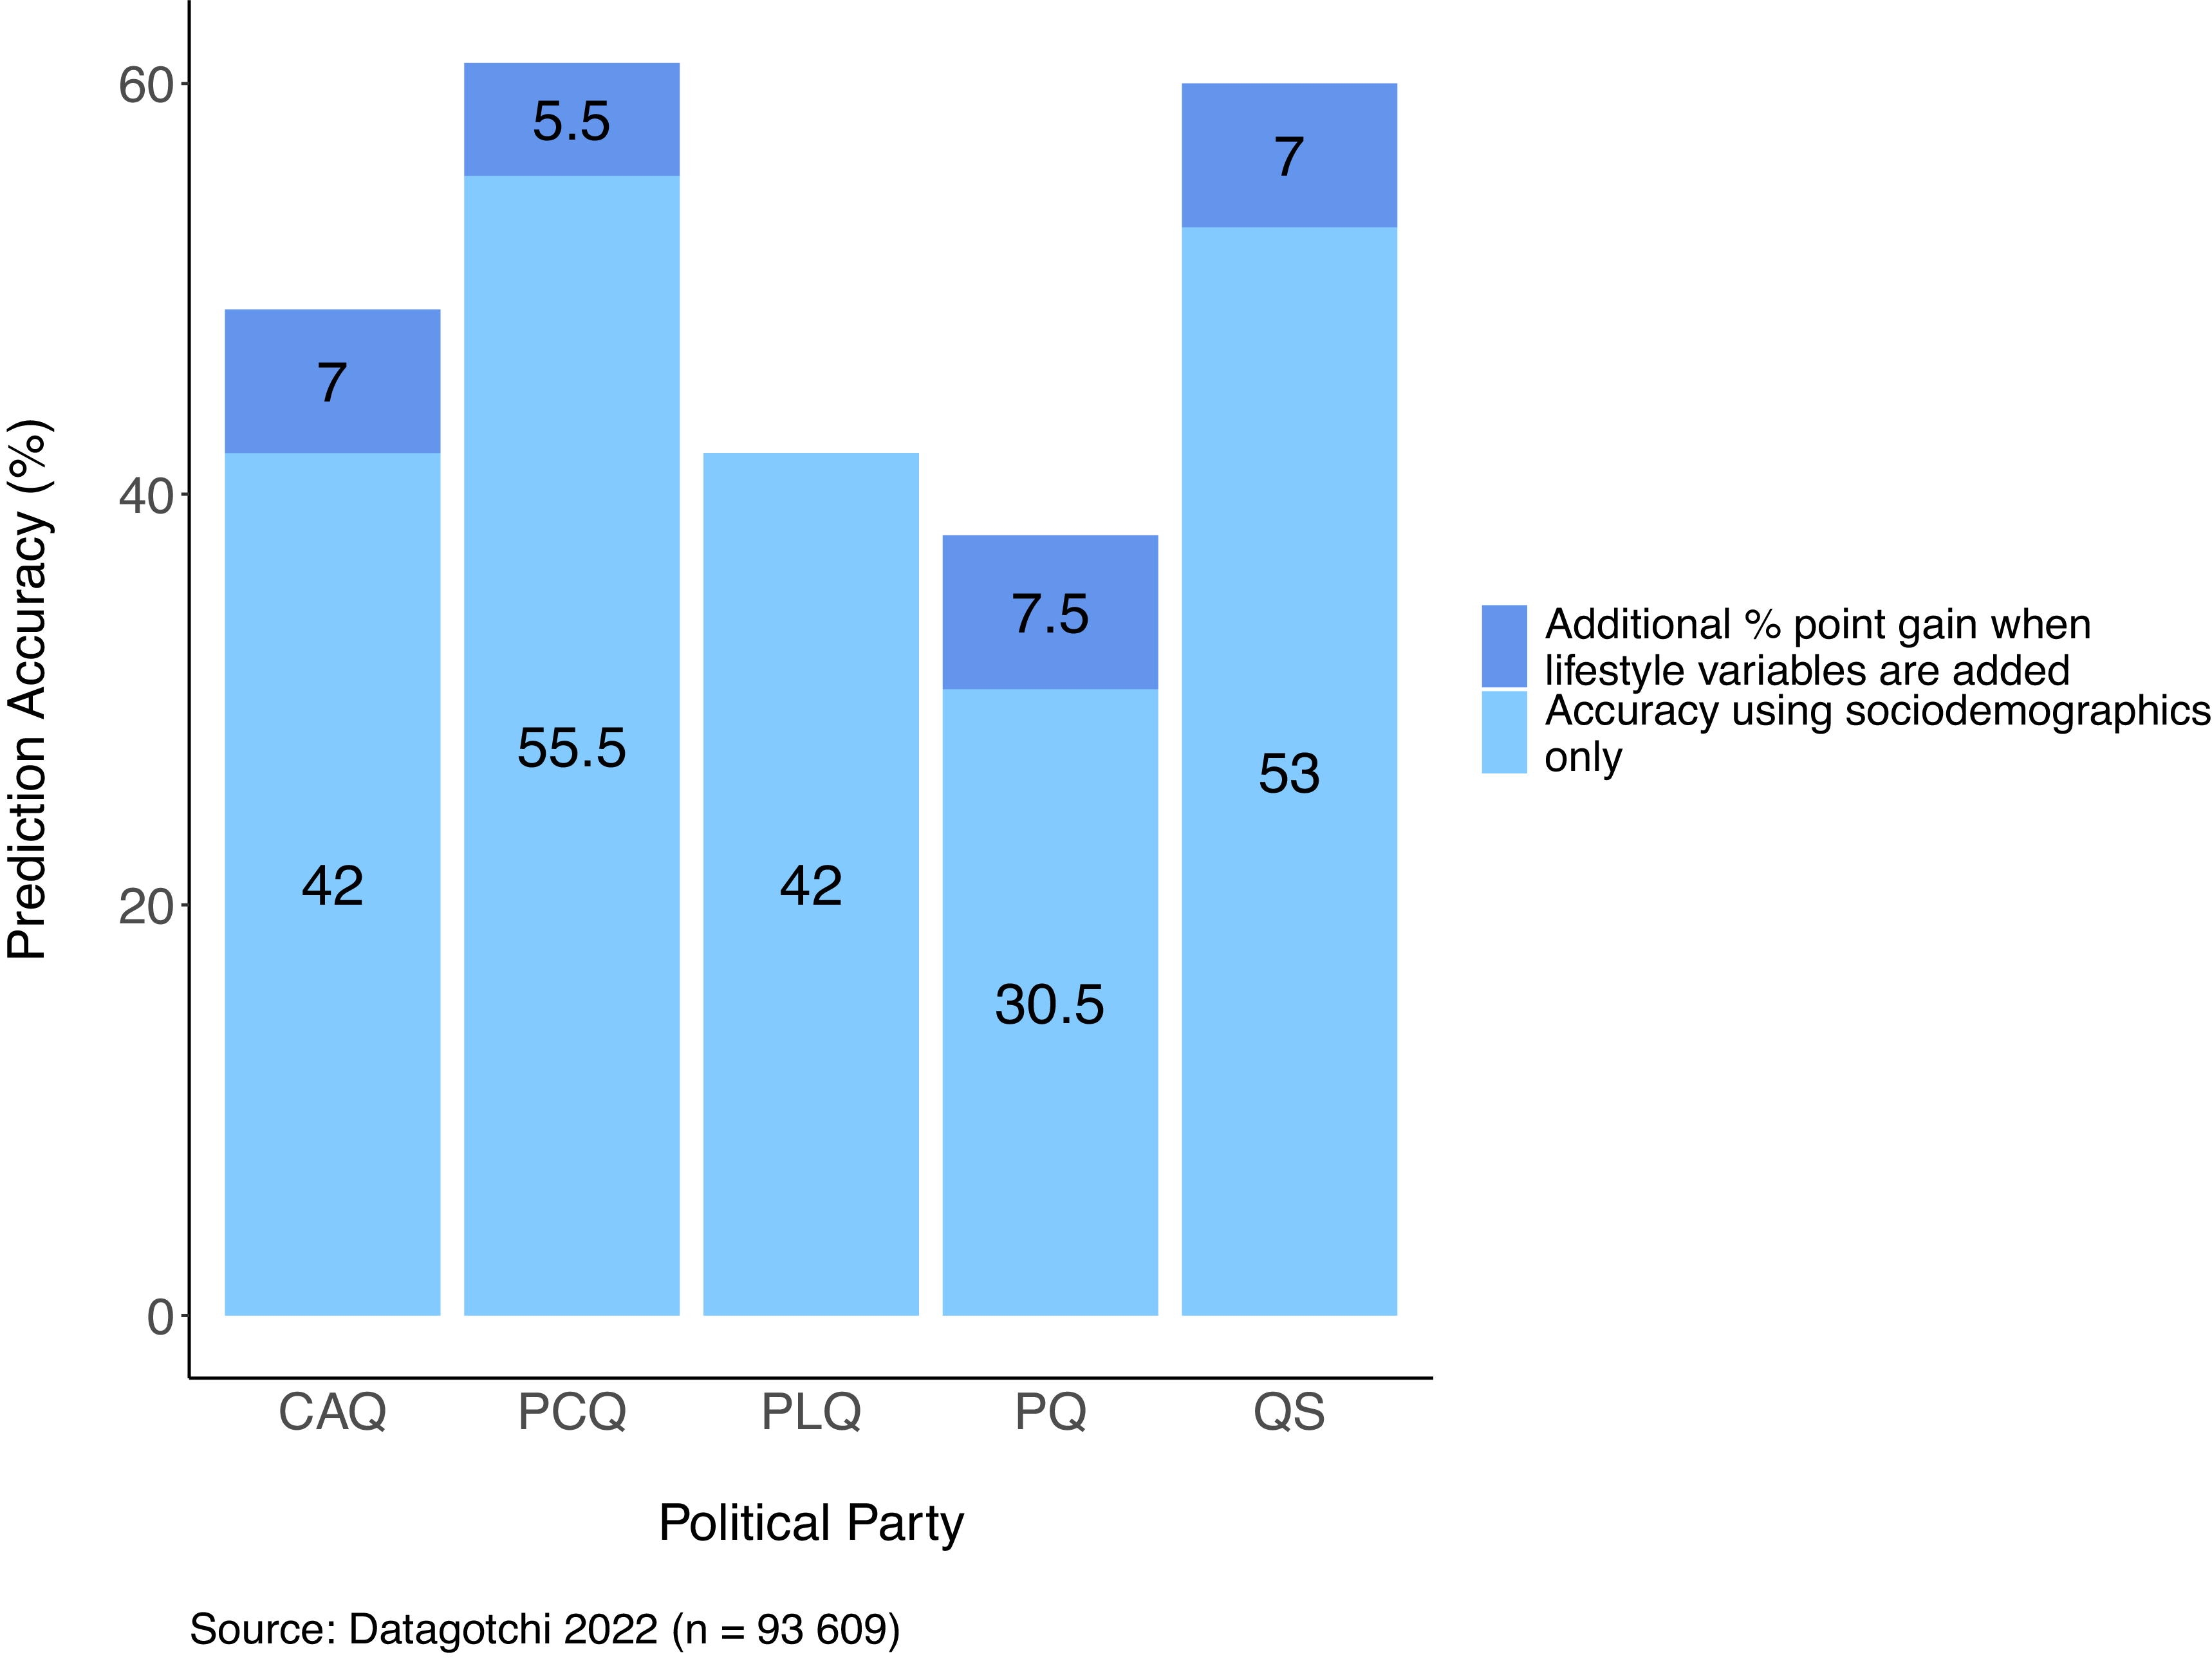
As explained above, the first part of the analysis relies on machine learning models to measure the added value of lifestyle over sociodemographic variables in predicting vote choice. The lifestyle-enhanced models incorporate cluster membership from the three-cluster k-means solution as additional predictors, alongside sociodemographic variables. Likelihood ratio tests confirm that the addition of lifestyle clusters significantly improves model fit for all parties (p < 0.001), showing that these predictive gains are statistically significant, not just a byproduct of adding variables. To this end, Figure 6 presents the prediction’s accuracy for each political party—with and without lifestyle variables. The figure should be read as follows: for instance, with the model using only sociodemographic variable, the algorithm correctly recognizes on the first try Coalition Avenir Québec’s voters 42 per cent of the time. Adding lifestyle variables increases this to 49 per cent, representing a 7-percentage point improvement. In other words, here, we are interested in the performance gain attributable to lifestyle clusters. As we can see, except for the Quebec Liberal Party, adding lifestyle characteristics significantly improves the predictive accuracy of the model for all parties. Specifically, lifestyle variables raise predictive accuracy by 5.5 percentage points for the Conservative Party of Quebec (from 55.5% to 61%), 7.5 points for the Parti Québécois, and 7 points for Québec Solidaire.
Predictive Accuracy by Party – Base Accuracy from Sociodemographics and Additional Gain from Lifestyle Variables.

In the interesting case of the Quebec Liberal Party, lifestyle variables do not add anything to the initial model. One potential explanation is that anglophones and allophones are known as a traditional, acquired base of the party (Blais et al., Reference Blais, Gidengil, Nadeau and Nevitte2002; Gidengil et al., Reference Gidengil, Nevitte, Blais, Everitt and Fournier2012). In other words, lifestyle variables would not add anything to the model, given that language and immigration status already predicts affiliation quite well.
The clustering of lifestyle variables in meaningful social groups
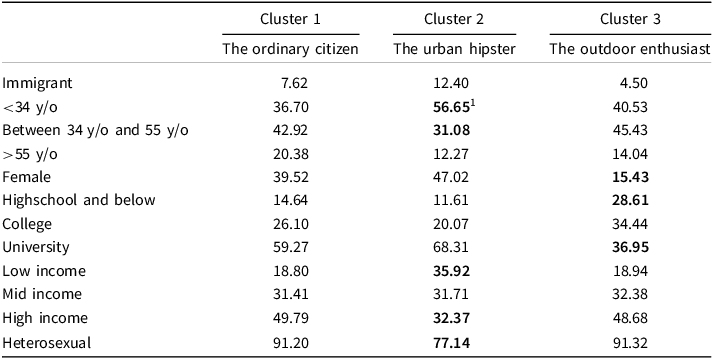
The second portion of this analysis examines how lifestyle and sociodemographic characteristics cluster together sees how, once clustered, lifestyles sub-types are associated with diverse vote choices. Table 1 provides a description of each cluster by showing, for each variable, the percentage of respondents. Three lifestyle clusters stand out. Cluster 1, the ordinary citizen, represents the largest group, composed of 9400 individuals. These people are the most likely to have never smoked, prefer red wine over other alcoholic beverages and are the most likely to dress classic. Compared to others, they are also less likely to go to coffee shops (see Table 1). Once the data are clustered and cross-tabulated with sociodemographic variables (again, which are excluded from the clustering analysis), we observe that this cluster represents the oldest group (see Table 2). Cluster 2, the urban hipster, includes 4090 people. They are characterized by their high propensity of living in an apartment, going to independent coffee shops and using mostly urban transport means (walk, bicycle or public transit). It is also the cluster that contains the most vegetarian people, individuals who shop in thrift stores and who have a hippie clothing style. They score extremely low on outdoor-related activities such as fishing and hunting, are the least likely to own a car and are the most likely to visit museums and galleries regularly. When we examine their sociodemographic characteristics, we observe that these people are also the poorest—this is not surprising, and the fact that they are renters is probably a proxy. Cluster 2 also represents the younger group, composed by a majority of women. Cluster 3, the outdoor enthusiast, is almost the exact opposite of Cluster 2. This cluster is composed of 1510 people and brings together those who enjoy motorized outdoor activities, hunting and fishing. Coherently, these people are also the most likely, by far, to have a pickup truck and own a detached house. Compared to others, they shop disproportionately in superstores, are the most likely to have regular beer as their preferred alcohol and prefer Tim Hortons over Starbucks or independent coffee shops. Consistent with their rural lifestyle, it is also no surprise that they are the least likely to use urban transport and are the most likely to have farm animals. When cross-tabulated with sociodemographic variables, we see that this cluster is mainly composed of men and are also the least educated.
Description of each Cluster (Percentages for All Sociodemographic Variables)

1 Percentages in bold indicate values that differ by at least 10 percentage points from Cluster 1 (The Ordinary Citizen), the reference category.
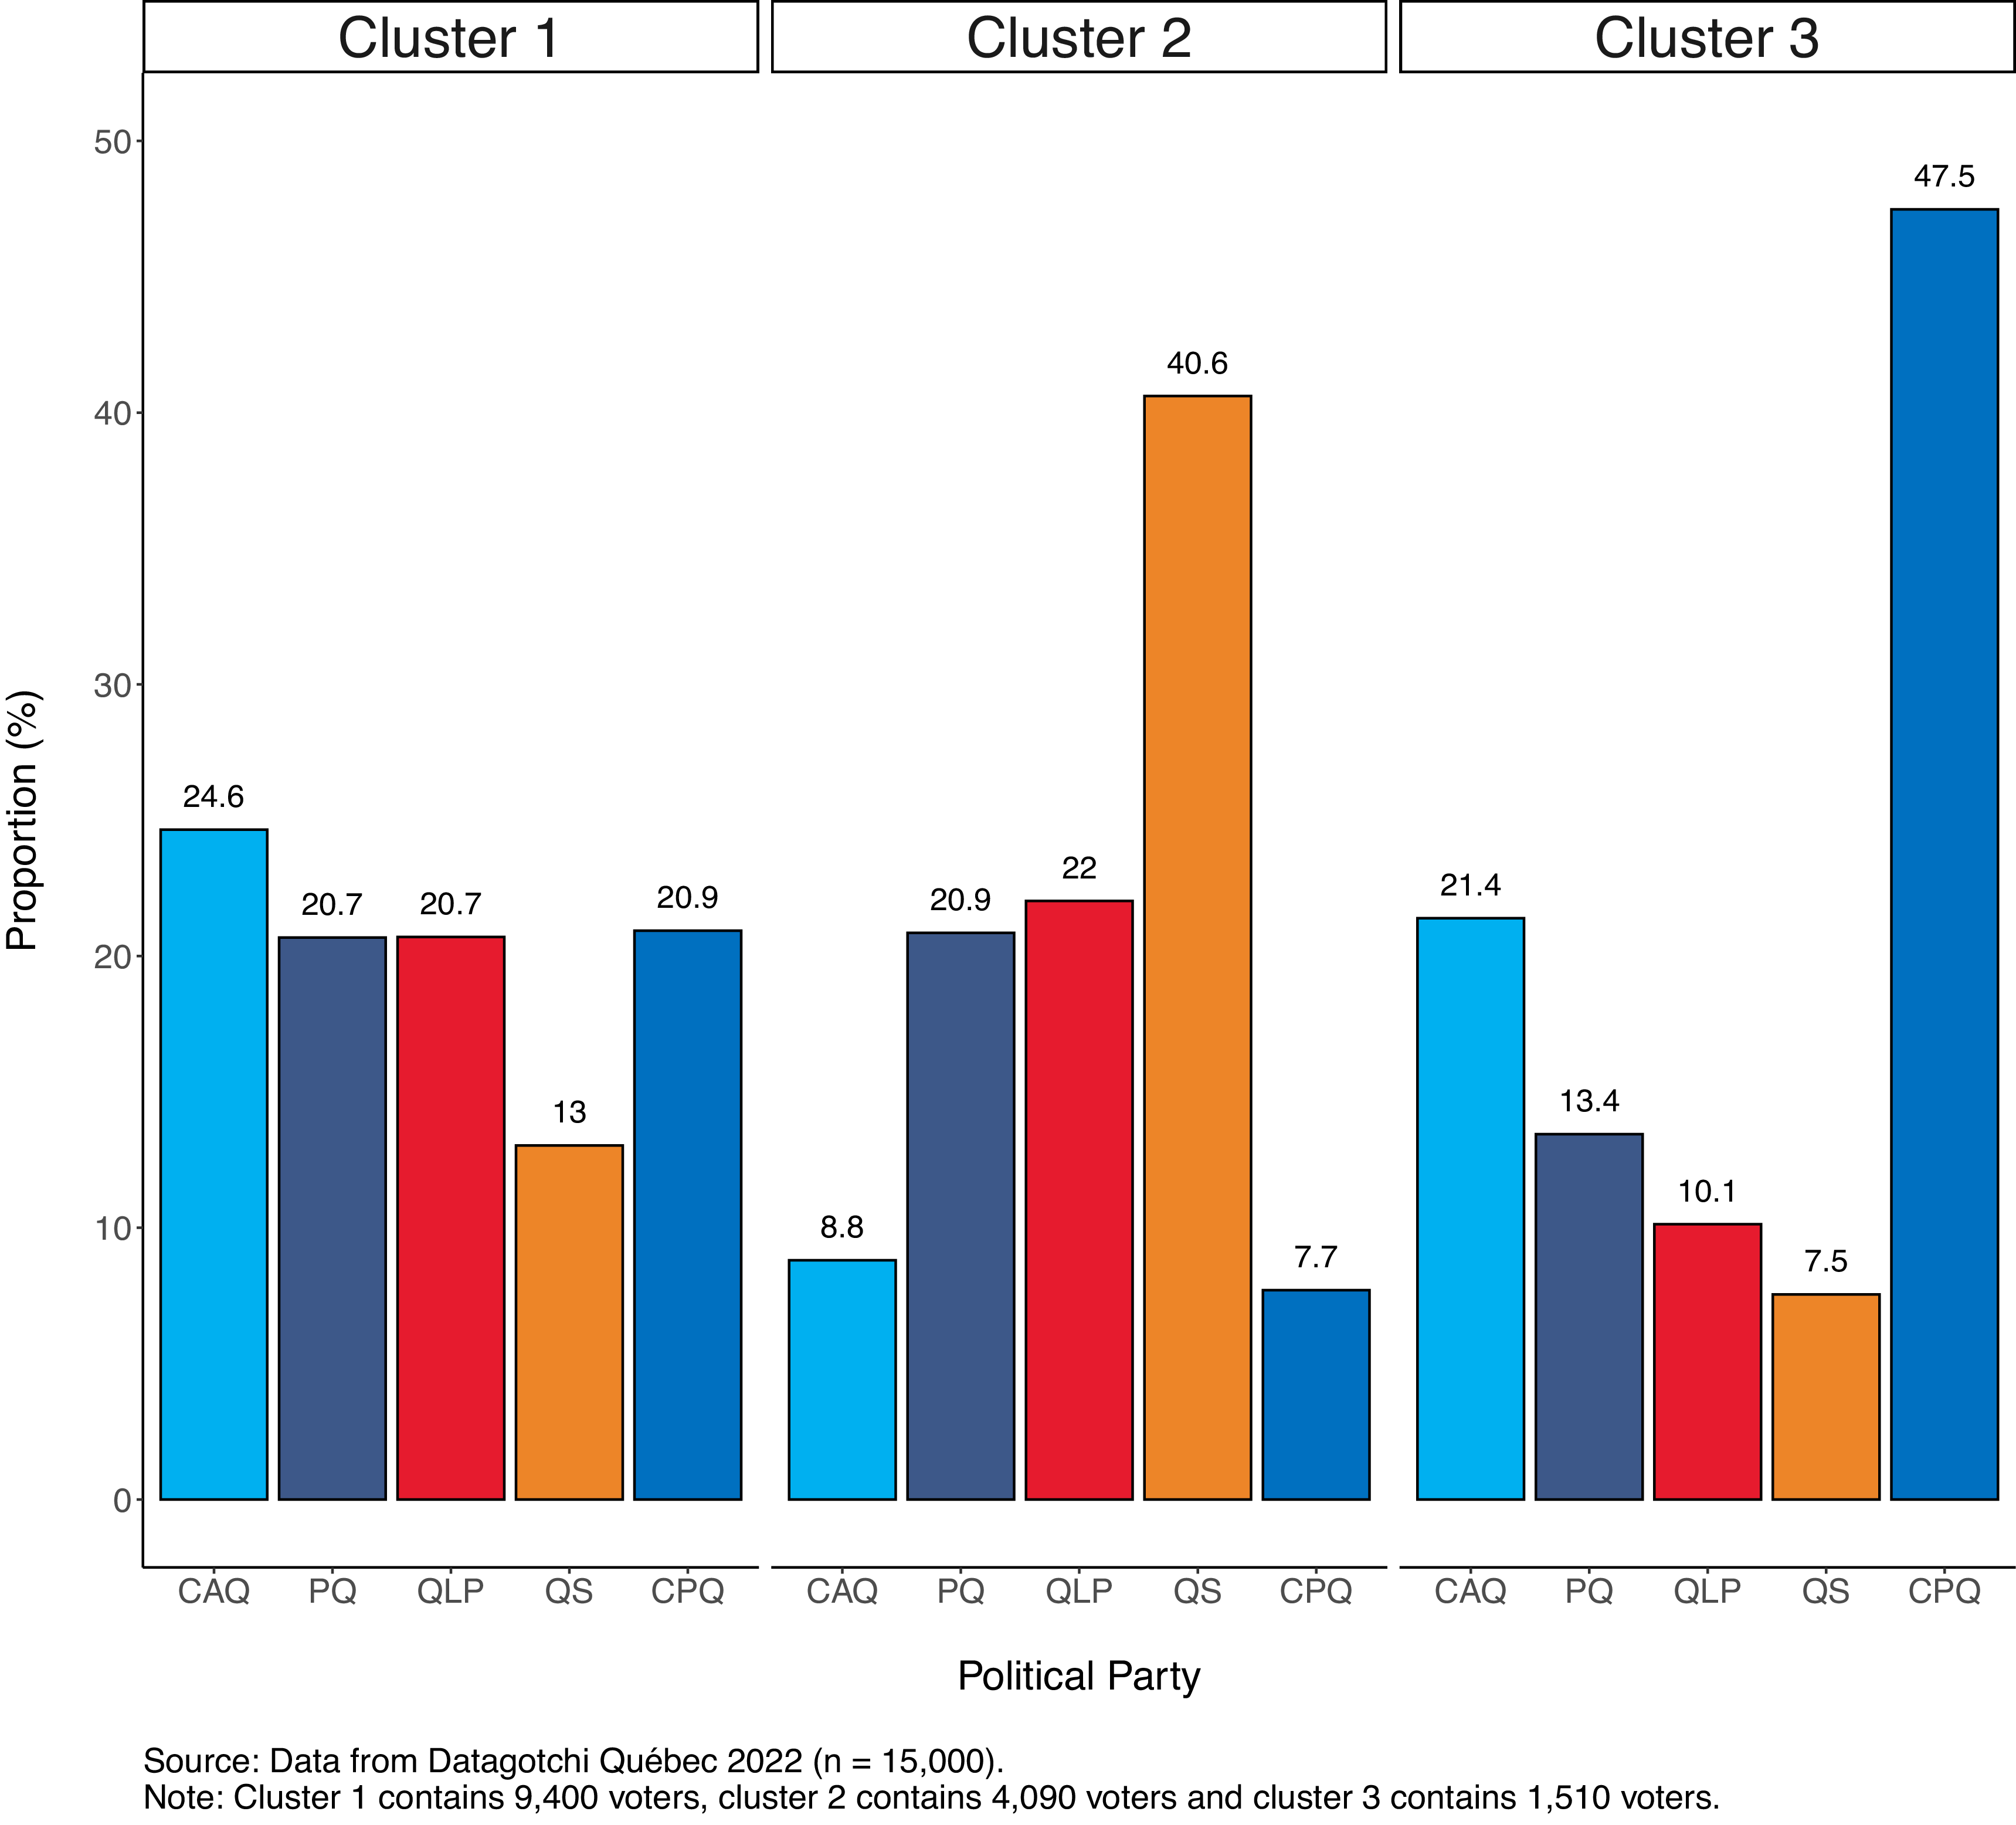
Now, let’s examine whether and how people classified in each of them differed in their interaction with the political field. Again, the whole dataset has an equal number of voters for each political party. However, once the data are clustered, significant differences emerge (see Figure 7). Because of our balanced sampling design, the figure reflects lifestyle–politics associations rather than population-weighted electoral preferences. The strong political homogeneity within Clusters 2 and 3 indicates that certain lifestyle patterns are powerful predictors of vote choice, independent of party size in the general electorate. People from Cluster 1 are a bit eclectic in terms of political preferences, although almost half of them report that they intend to vote for either the CAQ or the PQ—two parties between which many undecided voters wavered during the election given their more nationalist stance. Otherwise, people are almost distributed equally among the other parties, with slightly fewer people (13%) intending to vote for QS. People from Cluster 2 are more homogeneous in terms of vote intentions. Indeed, more than 40 per cent of them think they will vote for QS. Consistently, they are also less likely to vote for either the CPQ (7.7%) or the CAQ (8.8%).
Voting Intentions by Cluster.

Finally, as we can see, almost half of people in Cluster 3 report having intended to vote for the CPQ during the 2022 Quebec Elections. Far behind, 21.4 per cent of people among this cluster have the intention to vote for the CAQ—the party considered the most right-wing after the CPQ. Unsurprisingly, only 7.5 per cent of voters among this group reported having the intention to vote for QS, the most left-wing party of Québec politics (Bélanger and Mahéo, Reference Bélanger and Mahéo2020).
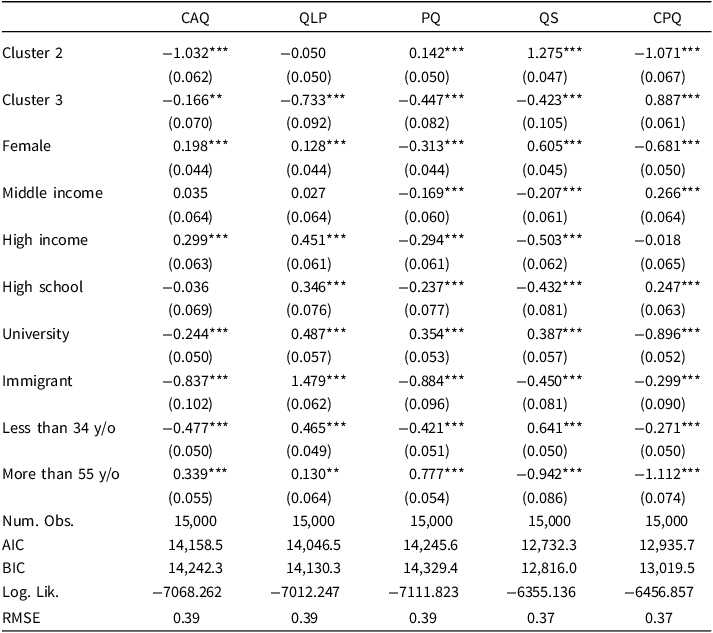
Now, how is membership in these clusters statistically related to vote intentions? Binomial logistic regressions let us test if lifestyle is significantly and autonomously associated with Quebecers’ vote choice (see Table 5). Again, findings clearly suggest that certain lifestyle clusters are correlated with political preferences, even when controlling for sociodemographic variables, hereby gender, age, education, income and immigrant status.Footnote 7
Compared to Cluster 1 (reference category), membership in Cluster 2 significantly increases the likelihood of voting for Québec Solidaire (β = 1.275, p < 0.001) while reducing the probability of voting for CAQ (β = −1.032, p < 0.001) and CPQ (β = −1.071, p < 0.001). Conversely, Cluster 3 membership strongly predicts voting for the Conservative Party of Quebec (β = 0.887, p < 0.001) and lowers support for all other parties, particularly the Quebec Liberal Party (β = −0.733, p < 0.001). This suggests that lifestyle clusters are particularly effective in discriminating voters at the ideological poles of Quebec’s party system: CPQ on the right and QS on the left. The strong and opposite coefficients for these parties across clusters (CPQ: β = −1.071 for Cluster 2 vs. β = 0.887 for Cluster 3; QS: β = 1.275 for Cluster 2 vs. β = −0.423 for Cluster 3) suggest that lifestyle characteristics capture meaningful political divisions that complement traditional sociodemographic predictors. By contrast, voters of the CAQ, QLP and PQ appear more heterogeneous in terms of lifestyle, with weaker and less systematics associations across clusters. This suggests that lifestyle plays a more modest role in distinguishing among these more centrist political options. Taken together, these findings suggest the alignment between lifestyle patterns and vote choice is most visible at the ideological extremes of Quebec’s party system.
Predictors of Voting for Each Party (Model B)

Note: Logistic binomial regressions. Reference categories: male (gender), cluster 1 (clusters), low income (income), high school and below (education), Canadian (status) and 35–53 years old (age). Significance levels: *** for p < 0.01, ** for 0.01 ≤ p < 0.05. Standard errors are given in parentheses.
The rise of challenger parties—commonly defined as parties without government experience and as parties addressing “noncentrist,” or “new” issues (De Vries and Hobolt, Reference De Vries and Hobolt2020)—helps interpreting these results. In a certain way, given that have long revolved around the sovereigntist-federalist divide,Footnote 8 challenger parties may now seek new ways to attract voters, notably by embodying social identities. Québec Solidaire, for instance, is often associated with “woke” culture, an expression used to disparage progressive ideas, but which also conjures specific ways of life, such as veganism (Fournier, Reference Fournier2022) or hippies’ counter culture (Martineau, Reference Martineau2022). After all, QS was partly created by activists who are normally critical of institutional, mainstream politics (Dufour, Reference Dufour2009). As for the CPQ, its supporters often relate to values such as autonomy or liberty and are depicted as hard-workers. Eric Duhaime also taps into lifestyle-related issues, such as raising the speed limit for snowmobiles or canceling the gas tax. He also does it in a more implicitly way when he shouts “At home, it’s ski-doo!” during press conferences (Porter, Reference Porter2022). This is also consistent with recent empirical analyses showing that the PCQ’s 2022 breakthrough rested less on “old debates” such as Quebec’s political status than on lifestyle-related and libertarian appeals, especially opposition to COVID-19 measures and skepticism about climate policies (Bélanger et al., Reference Bélanger, Mongrain, Gareau-Paquette and Mahéo2025; Medeiros and Gravelle, Reference Medeiros and Gravelle2023).
Discussion
The weakening of socio-structural cleavages on individual political choices gave rise to a vigorous debate among scholars. Some have interpreted the declining political salience of fixed social characteristics like class and religion as an “individualization of politics” (Dalton and Wattenberg, Reference Dalton and Wattenberg1993; Dalton, Reference Dalton2000). According to this view, reliance on social groups to make sense of complex political behaviour has lost relevance as individuals in post-modern societies have become freer to decide and therefore more or less detached from social forces. This perspective has fostered a resurgence of the rational voter model, often with an emphasis on issue opinions and candidate preferences (Carmines and Stimson, Reference Carmines and Stimson1980; Clarke et al., Reference Clarke, Scotto and Kornberg2011; Lewis-Beck and Paldam, Reference Lewis-Beck and Paldam2000; McAllister, Reference McAllister, Dalton and Klingemann2007). On the other hand, scholars have criticized this perspective for neglecting other social factors, such as race (Krystan and Bader, Reference Krystan and Bader2007) immigration (Huntington, Reference Huntington2004) or, more interestingly for our purpose, ways of life (Bellah et al., Reference Bellah, Madsen, Sullivan, Swidler and Tipton1985; Bishop, Reference Bishop2008; Florida, Reference Florida2008).
So far, most studies investigating the relationship between lifestyle and politics have been limited to the United States and lack the data to favour a holistic approach to lifestyle. Using Quebec as a case of study, this research demonstrates that not only does lifestyle matter when we want to understand voting behaviour: it also explains a new part of the story, that goes beyond traditional sociodemographic cleavages. As the world becomes more complex and fragmented, lifestyle subgroups would emerge, through which the sharing of political attitudes is not accidental. Rather, individuals appear as social actors engaged in a similar lifestyle within recognizable social groups (see also Cavazza and Corbetta, Reference Cavazza and Corbetta2016). These findings support the broader argument that lifestyle matters when it comes to politics. How people decide to live their life—through their leisure activities, consumption patterns or even dressing style—sheds lights on the social worlds in which people live. This is also in line with recent research conducted in the United States which demonstrates that even our smallest choices, such as coffee preferences, speak volumes about us, especially when it comes to politics (Hetherington and Weiler, Reference Hetherington and Weiler2018).
Evidently, this study is subjected to some typical methodological limitations of lifestyle studies and survey research. Indeed, given the broadness of the concept of lifestyle, it is virtually impossible to measure indicators that tap into each possible lifestyle component. However, we do not expect this to significantly alter the findings. What matters the most here is not to capture all possible lifestyle indicators, but rather the fact that the clusters are drawn from a breadth of lifestyle characteristics, therefore allowing us to determine if certain habits tend to form coherent wholes. This study is also subjected to the typical methodological limitations of large-n surveys, such as the non-representativeness of the data—especially since data were gathered through an online electoral tool, making the dataset overly young, educated and sophisticated. And although weights based on census benchmarks reduce sociodemographic imbalances, they cannot correct potential selection bias in lifestyle traits. Consequently, some lifestyle habits are likely over- or underrepresented in our sample. As such, the proportions of lifestyle clusters should not be interpreted as population estimates. In addition, because clustering was performed on a balanced subsample rather than strictly within the training set, there remains a risk of limited data leakage, though our robustness checks suggest the likelihood of it significantly affecting the results is negligible. More broadly, the three-cluster solution should not be interpreted as a purely data-driven discovery, but as an analytically informed way of capturing meaningful lifestyle configurations. In that sense, clustering here serves less to uncover entirely unknown groups than to structure and describe how lifestyle traits cohere. At the same time, the fact that statistical criteria initially point to a two-cluster solution may itself be informative, suggesting that some lifestyle distinctions are less sharply defined than often assumed—a research avenue that future work could explore.
Our analyses also exclude attitudinal or issue-based measures, which means that some dynamics emphasized by the rational voter tradition, such as issue preferences, remain outside the scope of our analysis. This is also a constraint of the Datagotchi dataset, which was built to explore how far vote choice can be predicted from lifestyle alone, and therefore excludes explicit political questions. Our contribution should thus be understood as complementary to, rather than a replacement for, approaches that focus on short-term determinants of vote choice. In fact, one promising avenue for future work is to investigate how lifestyle intersects with short-term forces. Likewise, it would be worth examining the extent to which sociodemographic variables themselves predict lifestyle traits, an analysis that would require more complex mediation models.
Beyond this, our findings open the door to fruitful research avenues on the sources of regional differences in Canadian politics. We know that context plays a role, and we also know that composition (rates of immigration, language groups, etc.) matters (Cochrane and Perrella, Reference Cochrane and Perrella2012; Simeon and Elkins, Reference Simeon and Elkins1974). But are there meaningful lifestyle differences that are also come into play? For example, might individuals with similar personalities or psychological predispositions orient themselves differently in Quebec versus Alberta? Within provinces, how might distinctive lifestyle patterns emerge between urban and rural populations? These kinds of questions are increasingly central to study of regional differences, as scholars move beyond viewing variation purely as aggregate differences between provinces and regions and start to consider other region-based or even within city-based differences (Henderson, Reference Henderson2003; Silver and Miller, Reference Silver and Mille2014).
Finally, while this analysis is primarily descriptive, further research is needed to uncover the underlying mechanisms that explain the relationship between seemingly disconnected preferences. Again, if the blurred lines between marketing, lifestyle and political research open new and promising avenues of inquiry, we still lack a clear and complete understanding of the relationship between lifestyle and politics. This analysis is therefore a first step in demonstrating the relevance of lifestyle as a concept for capturing meaningful sociopolitical identities.
Competing interests
The authors have no conflicts of interest to declare.
Appendix
Text Relevance Index.

Lifestyle Variables Correlation Matrix.

Optimal Number of Clusters – Elbow Method.

Optimal Number of Clusters – Silhouette Method.

Questionnaire

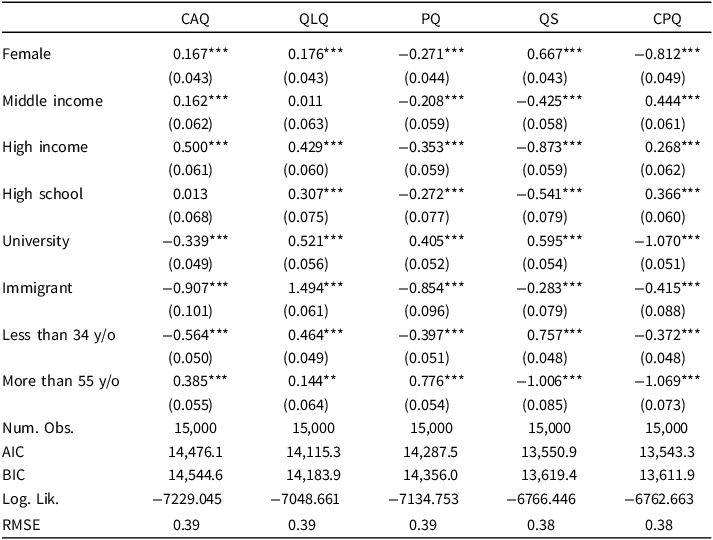
Predictors of Voting for Each Party (Model A)

Note: Logistic binomial regressions. Reference categories: male (gender), low income (income), high school and below (education), Canadian (status) and 35–53 years old (age). Significance levels: *** for p < 0.01, ** for 0.01 ≤ p < 0.05, and * for 0.05 ≤ p < 0.1. Standard errors are given in parentheses.


 Open access

