


Introduction
The human gut microbiota (GM) comprises trillions of micro-organisms that have been found to affect host health in a bidirectional manner through neuronal mechanisms (including the vagus nerve and enteric nervous system), immune responses, and the production of metabolites (Cryan et al., Reference Cryan, O’Riordan, Cowan, Sandhu, Bastiaanssen, Boehme, Codagnone, Cussotto, Fulling, Golubeva, Guzzetta, Jaggar, Long-Smith, Lyte, Martin, Molinero-Perez, Moloney, Morelli, Morillas and Dinan2019). The first few years of life are crucial for GM establishment along with overall rapid growth of the brain and internal organs (Derrien et al., Reference Derrien, Alvarez and De Vos2019). These simultaneous developmental processes further contribute to the development of metabolic and immune systems as well as cognitive and neurological development. Atypical early neurodevelopment has been found to predict various later psychiatric problems (Monk et al., Reference Monk, Lugo-Candelas and Trumpff2019). Therefore, early childhood has recently been a subject of interest in gut-brain research. Furthermore, gut microbiota composition (GMC) in infancy differs substantially from that of toddler microbiota due to the transition from milk nutrition to solid foods (Stewart et al., Reference Stewart, Ajami, O’Brien, Hutchinson, Smith, Wong, Ross, Lloyd, Doddapaneni, Metcalf, Muzny, Gibbs, Vatanen, Huttenhower, Xavier, Rewers, Hagopian, Toppari, Ziegler and Petrosino2018), and maturation continues through childhood and adolescence before reaching an adultlike composition (Derrien et al., Reference Derrien, Alvarez and De Vos2019). Similarly, the human brain undergoes rapid development in childhood, doubling in size from birth to one year old and reaching 80% of adult brain size by 6 years of age (Gilmore et al., Reference Gilmore, Knickmeyer and Gao2018). After 2 years, brain maturation continues at a slower pace.
As said, early life represents a period when both GMC and brain development are highly dynamic and particularly sensitive to environmental influences. Human studies have already reported associations between GMC and early neurocognitive development (e.g., Carlson et al., Reference Carlson, Xia, Azcarate-Peril, Goldman, Ahn, Styner, Thompson, Geng, Gilmore and Knickmeyer2018; Sordillo et al., Reference Sordillo, Korrick, Laranjo, Carey, Weinstock, Gold, O’Connor, Sandel, Bacharier, Beigelman, Zeiger, Litonjua and Weiss2019). Although these findings do not demonstrate causality, they suggest that the parallel trajectories of brain and microbiota development may be functionally linked, which highlights the importance of studying the potential biological markers in these developmental trajectories. This is particularly relevant for executive functioning, which undergoes rapid maturation during early childhood and are critical for the development of later cognitive, behavioral, and emotional outcomes.
Executive functions (EFs) can be defined as higher-order cognitive functions that support effortful and goal-directed behaviors (Diamond, Reference Diamond2013). EFs are required in situations where conscious planning and concentration are required, and more automatic behaviors are typically not sufficient to lead to adaptive outcomes (Diamond, Reference Diamond2013). EFs are typically classified into inhibition, working memory and shifting (Miyake et al., Reference Miyake, Friedman, Emerson, Witzki, Howerter and Wager2000), which refer to the ability to inhibit the most prominent response to produce an alternative answer; to keep items in mind for a short period of time; and to shift the focus of attention between tasks, rule sets and mental states. The development of EFs in early childhood plays a critical role in shaping later cognitive, academic, and behavioral outcomes, highlighting their importance for long-term success in various aspects of life.
EFs can be observed from the second half of the first year onward, and they develop rapidly during childhood (Best & Miller, Reference Best and Miller2010; Bridgett et al., Reference Bridgett, Oddi, Laake, Murdock and Bachmann2013), with great enhancements occurring between 3 and 5 years of age (Broomell & Bell, Reference Broomell and Bell2022). Unlike general cognitive abilities, which demonstrate greater stability early in life, EF development in childhood is highly dynamic and sensitive to various environmental influences (e.g., caregiving, early experiences) and reaches moderate to high stability in adolescence (Bridgett et al., Reference Bridgett, Burt, Edwards and Deater-Deckard2015). The brain networks underlying EFs (e.g. executive attention network) are considered highly sensitive to disruptions in development (e.g. environmental influences) (Posner et al., Reference Posner, Rothbart, Sheese and Voelker2014). On the other hand, variation in EF performance in childhood can be due to contextual factors (Miller et al., Reference Miller, Galvagno and Elgier2023). This large variation and plasticity in EF skills in early childhood underscores the need to understand different factors associated with this variation, including co-occurring biological and environmental influences.
Importantly, EFs play an important role in daily life and performance with disruptions in normative development during childhood potentially leading to diverse health implications later in life (Diamond, Reference Diamond2013; Yang et al., Reference Yang, Shields, Zhang, Wu, Chen and Romer2022). Recent meta-analysis found that EFs in childhood were inversely associated with broad internalizing and externalizing problems later (Yang et al., Reference Yang, Shields, Zhang, Wu, Chen and Romer2022). Additionally, direct links between deficits in EF skills in preschool age to depression and anxiety symptoms in elementary school have been made (Nelson et al., Reference Nelson, Kidwell, Nelson, Tomaso, Hankey and Espy2018). Overall, EF skills have been found to be essential for both physical and mental health as well as school and social life and overall cognitive, emotional, and psychological development (Diamond, Reference Diamond2013), underlying the relevance of EF-GMC-connections as a study topic since understanding the intricate interplay between EFs and GMC in early life may provide valuable insights into well-being later in life.
Currently, the potential associations between early GMC and later EFs in young children remain largely unexplored, without a few notable exceptions. Fujihara et al. (Reference Fujihara, Matsunaga, Ueda, Kajiwara, Takeda, Watanabe, Baba, Hagihara and Myowa2023) found that toddlers who had higher developmental risk for inhibitory control problems (SD = 1.5 higher than the mean score in BRIEF-P) had higher abundances of genera Actinomyces and Sutterella. Additionally, Willemsen et al. (Reference Willemsen, Ou, Belzer, Arias Vásquez, Smidt, Beijers and De Weerth2023) found that alpha diversity at two weeks of age was associated with better performance in an EF task at three years of age. Furthermore, the presence of Parabacteroides at two weeks was associated with enhanced EFs and less externalizing behaviors at three years, while the presence of Streptococcus at two weeks was related to poorer EFs and increased externalizing behaviors at the same age. In contrast, a study of older children, Eckermann et al. (Reference Eckermann, Ou, Lahti and de Weerth2022) did not find any associations between child fecal microbiota in infancy and the ages of 6 and 10 years and EFs at ages 8 and 10 years. They speculate that the lack of associations might be due to a smaller, low-risk sample. Furthermore, although not a study on EFs as such, Tamana et al. (Reference Tamana, Tun, Konya, Chari, Field, Guttman, Becker, Moraes, Turvey, Subbarao, Sears, Pei, Scott, Mandhane and Kozyrskyj2021) studied early cognitive and language skills in general and found that higher abundance of Bacteroides in late infancy was associated with enhanced cognitive and language skills at 2 years of age. Additionally, it is noteworthy that previous work on general cognitive development, such as Carlson et al. (Reference Carlson, Xia, Azcarate-Peril, Goldman, Ahn, Styner, Thompson, Geng, Gilmore and Knickmeyer2018), has demonstrated associations between early microbiome composition and broader cognitive measures, highlighting the potential broader context of early gut–brain interactions. In general, these findings highlight the potential associations between early GMC and EFs, although inconsistencies across studies underscore the need for further investigation that accounts for timepoints and sample characteristics that may moderate these associations.
Additionally, it is important to note that previous research in gut-brain associations has revealed sex specificity. Both rodent (Cryan et al., Reference Cryan, O’Riordan, Cowan, Sandhu, Bastiaanssen, Boehme, Codagnone, Cussotto, Fulling, Golubeva, Guzzetta, Jaggar, Long-Smith, Lyte, Martin, Molinero-Perez, Moloney, Morelli, Morillas and Dinan2019) and human studies (Aatsinki et al., Reference Aatsinki, Lahti, Uusitupa, Munukka, Keskitalo, Nolvi, O’Mahony, Pietilä, Elo, Eerola, Karlsson and Karlsson2019; Tamana et al., Reference Tamana, Tun, Konya, Chari, Field, Guttman, Becker, Moraes, Turvey, Subbarao, Sears, Pei, Scott, Mandhane and Kozyrskyj2021) suggest that GMC and neurodevelopment differ between sexes. This highlights the importance of examining the role of biological sex in the associations between GMC and EFs.
Finally, many of the studies in the field to date have been correlational, mainly focusing on the associations between different indicators of GMC and EF outcomes. Despite evidence from animal research suggesting that gut microbiota metabolites (e.g., short-chain fatty acids, SCFAs) may influence neurobehavioral processes (Dalile et al., Reference Dalile, Van Oudenhove, Vervliet and Verbeke2019; Gronier et al., Reference Gronier, Savignac, Di Miceli, Idriss, Tzortzis, Anthony and Burnet2018), corresponding studies in humans, particularly linking GM metabolites to EFs, are lacking. As mentioned, research on GMC and EFs in childhood remains scarce while investigating potential associations between early GMC and EFs in young children is important for understanding factors that may contribute to variation in EF development. Given that EFs are foundational to cognitive and behavioral development and their significance for later mental health and a range of other life outcomes, this research could provide valuable insights into early biological correlates of EF and inform future hypothesis-driven and even intervention studies.
In this study, our aim was to examine how GMC and fecal metabolites associate with EFs in early childhood in a general population sample of children. More specifically, we studied whether GMC at 2.5 months and 30 months of age is associated with EFs at 2.5 and 5 years of age. This design allowed us to examine whether early gut microbiota is related to later EFs. Importantly, the first years of life represent a sensitive period for both gut and brain development, making infancy and toddlerhood particularly meaningful ages for investigating links between microbial profiles and subsequent EF outcomes.
We hypothesized that GMC in infancy and toddlerhood would be associated with EF, both cross-sectionally and longitudinally during toddlerhood and preschool age, potentially in a sex-specific manner. Given that existing human research on GMC–EF associations is still scarce, prior work does not support a strong hypothesis concerning the direction of these linkages. For this reason, we emphasized an exploratory approach, aiming to capture potential associations without restricting the hypotheses too narrowly. However, by focusing on EF, we aimed to examine a developmental marker with known implications for later behavioral and emotional symptomatology, which underscores the potential relevance of early gut–brain associations, as early microbial variation may contribute to developmental pathways reflected in EF-related outcomes. To enhance reliability, we are combining both laboratory assessments across multiple time points with parent-reported measures. This approach allows us to capture both structured task-based performance and everyday EF behaviors, providing a more comprehensive picture of early EF development.
Method
Study sample
Our study sample is part of the FinnBrain Birth Cohort Study (www.finnbrain.fi) that was set up in 2010 to study the effects of early life stress on child development and health (Karlsson et al., Reference Karlsson, Tolvanen, Scheinin, Uusitupa, Korja, Ekholm, Tuulari, Pajulo, Huotilainen, Paunio and Karlsson2018). The data was collected in the areas of Turku and Åland Islands in Finland, and the size of the entire cohort is n = 3,837. A subcohort of this study included children with at least one microbial sample and one EF measurement (overall n = 373), and from these children, 277 had fecal samples from 2.5 months and 204 from 30 months. Overall, 108 participants had samples from both time points. Parents provided a written consent on their own and on their child’s behalf for participation in the study. The study protocol has been approved by the Ethics Committee of the Hospital District of Southwest Finland. This study followed the principles of the Helsinki Declaration.
Executive functions
EFs were assessed at age 2.5 and 5 years during a developmental research visit at the FinnBrain Child Development and Parental Functioning Lab. The visit included an EF assessment, along with other tasks and observational situations (including tests of temperament, general cognition, emotional attention, and parent–child interaction). The full visit lasted 1.5 hours at 2.5 years and 2 hours at 5 years. Study visits were conducted by clinical psychologists or trained advanced psychology students under the supervision of clinical psychologists. The parental reports of EF at the age of 5 years used in this study were gathered by asking the parent to fill out questionnaires in the waiting room during the child’s research visit.
Spin the Pots task
Visuospatial working memory was assessed using the Spin the Pots task (Hughes & Ensor, Reference Hughes and Ensor2005). The task at 2.5 years included a Lazy Susan Tray with eight visually distinct boxes glued to it. The experimenter hides six stickers in the boxes, covers the tray with an opaque scarf, and rotates it 180 degrees. Subsequently, the child is instructed to find a box with a sticker in it. Covering and rotating the tray is repeated between each trial. The task is discontinued after sixteen tries or when the child finds all six stickers. The final score is calculated by subtracting the number of unsuccessful attempts to find a sticker from the number of trials making the highest possible score in the task 16, with higher scores reflecting better working memory. The spin the Pots task at 5 years was nearly identical to the 30 months version; the difficulty level was increased by having 10 stickers in 12 boxes. Additionally, to increase the level of difficulty, the pots were designed to appear more similar to each other than in the 2.5 years version. The maximum number of trials was 20, making the maximum score in this task 20.
Snack delay task
Inhibitory control at 2.5 years was assessed using the modified Snack Delay task (Kochanska et al., Reference Kochanska, Murray and Harlan2000). In the task, the child is asked to keep their hands on the table while the experimenter puts the snack under a clear plastic cup. The child has to wait for the experimenter to ring a bell before taking the snack. The modified task in this study consists of six trials, with the duration of the task varying between 5 to 60 s. Trials were coded on a scale from 0 to 4 (0 = “Child eats the snack before the experimenter has touched the bell and rung it,” 4 = “Child does not touch the bell or the cup before the experimenter has rung the bell”). Additionally, up to 2 extra points were given based on how the child was able to keep their hands on the mat (0 = “The child is unable to hold their hands on the mat,” 1 = “The child is able to hold one hand on the mat,” 2 = “The child is able to hold both hands on the mat”) (Spinrad et al., Reference Spinrad, Eisenberg and Gaertner2007). The highest possible score in the task is 36, with higher scores reflecting better inhibitory control.
Delay of gratification task
Inhibitory control at 5 years of age was assessed using the Delay of Gratification task (Beck et al., Reference Beck, Schaefer, Pang and Carlson2011). In this task, the experimenter informs the child that they can either get one treat/sticker/penny now or two/four/six of these items later, at the end of the visit. After that, the child chooses the order: one now, four later (coin), one now, two later (sticker), one now, six later (coin), one now, four later (sticker), one now, two later (treat), one now, six later (sticker), one now, four later (treat), one now, two later (coin), one now, six later (treat). Each “later” answer gives one point, with the maximum delay score being 9 points.
EF Touch tasks: arrows, pigs and farmer
At 5 years, the child EF was assessed using three tasks from the computerized EF Touch Battery (Willoughby et al., Reference Willoughby, Blair, Wirth and Greenberg2012). Inhibitory control was assessed using the Spatial Conflict Arrows and Animal Go/No-Go (Pigs) tasks. In the Spatial Conflict Arrows task, the child needs to press the side of the screen where the arrow is pointing, despite the location of the arrow. The task consists of 36 items presented in three blocks (congruent, incongruent, and mixed conditions) with 12 items in each. Only the incongruent items were used in this study, since they specifically require inhibition of the prepotent response established during the congruent trials. Each item was displayed for 3,000 ms, and both the accuracy and reaction time of the responses were recorded. Responses faster than 400 ms were considered implausible (likely indicating a response from the previous screen) and were marked as missing (Willoughby et al., Reference Willoughby, Piper, Kwayumba and McCune2019). In the Animal Go/No-Go task, the child needs to press the screen when they see an animal, unless the animal presented is a pig, in which case the screen must not be pressed. Here again, each item was displayed for 3,000 ms and responses faster than 400 ms were considered implausible (likely indicating a response from the previous screen) and were marked as missing. Visuospatial working memory was assessed using the Farmer task, where the child needs to remember the order in which animals “walked” on four squared presented on the screen. In order to form factor scores for each EF Touch task, an IRT analysis was conducted to account for item level difficulty and discrimination properties. In the IRT analysis, the child’s response for each item was rescaled in a binary manner (pass = 1, fail = 0). The IRT analysis is described in more detail by Yada et al. (Reference Yada, Deater-Deckard, Takio, Nordenswan, Eskola, Karlsson, Karlsson, Korja, Nolvi and Tolvanen2025).
BRIEF-2
Additionally, EFs at 5 years were assessed by asking the parent to rate the child’s EF using Behavior Rating Inventory of Executive Functions, Second Edition (BRIEF-2) (Gioia et al., Reference Gioia, Isquith, Guy and Kenworthy2015). The BRIEF-2 consists of 63 child behavior rating items, for which the parents were asked to answer based on the frequency of certain behavior of their child using a Likert scale (0 = Never, 1 = Sometimes, 2 = Often). These items, in turn, form three indices: the Behavior Regulation Index (BRI; including factors Inhibit and Self-Monitor), the Emotional Recognition Index (ERI; including factors Shift and Emotional Control), and the Cognitive Regulation Index (CRI; including factors Initiate, Working Memory, Plan/Organize, Task-Monitor, and Organization of Materials) which further form the Global Executive Composite (GEC) factor used in this study. The GEC was used in this study to capture overall executive functioning in everyday life.
A Confirmatory Factor Analysis (CFA) was conducted to test the one-factor structure of the BRIEF-2. The initial model demonstrated an acceptable fit to the data: χ2(1779) = 12,976.771, p < .05; CFI = 0.82; TLI = 0.81; RMSEA = 0.047 (90% CI: 0.045–0.049); SRMR = 0.065. The BRIEF-2 factor structure was modified based on empirical fit indices and item characteristics. Items with very low frequency of endorsement (items 18, 36, 54) or low explained variance (items 55 and 61, R 2 < 0.20) were excluded. Additional items were removed due to poor factor loadings and inadequate model fit (items 47, 53, and 13). Modification indices were inspected to identify potential sources of model misfit, and adjustments were made accordingly (e.g., residual covariances with high modification indices were addressed; see Supplementary Table 1 for full details). After applying modifications, the model was refined and showed an improved fit: χ2(1485) = 12,070.355, p < .05; CFI = 0.87; TLI = 0.87; RMSEA = 0.042 (90% CI: 0.039–0.044); SRMR = 0.06. Due to the complexity of the model, we used the two-index strategy by Hu & Bentler (Reference Hu and Bentler1999), where a combination of RMSEA ≤ 0.06 and SRMR ≤ 0.09 are considered an acceptable fit for the data.
Gut microbiota
At 2.5 months and at 30 months of age, stool samples were collected from children by their parents, either from diapers or a potty, depending on the child’s age. Parents were instructed to store the samples in their home refrigerator until the study visit. The samples were transported to the clinic within 24 hours in a cooler bag with cold packs (“refrigerated plastic pouch”). At the clinic, samples were kept refrigerated until processed by the laboratory nurse. In the lab, samples were aliquoted into four cryotubes and stored at −75°C until further analysis. The time from collection to freezing was monitored for each sample, although the precise temperature during transport was not recorded beyond the use of cold packs. To account for potential effects of sample handling, sensitivity analyses were conducted for the 30-month samples by adjusting for the delay between sample collection and freezing, as this information was available at the 30-month time point (see Supplementary Materials).
The GXT Stool Extraction Kit VER 2.0 (Hain Lifescience GmbH) was used to extract bacterial DNA, the concentration of which was then measured with the Qubit dsDNA HS Assay Kit and the Qubit 2.0 fluorometer (Thermo Fisher Scientific). DNA sequencing was performed at the Medical microbiology of University of Turku. The V4 region of 16S rRNA genes was amplified with custom primers, and the resulting gene library was sequenced with the Illumina MiSeq platform, as previously described (Rintala et al., Reference Rintala, Riikonen, Toivonen, Pietilä, Munukka, Pursiheimo, Elo, Arikoski, Luopajärvi, Schwab, Uusitupa, Heinonen, Savilahti, Eerola and Ilonen2018). Sequencing reads were assembled into amplicon sequence variants (ASVs) with DADA2 (Callahan et al., Reference Callahan, McMurdie, Rosen, Han, Johnson and Holmes2016) and taxonomic annotation was performed on the SILVA rRNA database v138 (Quast et al., Reference Quast, Pruesse, Yilmaz, Gerken, Schweer, Yarza, Peplies and Glöckner2013) as previously described by Keskitalo et al. (Reference Keskitalo, Aatsinki, Kortesluoma, Pelto, Korhonen, Lahti, Lukkarinen, Munukka, Karlsson and Karlsson2021). Before further analysis, samples were rarefied to the minimum count across all samples to reduce sequencing amplification bias (Weiss et al., Reference Weiss, Xu, Peddada, Amir, Bittinger, Gonzalez, Lozupone, Zaneveld, Vázquez-Baeza, Birmingham, Hyde and Knight2017). Additionally, ASVs with a prevalence lower than 10% and a relative abundance greater than 0.1% were removed, which has been observed to improve the overall robustness of methods, specifically in differential abundance analysis (Nearing et al., Reference Nearing, Douglas, Hayes, MacDonald, Desai, Allward, Jones, Wright, Dhanani, Comeau and Langille2022).
Metabolomic assays
The Bile Acids, SCFAs, and untargeted metabolome were previously described and adapted for this publication by (Aatsinki et al., Reference Aatsinki, Lamichhane, Isokääntä, Sen, Kråkström, Alves, Keskitalo, Munukka, Karlsson, Perasto, Lukkarinen, Oresic, Kailanto, Karlsson, Lahti and Dickens2025). Briefly, the fecal samples were randomized before extraction. Two aliquots (50 mg each) of each fecal sample were weighed, with one aliquot freeze-dried to determine dry weight and the other homogenized with homogenizer beads and 20 μL of water per mg of dry weight. The samples were frozen to at least −70°C and homogenized for five min using a bead beater. The bile acids (BAs) analyzed included 33 compounds listed previously (Aatsinki et al., Reference Aatsinki, Lamichhane, Isokääntä, Sen, Kråkström, Alves, Keskitalo, Munukka, Karlsson, Perasto, Lukkarinen, Oresic, Kailanto, Karlsson, Lahti and Dickens2025). BAs were extracted by adding 40 μL of fecal homogenate to 400 μL of methanol containing internal standards, followed by filtration using a Supelco protein precipitation filter plate. The dried extracts were resuspended in 20 μL of methanol:water (40:60) containing an injection standard. Quality control (QC) samples were prepared by pooling an aliquot from each sample, vortexing, and treating them identically to the other samples. Blank samples and calibration curves were prepared similarly, with standard dilutions ranging from 0.0025 to 600 ppb. The LC separation was conducted on a Sciex Exion AD 30 system with a Waters Aquity UPLC HSS T3 column. Eluent A was 0.1% formic acid in water, and eluent B was 0.1% formic acid in methanol. The gradient increased from 15% to 100% B over 18 min, with a flow rate of 0.5 mL/min and a 5 μL injection volume. A Sciex 5500 QTrap mass spectrometer operating in scheduled multiple reaction monitoring mode was used for detection.
Short-chain fatty acids (SCFAs) were analyzed by modifying a targeted analysis protocol (Trimigno et al., Reference Trimigno, Khakimov, Mejia, Mikkelsen, Kristensen, Jespersen and Engelsen2017). Fecal homogenates were prepared with water (10 μL per mg dry weight) and homogenized with a bead beater. SCFAs were extracted by crashing 50 μL of fecal homogenate with 500 μL of methanol containing internal standards. The filtered extracts were analyzed on an Agilent 5890B GC system equipped with a Zebron ZB-WAXplus column. Gas chromatography-mass spectrometry (GC-MS) was performed on an Agilent 5977A MSD in SIM mode, with standard curves (0.1 to 100 ppm) prepared for acetic, propionic, butyric, valeric, hexanoic, isobutyric, and iso-valeric acids.
Polar metabolites were extracted using methanol containing internal standards and filtered using protein precipitation plates. The extracts were dried, stored at −80°C, and derivatized with methoxamine and N-Methyl-N-(trimethylsilyl) trifluoroacetamide (MSTFA). Gas chromatography was conducted on an Agilent 7890B GC system equipped with an Agilent DB-5 MS column. Mass spectrometry was carried out on a LECO Pegasus BT system with ChromaTOF software for data acquisition. The analysis was performed in nine batches, each including calibration curves, blanks, QCs, and standard samples. Instrument maintenance, including the replacement of septa and liners, was performed between batches.
Covariates
Covariates used in this study include the child’s biological sex assigned at birth, duration of pregnancy (gestational age), sampling age, delivery mode, breastfeeding status at the time of sampling, and maternal age, weight and education. Mothers’ education and breastfeeding status at 2.5 months and 30 months of child age were acquired by questionnaires. Information about child sex, duration of pregnancy, mothers’ age and pre-pregnancy body mass index (BMI), as well as mode of delivery (vaginal or caesarean) was drawn from the Wellbeing County of Southwest Finland registries. Duration of the pregnancy was defined as the number of weeks, while sampling age was defined as the number of days from the participant’s birth to the sampling. Delivery mode was categorized as either vaginal birth or cesarean section. Breastfeeding status at the time of sampling is based on maternal reports which were divided into four categories: no breastfeeding, cessation before timepoint, partial breastfeeding or full (exclusive) breastfeeding. Mothers’ weight was derived from their body mass index (BMI) and categorized into normal (BMI < 25), overweight (25 < BMI < 35) and obese (BMI > 35). Mother’s education was divided into three categories: 1 = up to upper secondary school, 2 = up to tertiary level, university, and 3 = higher than tertiary level.
Statistical analyses
The analytical pipeline was implemented in the R statistical language (R Core Team, 2024) using TreeSummarizedExperiment (Huang et al., Reference Huang, Soneson, Ernst, Rue-Albrecht, Yu, Hicks and Robinson2021) and MultiAssayExperiment (Ramos et al., Reference Ramos, Schiffer, Re, Azhar, Basunia, Rodriguez, Chan, Chapman, Davis, Gomez-Cabrero, Culhane, Haibe-Kains, Hansen, Kodali, Louis, Mer, Riester, Morgan, Carey and Waldron2017) data containers, along with the package mia v1.8.0 (Borman et al., Reference Borman, Ernst, Shetty and Lahti2025). Within-sample diversity, or alpha diversity was calculated in terms of Shannon index and observed richness, whereas between-sample diversity or beta diversity was visualized using Bray-Curtis dissimilarity and Principal Coordinate Analysis (PCoA). For the remaining analyses, samples were agglomerated by genus, and missing taxonomic information at the genus level was replaced with the corresponding family labels.
Associations between alpha diversity and EFs were preliminarily studied using a correlation analysis with the non-parametric Kendall τ coefficient, examining the relationships between each EF score, the Shannon index, and observed richness. After analyzing correlations for the whole sample, we conducted separate analyses for boys and girls to explore potential sex-based differences. Statistically significant correlations were further examined through linear regression analysis, both unadjusted and adjusted for covariates.
The samples were classified based on the most dominant genus. The analysis was performed on genus-level relative abundance data and the most dominant genus was determined for each sample in terms of relative abundance. Genera not among the top 5 genera with the highest mean abundance were classified as “Other”. This stratification by the most dominant genus provides a simple and interpretable way to characterize microbial communities, and it has been shown to align with broad community types (Salosensaari et al., Reference Salosensaari, Laitinen, Havulinna, Meric, Cheng, Perola, Valsta, Alfthan, Inouye, Watrous, Long, Salido, Sanders, Brennan, Humphrey, Sanders, Jain, Jousilahti, Salomaa and Niiranen2021). While more nuanced data-driven clustering approaches such as Dirichlet Multinomial Models (DMM) are possible, their interpretation is more complex and, in our data, DMM did not yield additional or clearer groupings in this sample. This approach was chosen to identify patterns in microbial community composition, enabling comparisons between groups that may reveal ecological or functional differences associated with the dominant taxa. Next, differences in EFs between these dominant genus groups for the whole sample and separately for boys and girls were determined with the non-parametric Kruskal–Wallis test by ranks followed by the post-hoc Dunn’s test.
To determine whether certain members of the microbial community associate with EFs, we used LinDA (Zhou et al., Reference Zhou, He, Chen and Zhang2022) to test if any genera were differentially abundant. Each EF score was analyzed with a separate model, once for each time point (2.5 months and 30 months), resulting in a total of 20 tests. Every model was adjusted for covariates and adjusted for multiple comparisons using the Benjamini–Hochberg procedure. Next, the same procedure was conducted for boys and girls separately to examine potential sex differences in these associations.
Lastly, log-transformed metabolite concentrations were correlated with EF scores using Spearman correlation and p-values were adjusted for multiple comparisons with the Benjamini–Hochberg method. Additionally, as a sensitivity analysis, we also adjusted for infant and toddler antibiotic exposure to assess the robustness of the observed associations.
Results
Participant characteristics
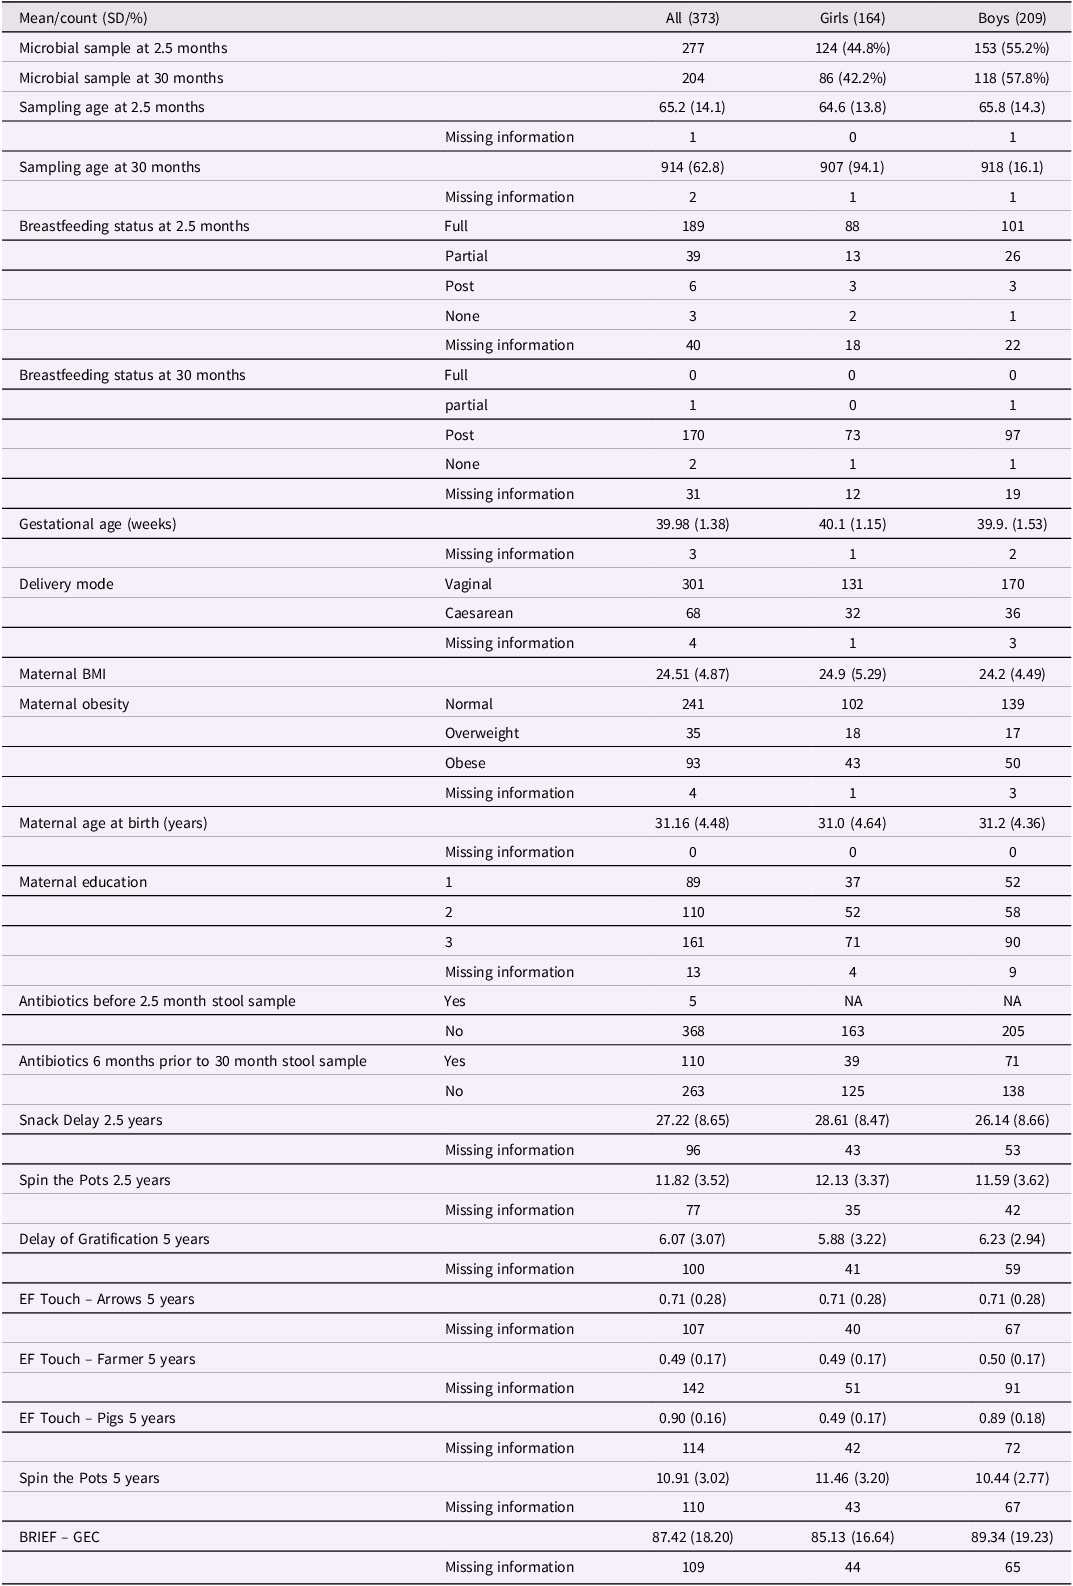
Participant characteristics are presented in Table 1. Overall composition of the data did not change remarkably between time points, excluding the breastfeeding status. Almost all participants stopped breastfeeding by 30 months of child age with only one case of ongoing partial breastfeeding. All participants with successfully collected and analyzed stool samples available did not necessarily have successful EF assessment. Since EF tasks were administered separately and at different time points, the participant pool throughout the tasks greatly overlaps, but is not identical. Some children contributed data at more than one time point (e.g., stool samples at 2.5 and 30 months, or EF assessments at 30 months and 5 years). To address this, we conducted separate analyses for each microbiota–EF combination: stool at 2.5 months with EF at 30 months, stool at 30 months with EF at 30 months, stool at 2.5 months with EF at 5 years, and stool at 30 months with EF at 5 years. Each model therefore included only one microbiota–EF pairing per participant. This approach allowed us to maximize the available sample size while avoiding non-independence within a single analysis and enabled us to examine associations across different developmental periods. Figure 1 shows the degree of overlap among participants with GMC and EF data across time points.
Participant characteristics

Note. EF task metrics: Spin the Pots: number of successful finds (max = 16 at 2.5 years; max = 20 at 5 years), higher scores indicate better working memory. Snack Delay: sum score across six trials (0–36), higher scores indicate better inhibitory control. Delay of Gratification: number of “later” choices (0–9), higher scores indicate better inhibitory control. Arrows, Pigs, and Farmer tasks: proportion correct (0–1), where 0 indicates no correct items and 1 indicates all items correct. Overlap in microbial samples: 108.
Venn diagram showing availability of stool samples and EF measurements across timepoints. Circles indicate children with stool samples at 2.5 months (blue) and 30 months (red), and EF measures at 30 months (green) and 5 years (purple). Overlaps show individuals with data at multiple timepoints, illustrating longitudinal versus cross-sectional coverage.

EF scores had only weak correlations between each other (τ = 0.01–0.19) (see Supplemental Figure 1). This is consistent with previous studies, which usually show weak to moderate correlations between tasks intended to measure the same performance (Willoughby et al., Reference Willoughby, Holochwost, Blanton and Blair2014). In addition, correlations in EF tasks over time potentially reflect the rapid and heterogeneous development of these skills in early life (Miller et al., Reference Miller, Galvagno and Elgier2023).
Alpha diversity and executive functions
The Shannon index did not correlate at any of the time points with EF scores. However, the observed richness index at 2.5 months of age correlated negatively with the EF Touch Pigs task at 5 years (τ = −0.16, adj.p = 0.03). When testing separately for boys and girls, the correlations were similar to the whole sample with the observed richness index at 2.5 months of age correlating negatively with the EF Touch Pigs task at 5 years for girls (τ = −0.23, adj.p = 0.03) but for boys there were no statistically significant associations. The correlation coefficient was higher when tested for in girls, suggesting that the correlation in the whole sample is driven by girls. Linear regression models were built first for the whole sample and then only for girls based on the correlations. For the whole sample, a higher observed richness index at 2.5 months was associated with decreased performance in the EF Touch Pigs task at 5 years both in the unadjusted analysis (β= -0.03, R 2 = 0.03, p < .01) and when adjusted for covariates (b = −0.40, R 2 = 0.08, p < .01) (Figure 2). Results were similar for girls with higher observed richness index at 2.5 months associating with decreased performance in the EF Touch Pigs task at 5 years both in the unadjusted analysis (β= −0.05, R 2 = 0.14, p < .001) and when adjusted for covariates (b = −.60, R 2 = 0.34, p < .001) (Figure 2). For alpha diversity, including infant antibiotic exposure did not change the statistical significance of the results.
Alpha diversity (Observed richness) at 2.5 months and EF Touch Pigs task at 5 years of age. Regression lines displayed by sex.

Community composition and executive functions
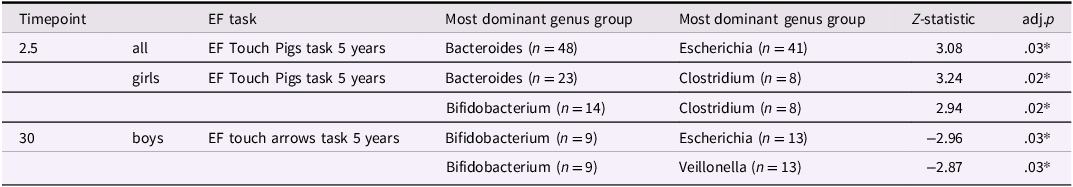
We used simple stratification by the five most dominant bacterial genera, which corresponded to Bacteroides (n = 104), Bifidobacterium (n = 68), Clostridium (n = 77), Escherichia (n = 91) and Veillonella (n = 76). The remaining samples (n = 65) were labeled as “Other” (Supplemental Figure 2). As for changes over time, the proportion of infants in the Bacteroides and Bifidobacterium-dominant groups decreased from 41% at 2.5 months to 28% at 30 months, while the Clostridium-dominant group increased from 10% to 23% over the same period. We observed differences in EF performance between the dominant genera groups (Table 2).
Results of Dunn's post-hoc test showing differences in EF scores across groups defined by dominant bacterial genera

P-values have been corrected for multiple testing. * p < .05.
Regarding EF scores, when analyzed for the whole sample, at 2.5 months of age the Bacteroides-dominant group differed from the Escherichia-dominant group with the Escherichia-dominant group at 2.5 months of age performing better in the EF Touch Pigs task at 5 years of age (adj.p = .03) (Table 2 & Figure 3(a)). When analyzed separately for boys and girls we found that for girls, the Clostridium-dominant group at 2.5 months performed better in the EF Touch Pigs task at 5 years of age compared to the Bacteroides-dominant (adj.p = .02) and the Bifidobacterium-dominant (adj.p = .02) groups (Table 2 & Figure 3(b)). For boys, the Bifidobacterium-dominant group at age 30 months performed better at the Arrows task at 5 years of age compared to the Escherichia-dominant (adj.p = .03) and the Veillonella-dominant (adj.p = .03) groups (Table 2 & Figure 3(d)). Sensitivity analyses including infant antibiotic exposure showed largely consistent results. In the difference-in-differences analyses, two previously significant associations were slightly attenuated, and one new association reached statistical significance.
Dunn's test for community composition (grouping by most dominant bacterial genera) and EF. EF Touch inhibition task pigs at 5 years in the whole sample (a), EF Touch inhibition task pigs at 5 years for girls (b), EF touch inhibition task arrows at 5 years for the whole sample (c), EF touch inhibition task arrows at 5 years for boys (d). Statistically significant differences displayed by lines.

Differential abundances and executive functions
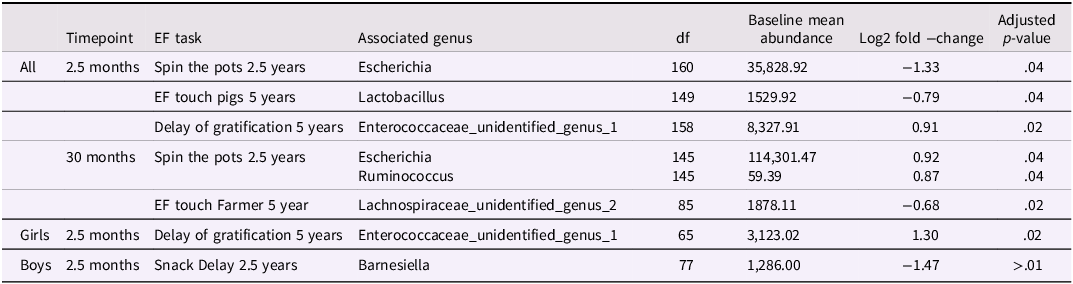
The associations between bacterial abundances at genus level and each EF variable are shown in Table 3 and illustrated in Figures 4 and 5. For the whole 2.5 month GMC sample, children’s higher performance in the Spin the Pots task at 2.5 years was negatively associated with the genus Escherichia, and better performance in the EF Touch Pigs task at 5 years showed negative associations with the genus Lactobacillus. The Delay of Gratification task (5 years) showed a positive association with unidentified genus belonging to the family Enterococcaceae. When stratified for sex, for girls, the Delay of Gratification task (5 years) was positively associated with unidentified genus belonging to the family Enterococcaceae at 2.5 months. For boys, the Snack Delay task at 2.5 years was negatively associated with the genus Barnesiella (p < 0.05 for all).
Differential abundances and EF adjusted

Scatter plots showing statistically significant associations between log-transformed abundances of genera and EF.

Volcano plots showing associations between genera and EF tasks. The statistically significant genera are labeled.

When focusing on the 30-month GMC, the Spin the Pots task at 2.5 years showed positive associations with the genera Escherichia and Ruminococcus. Additionally, at 30 months, an unidentified genus belonging to the family Lachnospiraceae was negatively associated with the EF Touch Farmer task at 5 years. With regard to 30-month GMC, there were no associations when stratified by sex. When accounting for the effects of sample handling, the results remained highly similar to the primary analyses, with comparable effect directions, and all reported associations remaining statistically significant (see Supplementary Table 2).
Metabolites and executive functions
We found that microbial metabolites, including polar metabolites, bile acids and SCFAs, were associated with EF traits. Specifically, Snack Delay and Spin the Pots tasks at 2.5 years were negatively associated with the microbe-modified secondary bile acids 7-oxo-DCA and GCA at 2.5 months based on a nominal p-value < .05. Likewise, the Spin the Pots at 2.5 years was negatively correlated with 7-oxo-DCA at 30 months.
The Delay of Gratification task at 5 years was negatively associated with valeric acid at 2.5 months of age and aMCA at 30 months of age. The Spin the Pots task at 5 years of age was negatively associated with propionic and isovaleric acids at 2.5 months. The BRIEF-2 GEC negatively associated with propionic acid at 2.5 months. Similarly, the EF Touch Pigs task at 5 years showed a negative association with CA and aMCA, whereas the EF Touch Arrows task at 5 years exhibited a positive association with 7-oxo-DCA and CA.
When stratified by sex, these associations showed some differences. For instance, for boys only, 7-oxo-DCA at 30 months was positively correlated with the EF Touch Arrows task at 5 years and butyric acid at 30 months positively associated with the Spin the Pots task at 5 years. For girls, GUDCA at 2.5 months was positively associated with the Spin the Pots task at 5 years.
These associations between stool metabolites and each EF variable are detailed in Supplementary Tables 3, 4, 5 and 6 and Supplementary Figures 3 and 4. None of these metabolites remained significant after correcting for multiple comparisons using a false discovery rate (FDR) threshold of 0.05.
Discussion
In this study, our aim was to examine how GMC and fecal metabolites in infancy and toddlerhood associate with EFs in toddlerhood and preschool age in a general population-based sample of children. We found some associations between alpha diversity and EFs and differences in EFs between microbial groups based on the most dominant genus as well as differential abundances of bacterial genera related to EFs. However, our findings differed somewhat from the limited and methodologically varied previous research, while comparable study populations and designs have been scarce.
First, regarding alpha diversity, we found that higher observed richness at 2.5 months of age was associated with poorer performance in the inhibition measuring EF Touch Pigs task at 5 years of age. Although high diversity is generally considered health-beneficial in adults, lower alpha diversity in infancy has been shown to be age appropriate (Bäckhed et al., Reference Bäckhed, Roswall, Peng, Feng, Jia, Kovatcheva-Datchary, Li, Xia, Xie, Zhong, Khan, Zhang, Li, Xiao, Al-Aama, Zhang, Lee, Kotowska, Colding and Wang2015; Stewart et al., Reference Stewart, Ajami, O’Brien, Hutchinson, Smith, Wong, Ross, Lloyd, Doddapaneni, Metcalf, Muzny, Gibbs, Vatanen, Huttenhower, Xavier, Rewers, Hagopian, Toppari, Ziegler and Petrosino2018). Breastfeeding affects infant GMC in a way that it is dominated by Bifidobacterium while richness and diversity of bacterial species increase over time with the introduction of solid foods (Stewart et al., Reference Stewart, Ajami, O’Brien, Hutchinson, Smith, Wong, Ross, Lloyd, Doddapaneni, Metcalf, Muzny, Gibbs, Vatanen, Huttenhower, Xavier, Rewers, Hagopian, Toppari, Ziegler and Petrosino2018). This suggests that lower microbial diversity can be seen as typical for early infancy, while higher diversity at this age point might reflect an atypical pattern of GMC development. Contrary to our finding, Willemsen et al. (Reference Willemsen, Ou, Belzer, Arias Vásquez, Smidt, Beijers and De Weerth2023) found that higher alpha diversity (observed richness) measured at 2 weeks of age was linked to better performance in the inhibitory control task and parental reports of EF at three years. A key difference between these studies is the timing of the assessments: Willemsen et al., measured diversity very early, at 2 weeks of age using Chao1, whereas in our study diversity was assessed at 2.5 months using observed richness. Moreover, gut microbiota diversity is naturally low at birth and increases rapidly over the first months of life (Bäckhed et al., Reference Bäckhed, Roswall, Peng, Feng, Jia, Kovatcheva-Datchary, Li, Xia, Xie, Zhong, Khan, Zhang, Li, Xiao, Al-Aama, Zhang, Lee, Kotowska, Colding and Wang2015), meaning that 2-week and 2.5-month measurements reflect different stages of microbial maturation. At 2.5 months, higher diversity may indicate deviations from the typical Bifidobacterium-dominated trajectory, whereas at 2 weeks variation in diversity might reflect the initial colonization process. These differences in measurement and developmental timing may partly explain the differences in findings.
Furthermore, the rapid and nonlinear development of EF in childhood may contribute to discrepancies between studies examining associations with gut microbiota. Longitudinal models show that a large portion of EF improvement occurs between the ages of 3 and 5, with children typically showing an improvement of even more than one standard deviation over a 12-month period (Willoughby et al., Reference Willoughby, Holochwost, Blanton and Blair2014). As a result, EF measures at 3 versus 5 years may capture different developmental processes, with earlier assessments reflecting a less stable construct. As EF matures, individual differences become more stable and the overall variability decreases, making later assessments more reliable indicators of meaningful differences in EF performance. This developmental shift in EF performance can partly explain why associations with early GMC may differ across studies, as can been seen in our and Willemsen et al. (Reference Willemsen, Ou, Belzer, Arias Vásquez, Smidt, Beijers and De Weerth2023) studies. Taken together, these findings highlight the importance of considering the developmental timing of both microbiota sampling and EF assessment when interpreting associations between them.
As for community composition, for the whole sample, the Escherichia-dominant group at 2.5 months performed better in an inhibition task (the EF Touch Pigs) at 5 years of age compared to the Bacteroides-dominant group. Interestingly, in a study by Tamana et al. (Reference Tamana, Tun, Konya, Chari, Field, Guttman, Becker, Moraes, Turvey, Subbarao, Sears, Pei, Scott, Mandhane and Kozyrskyj2021), the Bacteroides-dominant GMC at one year of age was found to be beneficial for neurodevelopmental outcomes at two years of age in a previous study. Both Bacteroides (Phoceaicola) and Escherichia are functionally diverse genera, and the age points and outcome measures differ to the extent that comparisons are difficult to make, and further studies are required to make more robust conclusions.
When girls and boys were analyzed separately, for girls only the Clostridium-dominant group at 2.5 months of age performed better in an inhibition task (the EF Touch Pigs) at 5 years of age compared to the Bacteroides- and Bifidobacterium-dominant groups. Bacteroides and Bifidobacterium in early life have been associated with beneficial outcomes such as better neurodevelopmental outcomes, adaptive skills and normal development scores (Naspolini et al., Reference Naspolini, Schüroff, Figueiredo, Sbardellotto, Ferreira, Fatori, Polanczyk, Campos and Taddei2024). However, our finding should be interpreted with caution. The Clostridium-dominant group for girls was small and comprised solely of top scores, which limited overall variance. Furthermore, as noted above, EFs develop rapidly in early childhood, likely contributing to ceiling effects in this task, as some children quickly reached the maximum performance level for certain measures (Miller et al., Reference Miller, Galvagno and Elgier2023; Willoughby et al., Reference Willoughby, Holochwost, Blanton and Blair2014). Overall, the complexity of assessing EFs in young children may help explain why associations were observed in some EF measures but not across the entire battery. This underscores the importance of group sizes, developmental variability, and task selection when interpreting EF associations with microbiota composition.
For boys, the Bifidobacterium-dominant group at 2.5 years of age performed better in an inhibition task (the EF Touch Arrows) at 5 years of age compared to the Escherichia- and Veillonella-dominant groups. This observation is in line with previous research, since it has shown that Bifidobacterium is abundant and beneficial in both infant and toddlerhood gut (Sudo et al., Reference Sudo, Chida, Aiba, Sonoda, Oyama, Yu, Kubo and Koga2004; Turroni et al., Reference Turroni, Milani, Duranti, Ferrario, Lugli, Mancabelli, van Sinderen and Ventura2017). Overall, sex differences in these results could be partly explained by differences in EF task performance between girls and boys (Grissom & Reyes, Reference Grissom and Reyes2019). While the between-sex differences in EF task performance are not as prominent as the within-sex differences, Grissom and Reyes (Reference Grissom and Reyes2019) suggest that differences in cognitive strategies rather than abilities may exist.
Moreover, accumulating evidence indicates that gut-brain interactions are often sex-specific. Animal studies have shown that GMC can influence neurodevelopment, stress response, and cognitive function differentially in males and females, potentially via sex hormones, immune system modulation, or divergent brain maturation trajectories (Clarke et al., Reference Clarke, Grenham, Scully, Fitzgerald, Moloney, Shanahan, Dinan and Cryan2013; Jašarević et al., Reference Jašarević, Morrison and Bale2016). A systematic review on rodent studies has shown that modulating maternal microbiota alters male offspring behavior (Hassib et al., Reference Hassib, de Oliveira, Rouvier, Kanashiro, Guimarães and Ferreira2023) indicating that males may be more vulnerable to the effects of these microbial alterations. This is in line with our finding on community composition and EF in boys. Importantly, early-life associations between GMC and behavioral development in early human studies have also been shown to differ by sex, as infant GMC has been linked with later behavioral development in a sex-dependent manner (Huovinen et al., Reference Huovinen, Aatsinki, Kataja, Munukka, Keskitalo, Lamichhane, Raunioniemi, Bridgett, Lahti, O’Mahony, Dickens, Korja, Karlsson, Nolvi and Karlsson2023; Laue et al., Reference Laue, Karagas, Coker, Bellinger, Baker, Korrick and Madan2022). Therefore, the associations observed between early GMC profiles and later EF performance may be influenced not only by sex-specific cognitive strategies but also by the seemingly sex-dependent characteristics of gut–brain communication, highlighting the importance of investigating the role of biological sex in future studies.
Additionally, differential abundance analysis showed a set of associations between different gut bacterial genera and EF scores. When analyzed for the whole sample, there was a time-dependent association between the genus Escherichia and working memory: a decrease at 2.5 months but an increase at 2.5 years of age was associated with an increase in the Spin the Pots task at 2.5 years of age indicating that there is no consistent positive association between the genus Escherichia and EF performance. The shift from breastfeeding to solid foods that usually occurs after 4-6 months leads to alterations in the composition of the bacterial community (Aatsinki et al., Reference Aatsinki, Lamichhane, Isokääntä, Sen, Kråkström, Alves, Keskitalo, Munukka, Karlsson, Perasto, Lukkarinen, Oresic, Kailanto, Karlsson, Lahti and Dickens2025). The cross-feeding with other bacteria and different dietary sources may modulate the metabolism of species in the Escherichia genus, potentially underlying the difference in direction (Seki et al., Reference Seki, Pollak, Kujawska, Kiu, Acuna-Gonzales, Crouch, Bakshani, Chivers, Mommers, Van Best, Penders and Hall2025).
In the whole sample, a higher abundance of the genus Lactobacillus at 2.5 months was negatively associated with performance in the inhibition task (EF Touch Pigs) at 5 years of age. This finding contrasts with previous research, as Lactobacillus is generally considered a beneficial component of the infant gut microbiota due to its association with breastfeeding (Zhang et al., Reference Zhang, Mushajiang, Luo, Tian, Ni and Yan2020), and probiotic treatments have been linked with improved neurodevelopment in animal models. However, due to the resolution of our data, we cannot determine whether the Lactobacillus strains represent resident microbes or originate from probiotic formulations, and we cannot rule out potential confounding effects of probiotic treatments.
When analyzed for boys and girls separately, for boys only, an increase in the Snack Delay task at 30 months of age was associated with a decrease in the genus Barnesiella at 2.5 months. Willemsen et al. (Reference Willemsen, Ou, Belzer, Arias Vásquez, Smidt, Beijers and De Weerth2023) found that Barnesiella at 3 years of age had a positive association with internalizing and externalizing behaviors at the same age. These findings suggest that Barnesiella may play a role in early behavioral development. However, it is important to note the differential age points again, as well as the distinction between EF and externalizing behavior. Although both are related to self-regulation, they represent different behavioral constructs. Interestingly, we found no statistically significant associations between alpha diversity, community composition, or differential abundances and BRIEF-2 questionnaire. BRIEF-2 measures parent-reported EF in everyday life and captures different aspects of EF compared to performance-based tasks. The lack of associations with this measure may be explained by the complex nature of EF, which is a heterogeneous phenotype shaped by various biological and environmental influences.
Lastly, as mentioned, we found no statistically significant associations between metabolites - spanning polar metabolites, bile acids, short chain fatty acids - and EF. However, we observed that generally EF tasks negatively correlated with secondary bile acids and short-chain fatty acids at the nominal significance level. Gut microbial metabolites are important mediators of the effects on host neurodevelopment (Ahmed et al., Reference Ahmed, Leyrolle, Koistinen, Kärkkäinen, Layé, Delzenne and Hanhineva2022). Our results highlight the potential role of bile acids in self-regulatory capacities such as EF functioning. Bile acids can bind to Farnesoid X receptor and G-protein coupled bile acid receptors that are expressed in numerous tissues, including the brain (Sabahat et al., Reference Sabahat, Saqib, Talib, Shaikh, Khan and Kailash2024). Moreover, BAs can influence neurotransmitter production as well as neuroinflammation. Of note, even though our metabolite panel was comprehensive, it did not include potential neurotransmitters, such as GABA, tryptophan or their precursors. Future studies should consider assessing how gut microbiota functional potential associates with EFs, and study targeted metabolomics, where the mechanistic relevance for EF might be clearer.
The EF tasks in this study included Spin the Pots and Snack Delay tasks at 2.5 years of age and Spin the Pots, Delay of Gratification, and EF Touch tasks as well as the BRIEF-2 questionnaire at 5 years of age. Different EF tasks did not correlate with each other in this study, which reflects the complexity of this phenotype. EF skills can be defined as dynamic and context dependent. For instance, previous research has shown that rank-order stability of EFs in childhood is moderate at best (Willoughby et al., Reference Willoughby, Holochwost, Blanton and Blair2014), which can be seen in our study as well.
The strengths of this study include extensive EF measurements, including both task- and questionnaire data as well as multiple time points regarding GMC and EF. One limitation of this study is the 16S rRNA sequencing, which does not allow for detailed information on bacterial species and functional potential. However, we added metabolite data to decrease the impact of that limitation. In our knowledge, this is one of the first few studies to investigate the potential associations between GMC and stool metabolites and later EF.
Taken together, these results add to the novel research literature on the associations between GMC and EF in early childhood when neurodevelopment, including the gut-brain axis, is rapid and malleable to environmental influence. Our results indicate that both infant and toddler gut microbiota features, such as the genus Escherichia, relate to inhibition and working memory. However, given the current heterogeneity of findings as well as the methodology applied in this field, drawing clear conclusions is challenging. One potential explanation for the disparate results is the dynamic and evolving nature of both GMC and EF, which are not fully stable during early development. Although it is suggested that GMC is one of the contributing factors to neurodevelopment, its impact is still largely unclear. Given these challenges, there is a need for more research on this topic. Further studies could help to confirm the existing findings, including the findings of the current study, and identify the mechanisms underlying the associations between GMC and EF in childhood.
Supplementary material
The supplementary material for this article can be found at https://doi.org/10.1017/S0954579426101527.
Data availability statement
Due to Finnish national legislation on personal data protection and ethics consent, the original data cannot be made available online, but data can potentially be shared with Research Agreement as part of research collaboration. Requests for collaboration can be sent to the Board of the FinnBrain Birth Cohort Study; please contact Linnea Karlsson (linnea.karlsson@utu.fi).
The R scripts for data analyses can be found in Zenodo doi: 10.5281/zenodo.15198449.
The metabolomics datasets generated in this study is available at the NIH Common Fund’s National Metabolomics Data Repository (NMDR) website, the Metabolomics Workbench (https://www.metabolomicsworkbench.org) where it has been assigned with DataTrackID 4779. The data can be accessed directly at Metabolomics Workbench: http://doi.org/10.21228/M8BB26. The 16s rRNA gene sequencing data with key metadata for this study are available in the European Nucleotide Archive with accession code PRJEB73815. The R scripts for data analyses can be found in Zenodo doi:10.5281/zenodo.11222841.
The metabolomics datasets generated in this study is available at the NIH Common Fund’s National Metabolomics Data Repository (NMDR) website, the Metabolomics Workbench (https://www.metabolomicsworkbench.org) where it has been assigned with DataTrackID 4779. The data can be accessed directly at Metabolomics Workbench: http://doi.org/10.21228/M8BB26. The 16s rRNA gene sequencing data with key metadata for this study are available in the European Nucleotide Archive with accession code PRJEB73815. The R scripts for data analyses can be found in Zenodo doi:10.5281/zenodo.11222841.
Acknowledgements
We acknowledge the contributions of all participating families, as well as the FinnBrain staff and assisting personnel. This work was supported by the “Inflammation in human early life: targeting impacts on life-course health” (INITIALISE) consortium funded by the Horizon Europe Program of the European Union under Grant Agreement 101094099. Artificial intelligence (AI) tools (e.g., ChatGPT by OpenAI) were used to assist in language editing and improving clarity of phrasing in the revision of this manuscript. The authors take full responsibility for the content of the manuscript.
Funding statement
This research was funded by Finnish State Grants for Clinical Research (ERVA) Research Council of Finland (308252, 308589, 308176) and Waterloo Foundation.
VH was funded by Emil Aaltonen foundation, OLVI Foundation and Signe & Ane Gyllenberg foundation. LK was funded by the Research Council of Finland (grant number 308176 and 325292), Yrjö Jahnsson Foundation (6847, 6976), Signe and Ane Gyllenberg Foundation, Finnish State Grants for Clinical Research (P3654), Jalmari and Rauha Ahokas Foundation, and Waterloo Foundation (2110-3601). AKA was supported by Yrjö Jahnsson Foundation, Psychiatry Research Foundation, Emil Aaltonen Foundation, Brain Foundation, Instrumentarium Science Foundation, Signe and Ane Gyllenberg Foundation, Duodecim Finnish Medical Society, Juho Vainio Foundation and Research Council of Finland (grant number 347640). LL was supported by Research Council of Finland (grant number 330887). EM was supported by the government research grant awarded to Turku University Hospital. AD has been funded by the Waterloo foundation and Research Council of Finland (347924). “Inflammation in human early life: targeting impacts on life-course health” (INITIALISE) consortium funded by the Horizon Europe Program of the European Union under Grant Agreement 101094099 (to MO HK AD).
Competing interests
All authors declare that they have no conflicts of interest.
Pre-registration statement
This study was not pre-registered. The analyses included exploratory components aimed at examining associations between early gut microbiota composition and later executive functioning.


 Open access