





1. Introduction
The breaking-up of liquid jets or pendant drops loaded with solid particles has applications for printing, spraying, granulation and seed dispersal. Owing to the particles, the necking dynamics not only depends on capillarity, gravity, liquid viscosity and inertia. It also depends at first order on the particle volume fraction $\phi$
and on the initial neck-to-particle size ratio
$\phi$
and on the initial neck-to-particle size ratio $h_{{0}}/d$
– which both influence the suspension rheology – as well as on the wetting of the particles, presumably. Over the past decades, besides purely inertial studies (Miskin & Jaeger Reference Miskin and Jaeger2012), many experiments have considered totally wetted particles and viscous situations, where the necking dynamics is limited, at least initially, by viscosity (Furbank & Morris Reference Furbank and Morris2007; Bonnoit et al. Reference Bonnoit, Bertrand, Clement and Lindner2012; Mathues et al. Reference Mathues, McIlroy, Harlen and Clasen2015; Château et al. Reference Château, Guazzelli and Lhuissier2018; Château & Lhuissier Reference Château and Lhuissier2019; Thievenaz & Sauret Reference Thievenaz and Sauret2022). In this case, for sufficiently large
$h_{{0}}/d$
– which both influence the suspension rheology – as well as on the wetting of the particles, presumably. Over the past decades, besides purely inertial studies (Miskin & Jaeger Reference Miskin and Jaeger2012), many experiments have considered totally wetted particles and viscous situations, where the necking dynamics is limited, at least initially, by viscosity (Furbank & Morris Reference Furbank and Morris2007; Bonnoit et al. Reference Bonnoit, Bertrand, Clement and Lindner2012; Mathues et al. Reference Mathues, McIlroy, Harlen and Clasen2015; Château et al. Reference Château, Guazzelli and Lhuissier2018; Château & Lhuissier Reference Château and Lhuissier2019; Thievenaz & Sauret Reference Thievenaz and Sauret2022). In this case, for sufficiently large $h_{{0}}/d$
, the necking initially follows a slow Newtonian-effective dynamics, which is set by the bulk-effective viscosity
$h_{{0}}/d$
, the necking initially follows a slow Newtonian-effective dynamics, which is set by the bulk-effective viscosity $\eta _{\textit{eff}}(\phi )$
, independently of the particle size
$\eta _{\textit{eff}}(\phi )$
, independently of the particle size $d$
. As necking proceeds, the neck flow region shrinks and deviations from the Newtonian-effective dynamics are observed. For moderately concentrated suspensions (
$d$
. As necking proceeds, the neck flow region shrinks and deviations from the Newtonian-effective dynamics are observed. For moderately concentrated suspensions ( $0.1\lesssim \phi \lesssim 0.5$
), these deviations consist of a spatial focusing and an acceleration of the necking, reminiscent of shear-thinning flows (Doshi et al. Reference Doshi, Suryo, Yildirim, McKinley and Basaran2003; Coussot & Gaulard Reference Coussot and Gaulard2005; Huisman, Friedman & Taborek Reference Huisman, Friedman and Taborek2012). The precise mechanism behind these deviations remains to be clarified. While several candidates have been invoked (such as finite size deviations to the bulk rheology, shear-induced migration and protrusion of the particles at the interface, breakdown of the capillary menisci), their experimental verification is intricate, owing to the unsteadiness, non-uniformity and stochastic nature of suspension breakup. Nonetheless, these deviations to the Newtonian-effective regime eventually arise when the current neck radius
$0.1\lesssim \phi \lesssim 0.5$
), these deviations consist of a spatial focusing and an acceleration of the necking, reminiscent of shear-thinning flows (Doshi et al. Reference Doshi, Suryo, Yildirim, McKinley and Basaran2003; Coussot & Gaulard Reference Coussot and Gaulard2005; Huisman, Friedman & Taborek Reference Huisman, Friedman and Taborek2012). The precise mechanism behind these deviations remains to be clarified. While several candidates have been invoked (such as finite size deviations to the bulk rheology, shear-induced migration and protrusion of the particles at the interface, breakdown of the capillary menisci), their experimental verification is intricate, owing to the unsteadiness, non-uniformity and stochastic nature of suspension breakup. Nonetheless, these deviations to the Newtonian-effective regime eventually arise when the current neck radius $h$
has reduced to a certain number of particle sizes, which increases with increasing particle volume fraction (Bonnoit et al. Reference Bonnoit, Bertrand, Clement and Lindner2012; Château et al. Reference Château, Guazzelli and Lhuissier2018; Thievenaz & Sauret Reference Thievenaz and Sauret2022). This suggests that, when
$h$
has reduced to a certain number of particle sizes, which increases with increasing particle volume fraction (Bonnoit et al. Reference Bonnoit, Bertrand, Clement and Lindner2012; Château et al. Reference Château, Guazzelli and Lhuissier2018; Thievenaz & Sauret Reference Thievenaz and Sauret2022). This suggests that, when $\phi$
is large enough, the accelerated regime would dominate the whole breakup. In this case, it remains unclear how fast the early dynamics would be, which usually determines the overall breakup duration. It is also unclear how viscous breakup actually proceeds when
$\phi$
is large enough, the accelerated regime would dominate the whole breakup. In this case, it remains unclear how fast the early dynamics would be, which usually determines the overall breakup duration. It is also unclear how viscous breakup actually proceeds when $\phi$
approaches or even exceeds the critical volume fraction,
$\phi$
approaches or even exceeds the critical volume fraction, $\phi _{{c}}$
, at which the steady bulk rheology of the suspension diverges.
$\phi _{{c}}$
, at which the steady bulk rheology of the suspension diverges.
To document these questions we consider here the case of particle volume fractions, $0.55\leq \phi \leq 0.605$
, comparing with
$0.55\leq \phi \leq 0.605$
, comparing with $\phi _{{c}}\approx 0.58$
(Guazzelli & Pouliquen Reference Guazzelli and Pouliquen2018). We study the detachment of a highly viscous and large pendant drop, which delays the onset of inertial and capillary effects. Most importantly, this gravity-driven configuration allows us to measure the stress and effective viscosity at the neck throughout detachment, including after the drop inertia has become important. These measurements provide the initial resistance to flow, which will be shown to determine the breakup time. They also reveal how this resistance decays progressively, as necking proceeds, with the consequence of a strongly and continuously accelerated detachment.
$\phi _{{c}}\approx 0.58$
(Guazzelli & Pouliquen Reference Guazzelli and Pouliquen2018). We study the detachment of a highly viscous and large pendant drop, which delays the onset of inertial and capillary effects. Most importantly, this gravity-driven configuration allows us to measure the stress and effective viscosity at the neck throughout detachment, including after the drop inertia has become important. These measurements provide the initial resistance to flow, which will be shown to determine the breakup time. They also reveal how this resistance decays progressively, as necking proceeds, with the consequence of a strongly and continuously accelerated detachment.
2. Experimental set-up
The set-up consists in preparing a large pendant drop of a highly concentrated suspension and monitoring its detachment (see figure 1
a). The suspension is composed of smooth polystyrene spheres (sieved TS 500, Dynoseed) with diameter $d=570\pm 10\,\unicode {x03BC}$
m and density
$d=570\pm 10\,\unicode {x03BC}$
m and density $\rho = 1050\,$
kg m–
$\rho = 1050\,$
kg m– $^3$
, suspended in a Newtonian liquid (PEGP, poly(ethylene glycol-ran-propylene glycol)-monobutyl-ether, Sigma Aldrich) with same density (
$^3$
, suspended in a Newtonian liquid (PEGP, poly(ethylene glycol-ran-propylene glycol)-monobutyl-ether, Sigma Aldrich) with same density ( $\pm 1\,$
kg m–
$\pm 1\,$
kg m– $^3$
), viscosity
$^3$
), viscosity $\eta _{{0}} = 2.8$
Pa s and surface tension
$\eta _{{0}} = 2.8$
Pa s and surface tension $\gamma = 37\pm 1\,$
mN m–1 (measured by cone-plate rheometry and pendant drop method, respectively, see Palma & Lhuissier Reference Palma and Lhuissier2019), which wets the particles totally. The particles are slowly incorporated to PEGP to avoid air trapping, and the suspension is slowly mixed overnight before use. The particle volume fraction
$\gamma = 37\pm 1\,$
mN m–1 (measured by cone-plate rheometry and pendant drop method, respectively, see Palma & Lhuissier Reference Palma and Lhuissier2019), which wets the particles totally. The particles are slowly incorporated to PEGP to avoid air trapping, and the suspension is slowly mixed overnight before use. The particle volume fraction $\phi$
ranges from 0.550 to 0.605. Experiments are conducted at fixed room temperature (
$\phi$
ranges from 0.550 to 0.605. Experiments are conducted at fixed room temperature ( $22\,^{\circ }$
C).
$22\,^{\circ }$
C).
The suspension is loaded into a syringe with no constriction. A pendant drop is formed by extruding the suspension with a mechanical stage. The extrusion speed (10 mm s–1) is large enough to obtain an initially cylindrical, essentially non-moving, pendant drop, with a diameter set by the syringe inner diameter $2h_{{0}}=12.03\,\textrm {mm}\sim 20d$
and a length
$2h_{{0}}=12.03\,\textrm {mm}\sim 20d$
and a length $L_{{0}}=3h_{{0}}$
. Once extrusion is complete, the drop detaches by gravity. It is backlit with a uniform LED panel and detachment is recorded with a high-speed camera (v611, Phantom) operating at
$L_{{0}}=3h_{{0}}$
. Once extrusion is complete, the drop detaches by gravity. It is backlit with a uniform LED panel and detachment is recorded with a high-speed camera (v611, Phantom) operating at ${\sim}3000$
fps. Images are processed to detect the drop contour and extract the neck diameter
${\sim}3000$
fps. Images are processed to detect the drop contour and extract the neck diameter $h(t)$
(as seen from the camera side view). Surface particle image velocimetry (PIV, correlating the drop contour corrugations, see figure 2
a,b and § 3.2) is used to obtain the drop vertical velocity and acceleration.
$h(t)$
(as seen from the camera side view). Surface particle image velocimetry (PIV, correlating the drop contour corrugations, see figure 2
a,b and § 3.2) is used to obtain the drop vertical velocity and acceleration.
Necking dynamics. (a) Left: image sequence of the detachment of a highly concentrated suspension drop ( $\phi = 0.60$
,
$\phi = 0.60$
, $\eta _{{0}}=2.8\,$
Pa s,
$\eta _{{0}}=2.8\,$
Pa s, $2h_{{0}}/d= 21$
). Right: snapshot for a highly viscous Newtonian drop (
$2h_{{0}}/d= 21$
). Right: snapshot for a highly viscous Newtonian drop ( $\phi =0$
,
$\phi =0$
, $\eta = 40\,$
Pa s, same nozzle size). (b) Inset: temporal evolution of the neck diameter for different particle volume fractions (
$\eta = 40\,$
Pa s, same nozzle size). (b) Inset: temporal evolution of the neck diameter for different particle volume fractions ( $0.55 \lt \phi \lt 0.605$
,
$0.55 \lt \phi \lt 0.605$
, $t=0$
corresponds to
$t=0$
corresponds to $2h=10\,$
mm). Main: same data vs time normalised by the breakup time
$2h=10\,$
mm). Main: same data vs time normalised by the breakup time $t_{\textit{break},10\,\textrm{mm}}$
. Circles correspond to the images in (a).
$t_{\textit{break},10\,\textrm{mm}}$
. Circles correspond to the images in (a).

Figure 1. Long description
The image consists of two main parts. Part (a) on the left shows a sequence of images depicting the detachment of a highly concentrated suspension drop. The drop has a particle volume fraction of 0.60, a viscosity of 10.5 pascal seconds, and a particle diameter of 0.15 millimeters. The right side of part (a) shows a snapshot of a highly viscous Newtonian drop with a viscosity of 10.5 pascal seconds and the same nozzle size. Part (b) includes an inset that displays the temporal evolution of the neck diameter for different particle volume fractions. The main graph shows the same data versus time normalized by the breakup time. Circles on the graph correspond to the images in part (a). The particle volume fractions range from 0.550 to 0.605, with 0.605 corresponding to a neck diameter of 10 millimeters. The graphs illustrate how the necking dynamics vary with different particle volume fractions and highlight the deviations from Newtonian-effective dynamics as the necking proceeds.
An immersed and doubly refractive-index-matched variant of the experiment is also implemented, to obtain undistorted visualisation of the inside of the drop and of the capillary menisci between particles. Smooth polymethylmethacrylate (PMMA) spheres (Engineering Laboratories Inc., $d = 1025\pm 5\,\unicode {x03BC}$
m,
$d = 1025\pm 5\,\unicode {x03BC}$
m, $\rho _{\text{PMMA}} = 1181$
kg m–
$\rho _{\text{PMMA}} = 1181$
kg m– $^3$
) are suspended in a customised ternary Newtonian liquid, matching the particle density and refractive index (75.06 w
$^3$
) are suspended in a customised ternary Newtonian liquid, matching the particle density and refractive index (75.06 w $\%$
Triton X-100, 14.24 w
$\%$
Triton X-100, 14.24 w $\%$
$\%$ $\textrm {ZnCl}_2$
and 10.7 w
$\textrm {ZnCl}_2$
and 10.7 w $\%$
$\%$ $\textrm {H}_2{\textrm {O}}$
,
$\textrm {H}_2{\textrm {O}}$
, $\rho _{\text{Triton}} = 1181$
kg m–
$\rho _{\text{Triton}} = 1181$
kg m– $^3$
,
$^3$
, $\eta _{{0}} = 3.9\,$
Pa s), which is dyed with a fluorophore (
$\eta _{{0}} = 3.9\,$
Pa s), which is dyed with a fluorophore ( ${\sim}10^{-3}$
w
${\sim}10^{-3}$
w $\%$
Rhodamine 6G). The immersion bath is a slightly lighter, immiscible oil (Cargille oil, 4211395,
$\%$
Rhodamine 6G). The immersion bath is a slightly lighter, immiscible oil (Cargille oil, 4211395, $\rho _{\text{PMMA}}-\rho _{\text{Oil}} = 4.7$
kg m–
$\rho _{\text{PMMA}}-\rho _{\text{Oil}} = 4.7$
kg m– $^3$
, measured from a PMMA bead sedimentation speed,
$^3$
, measured from a PMMA bead sedimentation speed, $\eta = 0.3\,$
Pa s), also matching the other two refractive indices (
$\eta = 0.3\,$
Pa s), also matching the other two refractive indices ( $n = 1.4875$
). The suspending liquid wets the particle totally (in the oil) and the liquid/liquid interfacial energy (measured with the pendant drop method on an immersed Triton drop) is
$n = 1.4875$
). The suspending liquid wets the particle totally (in the oil) and the liquid/liquid interfacial energy (measured with the pendant drop method on an immersed Triton drop) is $\gamma =0.31\pm 0.05\,$
mN m–1, which keeps Bond numbers similar to the in-air set-up (
$\gamma =0.31\pm 0.05\,$
mN m–1, which keeps Bond numbers similar to the in-air set-up ( $\sqrt {\Delta \rho g/\gamma }d \simeq 0.4$
and
$\sqrt {\Delta \rho g/\gamma }d \simeq 0.4$
and $\sqrt {\Delta \rho g/\gamma }h_{{0}} \simeq 2.3$
, versus
$\sqrt {\Delta \rho g/\gamma }h_{{0}} \simeq 2.3$
, versus $\simeq 0.3$
and
$\simeq 0.3$
and $\simeq 3.2$
, respectively). The syringe tip is immersed in the bath and the low extrusion speed (
$\simeq 3.2$
, respectively). The syringe tip is immersed in the bath and the low extrusion speed ( $1\,$
mm s–1) avoids air entrainment. The drop vertical mid-plane is illuminated with a laser sheet (532 nm) perpendicular to the view direction.
$1\,$
mm s–1) avoids air entrainment. The drop vertical mid-plane is illuminated with a laser sheet (532 nm) perpendicular to the view direction.
The critical meniscus curvature $\kappa _{{c}}$
above which capillary menisci collapse, i.e. cannot maintain at the surface of a dense suspension, is characterised with a static, sessile, suspension drop in air (polystyrene beads in PEGP, prepared at
$\kappa _{{c}}$
above which capillary menisci collapse, i.e. cannot maintain at the surface of a dense suspension, is characterised with a static, sessile, suspension drop in air (polystyrene beads in PEGP, prepared at $\phi = 0.60$
). The drop rests on a rigid mesh, which blocks particles while connecting the suspending liquid to a reservoir. The reservoir pressure is slowly lowered until air starts penetrating the drop. The critical pressure
$\phi = 0.60$
). The drop rests on a rigid mesh, which blocks particles while connecting the suspending liquid to a reservoir. The reservoir pressure is slowly lowered until air starts penetrating the drop. The critical pressure $p_{{c}}$
yields the non-dimensional critical curvature
$p_{{c}}$
yields the non-dimensional critical curvature $\kappa _{{c}} d = -p_{{c}}d/\gamma \approx 6.6$
.
$\kappa _{{c}} d = -p_{{c}}d/\gamma \approx 6.6$
.
3. Results
3.1. A localised and highly accelerated necking
The typical drop detachment dynamics of a highly concentrated suspension is illustrated in figure 1, for a volume fraction $\phi = 0.60$
(see also supplementary movie 1 available at https://doi.org/10.1017/jfm.2026.11678). From its initial cylindrical shape, the drop first stretches over most of its length (albeit for the stress-free lower part). However, as stretching proceeds, the drop develops a localised necking, with a roughly double conical shape, and eventually pinches at a short distance (
$\phi = 0.60$
(see also supplementary movie 1 available at https://doi.org/10.1017/jfm.2026.11678). From its initial cylindrical shape, the drop first stretches over most of its length (albeit for the stress-free lower part). However, as stretching proceeds, the drop develops a localised necking, with a roughly double conical shape, and eventually pinches at a short distance ( $\sim 2h_{{0}}$
) from the nozzle. Although this dynamics is purely dissipative, it is at odd with that of conventional viscous liquids. Indeed, in contrast to the strongly localised pinching and short breakup distance of concentrated suspensions (already reported for lower volume fractions
$\sim 2h_{{0}}$
) from the nozzle. Although this dynamics is purely dissipative, it is at odd with that of conventional viscous liquids. Indeed, in contrast to the strongly localised pinching and short breakup distance of concentrated suspensions (already reported for lower volume fractions $0.20\lesssim \phi \lesssim 0.50$
, Furbank & Morris Reference Furbank and Morris2007; Bonnoit et al. Reference Bonnoit, Bertrand, Clement and Lindner2012; Château et al. Reference Château, Guazzelli and Lhuissier2018; Thievenaz & Sauret Reference Thievenaz and Sauret2022), highly viscous Newtonian liquids show a slender necking and a long breakup distance (Wilson Reference Wilson1988; Shi, Brenner & Nagel Reference Shi, Brenner and Nagel1994; Papageorgiou Reference Papageorgiou1995), as illustrated in figure 1(a,right).
$0.20\lesssim \phi \lesssim 0.50$
, Furbank & Morris Reference Furbank and Morris2007; Bonnoit et al. Reference Bonnoit, Bertrand, Clement and Lindner2012; Château et al. Reference Château, Guazzelli and Lhuissier2018; Thievenaz & Sauret Reference Thievenaz and Sauret2022), highly viscous Newtonian liquids show a slender necking and a long breakup distance (Wilson Reference Wilson1988; Shi, Brenner & Nagel Reference Shi, Brenner and Nagel1994; Papageorgiou Reference Papageorgiou1995), as illustrated in figure 1(a,right).
Stress monitoring and effective viscosity at the neck. (a) Drop shape at $t_{\text{break}}-t = 41$
and
$t_{\text{break}}-t = 41$
and $4.5\,$
ms (
$4.5\,$
ms ( $\phi = 0.60$
, to disregard the final liquid bridge necking
$\phi = 0.60$
, to disregard the final liquid bridge necking $t_{\text{break}}$
is taken at
$t_{\text{break}}$
is taken at $2h \approx 0.5d$
). (b) Velocity profile along the drop obtained from surface PIV. (c) Evolution of the neck bulk-effective viscosity
$2h \approx 0.5d$
). (b) Velocity profile along the drop obtained from surface PIV. (c) Evolution of the neck bulk-effective viscosity $\eta _{\textit{eff}}$
(scaled by the suspending liquid viscosity
$\eta _{\textit{eff}}$
(scaled by the suspending liquid viscosity $\eta _{{0}}$
) with current neck diameter
$\eta _{{0}}$
) with current neck diameter $2h$
(scaled by the particle size
$2h$
(scaled by the particle size $d$
). Thin green lines: experiments (8 replicates). Green thick line: log average. Red line: fitted exponential decay
$d$
). Thin green lines: experiments (8 replicates). Green thick line: log average. Red line: fitted exponential decay $\eta _{\textit{eff}}=\eta _{{t}}(\eta _{{i}}/\eta _{{t}})^{h/h_{{0}}}$
, with
$\eta _{\textit{eff}}=\eta _{{t}}(\eta _{{i}}/\eta _{{t}})^{h/h_{{0}}}$
, with $\eta _{{i}}\simeq 743\eta _{{0}}$
and
$\eta _{{i}}\simeq 743\eta _{{0}}$
and $\eta _{{t}}\simeq 0.84\eta _{{0}}$
, the initial and terminal effective viscosities, respectively.
$\eta _{{t}}\simeq 0.84\eta _{{0}}$
, the initial and terminal effective viscosities, respectively.

Figure 2. Long description
The image contains three graphs labeled (a), (b), and (c). Graph (a) shows the shape of a liquid drop at different time intervals, highlighting the neck region where the drop is thinning. Graph (b) presents a velocity profile along the drop obtained from surface Particle Image Velocimetry (PIV), with velocity (u) in millimeters per second plotted against the vertical position (z) in millimeters. Graph (c) illustrates the evolution of the neck bulk-effective viscosity, scaled by the suspending liquid viscosity, as a function of the current neck diameter, scaled by the particle size. Thin green lines represent experimental data from eight replicates, the green thick line shows the log average, and the red line indicates a fitted exponential decay. The initial and terminal effective viscosities are marked on the graph.
Besides its spatial focusing, the necking of concentrated suspensions is characterised by its dramatic acceleration, illustrated in figure 1(b) through the time evolution of the neck diameter $2h(t)$
. While deformation is initially slow, the stretching rate
$2h(t)$
. While deformation is initially slow, the stretching rate $-2\dot {h}/h$
increases by almost four decades as the neck radius shrinks from
$-2\dot {h}/h$
increases by almost four decades as the neck radius shrinks from $h/d \approx 8$
to
$h/d \approx 8$
to $h/d \approx 1$
. Importantly, this increase largely exceeds the
$h/d \approx 1$
. Importantly, this increase largely exceeds the ${\sim}2$
-decade decrease in the neck cross section
${\sim}2$
-decade decrease in the neck cross section $h^2$
, which suggests that the bulk-effective viscosity at the neck also decays as pinching proceeds.
$h^2$
, which suggests that the bulk-effective viscosity at the neck also decays as pinching proceeds.
These behaviours are observed for all volume fractions we have investigated ( $0.55\leq \phi \leq 0.605$
). As shown in figure 1(b), a dramatic acceleration of the breakup is systematically observed, although the overall breakup duration and the magnitude of the acceleration both increase with increasing
$0.55\leq \phi \leq 0.605$
). As shown in figure 1(b), a dramatic acceleration of the breakup is systematically observed, although the overall breakup duration and the magnitude of the acceleration both increase with increasing $\phi$
(for the lower
$\phi$
(for the lower $\phi$
, necking initiates during extrusion, to facilitate comparison all dynamics are shown from the same initial neck diameter
$\phi$
, necking initiates during extrusion, to facilitate comparison all dynamics are shown from the same initial neck diameter $2h=10\,$
mm, slightly smaller than
$2h=10\,$
mm, slightly smaller than $2h_{{0}}=12.03\,$
mm, and breakup duration is measured from this time). Similarly, the drop shape at breakup is less and less slender as
$2h_{{0}}=12.03\,$
mm, and breakup duration is measured from this time). Similarly, the drop shape at breakup is less and less slender as $\phi$
is increased (with pinching distances to nozzle decreasing from
$\phi$
is increased (with pinching distances to nozzle decreasing from $\approx 4h_{{0}}$
for
$\approx 4h_{{0}}$
for $\phi =0.55$
to
$\phi =0.55$
to $\approx 2h_{{0}}$
for
$\approx 2h_{{0}}$
for $\phi =0.605$
).
$\phi =0.605$
).
3.2. Stress monitoring and neck effective viscosity
The observations of § 3.1 confirm that highly concentrated suspension drops detach differently from Newtonian ones. To specify this difference, we systematically monitor the effective strain rate $-{\dot {h^2}}/h^2$
as well as the mean tensile stress
$-{\dot {h^2}}/h^2$
as well as the mean tensile stress $\sigma$
at the neck. This requires to consider inertia, which eventually alleviates the drop weight in the last instants before pinch-off. Since the flow through the neck is in practice small, the mass
$\sigma$
at the neck. This requires to consider inertia, which eventually alleviates the drop weight in the last instants before pinch-off. Since the flow through the neck is in practice small, the mass $M$
below the neck can be considered as constant throughout detachment (the volume below the neck varies by typically less than 2 % between
$M$
below the neck can be considered as constant throughout detachment (the volume below the neck varies by typically less than 2 % between $2h/d \approx 12$
and
$2h/d \approx 12$
and $h/d \approx 0$
). This allows us to express the mean neck tensile stress as
$h/d \approx 0$
). This allows us to express the mean neck tensile stress as
 \begin{equation} \sigma = \frac {M(g - a)}{\pi h^2}, \end{equation}
with $a$
the mean vertical acceleration of the drop part below the neck. To obtain
$a$
the mean vertical acceleration of the drop part below the neck. To obtain $a$
, we use surface PIV to measure the drop vertical velocity. Figure 2(a,b) presents two typical velocity profiles along the drop,
$a$
, we use surface PIV to measure the drop vertical velocity. Figure 2(a,b) presents two typical velocity profiles along the drop, $u(z)=\boldsymbol{u}(z)\boldsymbol{\cdot }\boldsymbol{e_z}$
. They show that deformation is localised over a short region around the neck. Above the neck,
$u(z)=\boldsymbol{u}(z)\boldsymbol{\cdot }\boldsymbol{e_z}$
. They show that deformation is localised over a short region around the neck. Above the neck, $u\approx 0$
, whereas below the neck, the velocity plateaus at a constant value
$u\approx 0$
, whereas below the neck, the velocity plateaus at a constant value $u\approx \dot {Z}$
. This means that most of the drop below the neck experiences solid body acceleration
$u\approx \dot {Z}$
. This means that most of the drop below the neck experiences solid body acceleration $\ddot {Z}$
. Therefore, the mean acceleration follows
$\ddot {Z}$
. Therefore, the mean acceleration follows $a\simeq \ddot {Z}$
, which we obtain by time deriving the measured plateau velocity
$a\simeq \ddot {Z}$
, which we obtain by time deriving the measured plateau velocity $\dot {Z}$
.
$\dot {Z}$
.
By definition, the neck stress $\sigma$
is also related to the neck stretching rate
$\sigma$
is also related to the neck stretching rate $\partial _z u=-\dot {h^2}/h^2$
, through the neck extensional bulk-effective viscosity,
$\partial _z u=-\dot {h^2}/h^2$
, through the neck extensional bulk-effective viscosity, $3\eta _{\textit{eff}}$
, as
$3\eta _{\textit{eff}}$
, as
 \begin{equation} \sigma = -3 \eta _{\textit{eff}} \frac {\dot {h^2}}{h^2}, \end{equation}
where we have assumed a slender neck flow (which is reasonably well verified in experiments where $\partial _z h \lesssim 0.25$
) and neglected capillary stresses, since
$\partial _z h \lesssim 0.25$
) and neglected capillary stresses, since $({\gamma }/{\sigma h})\ll 1$
(for viscous necking,
$({\gamma }/{\sigma h})\ll 1$
(for viscous necking, $({\gamma }/{\sigma h})$
decreases from the initial value
$({\gamma }/{\sigma h})$
decreases from the initial value $\sim ({\gamma }/{\rho g h_{{0}}^2}) \lt 10^{-3}$
. Inertia tends to increase the ratio, but from the model of § 3.6, it remains below
$\sim ({\gamma }/{\rho g h_{{0}}^2}) \lt 10^{-3}$
. Inertia tends to increase the ratio, but from the model of § 3.6, it remains below $10^{-3}$
down to
$10^{-3}$
down to $h=d$
).
$h=d$
).
By combining (3.1) and (3.2), we obtain an expression for the neck effective viscosity
 \begin{equation} \eta _{\textit{eff}} = -\frac {1}{3\pi } \frac {M\bigl(g - \ddot {Z}\bigr)}{\dot{h^2}}, \end{equation}
which can be computed from the post-pinch-off measurements of $M$
, obtained by weighing the detached drop, and from those of
$M$
, obtained by weighing the detached drop, and from those of $h(t)$
,
$h(t)$
, $\dot {h}(t)$
and
$\dot {h}(t)$
and $\ddot {Z}(t)$
, at all times. Importantly, the effective viscosity of the suspension is presumably not uniform within and around the neck, and this measurement must be interpreted as the neck effective resistance to flow.
$\ddot {Z}(t)$
, at all times. Importantly, the effective viscosity of the suspension is presumably not uniform within and around the neck, and this measurement must be interpreted as the neck effective resistance to flow.
3.3. Typical evolution of the neck effective viscosity
The typical evolution of $\eta _{\textit{eff}}$
is shown in figure 2(c), for
$\eta _{\textit{eff}}$
is shown in figure 2(c), for $\phi =0.60$
. It is presented as a function of the current neck diameter to highlight how the drop in
$\phi =0.60$
. It is presented as a function of the current neck diameter to highlight how the drop in $\eta _{\textit{eff}}$
occurs. Surprisingly, the decay is not sharp, but very progressive in magnitude. Consistently with the large volume fraction in the drop, the neck effective viscosity is initially much larger than the suspending liquid viscosity,
$\eta _{\textit{eff}}$
occurs. Surprisingly, the decay is not sharp, but very progressive in magnitude. Consistently with the large volume fraction in the drop, the neck effective viscosity is initially much larger than the suspending liquid viscosity, $\eta _{{0}}$
. As necking proceeds, it is found to decay by over two decades. On average (thick green line), the decay follows a close to exponential dependence on the current neck diameter, which can be fitted as follows:
$\eta _{{0}}$
. As necking proceeds, it is found to decay by over two decades. On average (thick green line), the decay follows a close to exponential dependence on the current neck diameter, which can be fitted as follows:
 \begin{equation} \eta _{\textit{eff}} \simeq \eta _{{t}}\Big (\frac {\eta _{{i}}}{\eta _{{t}}}\Big )^{\!h/h_{{0}}}, \end{equation}
and which is fully characterised by the initial and terminal effective viscosities, $\eta _{{i}}$
and
$\eta _{{i}}$
and $\eta _{{t}}$
, extrapolated in
$\eta _{{t}}$
, extrapolated in $h=h_{{0}}$
and
$h=h_{{0}}$
and $h=0$
, respectively. The terminal value,
$h=0$
, respectively. The terminal value, $\eta _{{t}}$
, is found to compare with the suspending liquid viscosity,
$\eta _{{t}}$
, is found to compare with the suspending liquid viscosity, $\eta _{{0}}$
. The reproducibility of the scaling is highlighted by its consistency across the eight experimental replicates (thin green lines).
$\eta _{{0}}$
. The reproducibility of the scaling is highlighted by its consistency across the eight experimental replicates (thin green lines).
3.4. Dependences of the neck effective viscosity
Dependence of the neck effective viscosity. (a) $\eta _{\textit{eff}}/\eta _{{0}}$
vs
$\eta _{\textit{eff}}/\eta _{{0}}$
vs $2h/d$
for different volume fractions (
$2h/d$
for different volume fractions ( $2h_{{0}}/d = 21$
). (b) For different drop sizes (
$2h_{{0}}/d = 21$
). (b) For different drop sizes ( $8.3d \lt 2h_{{0}} \lt 47d$
,
$8.3d \lt 2h_{{0}} \lt 47d$
, $\phi =0.60$
). Grey solid line:
$\phi =0.60$
). Grey solid line: $4\alpha ^2\phi (\phi -\phi _{{c}})^2h_{{0}}^2/3K$
, with dilatancy factor
$4\alpha ^2\phi (\phi -\phi _{{c}})^2h_{{0}}^2/3K$
, with dilatancy factor $\alpha =4$
, permeability
$\alpha =4$
, permeability $K=10^{-3}d^2$
and critical volume fraction
$K=10^{-3}d^2$
and critical volume fraction $\phi _{{c}}=0.58$
. (c) Initial and terminal effective viscosity vs
$\phi _{{c}}=0.58$
. (c) Initial and terminal effective viscosity vs $\phi$
. Grey solid line: steady uniform bulk-effective law,
$\phi$
. Grey solid line: steady uniform bulk-effective law, $\eta _{\textit{eff}}/\eta _{{0}}\sim (\phi _{{c}} -\phi )^{-2}$
.
$\eta _{\textit{eff}}/\eta _{{0}}\sim (\phi _{{c}} -\phi )^{-2}$
.

Figure 3. Long description
The image contains three line graphs labeled (a), (b), and (c). Graph (a) shows the value of neck effective viscosity (η_eff/η_0) for different volume fractions (ϕ) ranging from 0.550 to 0.605, plotted against the ratio of neck height to particle diameter (2h_0/d). Graph (b) illustrates the neck effective viscosity for different drop sizes (2h_0/d) ranging from 8.3 to 47, plotted against the same ratio. A grey solid line represents the equation 4α²ϕ(ϕ−ϕ_c)²h_0²/3K. Graph (c) compares the initial and terminal effective viscosity (η_i/η_0) against the volume fraction (ϕ), with a grey solid line representing the steady uniform bulk-effective law (ϕ_c−ϕ)−². The graphs show how these viscosities vary with different parameters, highlighting the influence of volume fraction and drop size on the suspension rheology.
The exponential decay in effective viscosity is robust. As shown in figure 3(a), which displays the mean value of $\eta _{\textit{eff}}$
between experimental replicates, all volume fractions investigated (
$\eta _{\textit{eff}}$
between experimental replicates, all volume fractions investigated ( $0.55\leq \phi \leq 0.605$
) show a close to exponential decay (the variations between experiment replicates are similar to those shown in figure 2(c) for
$0.55\leq \phi \leq 0.605$
) show a close to exponential decay (the variations between experiment replicates are similar to those shown in figure 2(c) for $\phi =0.60$
, except for
$\phi =0.60$
, except for $\phi =0.605$
, where fluctuations become larger towards pinch-off). However, the initial value
$\phi =0.605$
, where fluctuations become larger towards pinch-off). However, the initial value $\eta _{{i}}$
is not fixed, but seems to increase with increasing
$\eta _{{i}}$
is not fixed, but seems to increase with increasing $\phi$
. As reported in figure 3(b), the exponential decay in
$\phi$
. As reported in figure 3(b), the exponential decay in $\eta _{\textit{eff}}$
is also observed for different system sizes. We ranged
$\eta _{\textit{eff}}$
is also observed for different system sizes. We ranged $2h_{{0}}$
from 8.3 to
$2h_{{0}}$
from 8.3 to $47d$
, using syringes of different inner radius
$47d$
, using syringes of different inner radius $h_{{0}}$
, while keeping the same particles, suspending liquid, initial aspect ratio of the drop and volume fraction fixed at
$h_{{0}}$
, while keeping the same particles, suspending liquid, initial aspect ratio of the drop and volume fraction fixed at $\phi =0.60$
(thus changing the initial neck-to-particle size ratio,
$\phi =0.60$
(thus changing the initial neck-to-particle size ratio, $2h_{{0}}/d$
, and initial stress scale,
$2h_{{0}}/d$
, and initial stress scale, $\sim \kern-2pt \rho g h_{{0}}$
). For all
$\sim \kern-2pt \rho g h_{{0}}$
). For all $h_{{0}}/d$
, the decay in
$h_{{0}}/d$
, the decay in $\eta _{\textit{eff}}$
is close to exponential. However, here also, the initial value varies.
$\eta _{\textit{eff}}$
is close to exponential. However, here also, the initial value varies.
To highlight the change in the range of neck effective viscosity spanned during detachment, figure 3(c) reports the initial (triangles) and terminal values (circles) inferred by fitting the data with (3.4). For all $\phi$
and
$\phi$
and $h_{{0}}/d$
, the inferred terminal value
$h_{{0}}/d$
, the inferred terminal value $\eta _{{t}}$
remains around
$\eta _{{t}}$
remains around $\eta _{{0}}$
, without systematic dependence, which indicates that the neck effective viscosity progressively decreases towards the pure liquid value
$\eta _{{0}}$
, without systematic dependence, which indicates that the neck effective viscosity progressively decreases towards the pure liquid value $\eta _{{0}}$
. By contrast, the inferred initial value
$\eta _{{0}}$
. By contrast, the inferred initial value $\eta _{{i}}$
increases with increasing
$\eta _{{i}}$
increases with increasing $\phi$
(approximately fivefold between
$\phi$
(approximately fivefold between $\phi =0.55$
and 0.605), as well as with increasing
$\phi =0.55$
and 0.605), as well as with increasing $h_{{0}}/d$
(approximately tenfold between
$h_{{0}}/d$
(approximately tenfold between $2h_{{0}}/d=8.3$
and 47).
$2h_{{0}}/d=8.3$
and 47).
These dependences indicate that both the system size and history influence the resistance to flow. Indeed, the initial value $\eta _{{i}}$
depends on the
$\eta _{{i}}$
depends on the $h_{{0}}/d$
and does not follow the diverging law,
$h_{{0}}/d$
and does not follow the diverging law, $\sim \kern-1pt \eta _{{0}}(\phi _{{c}}-\phi )^{-2}$
, reported for steady uniform flows as
$\sim \kern-1pt \eta _{{0}}(\phi _{{c}}-\phi )^{-2}$
, reported for steady uniform flows as $\phi$
approaches
$\phi$
approaches $\phi _{{c}}$
(see figure 3
c, the law is plotted for the conventionally reported value
$\phi _{{c}}$
(see figure 3
c, the law is plotted for the conventionally reported value $\phi _{{c}}\approx 0.58$
(Guazzelli & Pouliquen Reference Guazzelli and Pouliquen2018); note that a similar divergency exponent,
$\phi _{{c}}\approx 0.58$
(Guazzelli & Pouliquen Reference Guazzelli and Pouliquen2018); note that a similar divergency exponent, $-2$
, and a similar critical value,
$-2$
, and a similar critical value, $\phi _{{c}} \simeq 0.575$
, are reported for extensional flow of frictional suspensions (Cheal & Ness Reference Cheal and Ness2018)). Furthermore, the experiments with different
$\phi _{{c}} \simeq 0.575$
, are reported for extensional flow of frictional suspensions (Cheal & Ness Reference Cheal and Ness2018)). Furthermore, the experiments with different $h_{{0}}/d$
show that
$h_{{0}}/d$
show that $\eta _{\textit{eff}}$
is not even a function of
$\eta _{\textit{eff}}$
is not even a function of $\phi$
and the current neck size
$\phi$
and the current neck size $h/d$
only. For fixed
$h/d$
only. For fixed $\phi$
and
$\phi$
and $h/d$
, the effective viscosity also depends on the previous necking dynamics (for instance, in figure 3
b, the effective viscosity at
$h/d$
, the effective viscosity also depends on the previous necking dynamics (for instance, in figure 3
b, the effective viscosity at $2h/d \approx 15$
is over one decade larger for
$2h/d \approx 15$
is over one decade larger for $2h_{{0}}/d = 21$
, than for
$2h_{{0}}/d = 21$
, than for $2h_{{0}}/d = 47$
). These evolutions of
$2h_{{0}}/d = 47$
). These evolutions of $\eta _{\textit{eff}}$
stress that the rheological response of the neck depends not only on finite size effects, but also on transient and presumably non-uniform deformation effects.
$\eta _{\textit{eff}}$
stress that the rheological response of the neck depends not only on finite size effects, but also on transient and presumably non-uniform deformation effects.
The last remark suggests an important role of the dilation of the particle phase, at least at the beginning of the necking. This idea can be tested with the observed dependence of $\eta _{{i}}$
on the system size. Indeed, for
$\eta _{{i}}$
on the system size. Indeed, for $\phi$
sufficiently above
$\phi$
sufficiently above $\phi _{{c}}$
, the initial neck deformation is expected to be slaved to dilation through a kinematic relation
$\phi _{{c}}$
, the initial neck deformation is expected to be slaved to dilation through a kinematic relation $\dot {\phi }/\phi \approx -\alpha (2\dot {\varepsilon })(\phi -\phi _{{c}})$
, where
$\dot {\phi }/\phi \approx -\alpha (2\dot {\varepsilon })(\phi -\phi _{{c}})$
, where $\alpha \approx 2\,$
–
$\alpha \approx 2\,$
– $4$
is a geometrical dilation factor (Pailha & Pouliquen Reference Pailha and Pouliquen2009), and
$4$
is a geometrical dilation factor (Pailha & Pouliquen Reference Pailha and Pouliquen2009), and $\dot {\varepsilon }= -\dot {h}^2/{h^2}$
is the strain rate. Because of incompressibility, the dilatant particle motion imposes an opposite suspending liquid flow through the pore network between particles. This Darcy-like relative flow builds up a negative pore pressure, which is set by the particle phase permeability
$\dot {\varepsilon }= -\dot {h}^2/{h^2}$
is the strain rate. Because of incompressibility, the dilatant particle motion imposes an opposite suspending liquid flow through the pore network between particles. This Darcy-like relative flow builds up a negative pore pressure, which is set by the particle phase permeability $K\approx 10^{-3}d^2$
, through
$K\approx 10^{-3}d^2$
, through $\boldsymbol{\nabla} ^2 {p_{{pore}}} \approx -(\eta _{{0}}/K)\dot {\phi }/\phi$
(where gradients in
$\boldsymbol{\nabla} ^2 {p_{{pore}}} \approx -(\eta _{{0}}/K)\dot {\phi }/\phi$
(where gradients in $\phi$
have been neglected following Jerome, Vandenberghe & Forterre Reference Jerome, Vandenberghe and Forterre2016; Jørgensen et al. Reference Jørgensen, Forterre and Lhuissier2020). Identifying the Darcy flow scale with the neck radius
$\phi$
have been neglected following Jerome, Vandenberghe & Forterre Reference Jerome, Vandenberghe and Forterre2016; Jørgensen et al. Reference Jørgensen, Forterre and Lhuissier2020). Identifying the Darcy flow scale with the neck radius $h_{{0}}$
, we obtain
$h_{{0}}$
, we obtain ${p_{{pore}}} \approx -\eta _{{0}} (h_{{0}}^2/K)\dot {\phi }/\phi$
. Last, assuming the volume dissipation in the suspension,
${p_{{pore}}} \approx -\eta _{{0}} (h_{{0}}^2/K)\dot {\phi }/\phi$
. Last, assuming the volume dissipation in the suspension, $3\eta _{\textit{eff}}\dot {\varepsilon }^2$
, is dominated by the work of dilation against the pore pressure,
$3\eta _{\textit{eff}}\dot {\varepsilon }^2$
, is dominated by the work of dilation against the pore pressure, $-\dot {\phi }{p_{{pore}}}$
, we obtain that the initial effective viscosity should follow
$-\dot {\phi }{p_{{pore}}}$
, we obtain that the initial effective viscosity should follow
 \begin{equation} \frac {\eta _{{i}}}{\eta _{{0}}} \approx \frac {4}{3}\alpha ^2\phi (\phi -\phi _{{c}})^2\frac {h_{{0}}^2}{K} \approx 1.3\times 10^3\alpha ^2\phi (\phi -\phi _{{c}})^2\left (\frac {h_{{0}}}{d}\right )^2\!. \end{equation}
The prediction is expected to be valid at the onset of motion (for a deformation $\lesssim 1$
, when the volume fraction is still close to the initial value). It is compared with measurements in figure 3(b). Using
$\lesssim 1$
, when the volume fraction is still close to the initial value). It is compared with measurements in figure 3(b). Using $\phi _{{c}}=0.58$
and a dilatancy prefactor
$\phi _{{c}}=0.58$
and a dilatancy prefactor $\alpha =4$
within the range 2–4 reported previously (Pailha & Pouliquen Reference Pailha and Pouliquen2009; Jerome et al. Reference Jerome, Vandenberghe and Forterre2016), equation (3.5) captures reasonably well the magnitude and increase of
$\alpha =4$
within the range 2–4 reported previously (Pailha & Pouliquen Reference Pailha and Pouliquen2009; Jerome et al. Reference Jerome, Vandenberghe and Forterre2016), equation (3.5) captures reasonably well the magnitude and increase of $\eta _{{i}}$
with
$\eta _{{i}}$
with $h_{{0}}/d$
(albeit for the largest system size, where the measured value is somewhat below). This agreement suggests that for
$h_{{0}}/d$
(albeit for the largest system size, where the measured value is somewhat below). This agreement suggests that for $\phi$
above
$\phi$
above $\phi _{{c}}$
the initial detachment dynamics is essentially slaved to the viscosity-limited particle dilation.
$\phi _{{c}}$
the initial detachment dynamics is essentially slaved to the viscosity-limited particle dilation.
The above description is limited to the initial deformation and effective viscosity $\eta _{{i}}$
. Nonetheless, it is important because we will see below (§ 3.6) that
$\eta _{{i}}$
. Nonetheless, it is important because we will see below (§ 3.6) that $\eta _{{i}}$
sets the overall breakup duration. As for the subsequent exponential decay of
$\eta _{{i}}$
sets the overall breakup duration. As for the subsequent exponential decay of $\eta _{\textit{eff}}$
, a more involved analysis is needed, which would consider large accumulated strains (Athani et al. Reference Athani, Metzger, Forterre and Mari2022) and non-uniformity around the neck. These difficulties prevent us from providing a quantitative model, but we present below additional local observations, which highlight the qualitative evolution of the suspension during pinching.
$\eta _{\textit{eff}}$
, a more involved analysis is needed, which would consider large accumulated strains (Athani et al. Reference Athani, Metzger, Forterre and Mari2022) and non-uniformity around the neck. These difficulties prevent us from providing a quantitative model, but we present below additional local observations, which highlight the qualitative evolution of the suspension during pinching.
3.5. Symmetry breaking and capillary collapse
Symmetry breaking and capillary interface. (a–b) Asymmetry of the pinching ( $\phi =0.60$
). (a) Surface velocity field. Main: absolute velocity
$\phi =0.60$
). (a) Surface velocity field. Main: absolute velocity $\boldsymbol{u}$
. Close up: deviation
$\boldsymbol{u}$
. Close up: deviation $\boldsymbol{u} - \langle u\rangle |_z\boldsymbol{e_z}$
to extensional flow. (b) Average evolution of the neck apparent off-centring for different volume fractions (5 experiments each). (c) Mid-plane image of the drop, obtained by three-phase refractive-index matching, showing the suspension conformation and the capillary meniscus mid-plane curvatures
$\boldsymbol{u} - \langle u\rangle |_z\boldsymbol{e_z}$
to extensional flow. (b) Average evolution of the neck apparent off-centring for different volume fractions (5 experiments each). (c) Mid-plane image of the drop, obtained by three-phase refractive-index matching, showing the suspension conformation and the capillary meniscus mid-plane curvatures $\kappa _\parallel$
. The suspension detaches in a lighter, non-miscible liquid. The suspending liquid is fluorescent, the other two phases appear as black (
$\kappa _\parallel$
. The suspension detaches in a lighter, non-miscible liquid. The suspending liquid is fluorescent, the other two phases appear as black ( $\phi = 0.60$
,
$\phi = 0.60$
, $d = 1025\,\unicode {x03BC}$
m). (d) Meniscus curvature, at the neck and bottom of the drop, vs
$d = 1025\,\unicode {x03BC}$
m). (d) Meniscus curvature, at the neck and bottom of the drop, vs $2h$
(symbols,
$2h$
(symbols, $\kappa =2\kappa _\parallel$
, bars,
$\kappa =2\kappa _\parallel$
, bars, $\kappa =\kappa _\parallel$
). Pink line: critical total curvature
$\kappa =\kappa _\parallel$
). Pink line: critical total curvature $\kappa _{{c}} \simeq 6.6/d$
(see characterisation in § 2), above which capillary confinement collapses.
$\kappa _{{c}} \simeq 6.6/d$
(see characterisation in § 2), above which capillary confinement collapses.

Figure 4. Long description
The image contains four subfigures related to the breaking-up of liquid jets loaded with solid particles. Subfigure (a) shows the surface velocity field and asymmetry of pinching. The main part of the subfigure displays the absolute velocity, while the close-up shows the deviation to extensional flow. Subfigure (b) displays the average evolution of the neck apparent off-centring for different volume fractions, with five experiments conducted for each volume fraction. Subfigure (c) presents a mid-plane image of the drop, obtained by three-phase refractive-index matching, showing the suspension conformation and capillary meniscus mid-plane curvatures. The suspension detaches in a lighter, non-miscible liquid. The suspending liquid is fluorescent, while the other two phases appear as black. Subfigure (d) illustrates the meniscus curvature at the neck and bottom of the drop versus a variable, with symbols representing the data points and bars indicating the uncertainty. A pink line represents the critical total curvature above which capillary confinement collapses.
A first important observation is that deviations to axial symmetry increase as necking develops. This deviation can be evidenced in the surface velocity field (obtained by correlating particle patterns over the visible drop surface, see typical field in figure 4
a). The deviation $\boldsymbol{u} - \langle \boldsymbol{u}\boldsymbol{\cdot }\boldsymbol{e_z}\rangle |_z\boldsymbol{e_z}$
to a purely vertical
$\boldsymbol{u} - \langle \boldsymbol{u}\boldsymbol{\cdot }\boldsymbol{e_z}\rangle |_z\boldsymbol{e_z}$
to a purely vertical $z$
-dependent flow shows an asymmetric zip-like structure, akin to a crack-opening flow (see inset). This flow is associated with an increasingly asymmetric neck shape, as revealed by the increasing off-centring
$z$
-dependent flow shows an asymmetric zip-like structure, akin to a crack-opening flow (see inset). This flow is associated with an increasingly asymmetric neck shape, as revealed by the increasing off-centring $\delta$
between the neck and nozzle axes. The off-centring is realisation-dependent (and our side observation only provides one out of two off-centring components), but measurements in figure 4(b) show it is on average increasing with decreasing
$\delta$
between the neck and nozzle axes. The off-centring is realisation-dependent (and our side observation only provides one out of two off-centring components), but measurements in figure 4(b) show it is on average increasing with decreasing $h$
as well as with increasing
$h$
as well as with increasing $\phi$
.
$\phi$
.
Further information can be obtained about the actual conformation of the suspension at the neck by implementing a transparent set-up offering undistorted visualisation inside the drop. This set-up (detailed in § 2) is similar to the original one, except that the suspension drop detaches inside a lighter, immiscible and low-viscosity liquid bath, rather than air. This allows us to match the three phases’ refractive indices and obtain undistorted images in a plane illuminated with an (undistorted) laser sheet. Importantly, the detachment conditions and the suspension are similar to the in-air set-up (initially viscous detachment, particles wetted by suspending liquid, $\phi = 0.60$
,
$\phi = 0.60$
, $h_{{0}}/d=11.7$
and similar Bond numbers, see § 2). A typical snapshot of the drop mid-plane is shown in figure 4(c), for
$h_{{0}}/d=11.7$
and similar Bond numbers, see § 2). A typical snapshot of the drop mid-plane is shown in figure 4(c), for $2h/d\simeq 3$
, with the dyed suspending liquid appearing as bright, the other two phases as black (see also supplementary movie 2). It reveals that the suspension changes along the drop. It seems more diluted at the neck than at the bottom. Concomitantly, the capillary menisci between the particles at the drop surface are much more curved inward at the neck, which indicates a much more negative liquid pressure there. While sufficiently accurate local volume fraction measurements cannot be achieved because of the small number of particles involved and limitations of particle edge detection, we report in figure 4(b) the evolution of the maximal meniscus curvature observed in the neck region (red symbols) and at the bottom (blue ones). The value at the neck continuously increases as pinching proceeds, and rapidly compares with the critical curvature,
$2h/d\simeq 3$
, with the dyed suspending liquid appearing as bright, the other two phases as black (see also supplementary movie 2). It reveals that the suspension changes along the drop. It seems more diluted at the neck than at the bottom. Concomitantly, the capillary menisci between the particles at the drop surface are much more curved inward at the neck, which indicates a much more negative liquid pressure there. While sufficiently accurate local volume fraction measurements cannot be achieved because of the small number of particles involved and limitations of particle edge detection, we report in figure 4(b) the evolution of the maximal meniscus curvature observed in the neck region (red symbols) and at the bottom (blue ones). The value at the neck continuously increases as pinching proceeds, and rapidly compares with the critical curvature, $\kappa _{{c}}\simeq 6.6/d$
, at which menisci break down and allow the outer phase to permeate the suspension (the value
$\kappa _{{c}}\simeq 6.6/d$
, at which menisci break down and allow the outer phase to permeate the suspension (the value $\kappa _{{c}} d\simeq 6.6$
is experimentally characterised on a flat, non-moving, concentrated suspension interface, see § 2).
$\kappa _{{c}} d\simeq 6.6$
is experimentally characterised on a flat, non-moving, concentrated suspension interface, see § 2).
These local observations suggest that the solid phase at the neck dilutes gradually. Concomitantly, deviations to axial symmetry grow and the outer phase presumably permeates the suspension at some point. All these evolutions are expected to decrease the neck resistance to flow, but it remains unclear which contribution dominates. In spite of this limitation, we now turn to see how the detachment dynamics can actually be modelled if the observed rheological evolution at the neck is taken as granted, and how the breakup duration depends on $\eta _{{i}}$
.
$\eta _{{i}}$
.
3.6. Model of the detachment dynamics
Model of the pinching dynamics. (a) The almost constant cone angle $2\beta$
of the pinching drop relates the drop and necking accelerations,
$2\beta$
of the pinching drop relates the drop and necking accelerations, $\ddot {Z}$
and
$\ddot {Z}$
and $\ddot {h}$
(
$\ddot {h}$
( $\phi = 0.60$
). (b) Relative neck radius vs relative time to breakup. Thick solid lines: solution of (3.7), with
$\phi = 0.60$
). (b) Relative neck radius vs relative time to breakup. Thick solid lines: solution of (3.7), with $\eta _{{i}}/\eta _{{0}}=743$
, for different inertial numbers (grey lines,
$\eta _{{i}}/\eta _{{0}}=743$
, for different inertial numbers (grey lines, $\mathcal{I}\!=\!0$
,
$\mathcal{I}\!=\!0$
, $6.4\times 10^{-8}$
and
$6.4\times 10^{-8}$
and $4.0\times 10^{-5}$
, from left to right), including the experimental value (green line,
$4.0\times 10^{-5}$
, from left to right), including the experimental value (green line, $\mathcal{I}\!=\!1.6\times 10^{-6}$
). Thin solid lines: experiments (same data as in figure 2). Inset: breakup time obtained experimentally (black-outlined circles) and from the model fed with values of table 1 (red-outlined circles) vs
$\mathcal{I}\!=\!1.6\times 10^{-6}$
). Thin solid lines: experiments (same data as in figure 2). Inset: breakup time obtained experimentally (black-outlined circles) and from the model fed with values of table 1 (red-outlined circles) vs $\phi$
.
$\phi$
.

Figure 5. Long description
The image contains two main parts. On the left, labeled as (a), three diagrams show the pinching process of a drop with varying cone angles. The diagrams highlight the relationship between the drop and necking accelerations, with annotations indicating angles and directions. On the right, labeled as (b), a log-log plot displays the relative neck radius versus relative time to breakup. The plot includes thick solid lines representing the solution of a specific equation for different inertial numbers, with colors ranging from grey to green. Thin solid lines represent experimental data. An inset within this plot shows the breakup time obtained experimentally and from the model versus a variable, with black-outlined and red-outlined circles representing the data points.
From the observed evolution of the neck effective viscosity we propose a simplified effective model for the drop detachment dynamics, which accounts for inertial effects, by taking advantage of the close-to-conical shape of the detaching drop. Indeed, for a drop breaking with a double cone shape with constant half-angle $\beta$
(see figure 5
a), the vertical velocity
$\beta$
(see figure 5
a), the vertical velocity $\dot {Z}$
of the solid-like detaching part must relate to the necking speed
$\dot {Z}$
of the solid-like detaching part must relate to the necking speed $-\dot {h}$
through
$-\dot {h}$
through
 \begin{equation} \dot {Z} \approx -\frac {\dot {h}}{\tan \beta }. \end{equation}
In this case, the vertical acceleration of the drop, $\ddot {Z}$
, also relates to the neck radius acceleration,
$\ddot {Z}$
, also relates to the neck radius acceleration, $-\ddot {h}$
, through
$-\ddot {h}$
, through $\ddot {Z} \approx -\ddot {h}/\tan \beta$
. Together with the vertical momentum balance at the neck, (3.1,3.2), this allows us to close the problem and obtain the following evolution equation for the neck radius:
$\ddot {Z} \approx -\ddot {h}/\tan \beta$
. Together with the vertical momentum balance at the neck, (3.1,3.2), this allows us to close the problem and obtain the following evolution equation for the neck radius:
 \begin{align} \mathcal{I}\frac {\tau ^2}{h_{{0}}}\ddot {h} = -1 - \left (\frac {\eta _{{i}}}{\eta _{{0}}}\right )^{\!h/h_{{0}}-1}\!\frac {\tau }{h_{{0}}^2}\dot {h^2},&& \text{with}&& \tau = 3\pi \frac {\eta _{{i}}h_{{0}}^2}{\textit{Mg}},\qquad \mathcal{I} = \frac {1}{\tan \hspace {-.08em}\beta }\frac {h_{{0}}}{g\tau ^2}. \end{align}
In this equation, the left-hand term corresponds to the drop (vertical) inertia. The other two correspond, from left to right, to gravity and to the viscous stress, which involves the effective viscosity $\eta _{\textit{eff}}/\eta _{{i}} = (\eta _{{i}}/\eta _{{t}})^{h/h_{{0}}-1} \simeq (\eta _{{i}}/\eta _{{0}})^{h/h_{{0}}-1}$
, where we have used the experimental observation
$\eta _{\textit{eff}}/\eta _{{i}} = (\eta _{{i}}/\eta _{{t}})^{h/h_{{0}}-1} \simeq (\eta _{{i}}/\eta _{{0}})^{h/h_{{0}}-1}$
, where we have used the experimental observation $\eta _{{t}}\simeq \eta _{{0}}$
. The visco-gravity time scale
$\eta _{{t}}\simeq \eta _{{0}}$
. The visco-gravity time scale $\tau$
is the typical viscous detachment time, based on the initial viscosity
$\tau$
is the typical viscous detachment time, based on the initial viscosity $\eta _{{i}}$
. Last, the inertial number
$\eta _{{i}}$
. Last, the inertial number $\mathcal{I} \sim \rho ^2 \eta _{{i}}^2/gh_{{0}}^3$
(inverse Galilei number) embeds the initial magnitude of inertia and determines from which time the acceleration eventually alleviates the drop weight.
$\mathcal{I} \sim \rho ^2 \eta _{{i}}^2/gh_{{0}}^3$
(inverse Galilei number) embeds the initial magnitude of inertia and determines from which time the acceleration eventually alleviates the drop weight.
Mean measured quantities ( $\eta _{{i}}/\eta _{{0}}$
,
$\eta _{{i}}/\eta _{{0}}$
, $\beta$
) and computed parameters (
$\beta$
) and computed parameters ( $\tau$
,
$\tau$
, $\mathcal{I}$
,
$\mathcal{I}$
, $\eta _{\textit{eff}}(2h=\!10\,\textrm {mm})/\eta _{{0}}$
,
$\eta _{\textit{eff}}(2h=\!10\,\textrm {mm})/\eta _{{0}}$
, $\tau _{10\,\text{mm}}$
,
$\tau _{10\,\text{mm}}$
, $t_{\textit{break},10\,\textrm{mm}}$
) for the different volume fractions (
$t_{\textit{break},10\,\textrm{mm}}$
) for the different volume fractions ( $d=570\,\unicode {x03BC}$
m,
$d=570\,\unicode {x03BC}$
m, $2h_{{0}}=12.03\,$
mm,
$2h_{{0}}=12.03\,$
mm, $\eta _{{0}}=2.8$
Pa s,
$\eta _{{0}}=2.8$
Pa s, $M=1.50$
g). The last three values are for comparison with the experimental breakup time
$M=1.50$
g). The last three values are for comparison with the experimental breakup time $t_{\textit{break},10\,\textrm{mm}}$
, which is measured from
$t_{\textit{break},10\,\textrm{mm}}$
, which is measured from $2h=10\,$
mm. They are computed as
$2h=10\,$
mm. They are computed as $\eta _{\textit{eff}}(2h=\!10\,\textrm {mm})/\eta _{{0}} = (\eta _{{i}}/\eta _{{0}})^{10\,\textrm {mm}/2h_{{0}}}$
using (3.4), and by evaluating equations (3.7) and (3.8) for
$\eta _{\textit{eff}}(2h=\!10\,\textrm {mm})/\eta _{{0}} = (\eta _{{i}}/\eta _{{0}})^{10\,\textrm {mm}/2h_{{0}}}$
using (3.4), and by evaluating equations (3.7) and (3.8) for $\tau$
and
$\tau$
and $t_{\text{break}}$
, with
$t_{\text{break}}$
, with $2h_{{0}}=10\,$
mm and
$2h_{{0}}=10\,$
mm and $\eta _{{i}}=\eta _{\textit{eff}}(2h=\!10\,\textrm {mm})$
, respectively.
$\eta _{{i}}=\eta _{\textit{eff}}(2h=\!10\,\textrm {mm})$
, respectively.

Table 1. Long description
The table presents mean measured quantities and computed parameters for various volume fractions. It includes columns for volume fraction, ratio of viscosities, contact angle, surface tension, and inertial number. Additionally, it shows the ratio of viscosity to density, breakup time at 10 millimeters, and breakup time at 10 millimeters for different volume fractions. The data is organized in rows, each representing a specific volume fraction with corresponding values for the measured and computed parameters. Notable trends include variations in inertial numbers and breakup times across different volume fractions, providing insights into the dynamics of pinching drops.
Figure 5(b) represents integrations of (3.7) for small inertial numbers ( $\mathcal{I}\ll 1$
), which are relevant for highly concentrated drops. Initially, the dynamics follows the purely viscous evolution (
$\mathcal{I}\ll 1$
), which are relevant for highly concentrated drops. Initially, the dynamics follows the purely viscous evolution ( $\mathcal{I}=0$
, given by
$\mathcal{I}=0$
, given by $[1+(kh/h_{{0}}-1)\mathrm{e}^{kh/h_{{0}}}]/[1+(k-1)\mathrm{e}^{k}]=1-t/t_{\text{break}}$
, with
$[1+(kh/h_{{0}}-1)\mathrm{e}^{kh/h_{{0}}}]/[1+(k-1)\mathrm{e}^{k}]=1-t/t_{\text{break}}$
, with $k=\ln (\eta _{{i}}/\eta _{{0}})$
and
$k=\ln (\eta _{{i}}/\eta _{{0}})$
and $t_{\text{break}}/\tau =2(k-1+\mathrm{e}^{-k})/k^2$
). However, as pinching proceeds, inertia eventually matters. Acceleration alleviates the drop weight, and pinching becomes comparatively slower, with a ballistic terminal evolution
$t_{\text{break}}/\tau =2(k-1+\mathrm{e}^{-k})/k^2$
). However, as pinching proceeds, inertia eventually matters. Acceleration alleviates the drop weight, and pinching becomes comparatively slower, with a ballistic terminal evolution $h\propto t_{\text{break}}-t$
. The larger the value of
$h\propto t_{\text{break}}-t$
. The larger the value of $\mathcal{I}$
, the earlier the viscous to inertial cross-over. For large viscosity ratio (
$\mathcal{I}$
, the earlier the viscous to inertial cross-over. For large viscosity ratio ( $\eta _{{i}}/\eta _{{0}}\gg 1$
), this cross-over takes place when
$\eta _{{i}}/\eta _{{0}}\gg 1$
), this cross-over takes place when $h/h_{{0}}\sim k^{-1}\ln (\mathcal{I} k^3\mathrm{e}^{2k}/4)$
. For our experiments this happens for
$h/h_{{0}}\sim k^{-1}\ln (\mathcal{I} k^3\mathrm{e}^{2k}/4)$
. For our experiments this happens for $h$
not much below
$h$
not much below $h_{{0}}$
, which is why inertia must be considered. However, because of the tremendous acceleration of the dynamics, this only corresponds to the very last instants before pinch-off. Therefore, while the final breakup dynamics is largely influenced by inertia, the total breakup duration is almost undistinguishable from the viscous limit
$h_{{0}}$
, which is why inertia must be considered. However, because of the tremendous acceleration of the dynamics, this only corresponds to the very last instants before pinch-off. Therefore, while the final breakup dynamics is largely influenced by inertia, the total breakup duration is almost undistinguishable from the viscous limit
 \begin{align} \frac {t_{\text{break}}}{\tau }=2\frac {\ln \eta _{{i}}/\eta _{{0}}-1+\eta _{{0}}/\eta _{{i}}}{(\ln \eta _{{i}}/\eta _{{0}})^2},&& (\mathcal{I}\ll 1), \end{align}
which converges to $2(\ln \eta _{{i}}/\eta _{{0}})^{-1}$
, for
$2(\ln \eta _{{i}}/\eta _{{0}})^{-1}$
, for $\eta _{{i}}\gg \eta _{{0}}$
.
$\eta _{{i}}\gg \eta _{{0}}$
.
As shown in figure 5(b) with $\phi =0.60$
, this simple model captures the average evolution of
$\phi =0.60$
, this simple model captures the average evolution of $h$
towards pinch-off. The integration of (3.7), with the experimental values
$h$
towards pinch-off. The integration of (3.7), with the experimental values $\eta _{{i}}/\eta _{{0}}=743$
and
$\eta _{{i}}/\eta _{{0}}=743$
and $\mathcal{I}=1.6\times 10^{-6}$
matches the ensemble evolution across the different replicates of the experiment (
$\mathcal{I}=1.6\times 10^{-6}$
matches the ensemble evolution across the different replicates of the experiment ( $\mathcal{I}$
is computed from the weighted drop mass,
$\mathcal{I}$
is computed from the weighted drop mass, $M=1.5\,$
g, and the apparent neck angle,
$M=1.5\,$
g, and the apparent neck angle, $\beta = 9.4^\circ$
, measured on images before pinch-off. A similar value,
$\beta = 9.4^\circ$
, measured on images before pinch-off. A similar value, $\textrm {atan}(-\dot {h}/\dot {Z}) \sim 10^\circ$
, is obtained from the instantaneous velocity ratio
$\textrm {atan}(-\dot {h}/\dot {Z}) \sim 10^\circ$
, is obtained from the instantaneous velocity ratio $-\dot {h}/\dot {Z}$
). From the experimental values of
$-\dot {h}/\dot {Z}$
). From the experimental values of $\eta _{{i}}$
and
$\eta _{{i}}$
and $\beta$
reported in table 1, the model also recovers the breakup time across the different volume fractions
$\beta$
reported in table 1, the model also recovers the breakup time across the different volume fractions $\phi$
. Since the experimental value,
$\phi$
. Since the experimental value, $t_{\textit{break},10\,\textrm{mm}}$
, is measured from
$t_{\textit{break},10\,\textrm{mm}}$
, is measured from $2h=10$
mm, expression (3.8) for
$2h=10$
mm, expression (3.8) for $t_{\text{break}}$
must be evaluated with the neck size and effective viscosity at
$t_{\text{break}}$
must be evaluated with the neck size and effective viscosity at $2h=10\,$
mm. This is done by using (3.4) to express
$2h=10\,$
mm. This is done by using (3.4) to express $\eta _{\textit{eff}}(2h=\!10\,\textrm {mm}) = \eta _{{0}}(\eta _{{i}}/\eta _{{0}})^{10\,\textrm {mm}/2h_{{0}}}$
and by evaluating (3.7) and (3.8) with
$\eta _{\textit{eff}}(2h=\!10\,\textrm {mm}) = \eta _{{0}}(\eta _{{i}}/\eta _{{0}})^{10\,\textrm {mm}/2h_{{0}}}$
and by evaluating (3.7) and (3.8) with $2h_{{0}}=10\,$
mm and
$2h_{{0}}=10\,$
mm and $\eta _{{i}}=\eta _{\textit{eff}}(2h=\!10\,\textrm {mm})$
. The computed breakup times, reported in table 1 and figure 5(b), are found to match well the magnitude and trend of the experimental data. Part of this match is natural, since the model is fed with the observed effective decay in viscosity. Nonetheless, the simplified geometric input of the model (the relation (3.6) between
$\eta _{{i}}=\eta _{\textit{eff}}(2h=\!10\,\textrm {mm})$
. The computed breakup times, reported in table 1 and figure 5(b), are found to match well the magnitude and trend of the experimental data. Part of this match is natural, since the model is fed with the observed effective decay in viscosity. Nonetheless, the simplified geometric input of the model (the relation (3.6) between $\ddot {Z}$
and
$\ddot {Z}$
and $\ddot {h}$
) allows us to account for inertia and explains that, for the present case of a low inertial number
$\ddot {h}$
) allows us to account for inertia and explains that, for the present case of a low inertial number $\mathcal{I}$
, while inertia largely influences the late dynamics, the breakup time is essentially set by the initial viscous time scale
$\mathcal{I}$
, while inertia largely influences the late dynamics, the breakup time is essentially set by the initial viscous time scale $\tau$
and the logarithmic viscous correction of (3.8).
$\tau$
and the logarithmic viscous correction of (3.8).
4. Conclusion
The above observations reveal that a large viscous drop of highly concentrated suspension ( $\phi \approx \phi _{{c}}$
) pinches with a strong and localised decrease in the resistance to flow. This leads to a roughly double conical neck shape, with a short breakup length (relative to a similarly viscous regular liquid), and a catastrophically accelerated breakup. While localisation is similar to that reported for moderately concentrated suspensions (
$\phi \approx \phi _{{c}}$
) pinches with a strong and localised decrease in the resistance to flow. This leads to a roughly double conical neck shape, with a short breakup length (relative to a similarly viscous regular liquid), and a catastrophically accelerated breakup. While localisation is similar to that reported for moderately concentrated suspensions ( $0.2\lesssim \phi \lesssim 0.5$
), the temporal evolution is qualitatively different, showing no initial Newtonian-like behaviour. In contrast, the effective viscosity at the neck
$0.2\lesssim \phi \lesssim 0.5$
), the temporal evolution is qualitatively different, showing no initial Newtonian-like behaviour. In contrast, the effective viscosity at the neck $\eta _{\textit{eff}}$
decays close to exponentially with the current neck size, from an initial value
$\eta _{\textit{eff}}$
decays close to exponentially with the current neck size, from an initial value $\eta _{{i}}$
increasing with
$\eta _{{i}}$
increasing with $\phi$
and with the system size
$\phi$
and with the system size $h_{{0}}/d$
, down to a terminal value approaching the suspending liquid viscosity
$h_{{0}}/d$
, down to a terminal value approaching the suspending liquid viscosity $\eta _{{0}}$
. For
$\eta _{{0}}$
. For $\phi \gt \phi _{{c}}$
, the magnitude and dependence of
$\phi \gt \phi _{{c}}$
, the magnitude and dependence of $\eta _{{i}}/\eta _{{0}}\sim 10^3(\phi _{{c}}-\phi )^2(h_{{0}}/d)^2$
suggest that the early dynamics is slaved to viscosity-limited particle dilation. Together with the conical neck shape it selects, this rheological evolution controls the long early viscous acceleration, which sets the breakup duration, before inertia eventually dictates the late ballistic pinch-off.
$\eta _{{i}}/\eta _{{0}}\sim 10^3(\phi _{{c}}-\phi )^2(h_{{0}}/d)^2$
suggest that the early dynamics is slaved to viscosity-limited particle dilation. Together with the conical neck shape it selects, this rheological evolution controls the long early viscous acceleration, which sets the breakup duration, before inertia eventually dictates the late ballistic pinch-off.
Naturally, important questions remain. First, regarding the dependences of the initial viscosity for $\phi \lt \phi _{{c}}$
and how these recover the early viscous regime reported for lower volume fractions. Second, regarding the mechanism behind the progressive decay in the resistance to flow. Such mechanism must involve a reorganisation of the liquid and/or particle phase around the neck. Qualitative observations suggest the particle phase at the neck progressively dilutes, and is presumably permeated by the outer phase, while departing from axial symmetry, but a quantification of these effects remains to be done.
$\phi \lt \phi _{{c}}$
and how these recover the early viscous regime reported for lower volume fractions. Second, regarding the mechanism behind the progressive decay in the resistance to flow. Such mechanism must involve a reorganisation of the liquid and/or particle phase around the neck. Qualitative observations suggest the particle phase at the neck progressively dilutes, and is presumably permeated by the outer phase, while departing from axial symmetry, but a quantification of these effects remains to be done.
Supplementary movies
Supplementary movies are available at https://doi.org/10.1017/jfm.2026.11678.
Funding
This work was financially supported by the Agence Nationale de la Recherche (grant ANR-21-CE30-0015-01).
Declaration of interests
The authors report no conflict of interest.
Data availability statement
Data available upon request.

 ϕ=0.60
 η0=2.8
 2h0/d=21
 ϕ=0
ϕ=0 η=40
η=40 0.55<ϕ<0.605
 t=0
t=0 2h=10
2h=10 tbreak,10mm
 tbreak−t=41
 4.5
4.5 ϕ=0.60
 tbreak
 2h≈0.5d
 ηeff
ηeff η0
η0 2h
2h d
d ηeff=ηt(ηi/ηt)h/h0
 ηi≃743η0
 ηt≃0.84η0
 ηeff/η0
 2h/d
2h/d 2h0/d=21
 8.3d<2h0<47d
 ϕ=0.60
 4α2ϕ(ϕ−ϕc)2h02/3K
 α=4
α=4 K=10−3d2
 ϕc=0.58
 ϕ
ϕ ηeff/η0∼(ϕc−ϕ)−2
 ϕ=0.60
 u
u u−⟨u⟩|zez
 κ∥
κ∥ ϕ=0.60
 d=1025μ
 2h
2h κ=2κ∥
κ=2κ∥ κ=κ∥
κ=κ∥ κc≃6.6/d
 2β
2β Z¨
Z¨ h¨
h¨ ϕ=0.60
 ηi/η0=743
 I=0
I=0 6.4×10⁻⁸
 4.0×10⁻⁵
 I=1.6×10⁻⁶
 ϕ
ϕ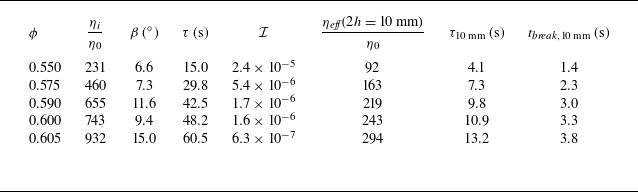
 ηi/η0
ηi/η0 β
β τ
τ I
I ηeff(2h=10mm)/η0
 τ10mm
τ10mm tbreak,10mm
 d=570μ
 2h0=12.03
 η0=2.8
 M=1.50
 tbreak,10mm
 2h=10
2h=10 ηeff(2h=10mm)/η0=(ηi/η0)10mm/2h0
 τ
τ tbreak
 2h0=10
 ηi=ηeff(2h=10mm)


 Open access

