


Statement of Research Significance
Research Question(s) or Topic(s): The present study serves as the first comprehensive meta-analytic review examining the magnitude of the relationship between United States (U.S.) acculturation and neuropsychological functioning. Main Findings: Findings (k = 19 articles, 18 included in quantitative analyses) revealed a small to medium, statistically significant positive relationship between greater U.S. acculturation and better performances on tests of neuropsychological functioning. Language of testing emerged as a significant moderator, with studies using English yielding stronger effect sizes compared to those that did not. Study Contributions: This comprehensive meta-analytic review provides an overview of the growing literature examining the relationship between U.S. acculturation and neuropsychological functioning. Results indicate that test performances may vary depending on the methodologies used and samples represented in each study. Additionally, the current review provides targeted recommendations for incorporating acculturation assessment into clinical and research practice to assist in clinical decision-making with diverse populations.
Introduction
Acculturation is the process of individual change that occurs through extended contact with different cultures (Zea et al., Reference Zea, Asner-Self, Birman and Buki2003). It is a multidimensional process that occurs across various domains, including behavioral changes such as language usage, media consumption, attitudes, and beliefs. Most acculturation research has focused on immigrant, refugee, and asylum-seeking populations who bring languages, cultural influences, and values that may differ from those found within their new country of residence (Schwartz et al., Reference Schwartz, Unger, Zamboanga and Szapocznik2010). Acculturation theories first conceptualized acculturation as a unidimensional process, such that the retention of the heritage culture and the acquisition of the new receiving culture exist on opposite ends of a continuum. This unidimensional approach assumed that as immigrants adopted the practices, values, and beliefs of the new receiving culture, they were expected to abandon those from their heritage culture. However, recent cross-cultural research advocates for a more nuanced, multidimensional framework for the understanding of acculturation. Modern multidimensional approaches to understanding acculturation (e.g., Berry Reference Berry1997) represent a significant advancement from the unidimensional approach, highlighting various categories of acculturation, including assimilation, separation, integration, and marginalization (Berry Reference Berry1997). Despite this progress, theoretical criticisms still persist regarding the lack of consideration of individual factors such as countries of origin and settlement, ethnocultural group, or type of migrant (e.g., indigenous peoples, refugee, voluntary migrant, sojourner; Schwartz et al., Reference Schwartz, Unger, Zamboanga and Szapocznik2010).
Acculturation has been measured in a variety of ways within the neuropsychology literature, ranging from the use of language proficiency measures to proxy measures of acculturation (e.g., years of U.S. residency, first vs. second generation immigrant status), or one of numerous scales of acculturation (e.g., African-American Acculturation Scale, Abbreviated Multidimensional Acculturation Scale (AMAS), Acculturation Rating Scale for Mexican Americans; Ardila, Reference Ardila2007; Boone et al., Reference Boone, Victor, Wen, Razani and Pontón2007; Kang, Reference Kang2006; Manly et al., Reference Manly, Byrd, Touradji and Stern2004). For a review of various acculturation scales that have been used in the neuropsychology literature, please see Medina et al., (Reference Medina, Henry, Torres, MacDonald and Strutt2023). Despite longstanding overreliance on proxy estimates of acculturation, some neuropsychologists have advocated for the practical value of utilizing acculturative measures in neuropsychological research and practice (Fujii, Reference Fujii2018; Ortiz et al., Reference Ortiz, Ochoa, Dynda, Flanagan and Harrison2012; Rivera Mindt et al., Reference Rivera Mindt, Byrd, Saez and Manly2010).
Some neuropsychological research has highlighted significant differences in performance on neuropsychological tests among non-Latinx White individuals compared to individuals from diverse backgrounds (e.g., Black/African-American, Latinx) (e.g. Boone et al., Reference Boone, Victor, Wen, Razani and Pontón2007; Manly et al., Reference Manly, Miller, Heaton, Byrd, Reilly, Velasquez, Saccuzzo and Grant1998; Manly et al., Reference Manly, Byrd, Touradji and Stern2004). Broadly, findings indicate that greater acculturation to the U.S. is associated with better scores across a variety of cognitive domains (e.g., language, attention/working memory, processing speed), and performance differences substantially decrease after adjusting for demographic (e.g., age, education) and sociocultural factors such as acculturation (Arentoft et al., Reference Arentoft, Byrd, Robbins, Monzones, Miranda, Rosario, Coulehan, Fuentes, Kubo Germano, D’Aquila, Sheynin, Fraser, Morgello and Rivera Mindt2012; Arnold et al., Reference Arnold, Montgomery, Castañeda and Longoria1994; Manly et al., Reference Manly, Byrd, Touradji and Stern2004; Razani et al., Reference Razani, Burciaga, Madore and Wong2007a). Research also indicates that ethnoculturally diverse populations may be disproportionately impacted by a myriad of inequities (e.g., lower years or poorer quality of education; poverty) and medical comorbidities (e.g., diabetes, hypertension, heart disease) that may result in worse neurocognitive outcomes. Furthermore, significant inequities in the use and availability of neuropsychological services among ethnoculturally diverse populations and a notable lack of appropriate normative data for these populations may result in under- or over-estimation of neurological deficits and the delivery of sub-standard clinical care (Brickman et al., Reference Brickman, Cabo and Manly2006; Rivera Mindt et al., Reference Rivera Mindt, Byrd, Saez and Manly2010).
Given the continued growth of ethnoculturally diverse populations within the U.S., there is an urgent need to better understand the role of acculturation in performance on neuropsychological tests. A critical review from O’Bryant et al., (Reference O’Bryant, O’Jile and McCaffrey2004) focusing on the reporting of demographic variables in five of the most cited neuropsychology journals found that information on race/ethnicity, native language, and acculturation are rarely, if ever, provided. In an update, Medina et al. (Reference Medina, Torres, Gioia, Lopez, Wang and Cirino2021) reviewed 1277 original articles and found modest to low reporting of demographic variables such as language (20%), race/ethnicity (36%), and acculturation (< 1%). While some have highlighted an important relationship between neuropsychological functioning and acculturation, there is a dearth of systematic literature reviews exploring this subject. Only one systematic review (Tan et al., Reference Tan, Burgess and Green2021) has comprehensively examined the effects of acculturation on neuropsychological test performance. This systematic literature cited significant methodological heterogeneity across studies and explored a diverse array of neuropsychological tests and ethnic groups, including Latinx, Japanese, Chinese, Arab American, and non-Latinx White individuals. Findings suggest that greater acculturation to the dominant culture is generally related to better neuropsychological test performance among both clinical and nonclinical populations. Furthermore, the authors highlight additional cultural factors (e.g., generational status, language of testing) or sample characteristics (e.g., socioeconomic status, reading ability) that may better explain performance differences on some neuropsychological tests.
To date, no meta-analyses have addressed the relationship between acculturation and neuropsychological test performance or examined the magnitude of this relationship within and across cognitive domains. As a result, there is an urgent need to address this gap in the literature by explicitly examining this relationship and quantifying the associated effect sizes. Therefore, the purpose of the current meta-analytic review is to address this gap through a comprehensive synthesis of the literature that aims to determine the magnitude of the relationship between acculturation and neuropsychological test performance.
Methods
Data sources and literature search criteria
A comprehensive literature search was conducted exploring all available published articles through January 1, 2024. Three databases were searched (i.e., PubMED/MEDLINE, PsycInfo, and PsycNET) utilizing the following search terms: acculturation AND (neuropsychology OR neuropsychological OR neurocognitive OR cognitive OR executive functioning OR attention OR working memory OR verbal fluency OR learning OR memory OR visuospatial functioning OR processing speed OR motor skills) AND (Assessment OR evaluation OR testing OR test OR measure). All articles were screened based on full title and abstract to determine study fit; those that met inclusion criteria were reviewed in their entirety. The review protocol was not registered.
Inclusion criteria
The following inclusion criteria were utilized: 1) Studies examining neuropsychological performance of adults aged >17 years; 2) published in English language; 3) utilized published, validated neuropsychological instruments with standardized administration procedures; 4) included at least one published, standardized, validated measure examining level of acculturation (e.g., AMAS); 5) reported sufficient information about study results to allow computation of effect size (e.g., Pearson’s r correlation coefficient; means, standard deviations). The acculturation scales must have assessed at least one of the following: a) various domains of acculturation (e.g., ethnic identity, food, language usage), b) dimensional (e.g., unidimensional, multidimensional), or c) constructs related to the process of acculturation (e.g., acculturative stress).
Exclusion criteria
The following exclusion criteria were utilized: 1) nonquantitative or qualitative studies, case-reports, or systematic review articles; 2) studies that did not use measures of neuropsychological or neurocognitive functioning (e.g., used scholastic or standardized academic achievement tests); 3) studies that utilized experimental or proxy measures of acculturation (e.g., years in the U.S.) in lieu of published, standardized, and validated acculturation measures; 4) studies that did not provide reporting of results related to the relationship between acculturation and neuropsychological assessment (e.g., unreported coefficients).
Study selection
An initial screening of titles and abstracts was conducted by one researcher (MA) to remove all duplicates across databases. After duplicates were removed, the remaining records were first screened by one researcher (MA) based on titles to determine appropriateness for inclusion. The remaining records were then screened by abstract by two study authors (MA & MRM). A second round of full-text screening was subsequently completed with the remaining articles. If multiple articles were published using the same dataset, the article with the largest sample size was selected to avoid redundancy, consistent with best practices (Valentine et al., Reference Valentine, Hedges and Cooper2009). After identifying studies that met inclusion criteria, a forward search was conducted with all included studies to identify any additional articles that were excluded in the original search. Inter-rater agreement (percent agreement) for study selection was high (93.8%). Disagreements regarding inclusion of studies were resolved through joint discussion and team consultation.
Data extraction and coding
The current study utilized standards for meta-analysis set forth by the Preferred Reporting Items for Systematic Reviews and Meta-Analyses (PRISMA) statement to ensure transparent reporting for meta-analysis (Moher et al., Reference Moher, Liberati, Tetzlaff and Altman2009; Page et al., Reference Page, McKenzie, Bossuyt, Boutron, Hoffmann, Mulrow, Shamseer, Tetzlaff, Akl, Brennan, Chou, Glanville, Grimshaw, Hróbjartsson, Lalu, Li, Loder, Mayo-Wilson, McDonald and Moher2021). To ensure reliability, two independent researchers were responsible for data extraction and coding of the included studies. The following information was extracted from each study: sample characteristics, including sample size, gender (% men), age (mean and standard deviation), years of education (mean and standard deviation), and race/ethnicity; type of population assessed (e.g., healthy, clinical); acculturation measure utilized (e.g., Bidimensional Acculturation Scale); neuropsychological domains assessed (e.g., verbal fluency, memory, attention); neuropsychological tests utilized (e.g., Wisconsin Card Sorting Task, Hopkins Verbal Learning Test), and outcome variables (e.g., correlation coefficient) examining the relationship between acculturation and neuropsychological test performance. The type of neuropsychological outcome metric (i.e., raw test data, T-scores, z-scores, deficit scores) was also extracted. Inter-rater agreement between two raters (MA & EB) was calculated for data extraction of all quantitative values used for calculation of effect sizes (mean percent agreement among raters across all quantitative variables extracted = 90.6%, with a range of 68 – 100%). All discrepancies in extraction of quantitative variables were resolved through discussion with a third coder (MRM) to prepare for final analyses.
Risk of bias
Two independent reviewers (MA & EB) assessed risk of bias of each included study using the Joanna Briggs Institute (JBI) Critical Appraisal tool, a commonly used appraisal checklist for assessing trustworthiness, relevance, and results of published studies to be included in reviews (see Supplementary Materials for checklist responses) (Aromataris et al., Reference Aromataris, Fernandez, Godfrey, Holly, Khalil and Tungpunkom2015). A low risk of bias was assigned to each study where most of the methodological criteria are met, while a high risk was assigned for studies with few criteria met. Inter-rater agreement for risk of bias analyses was high (Inter-rater agreement across 8 questions = 82.5%). Any discrepancy in the quality ratings of studies between the two reviewers was resolved through case consensus discussion with a third, independent coder (MRM). The risk of bias assessment tool is included in the Supplementary Materials.
Statistical approach
After completion of data extraction, coding, and risk of bias assessment, the meta-analysis was conducted using the metafor 4.6 package in R (Viechtbauer, Reference Viechtbauer2010). Metafor is a powerful and flexible tool for conducting meta-analyses, allowing for integration and synthesis of effect sizes from included studies, as well as generating summary statistics, figures, and tables.
Data to calculate study effect sizes were extracted from in-text results, tables, and figures. When sufficient information was not available, study authors were contacted to obtain additional raw data that were not reported in study manuscripts. The common metric used for reporting results presented in the current meta-analysis was Pearson’s r correlation coefficient. As such, the statistical approach included extraction of the Pearson correlation coefficient (r) between acculturation to the U.S. and neuropsychological functioning. When this relationship was provided between acculturation and a composite score for neuropsychological functioning across all cognitive domains (e.g., global neurocognition score), this effect size was extracted.
As per standard meta-analytic procedure (Borenstein et al., Reference Borenstein, Hedges, Higgins and Rothstein2009), all correlation coefficients were converted to Fisher’s z-scores (see Formula 1.1 in Supplementary Files) to normalize the sampling distribution of correlations when used as effect sizes. This transformation was performed using the escalc function in metafor. When studies reported multiple Pearson’s r correlations examining the relationships between acculturation and several different tests or domains of neuropsychological functioning (e.g., a battery of 10 individual tests, resulting in 10 different correlations), the mean of all Pearson’s r reported was obtained to represent a composite of the relationship between acculturation and neurocognition across various cognitive domains or cognitive tests. The procedure for computing an aggregate effect size across similar outcomes within a study are described as an appropriate approach by Borenstein et al., (Reference Borenstein, Hedges, Higgins and Rothstein2009), such that one can combine multiple effect sizes measuring a related construct to obtain a summary effect within that study (see Formula 1.3 in Supplementary Files). The resulting composite effect sizes were then transformed into Fisher’s z for the meta-analysis.
Some studies reported differences between levels of acculturation and neuropsychological functioning among two or more groups (e.g., low acculturation vs. high acculturation). When studies reported differences between groups (e.g., low vs. high acculturation) for a composite or global neurocognition score, the standardized mean difference was calculated (Cohen’s d). When studies reported multiple effect sizes for differences between groups across various neuropsychological tests or domains, the mean of all Cohen’s d’s was obtained to represent a composite of this effect (Formula 1.3 in Supplementary Files). This Cohen’s d value was then converted to Pearson’s r. Please see Formulas 1.4 – 1.6 in Supplementary Files for formulas utilized to complete transformations. All studies that reported Pearson’s r correlation coefficients, or values that could be directly converted to Pearson’s r correlation coefficients were meta-analyzed together using the metafor package in R.
A review of the literature suggested that it is not recommended to combine standard Pearson’s correlation coefficients with other types of correlation coefficients (e.g., partial or semi-partial correlation data) in one meta-analysis (Aloe & Thompson, Reference Aloe and Thompson2013). Some studies reported partial r correlations controlling for demographic variables such as age and education. Other studies included acculturation as a predictor in a multiple regression model, along with various other predictors. In these cases, the partial r correlation coefficient was calculated using commonly reported regression data (e.g., R 2, t-value, B, SE B, β) extracted from in-text results, tables, and figures. Please see Formulas 1.7 – 1.8 in Supplementary Files for formulas utilized to complete these transformations (Aloe & Becker, Reference Aloe and Becker2012; Cohen et al., Reference Cohen, Cohen, West and Aiken2003). Based on these recommendations (Aloe & Thompson, Reference Aloe and Thompson2013), studies that reported partial r’s or where partial r’s were computed using regression data were separated into a separate meta-analysis using the metafor R package. Findings are presented separately in the results. Of note, the direction of the Pearson’s r correlation or partial r correlation coefficients were carefully examined to accurately reflect the relationships between acculturation and neuropsychological functioning. For example, when studies reported raw test scores for which higher values indicated greater neurocognitive impairment (e.g., deficit scores, raw scores for timed tests), the absolute value of the correlation coefficient was utilized. As per Cohen (Reference Cohen1998), magnitudes of .10, .30, and .50 corresponded to small, medium, and large effect sizes, respectively for correlation coefficients.
The analysis involved creating both a forest plot and a funnel plot, along with examination of the degree of heterogeneity in the meta-analysis. Specifically, the statistical outputs include Cochrane’s Q, I2, and τ 2 (see Borenstein et al., Reference Borenstein, Hedges, Higgins and Rothstein2009 for additional information). The Q statistic is the weighted sum of squared differences between the observed effect and the average weighted effect. I 2 serves as a measure of the proportion of observed variance reflecting real differences in effect size, and is generally reported as a percentage, such that I 2 values of 25%, 50%, or 75% are generally interpreted as representing low, moderate, and high levels of heterogeneity, respectively (Higgins et al., Reference Higgins, Thompson, Deeks and Altman2003). Finally, the variance of true effect sizes was acquired using the parameter tau squared (τ 2), which states that the total variance of a study is the sum of the within study variance and the between studies variance. The closer the tau squared (τ 2) value is to zero, the lower the overall variability between the included studies. The moderating effects of study characteristics were also analyzed using meta-regression models to better understand how various factors influence the overall effect sizes. Given the small number of studies, we examined each moderator individually in univariate models.
Of note, for both meta-analyses (Pearson’s r correlation and partial r correlation), a random-effects model was implemented using restricted maximum likelihood (REML) estimation to account for variability between studies (DerSimonian & Laird, Reference DerSimonian and Laird1986). The inverse variance weighting method was used, allowing studies with lower variance (more precise estimates) contribute more to the overall effect size than those with higher variance. The confidence interval for the overall effect size was adjusted according to the Knapp–Hartung method, which provides more accurate interval estimates in the presence of heterogeneity (Suurmond et al., Reference Suurmond, van Rhee and Hak2017).
Results
Study selection and characteristics
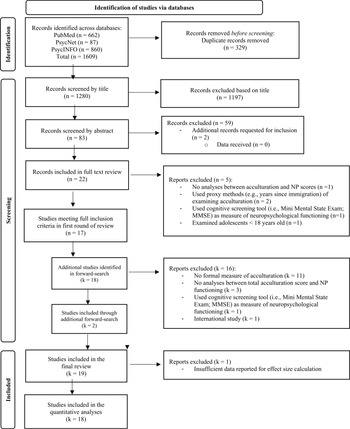
A total of 19 studies were initially included in the systematic review. First, 17 studies were identified in the original search that met inclusion criteria. Next, a forward search was conducted with all 17 studies to identify any additional related studies that were not identified in the original search procedure. This procedure rendered an additional 18 published, peer-reviewed studies that were reviewed for inclusion. Eleven of those 18 studies reviewed did not include formal measures of U.S. Acculturation (i.e., proxy methods), three studies did not include statistical analyses between acculturation level and neuropsychological functioning, one included only cognitive screeners (e.g., MMSE), and one was a non-U.S. based study (United Kingdom). Two studies (Enobi et al., Reference Enobi, Kemmotsu, Robinson and Murphy2022; Rivera Mindt et al., Reference Rivera Mindt, Miranda, Arentoft, Byrd, Monzones, Fuentes, Arias, Rentería, Rosario and Morgello2014) met inclusion criteria and thus were added to the meta-analysis. Two dissertations (Kazandjian, Reference Kazandjian2006; Varghese, Reference Varghese2004) were also identified, though neither met inclusion criteria due to reasons such as utilizing adapted versions of standardized scales (Kazandjian, Reference Kazandjian2006) or excluding a total acculturation score (Varghese, Reference Varghese2004). A flowchart of the literature search and study selection is presented in Figure 1.
PRISMA flowchart of study selection and inclusion for meta-analysis.

Outcome measures
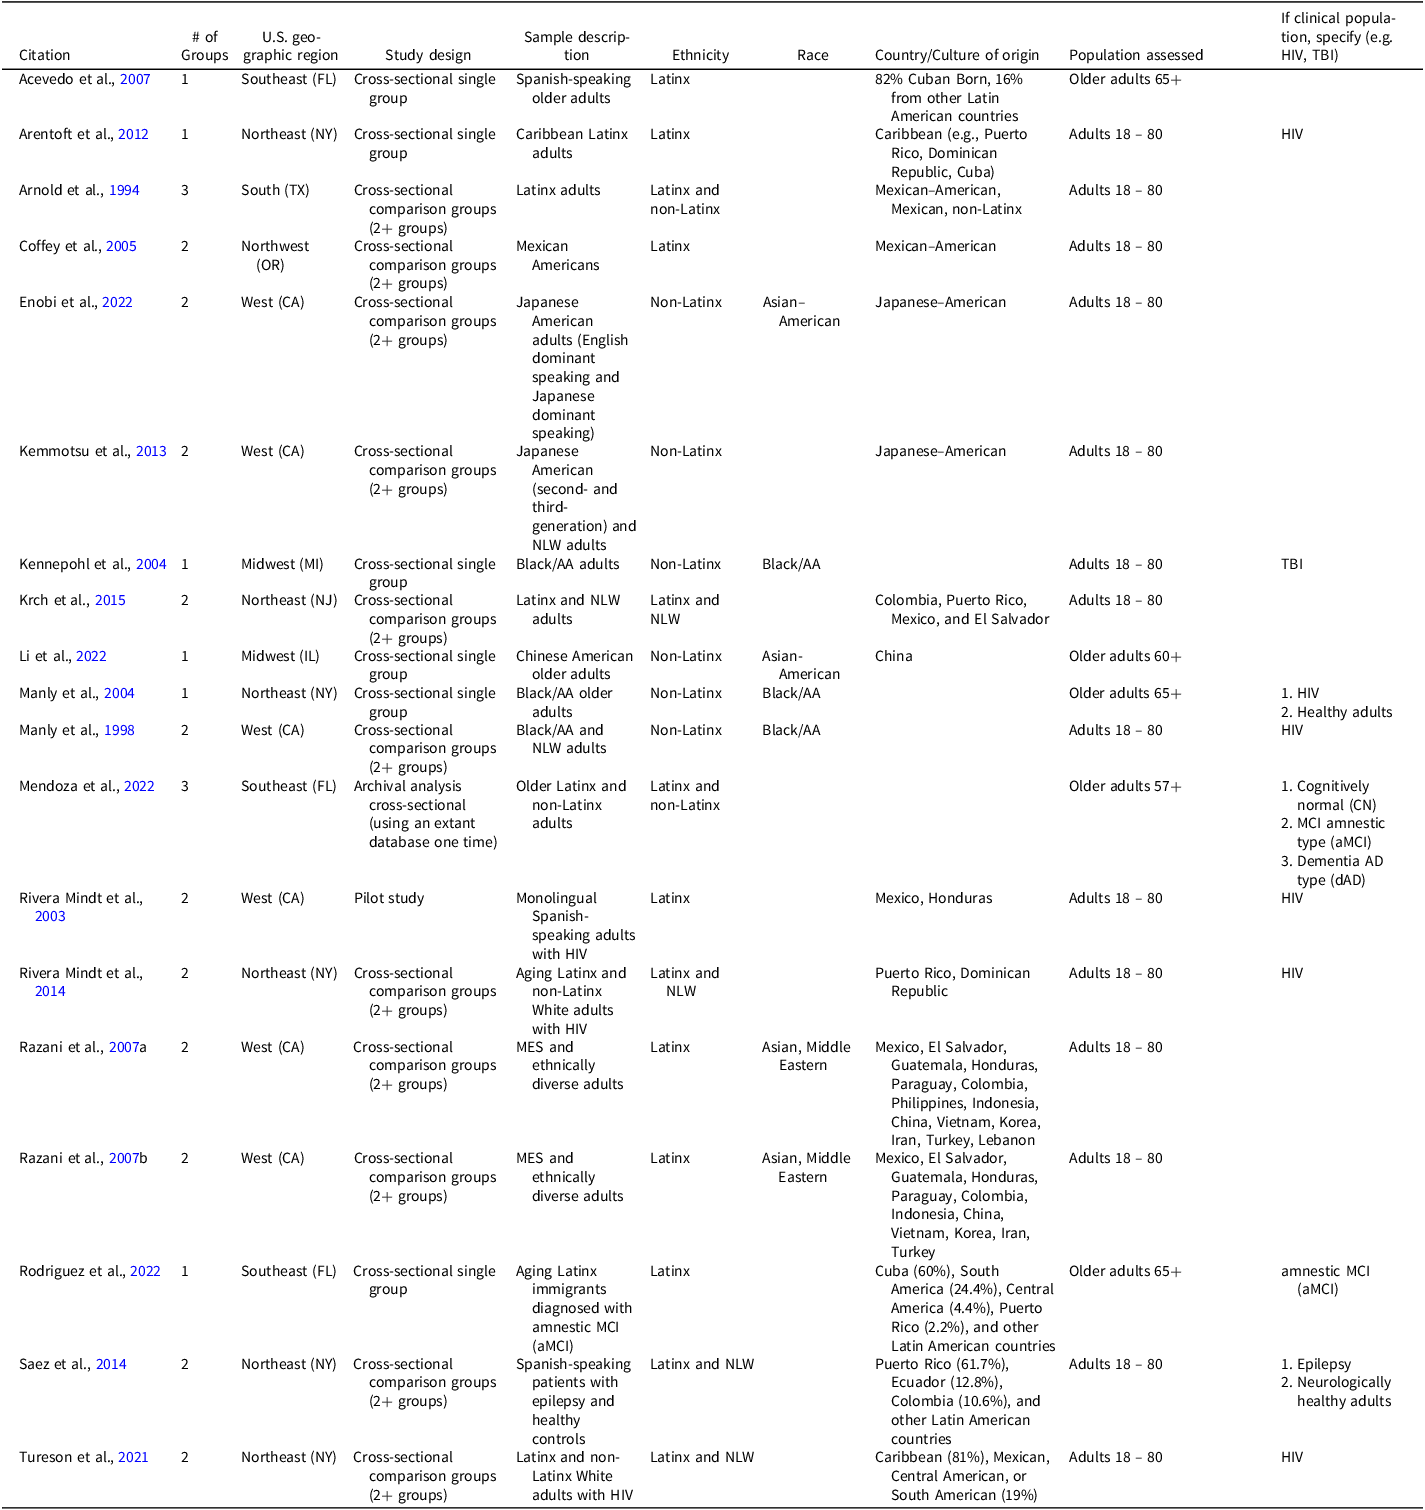
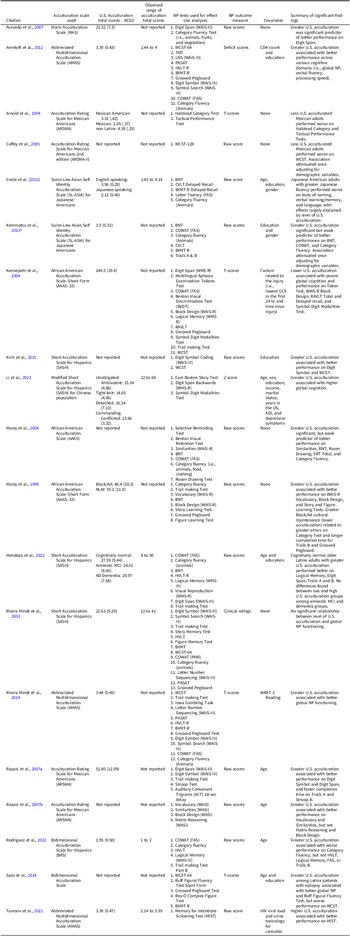
Study design and sample characteristics are presented in Tables 1 and 2, respectively. Given the significant variance in the statistical approaches used, the magnitude of effects, and the variance in the sociodemographic factors analyzed, ethnocultural groups examined, acculturation tools utilized, and neuropsychological batteries utilized across studies, the random-effects model was selected for the present meta-analysis (see Table 3 for detailed summary of acculturation scales and neuropsychological assessments, covariates, and summarized study results). This method accounts for both within- and between-study variation in effect size estimates and assumes greater variability between included studies than sampling error alone.
Study design characteristics of included studies (k = 19*)

Note: Black/AA = Black/African-American, NLW = non-Latinx White, MES = Monolingual English-Speaker.
*k = 18 included in quantitative analyses.
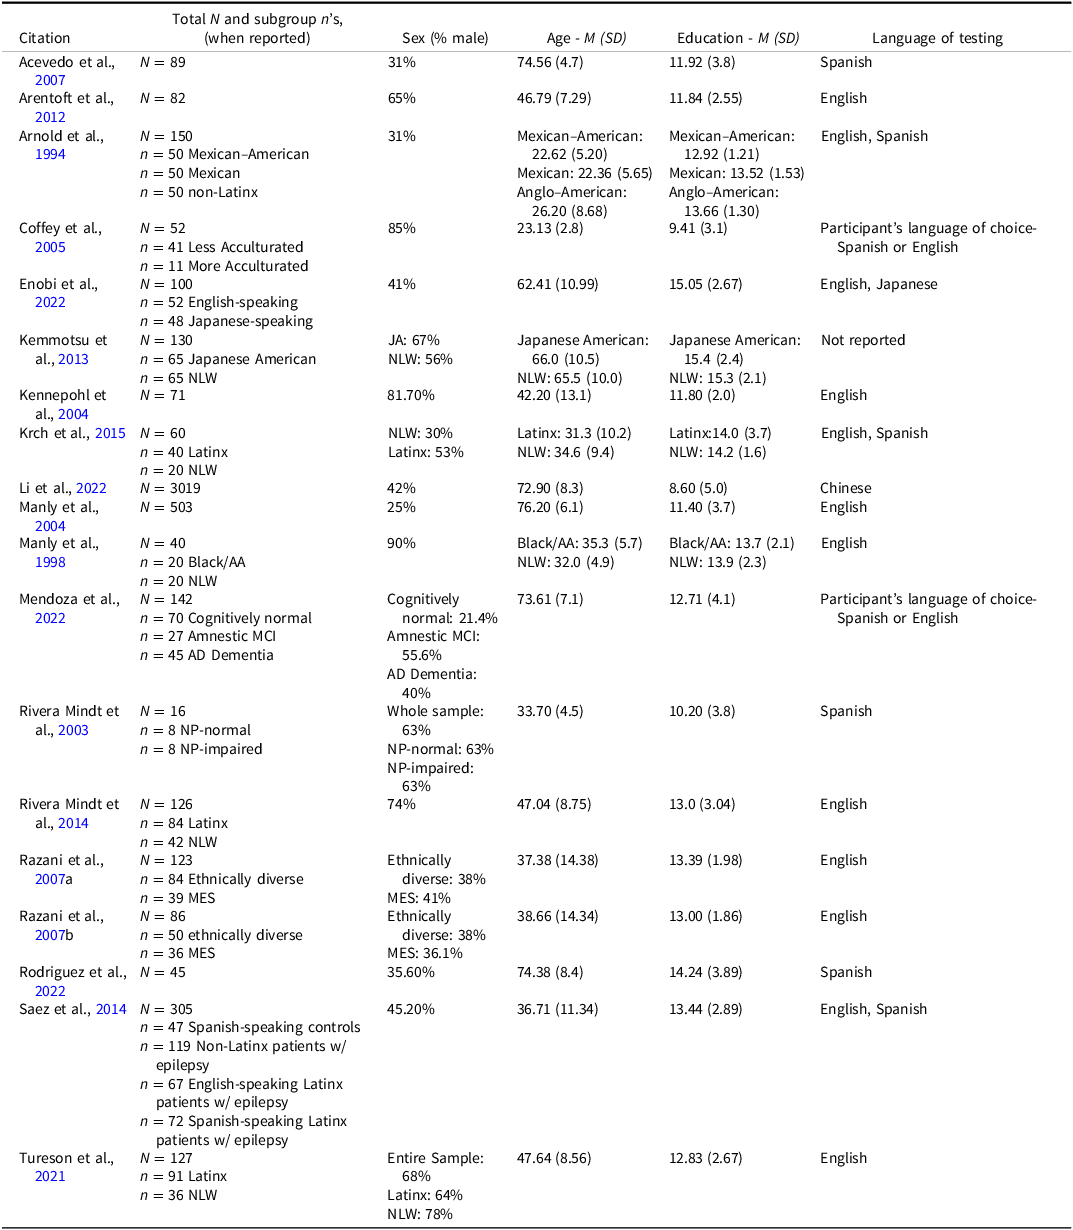
Sample characteristics of included studies (k = 19*)

Note: Black/AA = Black/African-American, NLW = non-Latinx White, JA = Japanese American, MES = Monolingual English-Speaker.
*k = 18 included in quantitative analyses.
Neuropsychological tests, U.S. acculturation scales, covariates applied, and summary of findings (k = 19*)

Note: Black/AA = Black/African-American, BNT = Boston Naming Test, BVMT – R = Brief Visuospatial Memory Test- Revised, Controlled Oral Word Association Test = COWAT, Global NP = Global neuropsychological functioning, HVLT-R = Hopkins Verbal Learning Test - Revised, NP = Neuropsychological, Paced Auditory Serial Addition Test (PASAT), RAVLT = Rey Auditory Verbal Learning Test, WAIS-R = Wechsler Adult Intelligence Scale -Revised, WAIS-III = Wechsler Adult Intelligence Scale, 3rd edition, WASI = Wechsler Abbreviated Scale of Intelligence, WCST = Wisconsin Card Sorting Test, WMS-III = Wechsler Memory Scale, 3rd edition, WAIS-R = Wechsler Adult Intelligence Scale, Revised, WMS-R = Wechsler Memory Scale, Revised.
*this study was excluded from quantitative analyses due to insufficient data reported, thus k = 18 studies were included in quantitative analyses.
Of the 19 studies included in the systematic review, seven (i.e., Arentoft et al., Reference Arentoft, Byrd, Robbins, Monzones, Miranda, Rosario, Coulehan, Fuentes, Kubo Germano, D’Aquila, Sheynin, Fraser, Morgello and Rivera Mindt2012; Coffey et al., Reference Coffey, Marmol, Schock and Adams2005; Krch et al., Reference Krch, Lequerica, Arango-Lasprilla, Rogers, DeLuca and Chiaravalloti2015; Manly et al., Reference Manly, Miller, Heaton, Byrd, Reilly, Velasquez, Saccuzzo and Grant1998; Rivera Mindt et al., Reference Rivera Mindt, Miranda, Arentoft, Byrd, Monzones, Fuentes, Arias, Rentería, Rosario and Morgello2014; Razani et al., Reference Razani, Burciaga, Madore and Wong2007a; Razani et al., Reference Razani, Murcia, Tabares and Wong2007b) reported Pearson’s r coefficients for the relationship between acculturation and global neuropsychological functioning (Arentoft et al., Reference Arentoft, Byrd, Robbins, Monzones, Miranda, Rosario, Coulehan, Fuentes, Kubo Germano, D’Aquila, Sheynin, Fraser, Morgello and Rivera Mindt2012; Rivera Mindt et al., Reference Rivera Mindt, Miranda, Arentoft, Byrd, Monzones, Fuentes, Arias, Rentería, Rosario and Morgello2014), as well as individual cognitive domains (Coffey et al., Reference Coffey, Marmol, Schock and Adams2005; Krch et al., Reference Krch, Lequerica, Arango-Lasprilla, Rogers, DeLuca and Chiaravalloti2015; Manly et al., Reference Manly, Miller, Heaton, Byrd, Reilly, Velasquez, Saccuzzo and Grant1998; Razani et al., Reference Razani, Burciaga, Madore and Wong2007a; Razani et al., Reference Razani, Murcia, Tabares and Wong2007b). Pearson’s r coefficients underwent Fisher’s z transformation for use as effect sizes in the current meta-analysis (Formula 1.1). Please see Supplemental Files for all formulas utilized for effect size transformations.
Three studies examined group differences, with one comparing ethnoracial groups (i.e., Mexican, Mexican American, non-Latinx; Arnold et al., Reference Arnold, Montgomery, Castañeda and Longoria1994), while the others compared clinical diagnostic groups (e.g., cognitively unimpaired, mild cognitive impairment; Mendoza et al., Reference Mendoza, Garcia, Duara, Rosselli, Loewenstein, Greig-Custo, Barker, Dahlin and Rodriguez2022; Rivera Mindt et al., Reference Rivera Mindt, Cherner, Marcotte, Moore, Bentley, Esquivel, Lopez, Grant and Heaton2003). For these studies, standardized mean difference (Cohen’s d) were calculated examining group comparisons on neuropsychological test performance, and then converted from Cohen’s d to Pearson’s r (Formulas 1.4 – 1.6). These converted Pearson’s r’s subsequently underwent Fisher’s z transformation.
Three studies (i.e., Rodriguez et al., Reference Rodriguez, Mendoza, Rodriguez, Rosselli, Loewenstein, Burke, Orozco and Duara2022; Saez et al., Reference Saez, Bender, Barr, Rivera Mindt, Morrison, Hassenstab, Rodriguez and Vazquez2014; Tureson et al., Reference Tureson, Byrd, Guzman, Summers, Morris and Rivera Mindt2021) reported partial correlation coefficients for the relationship between acculturation and global neurocognition/individual cognitive domains, controlling for demographic and neuromedical variables, such as age, education, and HIV viral load.
Finally, six studies (i.e., Acevedo et al., Reference Acevedo, Loewenstein, Agrón and Duara2007; Enobi et al., Reference Enobi, Kemmotsu, Robinson and Murphy2022; Kemmotsu et al., Reference Kemmotsu, Enobi and Murphy2013; Kennepohl et al., Reference Kennepohl, Shore, Nabors and Hanks2004; Li et al., Reference Li, Lu, Hoover, Flynn, Silverstein, Wu and Dong2022; Manly et al., Reference Manly, Byrd, Touradji and Stern2004) included total acculturation scores as predictors in regression models, predicting global and domain-level neuropsychological performance. When sufficient information was reported (e.g., regression coefficient, sample size, number of predictors, semi-partial correlation coefficient) the partial correlation coefficient for acculturation was calculated. One study (Kemmotsu et al., Reference Kemmotsu, Enobi and Murphy2013) did not report sufficient information to calculate the partial correlation coefficient and thus was excluded from the quantitative analyses after attempting to contact study authors for additional raw data. As such, a total of 18 studies were included in the quantitative meta-analysis.
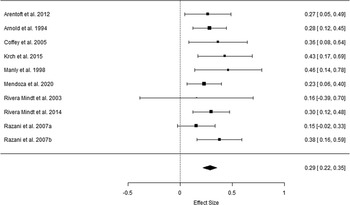
Two separate meta-analyses were conducted for correlational data and partial correlation data. The meta-analysis examining composite effect sizes of Pearson’s r correlations (k = 10) generated a small to medium sized effect that was statistically significant, r = .29, 95% CI = [.22, .35], p < .001 (see Figure 2 for Forest plot), such that higher U.S. acculturation was associated with better overall neuropsychological functioning. Significant variability was observed among the populations assessed (e.g., race/ethnicity, healthy vs. clinical populations) and scales used to measure acculturation (see Table 3) and neuropsychological functioning (see Table 3). Despite this, findings indicate low levels of heterogeneity among overall effect sizes between studies (Cochrane’s Q = 6.08 I 2 = .00%, τ 2 = .00) (Higgins et al., Reference Higgins, Thompson, Deeks and Altman2003).
Forest plot assessing relationship between neuropsychological function and acculturation across studies – Pearson’s r correlations (k = 10).
Note. The squares represent study level effect sizes, while the diamond represents the composite effect size (Fisher’s z transformed). The horizontal lines represent confidence intervals (CI). The size of the squares corresponds to the relative weight assigned to each study in the meta-analysis.

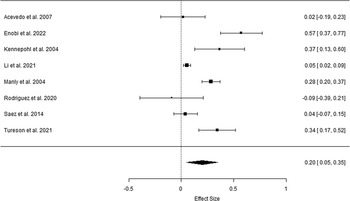
The meta-analysis examining composite effect sizes of partial r correlation coefficients (k = 8) generated a small, statistically significant composite effect, partial r = .20, 95% CI = [.05, .35], p < .01 (see Figure 3 for Forest plot). Substantial heterogeneity was observed among the overall effect sizes across studies, with Cochrane’s Q = 59.90, I2 = 91.38%, and τ 2 = .04 (Higgins et al., Reference Higgins, Thompson, Deeks and Altman2003).
Forest plot assessing relationship between neuropsychological function and acculturation across studies – partial r correlations (k = 8).
Note. The squares represent study level effect sizes, while the diamond represents the composite effect size (Fisher’s z transformed). The horizontal lines represent confidence intervals (CI). The size of the squares corresponds to the relative weight assigned to each study in the meta-analysis.

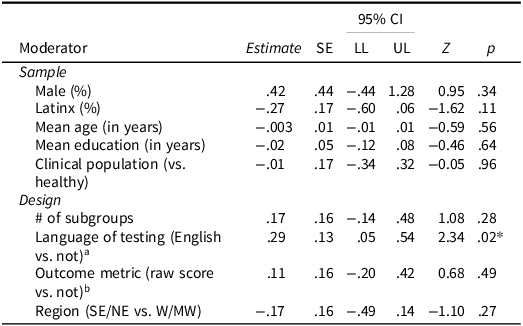
We then tested the moderating effects of study characteristics using univariate models (see Table 4). Only the language of testing emerged as a significant moderator. Specifically, studies that utilized English as the primary testing language or included English yielded stronger effect sizes compared to those that did not (B = .29, 95% CI = [.05, .54], p < .05). The model showed a substantial amount of residual heterogeneity (I 2 = 77.82%), indicating that a significant proportion of the variability in effect sizes remains unexplained.
Moderating effects of study characteristics for partial r correlation coefficients group (k = 8)

Note: SE = Southeast, NE = Northeast, W = West, MW = Midwest.
a Primary language of testing is English or includes English versus not.
b Used raw score for neuropsychological outcome metric versus not (T-scores or Z-scores).
* p < .05.
Publication bias
Funnel plots for the two meta-analyses examining the relationship between neuropsychological function and acculturation are presented below (see Figures 4 and 5).
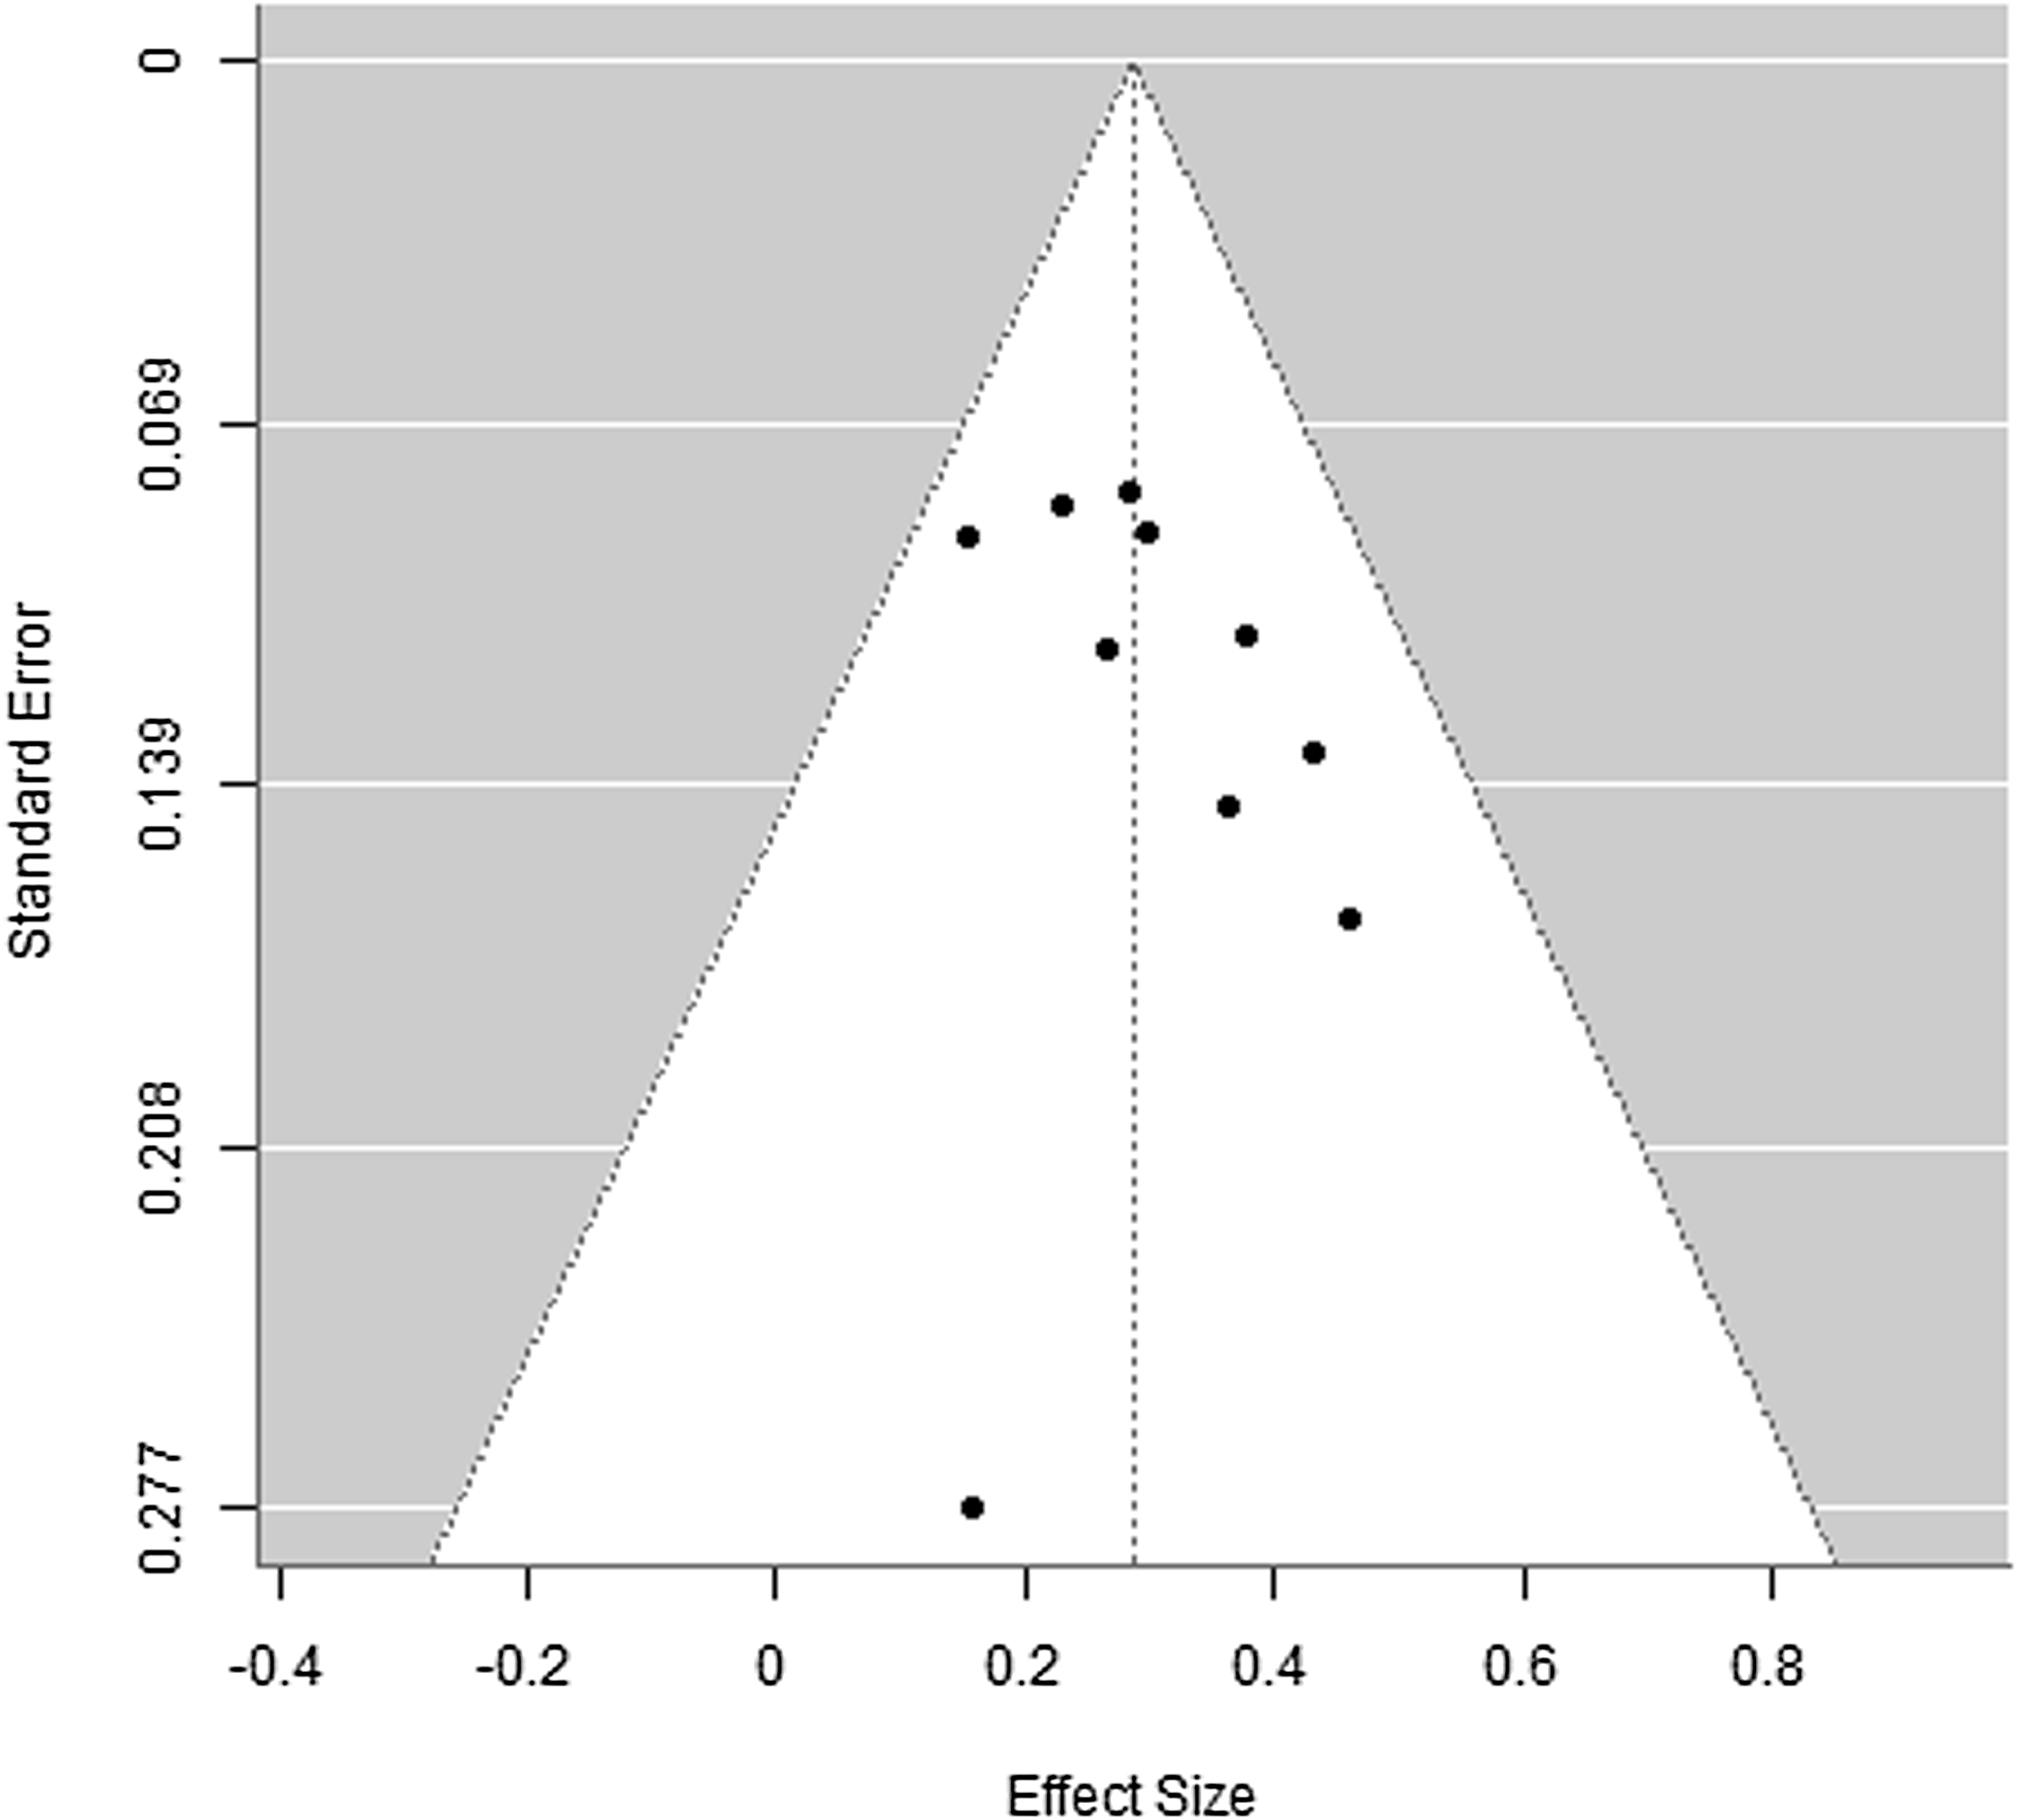
Funnel plot of the relationship between neuropsychological function and acculturation across studies – Pearson’s r correlation coefficients (k = 10).

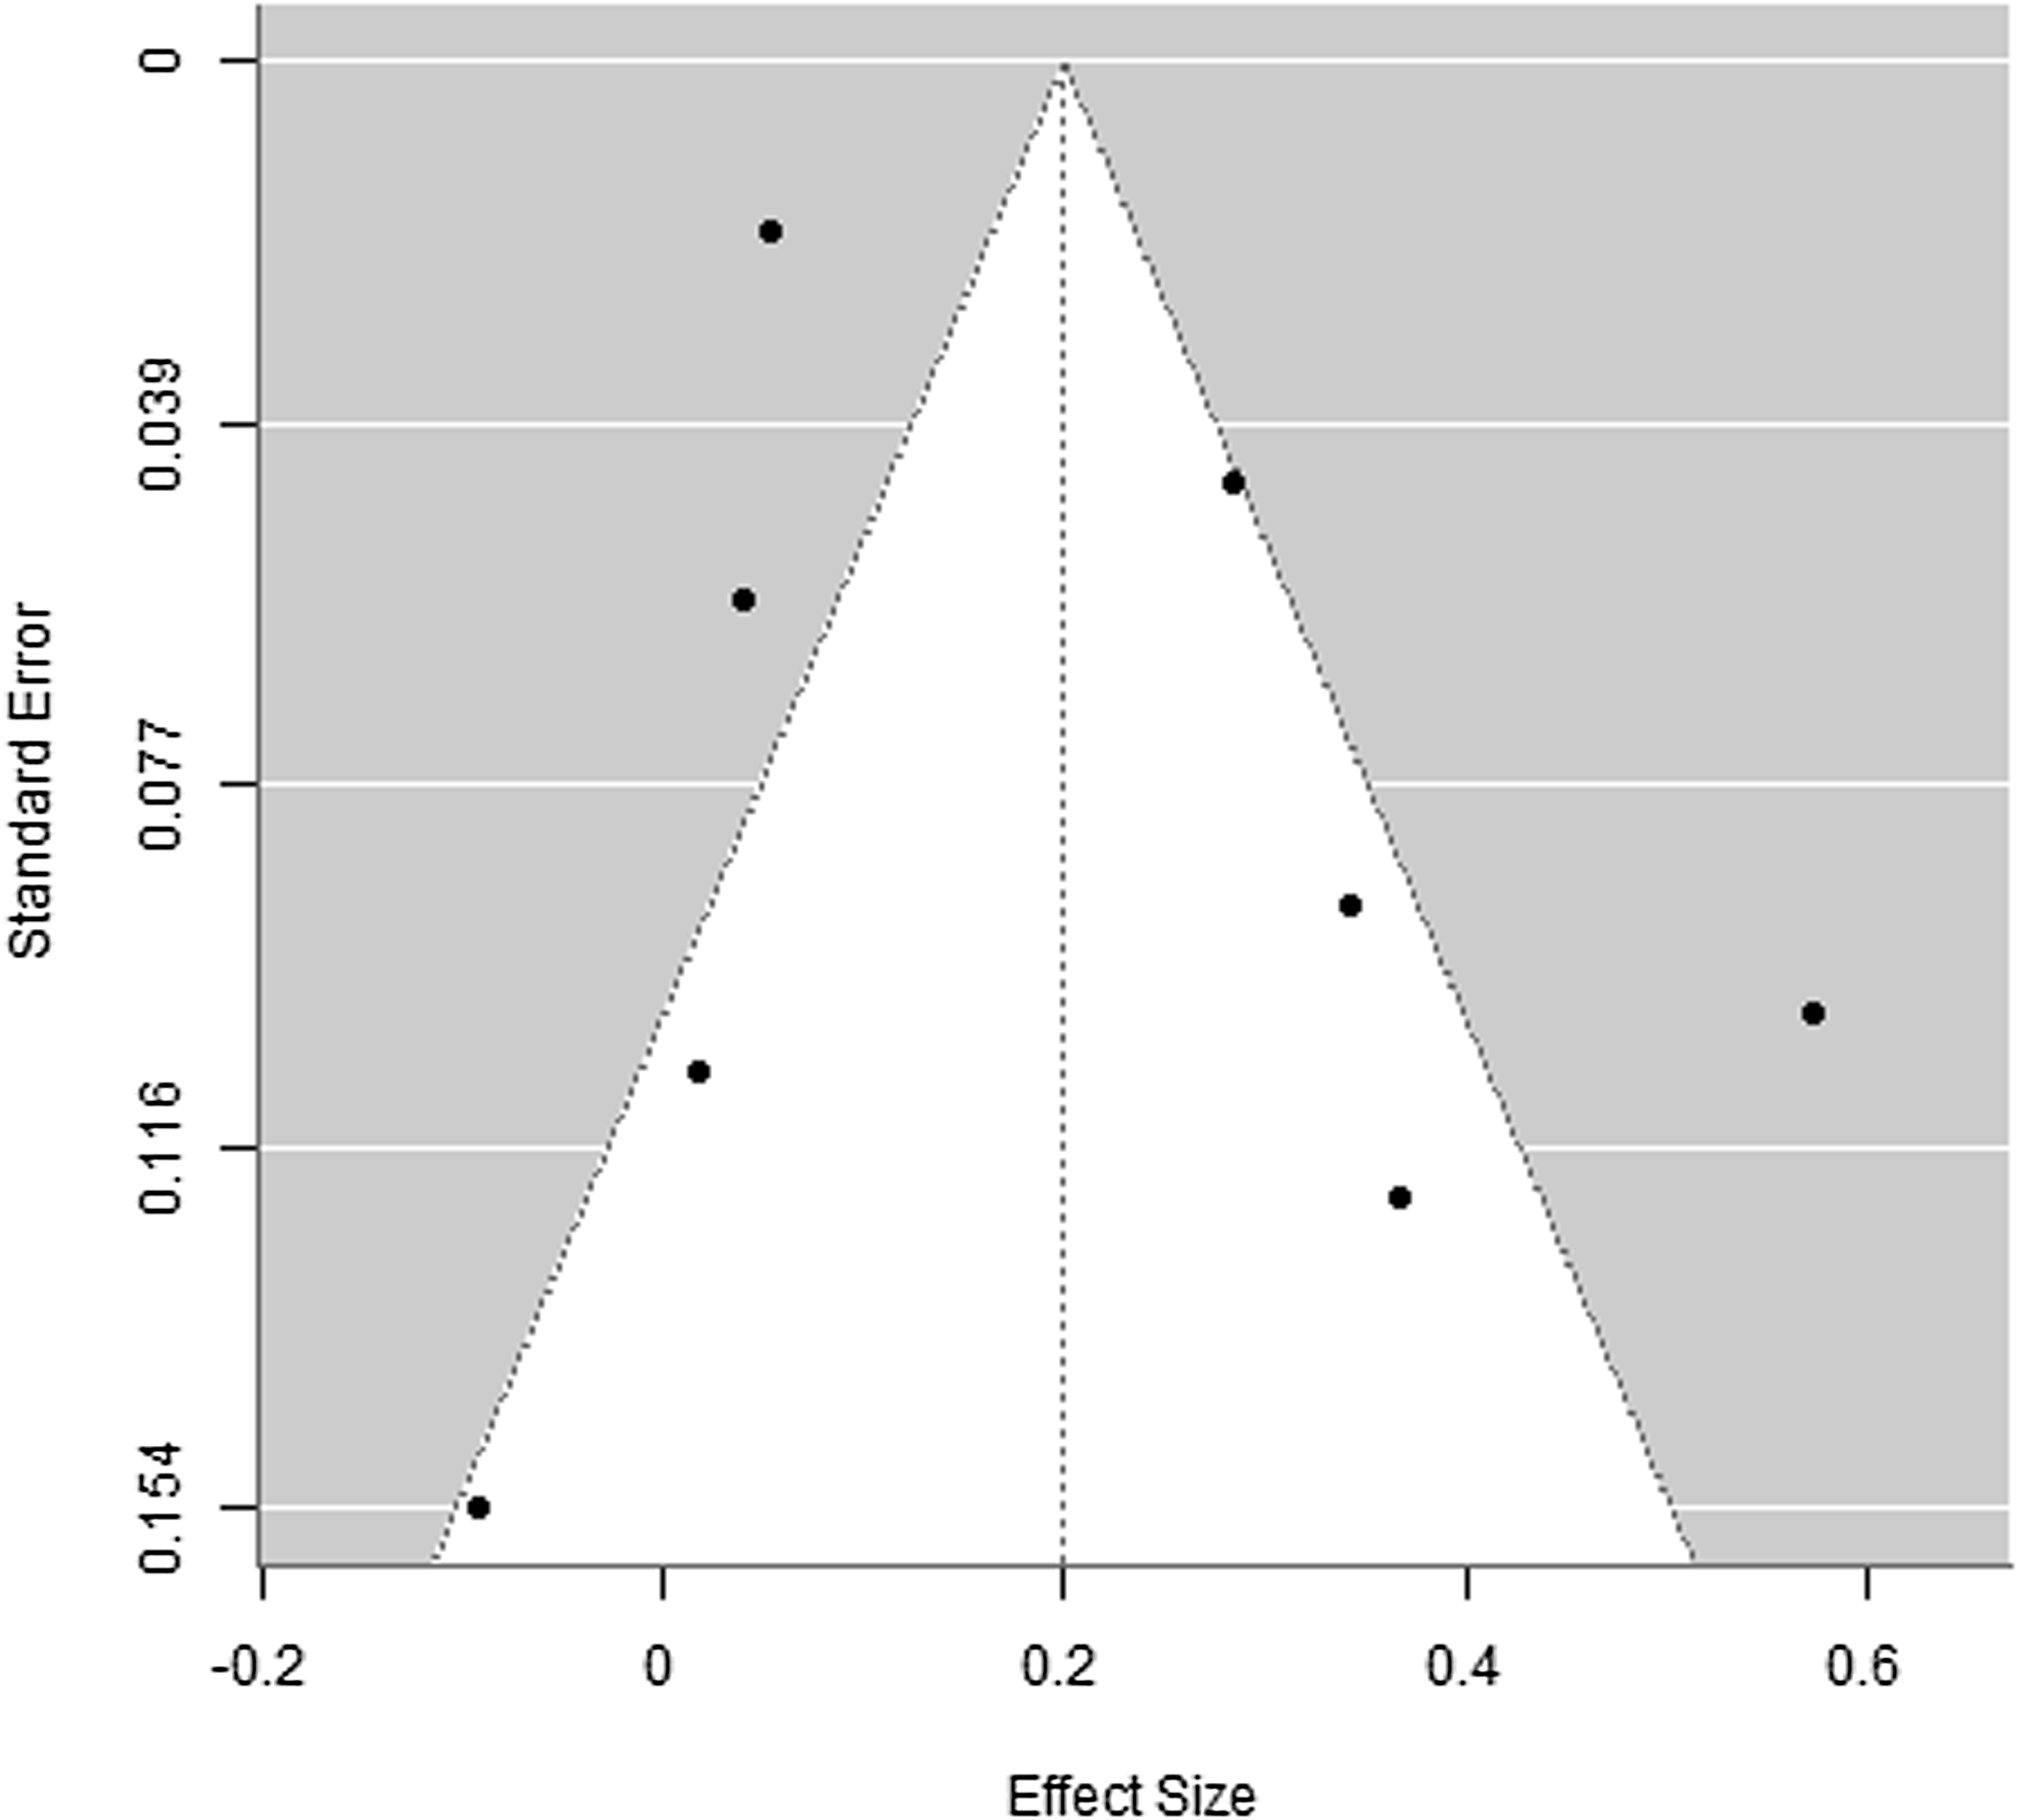
Funnel plot of the relationship between neuropsychological function and acculturation across studies – partial r correlation coefficients (k = 8).

Upon visual inspection, the funnel plots for both Pearson’s r correlation data (Figure 4) and partial r data (Figure 5) did not suggest high degrees of asymmetry. Publication bias analyses did not indicate statistically significant levels of publication bias for Pearson’s r (Egger’s regression = .18, 95% CI = [−.05, .40], t(8) = 1.17, p = .28) or partial r correlational data (Egger’s regression = .03, 95% CI = [−.12, .18], t(6) = 1.54 p = .17).
Discussion
The field of cultural neuropsychology has expanded in recent decades, and research has begun examining the disproportionate impact of inequities (e.g., lower years or quality of education; lack of access to healthcare services), sociocultural factors (e.g., acculturation) and medical comorbidities (e.g., diabetes, hypertension) that can adversely impact brain health outcomes among ethnoculturally diverse populations. Given the growing support for this literature, it is critical to consider how variables such as acculturation contribute to observed differences in neuropsychological test performance among these populations.
While the process of acculturating to the U.S. does not inherently improve cognitive performance among diverse populations, results support the theory that greater acculturation to the dominant, U.S. culture may positively impact test-taking and problem-solving skills (e.g., test-wiseness, speed) that are commonly emphasized in Western cultures (Ardila, Reference Ardila2007, Reference Ardila2020). The present review included 19 studies that utilized diverse methodology for assessing the relationship between acculturation and neuropsychological outcomes across various ethnocultural and clinical groups. Findings from 18 of the 19 studies included in this meta-analysis (one was excluded due to insufficient reporting of statistical data) highlighted a small to medium sized relationship between acculturation and neuropsychological test performance. Two meta-analyses were conducted to examine the association between acculturation and neuropsychological performance using Pearson’s r correlational and partial correlational data. Results across 18 studies examining a diverse sample of ethnocultural (e.g., Latinx, Black/African-American, Chinese American, Middle-Eastern adults, and older adults) and clinical groups (e.g., people living with HIV, epilepsy, and traumatic brain injury) suggest that greater U.S. acculturation was associated with better neuropsychological test performance. More specifically, there is a small to medium sized, positive relationship between U.S. acculturation and neuropsychological test performance, which suggests acculturation levels merit further consideration in both research and clinical practice.
The present review included a diverse toolkit of acculturation measures (i.e., 8 measures total) and neuropsychological tests (i.e., 39 tests total), and highlight variability in the magnitudes of the relationships within and across cognitive domains. While the Pearson’s r correlation meta-analysis found a significant overall effect size alongside highly homogeneous results, the partial r correlation meta-analysis exhibited high heterogeneity. The high heterogeneity observed among these studies may contribute to the dispersion of effect sizes, possibly explaining the distribution of points outside the funnel plot. As noted by Sterne et al., (Reference Sterne, Sutton, Ioannidis, Terrin, Jones, Lau, Carpenter, Rücker, Harbord, Schmid, Tetzlaff, Deeks, Peters, Macaskill, Schwarzer, Duval, Altman, Moher and Higgins2011), tests for funnel plot asymmetry and their interpretation are generally underpowered when fewer than 10 studies are included. Our meta-analysis of partial correlations included only eight studies, which may limit the reliability of visual or statistical inferences regarding asymmetry. Notably, language of testing emerged as a significant moderator, with studies testing in English yielding stronger effect sizes compared to those testing in other languages. Other contextual factors not explored here (e.g., age at arrival to the US, time in U.S. residence, attitudes towards migration) likely impact the relationship between acculturation and neuropsychological test scores (Cobb et al., Reference Cobb, Martínez, Lee, Lee and Lorenzo-Blanco2021; Tan, Reference Tan2020). For instance, it is possible that more nuanced consideration of sociocultural and demographic variables (e.g., generational, immigrant, or refugee status, years of residency and schooling in the U.S., acculturative stress) may better explain the relationship between acculturation and neuropsychological functioning, and that these relationships may be unique and discrete for each included study and population.
Heterogeneity may also arise from factors such as subtle cultural nuances and expressions that may vary across languages, which can potentially impact examinee performance and responses. It is likely that tests developed for English-speaking populations may not adequately reflect the lived experiences or cognitive styles of individuals from different cultural backgrounds. Therefore, it is essential for researchers to account for the language of testing when designing studies and interpreting findings to ensure that the results accurately reflect participants’ cognitive abilities rather than language differences.
Study limitations and strengths
This is the first, comprehensive meta-analytic review to date examining the relationship between validated scales of U.S. acculturation and neuropsychological functioning. Our findings provide a rigorous overview of the growing literature examining the unique role of acculturation in neuropsychological functioning among ethnoculturally diverse populations. We hope that these findings will increase awareness and use of acculturation measures in future research and clinical practice. Below, we summarize the current limitations of acculturation measurement in the neuropsychological literature, and of this meta-analysis.
One of the most important findings of this meta-analysis was the degree of methodological variability in the literature. First, studies administered different neuropsychological test batteries, with some reporting global neurocognition composite scores and others only reporting domain or test-level data. Thus, “global neurocognition” was operationalized heterogeneously across studies (e.g., Li et al., Reference Li, Lu, Hoover, Flynn, Silverstein, Wu and Dong2022 included a battery of three tests, while Arentoft et al., Reference Arentoft, Byrd, Robbins, Monzones, Miranda, Rosario, Coulehan, Fuentes, Kubo Germano, D’Aquila, Sheynin, Fraser, Morgello and Rivera Mindt2012 included a battery of eleven; see Table 3). Additionally, some studies examined multiple neurocognitive domains that were averaged to obtain a composite study effect size, (e.g., Arentoft et al., Reference Arentoft, Byrd, Robbins, Monzones, Miranda, Rosario, Coulehan, Fuentes, Kubo Germano, D’Aquila, Sheynin, Fraser, Morgello and Rivera Mindt2012; Mendoza et al., Reference Mendoza, Garcia, Duara, Rosselli, Loewenstein, Greig-Custo, Barker, Dahlin and Rodriguez2022, Saez et al., Reference Saez, Bender, Barr, Rivera Mindt, Morrison, Hassenstab, Rodriguez and Vazquez2014) while other studies (e.g., Coffey et al., Reference Coffey, Marmol, Schock and Adams2005; Tureson et al., Reference Tureson, Byrd, Guzman, Summers, Morris and Rivera Mindt2021) focused on the relationship between acculturation and 1 – 2 cognitive domains (i.e., executive function, memory). Though this meta-analysis applied a random-effects model due this methodological variability across studies, random-effects meta-analyses are also not without limitations. As such, it is possible that in some settings and populations, the relationship between acculturation and neuropsychological functioning may be lesser or greater than the current composite estimate (Serghiou & Goodman, Reference Serghiou and Goodman2019).
Second, to obtain the composite effect size for each included study, we combined effect sizes within studies then combined results across studies, which is a common meta-analytic approach (Aguinis et al., Reference Aguinis, Dalton, Bosco, Pierce and Dalton2011). When similar measures (e.g., multiple tests of memory, such as the CVLT, BVMT, and Logical Memory from the WMS-IV) are all used to examine the same construct in a study (e.g., memory), it is posited that population effect sizes are the same, and thus averaging the effect sizes is considered appropriate for meta-analytic research (Borenstein et al., Reference Borenstein, Hedges, Higgins and Rothstein2009). However, when effect sizes are dissimilar for multiple tests of a single cognitive domain, this approach can add significant variance to effect size analyses, resulting in higher levels of variability within studies. It is likely that the current findings utilizing composite effect sizes for each individual study may not accurately reflect the most nuanced examination of the relationship between these constructs. As such, further exploration of domain or test-level relationships with acculturation may be warranted. Studies also reported a variety of neuropsychological test scores, including domain and test-level raw scores, demographically adjusted T-scores, and neuropsychological deficit scores (Arentoft et al., Reference Arentoft, Byrd, Robbins, Monzones, Miranda, Rosario, Coulehan, Fuentes, Kubo Germano, D’Aquila, Sheynin, Fraser, Morgello and Rivera Mindt2012). Some studies applied normative adjustments for demographic variables, such as age and education, (e.g., Arentoft et al., Reference Arentoft, Byrd, Robbins, Monzones, Miranda, Rosario, Coulehan, Fuentes, Kubo Germano, D’Aquila, Sheynin, Fraser, Morgello and Rivera Mindt2012; Manly et al., Reference Manly, Miller, Heaton, Byrd, Reilly, Velasquez, Saccuzzo and Grant1998), while others explicitly applied culturally-specific norms (e.g., Coffey et al., Reference Coffey, Marmol, Schock and Adams2005 used Spanish-speaking norms). It is critical to consider the differences in utilizing each of these scores as cognitive outcome variables for the current meta-analysis, given significant variation in the interpretation and application of these outcome data (e.g., use of absolute values for deficit scores).
Studies also varied significantly in statistical approach (i.e., comparisons between clinical/ethnoracial groups, correlational analyses, regression analyses). While some studies used acculturation scores as predictor variables for regression analyses with neuropsychological outcome data as the dependent variable, other studies provided correlational analyses between acculturation and neuropsychological functioning. Some studies compared performance between groups (e.g., Monolingual English speakers and ethnically diverse adults; Razani et al., Reference Razani, Burciaga, Madore and Wong2007a), while others focused on a single ethnoracial group (e.g., Black/African-American, Latinx adults; Manly et al., Reference Manly, Byrd, Touradji and Stern2004). While we elected to separate the results of the present study into two separate meta-analyses (i.e., Pearson’s r correlations, partial r correlations), the variance in statistical approaches continues to merit reflection. For example, it is important to consider the impact of including different control variables across studies. Some studies controlled for sociodemographic variables (e.g., age, education, as applied in Saez et al., Reference Saez, Bender, Barr, Rivera Mindt, Morrison, Hassenstab, Rodriguez and Vazquez2014) that were unique to their study population, which can alter the magnitude of the relationship between acculturation and neuropsychological functioning.
Third, while the present study provides an overview of the literature examining the impact of acculturation on neuropsychological test performance, the contemporary definition of acculturation is a dynamic, multidimensional process that may change over time. Given that all included studies were cross-sectional and nonexperimental, our ability to infer how acculturation may causally impact test performance is limited. Additionally, half of the acculturation scales used across the included studies relied on the unidimensional framework of acculturation (i.e., Acculturation Rating Scale for Mexican Americans-First and Second edition, Short Acculturation Scale for Latinx, Suinn–Lew Asian Self Identity Acculturation Scale). As discussed previously, the unidimensional framework, which assumes that acculturation is an assimilative process, differs significantly from modern, multidimensional theories. Many of the included studies utilized a unidimensional approach to measure acculturation, and did not provide comparisons between the relationship between U.S. acculturation and neuropsychological test performance, compared to acculturation to one’s country of origin and neuropsychological test performance. Although this was not within the scope of this meta-analysis, future research might examine nondominant acculturation, as well. This highlights the vital need for future neuropsychological research to better integrate multidimensional models and tools for measuring acculturation.
Fourth, it is critical to consider the limits to external validity of the current findings. Specifically, 10 of the 19 studies included in this meta-analytic review were primarily comprised of Latinx samples from across the Latin American diaspora, but most prominently including Mexican/Mexican American and Caribbean Latinx samples. The remaining samples were primarily comprised of Black/African-American samples (k = 3), Asian/Asian-American samples (k = 2 Japanese American and k = 1 Chinese American), and multi-ethnic samples (k = 2; i.e., Latinx, Asian/Asian-American, Middle-Eastern). All studies reported gender information as either percentage of men or women, and did not report data on other gender diverse populations (e.g., nonbinary, transgender). Furthermore, given that the 18 included studies represented ethnoculturally diverse individuals from only eight states in the U.S. (i.e., California, Florida, Illinois, Michigan, New Jersey, New York, Oregon, Texas), it is likely that the present findings may differ based on the ethnocultural, geographic regions, and immigrant populations assessed.
Clinical significance and future directions
These summative findings indicate that acculturation can differentially affect neuropsychological test performance in clinical and ethnocultural populations. Yet recommendations for using acculturation measures in clinical decision-making are sparse in the neuropsychology literature. In order to understand the complex, multifactorial relationship between culture and cognition, it is critical to increase the routine exploration of sociocultural factors such as acculturation in neuropsychological research with ethnoculturally diverse groups.
Several factors should be considered when selecting measures of acculturation. For a brief review of the acculturation scales utilized in the current review, see Supplemental Materials. First, there is evidence to suggest that many of the published tools for assessing acculturation levels have highly variable psychometric properties (e.g., internal consistency) (Medina et al., Reference Medina, Henry, Torres, MacDonald and Strutt2023). Thus, it is important for investigators and clinicians to carefully examine psychometric characteristics and generalizability of acculturation measures prior to use in a research or clinical context. Additionally, investigators should review the conceptual background (e.g., unidimensional vs. bidimensional scale) of the acculturation measure to ensure appropriateness for the clinical/research question. For instance, measures such as the Acculturation Rating Scale for Mexican Americans (ARSMA) (Cuellar et al., Reference Cuellar, Harris and Jasso1980) or the Short Acculturation Scale for Latinx (SASH) (Marin et al., Reference Marin, Sabogal, Marin, Otero-Sabogal and Perez-Stable1987) are grounded in the unidimensional framework of acculturation, while measures such as the Bidimensional Acculturation Scale for Latinx (Marin & Gamba, Reference Marín and Gamba1996) or the Acculturation Rating Scale for Mexican Americans – II (Cuellar et al., Reference Cuellar, Arnold and Maldonado1995) were developed using a bidimensional framework and the AMAS (Zea et al., Reference Zea, Asner-Self, Birman and Buki2003) was grounded in a multidimensional framework.
Second, unlike the multidimensional process of acculturation that has been discussed in the foundational literature, there is evidence that commonly used acculturation measures rarely incorporate a lifespan perspective, such that acculturation tools often think of acculturation as a “static” or trait-like variable, rather than an evolving process influenced by time. For instance, we were unable to identify acculturation scales that were developed specifically for older adult populations and have found few scales for pediatric populations (e.g., Chicano Adolescent Acculturation Scale; Short Acculturation Scale for Latinx Youth). Given these limitations in the current tools for measuring acculturation, we believe it is critical to utilize a combination of validated scales and clinical interview questions (e.g., questions regarding country of origin, migration history, native language, language spoken at home, cultural adjustment, cultural identification, cultural knowledge, traditions, and activities) to better understand the full spectrum of the acculturative process over time.
Third, to improve the external validity of the current findings, future research is needed to better understand and extend the current findings. Specifically, there is a need to examine these associations across broader ethnocultural, geographic, and immigrant populations. There is a particular need for such research in Black/African-American, Asian (e.g., Korean, Southeast Asian, South Asian), and Middle-Eastern populations, as well across broader geographic regions (e.g., Midwest, the South), and consideration of the intersection between these factors and immigration variables.
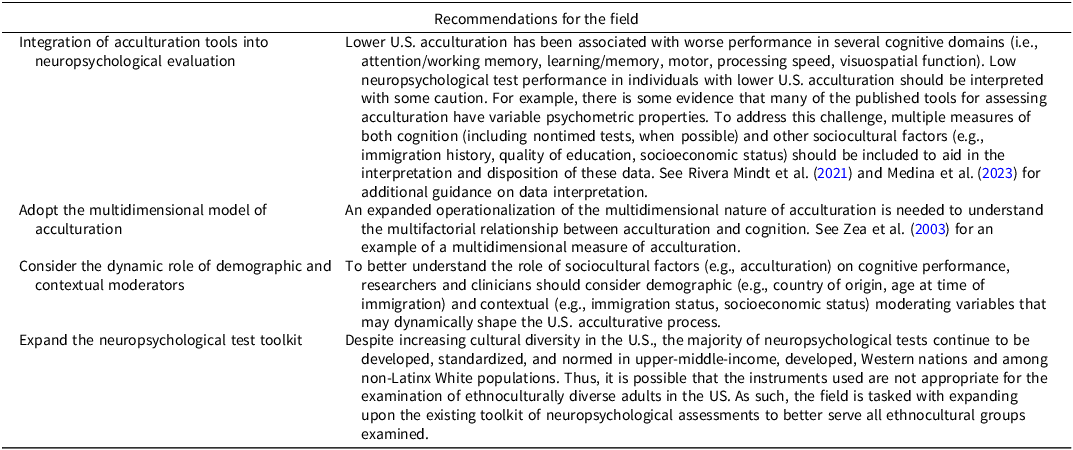
Fourth, in the context of a neuropsychological evaluation, it may be important to consider the impact of the acculturative process on brain-behavior relationships over time. To do this, we recommend consideration of the “ABC” framework of the acculturative process (antecedents, behaviors, and consequent acculturative changes) proposed by Medina et al. (Reference Medina, Henry, Torres, MacDonald and Strutt2023). For example, examiners should consider inquiring about the antecedents (e.g., early life experiences, prejudice/discrimination, sociopolitical climate), behaviors (e.g., language use, media use, food, traditions), and consequent changes (e.g., assimilation, cultural identity/pride, language proficiency/preference) that have occurred throughout the acculturative process. Implementation of this “ABC” framework or similar frameworks (e.g., ECLECTIC framework, Fujii, Reference Fujii2018) for working with culturally diverse populations and understanding the acculturative process can positively impact the overall neuropsychological evaluation, including the clinical interview, score interpretation, rapport building, and development of tailored, patient centered recommendations. For example, clinical neuropsychologists may elect to ask specific questions regarding a patient’s acculturative process based upon information gathered through an initial chart review and the clinical interview (e.g., early life experiences, age of immigration, language use, cultural identity). Clinicians should aim to tailor questions based on the information gathered, as understanding an examinee’s acculturative process can positively impact the overall neuropsychological evaluation. Please see Table 5 below for our targeted recommendations for the integration of acculturation information and neuropsychological data.
Targeted recommendations for the integration of acculturation into neuropsychological practice
This meta-analytic review highlighted several limitations in the literature, which may guide future research in this area. First, it is important to expand the present findings and explore these relationships across other ethnocultural groups and continents. For example, the acculturative process may differentially impact specific immigrant groups, and as such, neuropsychological performances among these groups. Furthermore, given that the present findings highlight a significant underrepresentation of some ethnoculturally diverse populations (e.g., American Indian/Alaskan Native, Middle-Eastern/North African, Southeast and Central Asian) in the literature, further study is necessary. Second, future research should adopt multidimensional frameworks and measures in their assessment of acculturation. Moreover, future research should also integrate additional measures of acculturative constructs (e.g., protective acculturative strategies, acculturative stress) that may contribute to these relationships. Third, given variability in the clinical and ethnocultural populations examined within this meta-analysis, future studies may consider conducting separate meta-analyses based on specific ethnocultural and clinical populations to identify unique patterns in the relationship between acculturation and neurocognitive functioning. Similarly, future studies may also consider conducting separate, domain or test-level meta-analyses examining specific neuropsychological tests and how the skills assessed may be uniquely related to acculturation level. Fourth, additional moderating factors that impact the magnitude of the relationship between acculturation and cognition should be explored.
In sum, these findings provide the first, comprehensive meta-analytic review examining the relationship between acculturation and neuropsychological performance among diverse populations. Results highlight a small to medium sized, significant relationship between greater U.S. acculturation and better neuropsychological test performance across studies, with language of testing emerging as the only significant moderator. Finally, though the overall literature has not explicitly discussed the implementation and clinical utility of acculturation tools in clinical neuropsychological assessment to date, the present study also underscores the need to examine the clinical utility of acculturation tools in conjunction with neuropsychological test data to better assist in data interpretation and clinical decision making with diverse patient populations.
Supplementary material
The supplementary material for this article can be found at https://doi.org/10.1017/S1355617725101264.
Funding statement
This research received no external funding. MRM was supported by NIH/NIA R01AG065110.
Competing interests
MRM has received research support from NIA, NIGMS, Genentech Charitable Foundation, and Alzheimer’s Association; speaker honoraria from Harvard University, Alzheimer’s Association, University of Texas, Annual Human Amyloid Imaging Conference, American Neurological Association Conference; served on the Data Safety Monitoring Board (DSMB) for the NEAR project, and advisory boards for Einstein/Rockefeller/Hunter CFAR (ERC-CFAR) HIV and Mental Health Scientific Working Group, CDC/National Alzheimer’s Project Act (NAPA) Physical Activity, Tobacco Use, and Alcohol Workgroup, Centers for Disease Control and Prevention (CDC) BOLD Public Health Center of Excellence on Dementia Risk Reduction Expert Panel, Brown University Center for Alzheimer’s Disease Research Center/Carney Institute for Brain Science, ARTFL LEFFTDS Longitudinal Frontotemporal Lobar Degeneration (ALLFTD) External Advisory Board (NIH/NIA#: U19AG063911; MPIs: A. Boxer, B. Boeve, H. Rosen), Diversity in Aging Research, Cognitive Loss and Dementia (RADAR; NIH/NIA:5R24AG06516; PI: M. Sano), University of Washington Alzheimer’s Disease Research Center Advisory Board (NIH/NIA#: P50AG005136; PI: T.J. Grabowski), National Centralized Repository for ADRD (NCRAD) Executive Committee (NIH/NIA#:U24AG021886; PI: T. Foroud), University of California, San Francisco Alzheimer’s Disease Research Center Advisory Board (NIH/NIA: P30AG062422Project-05; PI: G. Ravinovici), Mayo Clinic Alzheimer’s Disease Research Center Advisory Board (NIH/NIA#:P50G016574; PI: R. Petersen), is the treasurer of the Harlem Community and Academic Partnership, and serves on the editorial board of Alzheimer’s and Dementia: Behavior and Socioeconomics of Aging.
AA has received research support from NIA and NIGMS, honoraria from NIA (BMBH), is a committee member of APA’s Women in Neuropsychology, and serves on the editorial board of Alzheimer’s and Dementia: Behavior and Socioeconomics of Aging.
MZ has received research funding from NIH (R01 NS123445 and R01 NS123374).
MA, QH, DSO, HC, EAB, AWS, DZ, HC have no competing interests to report.


 Open access