

Lipids are the main components of the brain, in which they represent 50 % of its dry weight. In brain membranes, PUFA represent 35 % of the total fatty acids. Among these PUFA, n-3 long-chain PUFA (n-3 LC-PUFA), such as DHA (22 : 6n-3), play a critical role in the maintenance of cognitive functions such as learning and memory during normal and pathological ageing( Reference Denis, Potier and Vancassel 1 – Reference Cunnane, Plourde and Pifferi 3 ). Several studies( Reference Guesnet and Alessandri 4 , Reference Horrocks and Farooqui 5 ) have suggested that the ability of n-3 LC-PUFA to modulate brain functions is closely dependent on their levels in cerebral membranes, which is related to dietary intake. In fact, a low de novo synthesis of n-3 LC-PUFA occurs in the brain from their precursor, α-linolenic acid (18 : 3n-3), and several data have suggested that the major n-3 LC-PUFA requirements in the brain are covered by the circulating pool of fatty acids, which itself depends on dietary intake( Reference Rapoport and Igarashi 6 , Reference Rapoport 7 ). The abundance of n-3 LC-PUFA is brain region-specific( Reference Xiao, Huang and Chen 8 ) and dependent on phospholipid (PL) classes in brain membranes( Reference Dyall, Michael and Whelpton 9 ). DHA is preferentially enriched in the prefrontal cortex and hippocampus( Reference Xiao, Huang and Chen 8 , Reference Dyall, Michael and Whelpton 9 ), which are brain regions involved in memory processes and are particularly vulnerable to ageing( Reference Lister and Barnes 10 – Reference Mizumori and Jo 12 ). DHA is also present in other brain regions such as the striatum but at a lower proportion( Reference Xiao, Huang and Chen 8 , Reference Dyall, Michael and Whelpton 9 ). In the rat brain, DHA is mainly esterified to phosphatidylethanolamine (PE) and phosphatidylcholine (PC), which are the major cerebral membrane PL fractions (36–40 % and 42–44 % of the total PL, respectively). DHA represents 15 to 20 % of the total fatty acids in PE and 3 to 5 % of the total fatty acids in PC( Reference Dyall, Michael and Whelpton 9 , Reference Sastry 13 ).
Ageing is associated with multiple impairments, including changes in the lipid composition of brain membranes and mainly changes in the DHA content. However, depending on the age and diet of animals, and also on the brain regions and PL classes studied, data on the brain lipid composition differ from one study to another. Thus, most studies have shown lower DHA contents in the whole brain of aged rodents( Reference Barcelo-Coblijn, Hogyes and Kitajka 14 – Reference Arranz, Naudi and De la Fuente 16 ) or in certain brain regions such as the hippocampus( Reference Favrelière, Perault and Huguet 17 ) or cerebral cortex( Reference Little, Lynch and Manku 18 ). On the contrary, some studies have measured higher DHA contents in specific brain regions of aged rats such as the hippocampus( Reference André, Juanéda and Sébédio 19 ) or the midbrain, striatum, medulla or cerebellum( Reference Xiao, Huang and Chen 8 ), while another study has not highlighted any age-related modifications( Reference Ulmann, Mimouni and Roux 20 ). During ageing, a preferential decrease in total PE was observed in the rat hippocampus, which was associated with a decrease in the total hippocampal DHA contents( Reference Favrelière, Perault and Huguet 17 , Reference Favrelière, Stadelmann-Ingrand and Huguet 21 ). More precisely, regarding the class of PL, a selective decrease in the DHA contents of PE and PC in the hippocampus and frontal cortex has already been observed both in aged animals and in elderly people( Reference Dyall, Michael and Whelpton 9 , Reference Latour, Grintal and Champeil-Potokar 22 , Reference Soderberg, Edlund and Kristensson 23 ). Furthermore, numerous studies carried out in aged rodents have shown that intake of n-3 LC-PUFA-enriched diets either in the form of TAG( Reference Dyall, Michael and Whelpton 9 , Reference Labrousse, Nadjar and Joffre 15 ), PL( Reference Favrelière, Perault and Huguet 17 ) or ethyl esters( Reference Little, Lynch and Manku 18 ) can prevent changes in the brain fatty acid composition, thus helping to maintain cognitive functions during ageing( Reference Alfos, Watson and De Meester 24 ). Studies have suggested that dietary LC-PUFA in the form of TAG or PL may be differently absorbed and may differently affect lipoprotein metabolism( Reference Ramirez, Amate and Gil 25 ). Therefore, the efficacy of DHA to accumulate in the brain may be different according to the dietary TAG or PL form. While investigations on this field gave conflicting results and are still controversial, it seems clear that in humans, the major dietary form of fatty acids is TAG.
From the perspective of a strategy of preventive nutrition to delay brain ageing, it is crucial to understand the evolution of the brain DHA content during ageing. The literature suggests that a decreased DHA content may increase vulnerability to functional alterations occurring during ageing. Therefore, it is necessary to identify blood biomarkers of n-3 LC-PUFA status in brain membranes in order to help prevent age-related cognitive decline processes. Although the mechanisms by which fatty acids enter the brain are still being discussed, a number of studies have reported several correlations between the circulating fatty acid pool and the n-3 LC-PUFA brain content in response to a dietary fatty acid intake in adult rats( Reference Tu, Muhlhausler and Yelland 26 , Reference Stark 27 ) and human subjects( Reference Kuratko and Salem 28 ). These results suggest that it could be possible to identify reliable and readily available blood biomarkers of brain DHA status. However, the relationship between the pool of circulating fatty acids and n-3 LC-PUFA brain status could vary according to the brain region and the PL class, and could be modified with ageing. To our knowledge, there are missing data concerning the effects of ageing and of n-3 LC-PUFA supplementation on both brain and blood fatty acid compositions. Thus, a blood biomarker of brain n-3 PUFA status, taking into account age, specific brain regions and specific PL classes, still needs to be determined.
In this context, the aim of the present study was to determine the relationship between the fatty acid composition in the blood as well as the composition in several brain regions during ageing and n-3 LC-PUFA supplementation in rats. To address this issue, the present study was carried out in adult and aged rats fed a diet that was free from n-3 LC-PUFA, as well as in aged rats fed an EPA/DHA-enriched diet. We then analysed the fatty acid contents in both the blood (in plasma total lipids, and in the PE and PC fractions of erythrocyte membranes) and in the PE and PC fractions of three brain regions underlying memory processes: hippocampus; striatum; prefrontal cortex.
Materials and methods
Animals
The study was conducted according to the INRA Quality Reference System and to the directive 2010/63/UE of the European Parliament and of the Council on the protection of animals used for scientific purposes. The protocols were approved by the French Ministry for Higher Education and Research and the Animal Care and Use Committee of Bordeaux (no. 5012051-A).
For the present study, 3-week-old (adult) and 13-month-old (aged) male Wistar rats purchased from Janvier (France) were maintained under standard housing conditions in a temperature (22 ± 1°C)- and humidity-controlled room (40 %) with a 12 h light–12 h dark cycle. All of the animals were fed and given water ad libitum. After 1 week of acclimatisation to the housing conditions with a standard diet, the aged rats were randomly divided into two groups (n 9–10 per group): the first group received a control diet (aged control group) and the second group received an EPA/DHA-enriched diet (aged EPA/DHA group). The 3-week-old rats (n 10) exclusively received the control diet (adult control group). All of the diets were given for 21 weeks. Every effort was made to minimise the number of animals used. The number of animals in each group was determined based on previous studies( Reference Xiao, Huang and Chen 8 , Reference Dyall, Michael and Whelpton 9 , Reference Engler, Engler and Nguyen 29 ) showing significant alteration of fatty acid composition in the plasma and brain of rats during ageing.
Diets
The control diet was free from LC-PUFA and consisted of a mix of peanut, colza and sunflower oils (60:25:15, by weight) added to a fat-free diet containing (per 100 g) casein 19 g, maize starch 42·1 g, sucrose 31·5 g, fibre 2·1 g, dl-methionine 0·1 g, vitamin mix 1 g and mineral mix 4·2 g (UPAE-INRA). The EPA/DHA-supplemented diet was a mix of fish, colza and sunflower oils (50:20:30, by weight) added to the fat-free diet. Each diet contained 5 g/100 g oil. Fatty acids, including EPA and DHA in the supplemented diet, were supplied by oils in the form of TAG. The composition of the diets detailed in Table 1 shows that the two diets supplied the same amount of α-linolenic acid as shown by the similar 18 : 2n-6/18 : 3n-3 ratio. The diets were prepared every 2 d and stored at 4°C until their use. Food was given daily between 17.00 and 19.00 hours.
Composition of the experimental diets
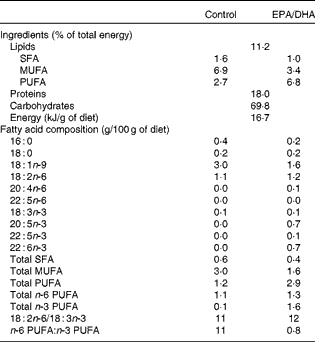
16 : 0, Palmitic acid; 18 : 0, stearic acid; 18 : 1n-9, oleic acid; 18 : 2n-6, linoleic acid; 20 : 4n-6, arachidonic acid; 22 : 5n-3 or 22 : 5n-6, docosapentaenoic acid; 18 : 3n-3, α-linolenic acid; 20 : 5n-3, EPA; 22 : 6n-3, DHA.
At the end of the 21-week feeding period, the adult rats (6 months old) and aged rats (18 months old) were euthanised and then decapitated. Blood was collected from the sectioned jugular vein and rapidly centrifuged to obtain plasma and erythrocytes, which were stored at − 80°C until analysis. The brain was quickly removed, and the whole hippocampus, striatum and prefrontal cortex were dissected out bilaterally and rapidly frozen and stored at − 80°C until lipid analysis.
Lipid analysis
Plasma total lipids
Total fatty acids from plasma were methylated according to the method described by Lepage & Roy( Reference Lepage and Roy 30 ). Briefly, 2 ml of methanol–isooctane (4:1, v/v) and 300 μl of acetyl chloride were added to 200 μl of plasma for 1 h at 100°C. To stop the reaction, 5 ml of 6 % Na2CO3 (w/v) were added to the mixture. After centrifugation, the upper phase containing fatty acid methyl esters (FAME) was removed, evaporated to dryness under a stream of N2, redissolved in hexane and then stored at − 20°C until further analysis.
Erythrocyte membrane phospholipids
Isolation of phosphatidylethanolamine and phosphatidylcholine
Erythrocyte membrane PL were extracted, according to the method proposed by Peuchant et al. ( Reference Peuchant, Wolff and Salles 31 ), with twenty volumes of isopropanol per g of erythrocytes. The extraction was carried out under agitation at room temperature for 10 min. The extract was filtered with isopropanol; the solvent was evaporated under vacuum at room temperature with a rotary evaporator. The residue was extracted again with chloroform–methanol (2:1, v/v), and then filtered. The solvent was evaporated to dryness under a stream of N2. The lipids were taken up in an appropriate volume of chloroform–methanol (2:1, v/v). PE and PC from erythrocytes were isolated from other PL classes by TLC using plates that were pre-coated with 0·35 mm of silica gel 60 H (Merck). The solvent system used for the separation was a mixture of chloroform–methanol–acetic acid–distilled water (50:37·5:3·5:2, by vol.). After migration and detection with 2,7-dichlorofluorescein (0·2 % in ethanol, w/v), the silica gel areas corresponding to PE and PC were visualised under UV light (254 nm), removed from the TLC plate and transferred to a glass tube for preparation of FAME.
Brain membrane phospholipids
Isolation of phosphatidylethanolamine and phosphatidylcholine
Total lipids from the hippocampus, striatum and frontal cortex were extracted using a method adapted from Folch et al. ( Reference Folch, Lees and Sloane Stanley 32 ) by twenty volumes of chloroform–methanol (2:1, v/v) per g of tissue. The extraction was carried out under agitation at room temperature. After 1 h, 0·2 volume of KCl (0·8 % in water, w/v) per volume of the extraction mixture was added, and the samples were centrifuged to separate the chloroform and hydroalcoholic phases. The hydroalcoholic phase was removed and the chloroform phase containing the fatty acids was filtered with chloroform–methanol (2:1, v/v), and then the solvent was evaporated under vacuum at room temperature with a rotary evaporator. The extracts were re-dissolved in chloroform and filtered to obtain a chloroform solution. The solvent was evaporated under N2 and the dry extracts were finally dissolved again in chloroform–methanol (2:1, v/v). PE and PC contained in the Folch extracts obtained from the brain regions were isolated from other lipid classes by TLC, as described previously for erythrocyte PE and PC.
Preparation of fatty acid methyl esters
PE and PC total fatty acid contents that were isolated from erythrocytes and from the three brain regions were methylated and analysed as described previously( Reference Buaud, Esterle and Vaysse 33 ). The total fatty acid chains of PE and PC were transmethylated according to the method proposed by Morrison & Smith( Reference Morrison and Smith 34 ). Briefly, 1 ml boron trifluoride–methanol solution (14 %, w/v; Sigma Chemical Company) was added to the silica gel containing the PL fraction in a glass tube maintained at 100°C for 20 min. After the addition of 1 ml NaOH (5 m), FAME were extracted three times with 2 ml of isooctane. The organic phases were concentrated, washed with 1 ml of water and stored at − 20°C until GC analysis.
Fatty acid methyl ester analysis
FAME analysis was performed in a blinded fashion with a gas chromatograph equipped with a flame ionisation detector and a split injector. A fused silica capillary column (BPX 70, 60 m × 0·25 mm internal diameter, 0·25 mm film; Phenomenex) was used with H2 as the carrier gas (inlet pressure: 1 bar). The column temperature was programmed to increase from 150 to 200°C at 1·5°C/min for 25 min, and then from 200 to 225°C at 20°C/min and was held at 225°C until the completion of the analysis (20 min). The injection port and detector were maintained at 250 and 280°C, respectively. The GC peaks were integrated using a ChromJet SP4400 integration system (Spectra-Physics). Individual FAME were identified by comparing their retention times with those of authentic standards eluted in the same conditions (Sigma Chemical Company). Results are expressed as a percentage of total fatty acids.
Statistical analyses
Results are presented as means with their standard errors of the mean. Statistical analyses were performed using the StatView 5.0 software (SAS Institute Inc.). Data were analysed using a one-way ANOVA followed by a Student's t test with a Bonferroni correction for multiple group comparison. Using the Bonferroni correction for significance-level adjustments of P≤ 0·025, two pairwise comparisons were performed between the adult and aged rats (effect of age) and between the aged and EPA/DHA-supplemented aged rats (effect of supplementation). Pearson's correlation was used to identify significant relationships between the fatty acid compositions in the plasma and erythrocyte membranes, and PE and PC fatty acid composition from the hippocampus, striatum and prefrontal cortex.
Results
Effect of age and diet on plasma fatty acid composition
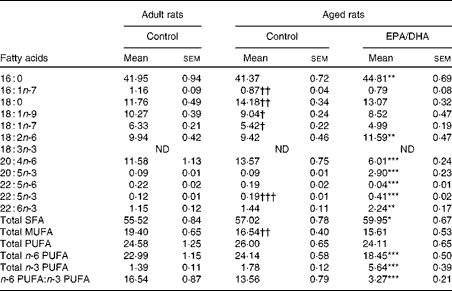
Table 2 shows the plasma fatty acid composition of the adult and aged rats fed either the control diet or the EPA/DHA-supplemented diet.
Fatty acid composition (% of total fatty acids) of plasma total lipids in rats fed either the control diet or the EPA/DHA-supplemented diet (Mean values with their standard errors)

16 : 0, Palmitic acid; 16 : 1n-7, palmitoleic acid; 18 : 0, stearic acid; 18 : 1n-9, oleic acid; 18 : 1n-7, trans-vaccenic acid; 18 : 2n-6, linoleic acid; 18 : 3n-3, α-linolenic acid; 20 : 4n-6, arachidonic acid; 20 : 5n-3, EPA; 22 : 5n-3 or 22 : 5n-6, docosapentaenoic acid; 22 : 6n-3, DHA.
Mean value was significantly different from that of the aged control group: * P< 0·025, ** P< 0·01, *** P< 0·001 (Student's t test after Bonferroni correction).
Mean value was significantly different from that of the adult control group: †† P< 0·01, ††† P< 0·001 (Student's t test after Bonferroni correction).
Effect of age
The plasma of the aged control rats exhibited a significantly lower level of the total MUFA content than that of the adult rats. Palmitoleic acid (16 : 1n-7; − 20 %, P< 0·01), oleic acid (18 : 1n-9; − 23 %, P< 0·001) and trans-vaccenic acid (18 : 1n-7; − 20 %, P< 0·001) contents were lower in the plasma of the aged control rats than that of the adult rats. The total n-6 and n-3 PUFA contents were higher in the plasma of the aged rats, due to the higher levels of arachidonic acid (AA, 20 : 4n-6;+41 %, P< 0·001), EPA (20 : 5n-3;+26 %, P< 0·01), n-3 docosapentaenoic acid (n-3 DPA, 22 : 5n-3;+74 %, P< 0·001) and DHA (22:6 n-3;+23 %, P< 0·01).
Effect of diet
The aged EPA/DHA group exhibited a higher content of SFA than the aged control group, partly due to a higher level of palmitic acid (16 : 0;+11 %, P< 0·01). In contrast, the total MUFA proportion was lower in the aged EPA/DHA group than in the aged control group. This effect was a result of the lower levels of oleic acid ( − 47 %, P< 0·001) and trans-vaccenic acid ( − 31 %, P< 0·001) in the aged EPA/DHA group than in the aged control group. Furthermore, the aged EPA/DHA group showed higher levels of n-3 PUFA such as EPA, DPA and DHA compared with the aged control group (initial values being multiplied by 36 (P< 0·001), 5 (P< 0·001) and 4 (P< 0·001), respectively). This high level of n-3 PUFA was associated with the lower levels of n-6 PUFA such as AA ( − 44 %, P< 0·001) and n-6 DPA ( − 47 %, P< 0·001).
Effect of age and diet on erythrocyte phosphatidylethanolamine fatty acid composition
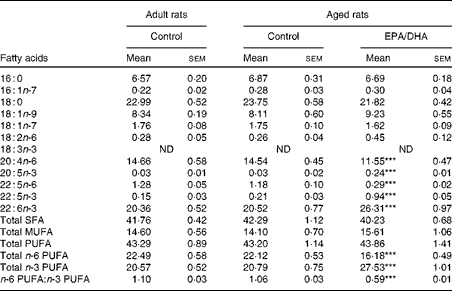
The fatty acid composition of erythrocyte PE in the adult and aged rats that were fed either the control diet or the EPA/DHA-supplemented diet is presented in Table 3.
Fatty acid composition (% of total fatty acids) of erythrocyte phosphatidylethanolamine in rats fed either the control diet or the EPA/DHA-supplemented diet (Mean values with their standard errors)

16 : 0, Palmitic acid; 16 : 1n-7, palmitoleic acid; 18 : 0, stearic acid; 18 : 1n-9, oleic acid; 18 : 1n-7, trans-vaccenic acid; 18 : 2n-6, linoleic acid; 18 : 3n-3, α-linolenic acid; ND, not detected; 20 : 4n-6, arachidonic acid; 20 : 5n-3, EPA; 22 : 5n-3 or 22 : 5n-6, docosapentaenoic acid; 22 : 6n-3, DHA.
Mean value was significantly different from that of the aged control group: * P< 0·025, *** P< 0·001 (Student's t test after Bonferroni correction).
Mean value was significantly different from that of the adult control group: †† P< 0·01, ††† P< 0·001 (Student's t test after Bonferroni correction).
Effect of age
Regarding the erythrocyte PE fatty acid composition, only the n-3 and n-6 DPA contents were modified with age: the n-6 DPA proportion was lower ( − 24 %, P< 0·01) and the n-3 DPA content was higher (+43 %, P< 0·001) in the aged control rats than in the adult control rats.
Effect of diet
The MUFA content was lower in the aged EPA/DHA group than in the aged control group ( − 29 %, P< 0·001), partly resulting from a lower oleic acid content ( − 21 %, P< 0·025). Regarding the PUFA content, the EPA, n-3 DPA and DHA levels were higher in the aged EPA/DHA group than in the aged control group (levels being increased by 38 (P< 0·001), 2·5 (P< 0·001) and 3 (P< 0·001), respectively). At the same time, a drastic reduction in the total n-6 PUFA content was observed, resulting from the lower levels of AA ( − 25 %, P< 0·001) and n-6 DPA ( − 81 %, P< 0·001) in the aged EPA/DHA group than in the aged control group. Finally, linoleic acid (LA, 18 : 2 n-6) content was higher in the aged EPA/DHA group than in the aged control group (+29 %, P< 0·025).
Effect of age and diet on erythrocyte phosphatidylcholine fatty acid composition
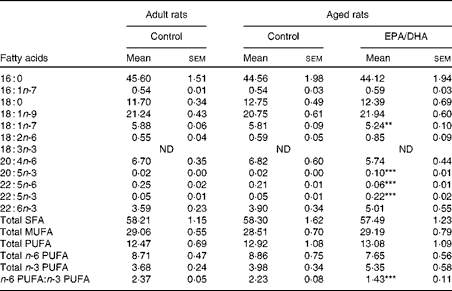
The fatty acid composition of erythrocyte PC in the adult and aged rats that were fed either the control diet or the EPA/DHA-enriched diet is presented in Table 4.
Fatty acid composition (% of total fatty acids) of erythrocyte phosphatidylcholine in rats fed either the control diet or the EPA/DHA-supplemented diet (Mean values with their standard errors)
16 : 0, Palmitic acid; 16 : 1n-7, palmitoleic acid; 18 : 0, stearic acid; 18 : 1n-9, oleic acid; 18 : 1n-7, trans-vaccenic acid; 18 : 2n-6, linoleic acid; 18 : 3n-3, α-linolenic acid; ND, not detected; 20 : 4n-6, arachidonic acid; 20 : 5n-3, EPA; 22 : 5n-3 or 22 : 5n-6, docosapentaenoic acid; 22 : 6n-3, DHA.
Mean value was significantly different from that of the aged control group: * P< 0·025, ** P< 0·01, *** P< 0·001 (Student's t test after Bonferroni correction).
Mean value was significantly different from that of the adult control group: † P< 0·025, †† P< 0·01, ††† P< 0·001 (Student's t test after Bonferroni correction).
Effect of age
MUFA content was lower in the aged control rats than in the adult control rats ( − 15 %, P< 0·01), as a result of lower levels of palmitoleic acid ( − 25 %, P< 0·01), oleic acid ( − 12 %, P< 0·025) and trans-vaccenic acid ( − 14 %, P< 0·025). Additionally, it should be noted that in the aged control rats, the levels of stearic acid (18 : 0;+21 %, P< 0·01) and n-3 DPA (+58 %, P< 0·001) were higher than in the adult control rats.
Effect of diet
Palmitic acid content was slightly higher (+8 %, P< 0·01) in the aged EPA/DHA group than in the aged control group. The enriched EPA/DHA diet led to a drastic elevation of the total n-3 PUFA level (increased by 3, P< 0·001) in the aged EPA/DHA group, due to the higher levels of EPA, n-3 DPA and DHA (increased by 32 (P< 0·001), 2 (P< 0·001) and 1·5 (P< 0·01), respectively). By contrast, the total n-6 PUFA level was reduced ( − 23 %, P< 0·001), due to the lower levels of AA and n-6 DPA ( − 56 %, P< 0·001; − 79 %, P< 0·001) in the aged EPA/DHA group than in the aged control group. LA content was higher in the aged EPA/DHA group than in the aged control group (+23 %, P< 0·01).
The fatty acid compositions of the hippocampus, striatum and prefrontal cortex were measured in the two main PL PE and PC.
Effect of age and diet on hippocampal fatty acid composition
The fatty acid compositions of the hippocampal PE and PC are presented in Tables 5 and 6, respectively.
Fatty acid composition (% of total fatty acids) of hippocampal phosphatidylethanolamine in rats fed either the control diet or the EPA/DHA-supplemented diet (Mean values with their standard errors)

16 : 0, Palmitic acid; 16 : 1n-7, palmitoleic acid; 18 : 0, stearic acid; 18 : 1n-9, oleic acid; 18 : 1n-7, trans-vaccenic acid; 18 : 2n-6, linoleic acid; 18 : 3n-3, α-linolenic acid; ND, not detected; 20 : 4n-6, arachidonic acid; 20 : 5n-3, EPA; 22 : 5n-3 or 22 : 5n-6, docosapentaenoic acid; 22 : 6n-3, DHA.
Mean value was significantly different from that of the aged control group: * P< 0·025, *** P< 0·001 (Student's t test after Bonferroni correction).
Mean value was significantly different from that of the adult control group: † P< 0·025, ††† P< 0·001 (Student's t test after Bonferroni correction).
Fatty acid composition (% of total fatty acids) of hippocampal phosphatidylcholine in rats fed either the control diet or the EPA/DHA-supplemented diet (Mean values with their standard errors)

16 : 0, Palmitic acid; 16 : 1n-7, palmitoleic acid; 18 : 0, stearic acid; 18 : 1n-9, oleic acid; 18 : 1n-7, trans-vaccenic acid; 18 : 2n-6, linoleic acid; 18 : 3n-3, α-linolenic acid; ND, not detected; 20 : 4n-6, arachidonic acid; 20 : 5n-3, EPA; 22 : 5n-3 or 22 : 5n-6, docosapentaenoic acid; 22 : 6n-3, DHA.
Mean value was significantly different from that of the aged control group: * P< 0·025, ** P< 0·01, *** P< 0·001 (Student's t test after Bonferroni correction).
Mean value was significantly different from that of the adult control group: † P< 0·025, †† P< 0·01 (Student's t test after Bonferroni correction).
Effect of age
The total MUFA content was higher in the hippocampal PE and PC of the aged control rats than in that of the adult rats, particularly due to the high levels of palmitoleic acid in PE (+30 %, P< 0·001) and oleic acid in PE (+9 %, P< 0·025) and PC (+7 %, P< 0·01). In the hippocampal PC, ageing was associated with a lower DHA level ( − 18 %, P< 0·025) compared with the adult rats.
Effect of diet
Oleic acid content in PE (+12 %, P< 0·001) and palmitoleic acid content in PC (+14 % P< 0·025) were slightly higher in the aged EPA/DHA group than in the aged control group, while trans-vaccenic acid was lower in PC ( − 9 %, P< 0·001). Regarding the total n-3 and n-6 PUFA, their respective levels in both PE and PC were higher (PE: +27 %, P< 0·01; PC: +29 %, P< 0·01) and lower (PE: − 23 %, P< 0·001; PC: − 14 %, P< 0·025) in the aged EPA/DHA group than in the aged control group. In PE and PC, EPA, the n-3 DPA and DHA proportions were higher (PE: increased by 8 (P< 0·001), 5 (P< 0·001) and 1·2 (P< 0·001); PC: increased by 13 (P< 0·001), 2 (P< 0·001) and 1·2 (P< 0·025)), whereas the AA ( − 16 %, P< 0·001) and n-6 DPA ( − 73 %, P< 0·001) levels were lower in PE, and in PC only for AA ( − 19 %, P< 0·01). LA content was higher in both PE (+59 %, P< 0·001) and PC (+32 %, P< 0·01) in the aged EPA/DHA group than in the aged control group.
Effect of age and diet on striatal fatty acid composition
Tables 7 and 8 show the respective fatty acid compositions of striatal PE and PC.
Fatty acid composition (% of total fatty acids) of striatal phosphatidylethanolamine in rats fed either the control diet or the EPA/DHA-supplemented diet (Mean values with their standard errors)

16 : 0, Palmitic acid; 16 : 1n-7, palmitoleic acid; 18 : 0, stearic acid; 18 : 1n-9, oleic acid; 18 : 1n-7, trans-vaccenic acid; 18 : 2n-6, linoleic acid; 18 : 3n-3, α-linolenic acid; ND, not detected; 20 : 4n-6, arachidonic acid; 20 : 5n-3, EPA; 22 : 5n-3 or 22 : 5n-6, docosapentaenoic acid; 22 : 6n-3, DHA.
Mean value was significantly different from that of the aged control group: ** P< 0·01, *** P< 0·001 (Student's t test after Bonferroni correction).
Mean value was significantly different from that of the adult control group: † P< 0·025, †† P< 0·01, ††† P< 0·001 (Student's t test after Bonferroni correction).
Fatty acid composition (% of total fatty acids) of striatal phosphatidylcholine in rats fed either the control diet or the EPA/DHA-supplemented diet (Mean values with their standard errors)

16 : 0, Palmitic acid; 16 : 1n-7, palmitoleic acid; 18 : 0, stearic acid; 18 : 1n-9, oleic acid; 18 : 1n-7, trans-vaccenic acid; 18 : 2n-6, linoleic acid; 18 : 3n-3, α-linolenic acid; ND, not detected; 20 : 4n-6, arachidonic acid; 20 : 5n-3, EPA; 22 : 5n-3 or 22 : 5n-6, docosapentaenoic acid; 22 : 6n-3, DHA.
Mean value was significantly different from that of the aged control group: ** P< 0·01, *** P< 0·001 (Student's t test after Bonferroni correction).
Mean value was significantly different from that of the adult control group: † P< 0·025, †† P< 0·01, ††† P< 0·001 (Student's t test after Bonferroni correction).
Effect of age
Age was associated with a slight decrease in the SFA level in the striatal PE ( − 9 %, P< 0·001). On the contrary, the aged rats exhibited a higher level of total MUFA in both the striatal PE (+15 %, P< 0·001) and PC (+10 %, P< 0·001). This could be explained by the higher levels of trans-vaccenic acid in PE (+19 %, P< 0·001) and of oleic acid in PE (+8 %, P< 0·01) and PC (+10 %, P< 0·01). The total PUFA content was also affected by ageing in PE ( − 7 %, P< 0·025) and PC ( − 20 %, P< 0·025), due to a lower n-3 PUFA level in the aged rats than in the adult control rats, associated more particularly with a decrease in the DHA level in both PL (PE: − 13 %, P< 0·025; PC: − 29 %, P< 0·01).
Effect of diet
The aged EPA/DHA group exhibited higher levels of oleic acid in PE (+12 %, P< 0·001) and PC (+2 %, P< 0·001) and palmitoleic acid in PC (+22 %, P< 0·01), and a lower level of trans-vaccenic acid in PC ( − 8 %, P< 0·001) compared with the aged control group. In PE, the total n-3 PUFA level was higher due to an increase in the n-3 DPA and DHA proportions (increased by 4 (P< 0·001) and +20 % (P< 0·01), respectively) in the aged EPA/DHA group than in the aged control group. In contrast, the total n-6 PUFA level was lower in the aged EPA/DHA group than in the aged control group, due to a decrease in the levels of AA ( − 22 %, P< 0·001) and n-6 DPA ( − 67 %, P< 0·001). In PC, the increased level of DHA in the aged EPA/DHA group was not statistically significant; however, there was a significantly higher level of n-3 DPA (increased by 2, P< 0·001) and a lower level of n-6 DPA ( − 75 %, P< 0·001) than in the aged control group.
Effect of age and diet on cortical fatty acid composition
The cortical PE and PC fatty acid compositions are presented in Tables 9 and 10, respectively.
Fatty acid composition (% of total fatty acids) of cortical phosphatidylethanolamine in rats fed either the control diet or the EPA/DHA-supplemented diet (Mean values with their standard errors)
16 : 0, Palmitic acid; 16 : 1n-7, palmitoleic acid; 18 : 0, stearic acid; 18 : 1n-9, oleic acid; 18 : 1n-7, trans-vaccenic acid; 18 : 2n-6, linoleic acid; 18 : 3n-3, α-linolenic acid; ND, not detected; 20 : 4n-6, arachidonic acid; 20 : 5n-3, EPA; 22 : 5n-3 or 22 : 5n-6, docosapentaenoic acid; 22 : 6n-3, DHA.
*** Mean value was significantly different from that of the aged control group (P< 0·001; Student's t test after Bonferroni correction).
Fatty acid composition (% of total fatty acids) of cortical phosphatidylcholine in rats fed either the control diet or the EPA/DHA-supplemented diet (Mean values with their standard errors)
16 : 0, Palmitic acid; 16 : 1n-7, palmitoleic acid; 18 : 0, stearic acid; 18 : 1n-9, oleic acid; 18 : 1n-7, trans-vaccenic acid; 18 : 2n-6, linoleic acid; 18 : 3n-3, α-linolenic acid; ND, not detected; 20 : 4n-6, arachidonic acid; 20 : 5n-3, EPA; 22 : 5n-3 or 22 : 5n-6, docosapentaenoic acid; 22 : 6n-3, DHA.
Mean value was significantly different from that of the aged control group: ** P< 0·01, *** P< 0·001 (Student's t test after Bonferroni correction).
Effect of age
No statistically significant effect of age was observed in the fatty acid composition of cortical PE and PC.
Effect of diet
In the cortical PE of the aged EPA/DHA group, the total n-3 PUFA content was higher (+23 %, P< 0·001) than in the aged control group due to the higher levels of EPA, n-3 DPA and DHA (increased by 8 (P< 0·001), 4 (P< 0·001) and 1·3 (P< 0·001), respectively). This increase was associated with an equivalent reduction in the total n-6 PUFA content ( − 27 %, P< 0·001), represented by AA ( − 21 %, P< 0·001) and n-6 DPA ( − 75 %, P< 0·001). Regarding the cortical PC of the aged EPA/DHA group, the n-3 PUFA levels were higher than in those of the aged control group due to an increase in the levels of EPA (increased by 5, P< 0·001) and n-3 DPA (increased by 4, P< 0·001). In contrast, the aged EPA/DHA group exhibited a lower n-6 DPA proportion ( − 71 %, P< 0·001), and a lower trans-vaccenic acid level ( − 10 %, P< 0·01) compared with the aged control group.
Relationship between fatty acid compositions in plasma and erythrocytes and fatty acid compositions of phosphatidylethanolamine and phosphatidylcholine from the brain regions
Aged rats exhibited an increase in n-3 LC-PUFA levels in the plasma and a decrease in some brain regions, suggesting an inverse relationship for the n-3 LC-PUFA between the plasma and the brain. Therefore, we first investigated the relationship between n-3 LC-PUFA contents in the plasma and brain regions of the adult and aged rats. As illustrated in Fig. 1 for the hippocampus, correlation analyses revealed no significant relationship between the DHA level in the plasma and the DHA level in the PC and PE fractions in this brain region. Similar results were obtained for the striatum and the cortex, and for other n-3 LC-PUFA (all P>0·05). As the fatty acid profile of erythrocyte membranes is known to reflect dietary intakes over a longer period, due to their longer half-life, as compared with the plasma( Reference Arab 35 ), we then investigated the putative relationship between the fatty acid composition of PE and PC in erythrocytes and brain regions. As presented in Fig. 2, significant positive associations between the DHA content in erythrocyte PE and in hippocampal and cortical PE were observed (Fig. 2(a), P< 0·01, r 0·610; Fig. 2(c), P< 0·001, r 0·667). The same analysis was performed between the DHA levels in erythrocyte PC and the levels in the three brain regions without showing any significant relationship (data not shown).
Correlations between the DHA level in the plasma and the DHA levels in the phosphatidylethanolamine (PE) (a) and phosphatidylcholine (PC) (b) fractions of the hippocampus in the adult and aged rats. r: Pearson's correlation coefficient. (a) P= 0·29; r − 0·25; NS. (b) P= 0·37; r − 0·21; NS.

Correlations of DHA levels in the phosphatidylethanolamine (PE) fraction between erythrocytes and (a) hippocampus, (b) striatum and (c) prefrontal cortex in the control and EPA/DHA-supplemented aged rats. r: Pearson's correlation coefficient. (a) P< 0·01; r 0·610; r 2 0·372. (b) P= 0·08; r 0·34; NS. (c) P< 0·001; r 0·667; r 2 0·445.

Discussion
The present results showed a higher total PUFA level in the plasma of aged rats compared with that of adult rats that can be explained by an increase in n-6 and n-3 PUFA levels and more particularly in AA, EPA, n-3 DPA and DHA, suggesting an age-related lipid metabolism alteration. Limited data are available in animals regarding the effects of ageing on the plasma fatty acid composition. Although Ruggiero et al. ( Reference Ruggiero, Cafagna and Gadaleta 36 ) previously described a decrease in PUFA and an increase in MUFA in the plasma of 28-month-old compared with 4-month-old Fischer rats, Engler et al. ( Reference Engler, Engler and Nguyen 29 ) observed a similar increase in the total PUFA, specifically n-6 PUFA, in the plasma of 15-month-old compared with 4-month-old Fischer 344 rats. Knowing that the plasma fatty acid pool is the major source of PUFA for the brain( Reference Rapoport 37 , Reference Spector 38 ), such an alteration in the plasma fatty acid composition may have important consequences for the bioavailability of n-3 PUFA to the brain.
To our knowledge, the present study is the first to measure fatty acid contents in the PE and PC fractions of erythrocytes in rats during ageing. With regard to plasma, the n-3 DPA contents were increased both in the PE and PC fractions of erythrocyte membranes in aged rats compared with adult rats. As observed in the plasma, the total MUFA content in the PC fraction of erythrocytes was reduced in aged rats, indicating a higher vulnerability to ageing for this PL class. It should be noted that PC is the major PL class and represents 32 % (v. 21 % for PE) of the total lipids in the erythrocyte membranes( Reference Christie 39 ).
While n-6 PUFA contents remained stable during ageing in both PE and PC in the three studied brain regions, the n-3 PUFA, mainly DHA, contents decreased in the striatal PL, and only in the hippocampal PC. These results are in agreement with a previous study of Dyall et al. ( Reference Dyall, Michael and Whelpton 9 ) who measured a decrease in DHA in the hippocampal and striatal PE and PC but not in the cortical PC in 24-month-old rats compared with 3-month-old rats. Several mechanisms could be involved to explain this decrease. First, the reduced DHA level in brain PL may be the result of a reduction in the activity of enzymes allowing the incorporation of DHA into brain PL, as previously shown during ageing( Reference André, Juanéda and Sébédio 19 , Reference Giusto, Salvador and Castagnet 40 ). Moreover, in the present study, we observed during ageing, on the one hand, an increase in the plasma and erythrocyte n-3 LC-PUFA levels and, on the other hand, a decrease in n-3 LC-PUFA levels in some brain regions. These results suggested that the bioavailability of n-3 LC-PUFA to the brain is reduced during ageing potentially via a decrease in their transport through the blood brain barrier, leading to an increase in the plasma. Indeed, ageing is associated with modifications of the selective transport of fatty acids across the blood brain barrier, and thus contribute to alter their bioavailability and modify the brain fatty acid composition( Reference Kuo, So and Parkinson 41 , Reference Polozova and Salem 42 ). Therefore, an altered fatty acid transport across the blood brain barrier may contribute, in association with the reduced activity of the enzymes allowing the incorporation of DHA into brain PL, to a decline in brain DHA levels observed during ageing.
The stability of DHA contents in the hippocampal PE and cortical PE and PC along the life, suggests a compensatory mechanism which might serve to ensure a good availability of unsaturated fatty acids in these PL, as already suggested by Ilincheta de Boschero et al. ( Reference Ilincheta de Boschero, Roque and Salvador 43 ). These authors have demonstrated that ageing differentially affected PL species in the brain regions of aged rats through changes in the base exchange enzyme activities. Moreover, although the striatum contained less DHA than the hippocampus or the cerebral cortex, it is also the area of the brain that exhibited the most significant decrease in both PE and PC during ageing. Despite the age-related compositional changes, it should be noted that the total n-6 PUFA:total n-3 PUFA ratio remained stable in the PE and PC of the three brain regions, further supporting the hypothesis that a compensatory mechanism maintains the unsaturated rate and, thus, the global integrity of the brain membranes.
The decrease in PUFA levels in the hippocampus and striatum was accompanied by a significant increase in the level of total MUFA, such as oleic acid, in the three studied brain regions, both in PE and PC. This age-related increase in MUFA contents has been previously observed in PE from the cerebral cortex, cerebellum and hippocampus of aged rats( Reference Favrelière, Stadelmann-Ingrand and Huguet 21 , Reference Giusto, Salvador and Castagnet 40 , Reference Lopez, Ilincheta de Boschero and Castagnet 44 ). Moreover, the total SFA content decreased in the striatal PE of aged rats, suggesting a potential increase in the Δ-9 desaturase activity( Reference Guillou, Zadravec and Martin 45 ).
In the present study, we observed no age-related modification of the cortical fatty acid profile. However, a decrease in the DHA content in the cortical PE has been previously observed in older rats( Reference Little, Lynch and Manku 18 , Reference Latour, Grintal and Champeil-Potokar 22 ). These results suggest that in rats, the prefrontal cortex region is less sensitive to the effect of ageing than the hippocampus and striatum. This may be explained by the differential PL composition between the cortical membranes, mainly composed of PE, and the hippocampal and striatal membranes, containing mainly PC( Reference Dyall, Michael and Whelpton 9 ).
The dietary supplementation with EPA/DHA led to a significant accumulation of n-3 PUFA in the plasma and erythrocyte membranes, with a large increase in the levels of EPA, n-3 DPA and DHA. This was accompanied by a subsequent reduction in n-6 PUFA (AA and n-6 DPA), which results in an inhibition by the LC-PUFA of the Δ-6 and Δ-5 desaturase activities involved in both n-6 and n-3 PUFA biosynthetic pathways( Reference Guillou, Zadravec and Martin 45 , Reference Christiansen, Lund and Rortveit 46 ).
At the same time, the supplemented aged rats exhibited a lower level of oleic acid explained by the lower amount of MUFA contained in their diet. However, they also displayed a higher level of SFA in the plasma and erythrocyte PC compared with the aged control rats. This change cannot be explained by the SFA intake, which was lower in the EPA/DHA-supplemented rats than in the control rats. Similar compositional changes have already been observed in 3-month-old mice supplemented with DHA from weaning compared with control animals receiving palm oil. Supplementation induced an increase in palmitic acid levels and a reduction in oleic acid levels in the plasma( Reference Lim and Suzuki 47 ). These results are consistent with an inhibition of the Δ-9 desaturase, leading to the accumulation of SFA, as described previously in the liver microsomes of adult rats fed with a fish oil-supplemented diet( Reference Christiansen, Lund and Rortveit 46 ).
Globally, the supplemented aged rats displayed a n-3 LC-PUFA content in the brain, such as EPA, n-3 DPA and DHA, close to or even higher than that measured in the adult control rats, except in the striatal and cortical PC, in which the increases were not statistically significant. This increase in n-3 LC-PUFA contents, mainly in the hippocampal PC and PE of the supplemented aged rats, was associated with the maintenance of spatial working memory altered in aged rats (data not shown). It could be suggested that the beneficial effect of EPA/DHA supplementation on working memory in aged rats could result, in part, from the increase in DHA content in the hippocampus as this brain region is highly involved in spatial memory.
As for plasma and erythrocyte membranes, the increase in the levels of n-3 LC-PUFA measured in the supplemented aged rats was in balance with the lower amount of n-6 LC-PUFA, leading to a decrease by nearly half of the total n-6 PUFA:total n-3 PUFA ratio in each brain region. These observations are coherent with the data that have already been reported in young and old mice receiving an n-3 PUFA-enriched diet( Reference Labrousse, Nadjar and Joffre 15 , Reference Wainwright, Huang and Simmons 48 , Reference Wainwright, Xing and Mutsaers 49 ). However, the LA level increased in the hippocampus and striatum in response to supplementation, even if the control and supplemented groups received an equivalent amount of LA. This could be the result of an inhibition of the Δ-6 and Δ-5 desaturase activities by n-3 LC-PUFA intake, as discussed previously for the blood( Reference Guillou, Zadravec and Martin 45 , Reference Christiansen, Lund and Rortveit 46 ). Otherwise, it should be note that nor MUFA neither SFA contents were restored in the supplemented aged rats. Thus, EPA/DHA supplementation in aged rats allowed to preserve a high PUFA content in the brain membranes, but failed to maintain other fatty acid levels such as MUFA and SFA.
From the perspective of developing a preventive nutrition to delay brain ageing, understanding the n-3 PUFA composition in the brain, and particularly the brain DHA content, is of considerable significance for human health. However, robust and accessible biomarkers of brain DHA status are necessary. Previous clinical studies have proposed that the EPA+DHA content in erythrocyte membranes could be considered as a marker of cardiovascular risk in humans( Reference Harris 50 ). More recently, EPA/DHA composition in erythrocytes was also associated, in postmenopausal women, with brain and hippocampal volumes( Reference Pottala, Yaffe and Robinson 51 ), the latter being closely related to memory performances( Reference Lister and Barnes 10 ). Furthermore, it has been reported that a higher erythrocyte DHA level is associated with a protective effect against neurological disorders in humans( Reference Tan, Harris and Beiser 52 ). Therefore, in the present study, we assessed the relationship between the erythrocytes and the brain fatty acid composition during ageing and n-3 LC-PUFA supplementation in order to identify a potential biomarker of DHA status in the brain according to age and dietary intake.
One of the major results of the present study is the inverse relationship between the n-3 PUFA content in the plasma and that in the brain during ageing. Therefore, the n-3 PUFA level in the plasma does not seem to be an accurate biomarker of brain DHA status during ageing. This conclusion has already been drawn in human studies, showing no correlation between plasma and brain DHA contents in elderly people( Reference Rapoport, Ramadan and Basselin 53 , Reference Cunnane, Schneider and Tangney 54 ). In contrast, some studies have reported a positive correlation between the DHA level in erythrocytes and those in the brain in response to various dietary fatty acid manipulations in adult rats( Reference Tu, Muhlhausler and Yelland 26 , Reference Stark 27 ). These results suggest that it could be possible to identify reliable and readily available blood biomarkers of brain DHA status, according to n-3 PUFA dietary intake. Considering therefore the whole of control and EPA/DHA-supplemented rats, we demonstrated that the DHA content in erythrocyte membranes, reflecting dietary n-3 PUFA intake over a longer period than plasma( Reference Arab 35 ), was significantly correlated with the DHA content measured in the PE of the hippocampus and prefrontal cortex. One limitation of the present study may be the use of only condition of EPA/DHA supplementation, leading to two distinct clusters in the correlation analysis corresponding to the two populations of rats receiving or not the n-3 LC-PUFA-supplemented diet. Therefore, there is no continuum in the DHA level values, and the use of intermediate n-3 LC-PUFA-supplemented diets would have allowed us to observe a continuum as in the study of Tu et al. ( Reference Tu, Muhlhausler and Yelland 26 ). However, this positive association was not significant for the striatum, highlighting the specificity of the brain region in this association. In the same way, there was no statistically significant correlation between the fatty acid compositions in erythrocyte PC and those in PC from the three studied brain regions. Thus, it should be noted that potential associations between erythrocyte and whole-brain fatty acid contents should be considered with prudence, taking into account the brain region and the PL class. The most robust correlation was observed in PE from the prefrontal cortex, where the DHA level of adult control rats was the highest compared with the other fractions. This could be explained by a better incorporation rate of DHA in the PE fraction in the supplemented aged rats.
In conclusion, the present study suggests that ageing is associated with altered fatty acid bioavailability, leading to an increase in plasma n-3 LC-PUFA contents, which is therefore not indicative of the decrease in n-3 LC-PUFA contents observed in the brain. However, we have highlighted that the DHA content in erythrocyte PE was indicative of the DHA levels in the hippocampus and the prefrontal cortex PE in the supplemented aged rats. Our findings are of great interest for the search of blood biomarkers of brain DHA status in humans. The present results could be useful for clinical studies using n-3 PUFA supplementation in elderly people to slow down age-related memory impairments.
Acknowledgements
The authors thank Rachel Hamiani for animal care, and Sandrine Djoukitch and Emeline Montesinos for technical assistance in lipid analysis.
The present study was supported by the Conseil Régional d'Aquitaine, the Ministère de l'Agriculture, de l'Agroalimentaire et de la Forêt – ACTIA, Association Nationale de la Recherche et de la Technologie – ANRT, Société Lesieur and ONIDOL. The funders had no role in the study design, data collection and analysis, decision to publish, or preparation of the manuscript.
The authors’ contributions are as follows: A. L., S. A. and B. B. wrote the manuscript and analysed the data; A. L., L. F., C. H. and B. S. conducted the experiments; C. V., V. P., S. L., B. B. and S. A. designed the study and supervised the work. All authors read and approved the final manuscript.
There is no conflict of interest to declare.


