


Introduction
Mild cognitive impairment (MCI) is a stage of cognitive decline falling between normal aging and dementia. A subtype of MCI known as amnestic MCI (aMCI), presents with a marked decline in verbal memory and may reflect early manifestations of a neurodegenerative disease process like Alzheimer’s disease (AD; Eppig et al., Reference Eppig, Edmonds, Campbell, Sanderson-Cimino, Delano-Wood and Bondi2017; Petersen et al., Reference Petersen, Smith, Waring, Ivnik, Tangalos and Kokmen1999). Though etiologies can be inferred based on patterns of cognitive impairment, comprehensive medical/psychosocial history, and additional neurodiagnostic testing, MCI is etiologically nonspecific. Various diagnostic criteria have been developed and revised in attempts to best capture MCI patterns that define a pre-dementia syndrome (versus stable or remitting MCI) despite its inherent heterogeneity (Clark et al., Reference Clark, Delano-Wood, Libon, McDonald, Nation, Bangen and Bondi2013; Clark et al., Reference Clark, Koscik, Nicholas, Okonkwo, Engelman, Bratzke and Johnson2016; Edmonds et al., Reference Edmonds, Delano-Wood, Jak, Galasko, Salmon and Bondi2016; Grundman et al., Reference Grundman, Petersen, Ferris, Thomas, Aisen, Bennett and Thal2004; Rountree et al., Reference Rountree, Waring, Chan, Lupo, Darby and Doody2007). MCI subtypes have been further characterized (e.g., aMCI, dysexecutive, anomic) by employing conventional Peterson/Winblad (“single-test”) criteria as well as actuarial neuropsychological (“multi-test”) criteria by Jak and Bondi. The Jak/Bondi criteria categorizes specific cognitive phenotypes that are differentially associated with relatively high rates of the APOE e4 allele, abnormal CSF levels of AD biomarkers, and 49% AD conversion rates over 7 years of follow-up (Bondi et al., Reference Bondi, Edmonds, Jak, Clark, Delano-Wood, McDonald and Salmon2014).
In the last decade, there has been a growing research interest in the role of sex on cognition in MCI. For instance, several large-scale studies show a higher incidence and prevalence of aMCI in men (Petersen et al., Reference Petersen, Roberts, Knopman, Geda, Cha, Pankratz and Rocca2010; Roberts et al., Reference Roberts, Geda, Knopman, Cha, Pankratz, Boeve and Petersen2012), though a recent meta-analysis of population and community-based studies around the world shows no significant sex differences in prevalence or incidence of aMCI. In contrast, there is a higher prevalence, but not incidence, of non-aMCI in females compared to males (Au et al., Reference Au, Dale-McGrath and Tierney2017). Moreover, evidence suggests that women tend to be diagnosed with MCI at a later disease stage, and progress more quickly from MCI to dementia than men (Holland et al., Reference Holland, Desikan, Dale and McEvoy2013; Sundermann et al., Reference Sundermann, Maki, Biegon, Lipton, Mielke, Machulda and Bondi2019). Across the lifespan, females exhibit better verbal memory performance, especially on list-learning memory tasks (Sundermann et al., Reference Sundermann, Maki, Biegon, Lipton, Mielke, Machulda and Bondi2019).
The “female verbal advantage” for memory performance (Stricker et al., Reference Stricker, Christianson, Lundt, Alden, Machulda, Fields and Petersen2021; Sundermann et al., Reference Sundermann, Biegon, Rubin, Lipton, Mowrey, Landau and Alzheimer’s Disease Neuroimaging2016b; Sundermann et al., Reference Sundermann, Biegon, Rubin, Lipton, Landau and Maki2017) is posited to play a role in false-negative diagnostic errors and delayed diagnosis of MCI in women. Consistent with cognitive reserve theory (Stern et al., Reference Stern, Gurland, Tatemichi, Tang, Wilder and Mayeux1994, Stem, Reference Stern2002), the “female verbal advantage” may mask the milder early memory changes emphasized in aMCI. For example, when typical Jak/Bondi cut scores for aMCI diagnosis were applied to Rey Auditory Verbal Learning Test (RAVLT) participant scores from the Alzheimer’s Disease Neuroimaging Initiative and the Mayo Clinic Study of Aging, results showed a 20% diagnostic error rate (10% false positives for men; 10% false negatives for women), but when sex-specific aMCI criteria were applied, this effect was diminished (Sundermann et al., Reference Sundermann, Maki, Biegon, Lipton, Mielke, Machulda and Bondi2019). Further, female older adults with positive AD-related markers of neurodegeneration (i.e., moderate hippocampal atrophy) remained cognitively intact on verbal memory assessments (Sundermann et al., Reference Sundermann, Maki, Rubin, Lipton, Landau and Biegon2016a), suggesting a delay in verbal memory decline and a sex-specific expression of cognitive reserve. Thus, when AD biomarkers are employed as the gold standard, sex-specific cut points improve diagnostic accuracy (Sundermann et al., Reference Sundermann, Biegon, Rubin, Lipton, Mowrey, Landau and Alzheimer’s Disease Neuroimaging2016a; Sundermann et al., Reference Sundermann, Maki, Biegon, Lipton, Mielke, Machulda and Bondi2019).
Participants meeting MCI criteria that was initially developed to detect earlier indicators of cognitive impairment are not comparable to outpatient samples meeting clinical MCI criteria that more heavily weighs subjective concerns and relative preservation of independent living (Albert et al., Reference Albert, DeKosky, Dickson, Dubois, Feldman, Fox and Phelps2011; Petersen et al., Reference Petersen, Lopez, Armstrong, Getchius, Ganguli, Gloss and Grant2018). Additional research is needed to determine if sex differences in memory profiles are also present in clinical samples with MCI (Stricker et al., Reference Stricker, Christianson, Lundt, Alden, Machulda, Fields and Petersen2021) to guide the development of sex-specific diagnostic tools (e.g., criteria, norms). Further, other key cognitive domains in MCI (e.g., language, executive functioning/information processing speed) must be better characterized in the context of the female verbal advantage. The aim of the current project was to determine sex differences in neuropsychological profiles of individuals who were clinically diagnosed with MCI using both research and clinical criteria. Specifically, we examined severity of global and domain-specific cognition (memory, language, executive functioning/ information processing speed), and material-specific memory profiles (verbal vs. visual). We also examined age and education as potential moderators of significant differences. We hypothesized that females would exhibit evidence of (1) specific subtypes including nonamnestic or multi-domain MCI; (2) broader or more severe global or non-memory domain impairments; and (3) have a relative verbal memory advantage compared to males.
Method
Participants
The current study includes archival data from patients (n = 349) who underwent a neuropsychological evaluation through the Rhode Island Hospital Neuropsychology Program (RIH-NP) and were clinically diagnosed with MCI or a diagnostic equivalent. The RIH-NP archival database was developed with entry of clinical data on a secure server, REDCap (Research Electronic Data Capture; Harris et al., Reference Harris, Taylor, Thielke, Payne, Gonzalez and Conde2009). From 2006 to 2019, all English-speaking outpatients that met diagnostic criteria from the Diagnostic and Statistical Manual of Mental Disorders Fourth and Fifth Editions (DSM-IV; DSM-5; American Psychiatric Association, 1994, 2013, respectively) along the MCI spectrum (e.g., cognitive disorder not otherwise specified, minor neurocognitive disorder) were entered into the database. For the current study, additional data from clinical reports were extracted from the larger medical record as needed to determine eligibility and code additional variables of interest. The current study included people over the age of 55 and excluded for a history of severe mental illness like bipolar disorder, schizophrenia (depression, post-traumatic stress disorder, and anxiety were not exclusionary unless there was a history of psychiatric hospitalization), attempted suicide, human immunodeficiency virus or other brain infections, encephalitis, moderate/ severe traumatic brain injury, stroke (included lacunes or transient ischemic attack), epilepsy (included isolated seizure or possible seizure), multiple sclerosis, brain surgery, Parkinson’s disease (included Parkinsonism/Essential Tremor), normal pressure hydrocephalus, alcohol or drug dependence, current cancer treatment, blindness, prior developmental disorder diagnosis (e.g., learning disorder, attention deficit hyperactivity disorder), or <75% of pre-specified neuropsychological measures available for analysis. Each participant’s neuropsychological evaluation, including medical history and medication lists indicated in the report, were reviewed by at least two raters (predoctoral clinical psychology intern, trained research assistant). This project was approved by the Rhode Island Hospital Institutional Review Board and conducted in accordance with the 1975 Declaration of Helsinki, as revised in 2008.
Of the 531 participants in the database, 182 were excluded due to the following: 2 for being 55 years of age or younger, 89 for neurological diagnoses/issues other than MCI and/or neurosurgical intervention, 29 for psychiatric diagnoses, 19 for substance use history, 8 for developmental disorders, 5 did not have an MCI diagnosis upon further review, 8 were missing a report or raw data in the report, 4 were not administered at least 9 tests necessary for inclusion, 2 were administered with an interpreter, and 16 met multiple exclusionary criteria related to history, mode of assessment, or data availability. The final sample used for analyses included 349 participants.
Flexible neuropsychological batteries were selected for clinical purposes by licensed clinical neuropsychologists and administered under their supervision by trained psychometricians, graduate-level practicum and clinical psychology interns, and/or postdoctoral neuropsychology fellows. To allow for inclusion of participants with slight variations in their clinical battery, we identified comparable cognitive measures to act as substitutes and widely used normative data to interpret scores within and across constructs. This allowed us to examine comparable test paradigms within broader cognitive domains without limiting our sample size or potentially introducing sample bias. Most participants had all 12 test scores/substitutes (n = 274), 1 missing test (n = 57), or 2 missing tests (n = 12). A z-score of −1.5 was used as a cut point for “low” or “impaired” performance to be conservative given that MCI clinical samples typically are more severe than research samples.
MCI criteria
MCI criteria included the Petersen/Winblad criteria defined as normative scores equivalent to ≤1.5 standard deviations on any of the 9 tests or comparable equivalents and the Jak/Bondi criteria defined as any two (or more) tests equivalent to ≤1 SD (z-score ≤ −1) within a domain across the 9 tests or designated comparable equivalents (Jak et al., Reference Jak, Urban, McCauley, Bangen, Delano-Wood, Corey-Bloom and Bondi2009). We further defined groups into single domain amnestic (memory domain impaired alone), single domain nonamnestic (1 domain impaired other than memory), multi-domain amnestic (memory plus at least one other domain) and multi-domain nonamnestic (multiple domains impaired, not memory) based on the −1.5 SD cut point. All participants were evaluated as referrals to the RIH-NP, and therefore, subjective cognitive impairment or concern about cognitive changes was inherently present by the patient, the patient’s loved one(s) and/or a medical provider.
Neuropsychological measures
The memory domain included total learning trials 1-3 and delayed recall using the Hopkins Verbal Learning Test-Revised (HVLT-R; Benedict & Brandt, Reference Benedict and Brandt2001) and the Brief Visuospatial Memory Test-Revised (BVMT-R; Benedict, Reference Benedict1997), and immediate and delayed prose passage recall using the Wechsler Memory Scale Third or Fourth Edition (Wechsler, Reference Wechsler1997) Logical Memory subtest (LMI and LMII) or the Neuropsychological Assessment Battery (NAB; White & Stern, Reference White and Stern2003) Story Memory subtest. Executive functioning and information processing speed was measured via graphomotor sequencing, and set-shifting using Trail Making Tests A and B (TMT-A, TMT-B; Reitan & Wolfson, Reference Reitan and Wolfson1985), lexical fluency (letters F, A, and S) using the Controlled Oral Word Association Test (COWAT; Benton et al., Reference Benton, Hamsher de and Sivan1994), and visuomotor processing/coding using the Wechsler Adult Intelligence Scale-Third or Fourth Edition (Wechsler, Reference Wechsler2009) Coding subtest or the Symbol Digit Modalities Test (SDMT; Smith, Reference Smith1982). The language domain included confrontation naming using the Boston Naming Test (BNT; Goodglass et al.,Reference Goodglass, Kaplan and Weintraub1983) or the NAB Naming subtest (White & Stern, Reference White and Stern2003), and semantic fluency using the category Animals (Benton et al., Reference Benton, Hamsher de and Sivan1994).
Normative data with the demographic adjustments used for specified tests are listed under each cognitive domain in Supplemental Table I, along with the available ns for each measure. Normative scores were converted to z-scores for ease of interpretation and to create composite scores, and herein are referred to as z-scores. For the few participants that were administered multiple tests within one category (e.g., BNT and NAB Naming), standardized scores were averaged for the domain composites and performance within that test category was coded as “low” if at least one of the two test z-scores was ≤ −1.5. The multi-test categories were renamed once converted to z-scores (e.g., “visuomotor coding” for Coding or SDMT) to reflect one construct variable, regardless of test. When raw scores were examined, the more frequently administered test in this sample was used. Discontinued TMT-A and TMT-B scores were coded as impaired; analyses of raw and z-scores included the maximum time (300”) and the lowest possible z-score (−4.10).
Global severity
Severity was measured by calculating the proportion (%) of impaired scores (z-scores ≤ −1.5) on tests of interest administered overall and by creating a global cognitive composite of all tests (averaged z-scores).
Domain-specific patterns of impairment
Patterns of domain-specific impairment were examined using continuous (z-score) and categorical (z ≤ −1.5 cut-point American Academy of Clinical Neuropsychology [AACN] descriptors; Board of Directors, 2007; Guilmette et al., Reference Guilmette, Sweet, Hebben, Koltai, Mahone and Spiegler2020) variables for memory, executive functioning/information processing speed, and language. Domain-specific composites with significant sex effects were examined post hoc to (1) determine sex differences in raw scores of individual measures and (2) explore whether sex effects were uniform across age and education. Composites for memory (α = .76) and executive functioning/information processing speed (α = .66) were reliable. As expected, language was less reliable (α = .48), given that one of only two tests was not normally distributed (BNT). We allowed for lower reliability in the language composite as this was meant to guide targeted, data-driven analysis. The distribution of participants falling into the AACN descriptive categories by sex (Guilmette et al., Reference Guilmette, Sweet, Hebben, Koltai, Mahone and Spiegler2020) was visually represented. An additional category was added to the descriptors to show greater differentiation in the lowest performing groups (z-scores ≤ −2) and average and higher groups were collapsed into one category given the limited above average performances in this sample.
Memory profiles
Memory profiles and sex differences in learning curves were examined via trial-by-trial recall (Trial 1, Trial 2, Trial 3, and Delayed recall) or learning curves on the HVLT-R and BVMT-R, as well as through visual representation modality-specific (HVLT-R, BVMT-R, Story) performances. Patterns of modality-specific impairments were illustrated using Venn diagrams for learning/immediate and delayed recall impairment across sex (www.meta-chart.com; Figure 1).
Venn Diagrams of Modality Specific Learning and Memory Impairment. Note. Female immediate recall/learning: 4.78% HVLT-R only, 9.04% BVMT-R only, 7.98% Story only, 12.23% HVLT-R+BVMT-R only, 45.21% HVLT-R+Story, 13.29% BVMT-R+Story, 37.77% HVLT-R+BVMT-R+Story; Female delay: 3.19% HVLT-R only, 9.57% BVMT-R only, 3.19% Story only, 20.21% HVLT-R+BVMT-R only, 2.13% HVLT-R+Story, 6.91% BVMT-R+Story, 50.0% HVLT-R+BVMT-R+Story; Male immediate recall/learning: 13.70% HVLT-R only, 8.22% BVMT-R only, 4.11% Story only, 16.44% HVLT-R+BVMT-R only, 10.27% HVLT-R+Story, 7.53% BVMT-R+Story, 33.56% HVLT-R+BVMT-R+Story; Male delay: 12.33% HVLT-R only, 9.59% BVMT-R only, 0.68% Story only, 28.08% HVLT-R+BVMT-R only, 3.42% HVLT-R+Story, 0.0% BVMT-R+Story, 41.78% HVLT-R+BVMT-R+Story.

Statistical analyses
Analysis of variance (ANOVA) and Chi-square analyses were used to examine sex differences in participant characteristics, eligibility and main outcome variables of interest including the standard criteria for MCI (Jak/Bondi criteria and subdomains), and severity across and within domains using SPSS Statistical Package Version 25 (IBM). Significance was determined by p <.05 and post hoc analyses applied Bonferroni correction. When exploring post hoc analyses, age and education were entered as categorical variables (age: ≤65, 66–75, 76–85, ≥86; education: ≤11, 12–15, ≥16), but were set as continuous variables when included as covariates. Analyses of normative-corrected scores did not control for age or education, as many of the norms already control for those variables; however, all raw score analyses adjusted for age and education in the models.
Linear mixed models were conducted using the PROC MIXED procedure in SAS Enterprise Edition release 9.04.01M4P11092016 (SAS Institute Inc, Cary NC) to determine sex differences in HVLT-R and BVMT-R raw score learning curves (Trial 1, Trial 2, Trial 3, and Delayed recall). Interactive effects of sex and trial (sex*time, sex*time2) were examined in two ways for separate HVLT-R and BVMT-R models. First, the data were structured with time (i.e., trial, Level 1) nested within participants (Level 2). Random intercepts were specified at the test and participant levels, and random slopes were specified for rectilinear and quadratic time. Second, we examined the interaction between sex and a categorical trial variable to contrast performance at each trial. All models were adjusted for age and education and were fit to the data using maximum likelihood estimation, assuming incomplete data as missing at random. Unstructured covariance and Kenward-Roger degrees of freedom approximation were used.
Results
Participant characteristics are reported in Table 1 by sex and for the total sample. There were no significant sex differences in age, ethnoracial background, dementia screening raw and normative performance (Mini-Mental State Examination [MMSE]; Folstein et al., Reference Folstein, Folstein and McHugh1975; Mattis Dementia Rating Scale [DRS]; Mattis, Reference Mattis1988), MCI subtypes, depression severity, or proportion of multilingual individuals. Males had greater years of education on average than females, [F(1, 342) = 18.57, p<.001], with categorical differences indicating a greater proportion of females had 12 years of education and a greater proportion of males had at least 16 years of education [X 2 (3, 349) = 17.2, p = .001].
Participant characteristics

Note. BDI: Beck Depression Inventory; DRS: Dementia Rating Scale; MMSE: Mini-Mental Status Examination. Jak & Bondi MCI criteria applied. Scaled scores: M = 10, SD = 3. *p <.01.
Global severity
Females had a greater proportion of impaired tests at 1.5 SD, [F(1, 347) = 4.24, p= 0.04, ηp 2 = 0.01] and lower global composite z-scores [F(1, 347)= 6.91, p=.009, ηp 2= 0.02] compared to males (Table 2).
Sex differences in research criteria: MCI criteria, subtypes, & severity

Note. Domains impaired: percentage of 3 domains where at least 2 tests are impaired (z-scores ≤−1.5); Jak/Bondi criteria: 2 tests within a domain < 1SD; Language composite: average z-score for Animals category fluency and confrontation naming of either Neuropsychological Assessment Battery Naming subtest or the Boston Naming Test; Memory composite: average z-score for learning trials total and delayed recall from the Brief Visual Memory Test-Revised and the Hopkins Verbal Learning Test-Revised and immediate and delayed recall of either Neuropsychological Assessment Battery story memory subtest or the Wechsler Memory Scale Logical Memory subtest; Multi-domain amnestic: memory and at least one other domain (z-scores ≤−1.5); Multi-domain nonamnestic: (z-scores ≤−1.5) impaired in multiple domains that are not memory; Single domain amnestic: only memory impaired (z-scores ≤−1.5); Single domain nonamnestic: 1 domain other than memory (z-scores ≤−1.5); Executive functioning/Speeded processing (EF/PS): average z-score for Trail Making Tests A and B, FAS phonemic fluency and coding from either digit symbol modalities test or the Wechsler Adult Intelligence scale coding subtest; Tests impaired: percentage of tests (z-scores ≤−1.5). *p<.05, **p<.01.
Domain-specific patterns of impairment
A greater proportion of females met domain-specific impairment in language [X 2 (1, 349) = 5.2, p = .02, ϕ = 0.12] and executive functioning/ information processing speed [X 2 (1, 349) = 4.8, p = .03, ϕ = 0.12] than males. No sex differences were observed for the memory domain, MCI criteria or subtypes (p-values >.05). See Tables 2–3 for full results. ANOVAs revealed that females performed worse on language composites [F(1, 342) = 13.97, p < .001, ηp 2 = 0.04], but only marginally worse on memory composites [F(1, 347) = 3.04, p= 0.08, ηp 2 = 0.01]. There were no significant sex differences seen within executive functioning/information processing speed composites [F(1, 347) = 1.46, p = .23, ηp 2 = .004]. Post hoc analyses indicated that performance was worse for females on both object naming, [F(1, 346) = 26.03, p < .001, ηp 2 = 0.07], and animal fluency [F(1, 346) = 4.09, p = 0.04, ηp 2 = 0.012], but only object naming survived Bonferroni correction. When controlling for age and education, there was a significant sex effect on BNT raw scores [Female M = 45.59 SD = 9.91, Male M = 51.02, SD = 7.96, F(3, 339) = 17.64, p < .001, ηp 2 = 0.05], but not animal fluency raw scores [Female M = 12.79 SD = 5.92, Male M = 13.97, SD = 4.90, F(3, 344) = 0.77, p = .38, ηp 2 = .002].
Sex differences in stratified age and education groups

Note. Language composite: average z-score for Animals category fluency and confrontation naming of either Neuropsychological Assessment Battery Naming subtest or the Boston Naming Test. †p<.10, *p<.05, **p<.01.
Stratified age analyses (≤65, 66–75, 76–85, ≥86) revealed that the sex effect on language was maintained in the 76-85 year-old total composite [F(1, 127) = 11.85, p = .001, ηp 2 = .09], object naming [F(1, 127) = 9.32, p = .003, ηp 2 = .07], and animal fluency performances [F(1, 127) = 7.86, p = .006, ηp 2 = 0.06]. Stratified education (≤11, 12–15, ≥16) analyses revealed a pattern of consistent significant or marginal effects of sex across all education groups, except for the language composite and animal fluency performance in individuals with at least college education. See Table 3 for Ms and SDs. Nonsignificant post hoc results are not shown. Bar graphs show the proportion of females vs. males falling into descriptor categories based on overall domain and specific test z-scores (Figure 2).
AACN Descriptors for composite domains.

Sex differences: Memory profiles
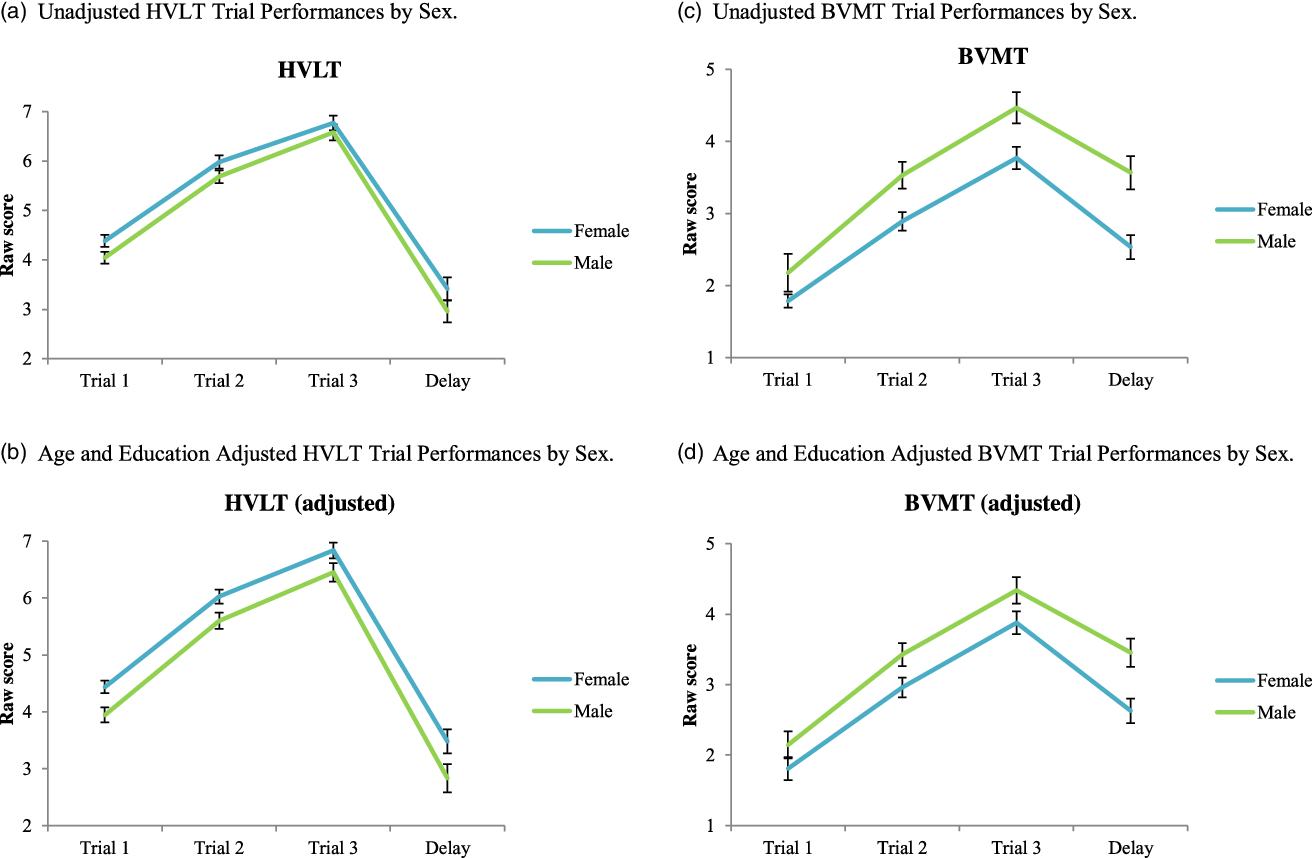
Learning curves illustrating adjusted and unadjusted sex differences on trials 1–3 and delayed recall performances are graphed in Figures 3 a–d and linear mixed model results are reported in Table 4. There were no effects of sex on learning slopes or rate of decline in retention (sex*time, sex*trial2) in models using trial as a continuous variable (Table 4). When trial was entered as a categorical variable, females recalled more HVLT-R items on Trial 1, Trial 2, and Trial 4 (Delayed Recall) than males (p’s < .05). In contrast, females recalled fewer BVMT-R figure details than males overall, with significant differences on Trial 3 and Trial 4 (Delayed Recall; p’s < .05). Figure 1 illustrates a Venn diagram of females vs. males and learning/immediate vs. delayed recall for low score profiles across the three test modalities (HVLT-R, BVMT-R, and Story).
(a) Unadjusted HVLT Trial performances by sex. (b) Age and education adjusted HVLT trial performances by sex. (c) Unadjusted BVMT trial performances by sex. (d) Age and education adjusted BVMT trial performances by sex.
Linear mixed models of sex differences across learning curves and memory

Note. Models included raw scores from trials 1–3 and delayed recall (coded 1, 2, 3, 4). Sex was dummy coded female = 1 male = 0. Model 1 includes trial as a continuous variable and model 2 includes trial as a categorical variable. Fixed effects are reported for sex, age, and education and least square mean differences are reported for sex effects at each trial.
Discussion
The primary objective of the present study was to examine sex differences in cognitive profiles of individuals diagnosed with MCI. We applied both research criteria and clinical methods to characterize our sample and interpret sex differences. Our findings show differences in language and executive functioning/information processing speed in females with MCI compared to males. Analysis of learning curves through statistical modeling as well as visual representation of descriptors and memory modalities showed additional nuances not captured by standard MCI subtypes. Despite these differences in cognitive profiles, there were no sex differences in standard MCI research criteria (i.e., Jak/Bondi MCI subtypes) and severity of global cognition via screeners. Detailed analysis and the use of conservative cut scores are strengths of this work. These results expand the growing literature examining sex differences in MCI to a clinical sample using archival neuropsychological evaluation data.
Despite having comparable global cognition (MMSE, DRS) scores, females had a greater proportion of low scores (z ≤ −1.5 SD) than males, equivalent to 60% of females having 1 more impaired score out of 9–12 tests. This finding was driven by a proportion of impaired performances in non-memory domains that perhaps reflect greater severity not captured by cognitive screeners or existing memory paradigms. The female verbal advantage may mask the degree of impairment captured by cognitive screeners and isolated memory test scores that are often the primary diagnostic tool of determining MCI or dementia status, or the outcome variable in large-scale research. This is in line with sex-stratified analyses showing a discrepancy in presence/severity of AD biomarkers with better verbal learning and memory performance in females compared to males (Koran, et al., Reference Koran, Wagener, Hohman and Alzheimer’s Neuroimaging2017; Sundermann et al., Reference Sundermann, Biegon, Rubin, Lipton, Mowrey, Landau and Alzheimer’s Disease Neuroimaging2016a; Sundermann et al., Reference Sundermann, Biegon, Rubin, Lipton, Landau and Maki2017). The “female verbal advantage” has implications for clinical practice, particularly with respect to global cognitive screenings and referrals for neuropsychological evaluation. If cut scores on cognitive screenings reflect this verbal advantage, particularly in women who are high functioning at baseline, there could be a marked reduction in false-negative error rates in MCI diagnosis. Preclinical Alzheimer’s Cognitive Composites are possible alternatives; however, further investigation is needed to establish normative data and reliable cut points (Randolph, Reference Randolph2020).
Summation of memory performances appeared to wash out the pattern of modality-specific memory differences observed using linear mixed models. Across the MCI spectrum, subtle verbal versus visual memory advantages were observed for females and males, respectively. According to our mixed models, this was not due to strengths in learning curves or weaknesses in rapid forgetting, but overall trends of higher or lower recall across trials. The complexity of this heterogeneity of memory performance is illustrated by the Venn diagrams (Figure 1) and the AACN descriptor tables (Figure 2). Results from our clinical sample support the need for sex adjusted normative data (Stricker et al., Reference Stricker, Christianson, Lundt, Alden, Machulda, Fields and Petersen2021) and sex-stratified analyses in aging research (Nebel et al., Reference Nebel, Aggarwal, Barnes, Gallagher, Goldstein, Kantarci and Mielke2018). These data have implications for recruitment into clinical trials, which often rely on brief screening or memory testing results for inclusion. Visuospatial impairments were also more pronounced in females (data not shown), though our analyses focused on tests and domains more commonly used in research and clinical samples. There is a need to examine the utility of cognitive domains examined in existing MCI criteria in heterogenous clinical samples likely to include AD, vascular, and Lewy body dementias (Taylor et al., Reference Taylor, McKeith, Burn, Boeve, Weintraub, Bamford and O’Brien2020; Tensil et al., Reference Tensil, Hessler, Gutsmiedl, Riedl, Grimmer and Diehl-Schmid2018; Wolters & Ikram, Reference Wolters and Ikram2019), as well as premorbid or comorbid conditions affecting baseline cognitive performance or rate of progression (Albai et al., Reference Albai, Frandes, Timar, Roman and Timar2019; Mubashir et al., Reference Mubashir, Abrahamyan, Niazi, Piyasena, Arif, Wong and Chung2019).While the learning curves showed small sex effects, the larger literature allude to the potential public health consequences of relative sex and/or gender differences at different stages of AD (Bloomberg et al., Reference Bloomberg, Dugravot, Dumurgier, Kivimaki, Fayosse, Steptoe and Severine2021; Shang et al., Reference Shang, Wang, Klionsky, Cheng and Zhou2021; Udeh-Momoh & Watermeyer, Reference Udeh-Momoh and Watermeter2021).
Contrary to prior cohort studies (Bondi et al., Reference Bondi, Edmonds, Jak, Clark, Delano-Wood, McDonald and Salmon2014; Edmonds et al., Reference Edmonds, Delano-Wood, Clark, Jak, Nation, McDonald and Bondi2015; Edmonds et al., Reference Edmonds, Delano-Wood, Jak, Galasko, Salmon and Bondi2016; Eppig et al., Reference Eppig, Edmonds, Campbell, Sanderson-Cimino, Delano-Wood and Bondi2017) that have found concerning false positive (31.3%–34.2%) and false-negative (7.1%) rates of MCI, the Jak/Bondi MCI criteria had minimal false-negative rates (0.9–2.0%) in our clinical sample. Given that cohort study algorithms are primarily designed to detect emergent MCI in more homogenous and high functioning research participants at enrollment, our findings are not surprising. A strength of the current study is that our sample was more likely to have multiple comorbid factors that commonly affect cognition in older adults (e.g., vascular risk, obstructive sleep apnea, anticholinergic medications), similar to epidemiological research samples with fewer exclusion criteria (Roberts et al., Reference Roberts, Geda, Knopman, Cha, Pankratz, Boeve and Rocca2008). However, clinicians may be more conservative than research algorithms in diagnosing MCI in individuals with few low scores that could alternatively be attributed to baseline weaknesses or chance (Brooks et al., Reference Brooks, Iverson and White2007). While we excluded various medical and psychiatric factors often associated with significant cognitive impairment, clinical samples may inevitably be seen at more advanced stages when subjective cognitive impairment is more concerning or beginning to cause mild functional changes (Holland et al., Reference Holland, Desikan, Dale and McEvoy2013). Likewise, it is possible that females are referred for neuropsychological testing at an older age due to their ability to compensate in daily life with verbal strengths. This is one possible explanation for evidence of more severe MCI or faster progression to AD from MCI in females than males (Holland et al., Reference Holland, Desikan, Dale and McEvoy2013; Sundermann et al., Reference Sundermann, Maki, Biegon, Lipton, Mielke, Machulda and Bondi2019).
The interpretation of MCI criteria and domain-specific low scores/severity are subject to the normative data and cut points used, a constant consideration for clinicians. While all normative datasets we included adjust for age, the characteristics of the normative samples, parameters of age corrections/stratification, and additional variables adjusted for vary by dataset. For example, the NAB [Story Immediate and Delayed Recall n = 58; Naming n = 6] and Heaton norms [TMT-A n = 342; TMT-B n = 343] additionally adjusted for sex and education. The domain-specific effect is unlikely to influence our sex-specific results given that the variance explained by sex for LMI and LMII (r 2 = 0.001–0.003), TMT-A and TMT-B (r 2 = 0.00–0.002), and the BNT (r 2 = 0.0176, less sensitive than the NAB Naming measure) are minimal (Karstens et al., Reference Karstens, Christianson, Lundt, Machulda, Kremers, Jack, Knopman, Peterson and Stricker2021). It is possible that our conservative cut point, in combination with norms that did not adjust for sex (e.g., on tests with known sex effects such as list-learning/recall), underestimated impairment in our sample. Although sex-specific normative data have recently been published for the AVLT (Stricker et al., Reference Stricker, Christianson, Lundt, Alden, Machulda, Fields and Petersen2021), this is only one of many verbal memory tests employed in research and clinical settings that historically failed to control for sex differences (Gale et al., Reference Gale, Baxter, Connor, Herring and Comer2007). Thus, we conducted exploratory analyses examining raw scores and stratifying them by age groups and years of education; sex effects on language measures were evident in 76–85 year-olds (n = 127) and individuals with less than a college education (≤11, 12–15; n = 193). Although our sample sizes are somewhat limited in these groups, these results are likely related to evidence for increased cognitive decline and MCI between the ages of 70 to 80 (Legdeur et al., Reference Legdeur, Heymans, Comijs, Huisman, Maier and Visser2018) and suggest that other social factors related to cognitive reserve via education or occupational demands may mitigate the sex effect. Little to no variance ( < 1%) is typically attributed to sex for Animal fluency and confrontation naming tasks in similar populations (Tombaugh et al., Reference Tombaugh, Kozak and Rees1999; Karstens et al., Reference Karstens, Christianson, Lundt, Machulda, Kremers, Jack, Knopman, Peterson and Stricker2021). Previous studies have found slightly improved naming with increasing age, while other studies with less stringent inclusion criteria (Zec et al., Reference Zec, Markwell, Burkett and Larsen2005) showed a decline in performance after age 60 (Zec et al., Reference Zec, Markwell, Burkett and Larsen2005). Education typically accounts for considerable variance in naming/fund of knowledge type tasks (e.g., 18.6% of variance; Karstens et al., Reference Karstens, Christianson, Lundt, Machulda, Kremers, Jack, Knopman, Peterson and Stricker2021; Tombaugh et al., Reference Tombaugh, Kozak and Rees1999). Importantly, these data suggest that sex effects on MCI cognitive profiles may be influenced by other factors (e.g., cognitive reserve, age).
There are many strengths of this project including comprehensive hospital-based neuropsychological evaluations and our detailed approach to data coding and analysis. However, there are limitations to address. First, this data is cross-sectional. While many patients have repeat follow-ups, these data have not yet been incorporated for longitudinal purposes. Further, we attempted to use the earliest data available to avoid introducing practice effects, but some data were not available, or the evaluations were completed outside of the RIH-NP. Future follow-up work including the inclusion of other clinical and research data (e.g., PET imaging results) is needed to characterize the diagnostic outcomes of the sex differences we observed. This clinical dataset represents the patients evaluated by the RIH-NP at an academic medical center that serves predominantly English-speaking patients and is not representative of the ethnoracial makeup of the United States. More work is needed to characterize sex differences in cognitive decline, MCI, and dementia in diverse cultural and ethnic minority groups. Finally, as a clinical dataset, not all patients were given identical test batteries, potentially limiting our ability to detect impairments in some cases. Few of the test z-scores were derived from co-normed datasets, which could influence the reliability of our findings, but nevertheless reflects clinical issues we probe with this research question and dataset. However, the benefit of using this large, clinical dataset outweighs the minor variability in testing for a portion of participants. Additional review of patient charts in the future may allow for further characterization related to subjective impairments, medications, new onset depression or other psychiatric symptoms, family history, vascular risk factors, and other factors relevant to cognitive impairment. Of note, sex and gender differences cannot be entirely disentangled in this sample or others like it. Thus, the severity of these implications may vary by generation or with other elements (e.g., systemic racism, cultural-linguistic factors) that are not captured in this dataset. This speaks to a general limitation of our field in determining the diagnostic implications of key variables that influence neuropsychological test performance.
MCI is a heterogenous diagnosis that is prognostically limited without additional strong etiological evidence (e.g., biomarker data, neuropsychiatric syndromes). Our findings suggest that examining profiles that are predominately memory-based without appropriate sex-specific corrections may limit characterization of impairment. The brain is a highly integrated network; thus, localizing to the medial temporal lobe (e.g., entorhinal cortex, hippocampus), or other dysfunction in mild disorder/disease states is complex. Neuropsychological testing, while the gold standard in this endeavor, has its limitations. First, tests themselves and normative data are biased and infrequently revised or reinvented. The same test may not localize to brain functions similarly between individuals, especially for memory functions that may involve numerous aspects of cognition. Thus, the test itself does not determine the weighted integration of brain resources an individual employs to complete a task. However, patterns within a task, across multiple tests, and over time intervals help to provide an integrated picture of an individual’s functioning and cognitive trajectory. Quantifying these differences and refining our tools for capturing memory impairment for research purposes is a challenge but may be worthwhile to better understand sex-based risk algorithms and profiles.
Taken together, females may benefit from earlier referrals for neuropsychological evaluation to capture MCI before it progresses to dementia, although development of new, more sensitive tests is also necessary. Future work following this cohort will be valuable to determine whether language and/or executive changes are possible signs of medial temporal lobe dysfunction in individuals with relative memory preservation (i.e., whether this pattern predicts the onset of dementia due to possible/probable AD). It is feasible that characteristics attributed to performance variance in healthy individuals may alter the pattern of detectable functional changes in MCI. Thus, by the time comparable and even slightly advantaged verbal impairment is observed in females, other domains may have begun to progress. These results underscore the importance of more nuanced cognitive assessment and characterization of MCI in stratified groups and highlight the need for multidisciplinary care and earlier intervention.
Supplementary material
The supplementary material for this article can be found at https://doi.org/10.1017/S1355617723000085.
Acknowledgments
The authors do not have any sources of financial support or conflicts of interest to report.
Funding statement
None
Conflicts of interest
None


 Open access