

1 Introduction
Several X-ray free electron lasers (FELs) are currently in operation around the world[ Reference Emma, Akre, Arthur, Bionta, Bostedt, Bozek, Brachmann, Bucksbaum, Coffee, Decker, Ding, Dowell, Edstrom, Fisher, Frisch, Gilevich, Hastings, Hays, Hering, Huang, Iverson, Loos, Messerschmidt, Miahnahri, Moeller, Nuhn, Pile, Ratner, Rzepiela, Schultz, Smith, Stefan, Tompkins, Turner, Welch and White 1 – Reference Maroju, Grazioli, Fraia, Moioli, Ertel, Ahmadi, Plekan, Finetti, Allaria, Giannessi, De Ninno, Spezzani, Penco, Spampinati, Demidovich, Danailov, Borghes, Kourousias, Dos Reis, Billé, Lutman, Squibb, Feifel, Carpeggiani, Reduzzi, Mazza, Meyer, Bengtsson, Ibrakovic, Simpson, Mauritsson, Csizmadia, Dumergue, Kühn, Gopalakrishna, You, Ueda, Labeye, Bækhøj, Schafer, Gryzlova, Grum-Grzhimailo and Prince 7 ]. At these facilities, femtosecond (fs) or even attosecond (as) pulse durations with wavelengths tunable down to 0.5 Å (1 Å = 0.1 nm) and pulse energies up to the millijoule level can be achieved. The corresponding peak brilliance at these wavelengths in comparison with synchrotrons is surpassed by many orders of magnitude. Owing to their unprecedented temporal resolution and spatial coherence, X-ray FELs enable the visualization of the valence and core-electron dynamics on their natural timescales and more generally, can be used to conduct advanced studies in fields ranging from biology, femto-chemistry and condensed matter to the emerging field of nonlinear X-ray optics[ Reference Maroju, Grazioli, Fraia, Moioli, Ertel, Ahmadi, Plekan, Finetti, Allaria, Giannessi, De Ninno, Spezzani, Penco, Spampinati, Demidovich, Danailov, Borghes, Kourousias, Dos Reis, Billé, Lutman, Squibb, Feifel, Carpeggiani, Reduzzi, Mazza, Meyer, Bengtsson, Ibrakovic, Simpson, Mauritsson, Csizmadia, Dumergue, Kühn, Gopalakrishna, You, Ueda, Labeye, Bækhøj, Schafer, Gryzlova, Grum-Grzhimailo and Prince 7 ].
SwissFEL is a compact X-ray FEL facility with an ultra-low-emittance electron bunch and corresponding short-period undulators. It can be driven to the hard X-ray regime using a relatively low-energy (6 GeV) linear accelerator (LINAC). The electron accelerator feeds two parallel FEL lines: Aramis and Athos. The Aramis FEL delivers hard X-ray radiation (SASE mode) down to 1 Å wavelength (12 keV energy) with pulse energies of more than 500 μJ, typical pulse durations of approximately 30 fs (root mean square (r.m.s.)), and a relative spectral bandwidth below the 0.1% level[ Reference Prat, Abela, Aiba, Alarcon, Alex, Arbelo, Arrell, Arsov, Bacellar, Beard, Beaud, Bettoni, Biffiger, Bopp, Braun, Calvi, Cassar, Celcer, Chergui, Chevtsov, Cirelli, Citterio, Craievich, Divall, Dax, Dehler, Deng, Dietrich, Dijkstal, Dinapoli, Dordevic, Ebner, Engeler, Erny, Esposito, Ferrari, Flechsig, Follath, Frei, Ganter, Garvey, Geng, Gobbo, Gough, Hauff, Hauri, Hiller, Hunziker, Huppert, Ingold, Ischebeck, Janousch, Johnson, Johnson, Juranić, Jurcevic, Kaiser, Kalt, Keil, Kiselev, Kittel, Knopp, Koprek, Laznovsky, Lemke, Sancho, Löhl, Malyzhenkov, Mancini, Mankowsky, Marcellini, Marinkovic, Martiel, Märki, Milne, Mozzanica, Nass, Orlandi, Loch, Paraliev, Patterson, Patthey, Pedrini, Pedrozzi, Pradervand, Radi, Raguin, Redford, Rehanek, Reiche, Rivkin, Romann, Sala, Sander, Schietinger, Schilcher, Schlott, Schmidt, Seidel, Stadler, Stingelin, Svetina, Treyer, Trisorio, Vicario, Voulot, Wrulich, Zerdane and Zimoch 8 ]. The Athos branch is a new, highly versatile FEL line that has been designed to deliver soft X-ray radiation covering a variety of modes (SASE, CHIC[ Reference Prat, Calvi, Ganter, Reiche, Schietinger and Schmidt 9 ], self-seeding[ Reference Ribič, Abrami, Badano, Bossi, Braun, Bruchon, Capotondi, Castronovo, Cautero, Cinquegrana, Coreno, Couprie, Cudin, Danailov, De Ninno, Demidovich, Di Mitri, Diviacco, Fawley, Feng, Ferianis, Ferrari, Foglia, Frassetto, Gaio, Garzella, Ghaith, Giacuzzo, Giannessi, Grattoni, Grulja, Hemsing, Iazzourene, Kurdi, Lonza, Mahne, Malvestuto, Manfredda, Masciovecchio, Miotti, Mirian, Nikolov, Penco, Penn, Poletto, Pop, Prat, Principi, Raimondi, Reiche, Rousse, Sauro, Scafuri, Sigalotti, Spampinati, Spezzani, Sturari, Svandrlik, Tanikawa, Trovó, Veronese, Vivoda, Xiang, Zaccaria, Zangrando, Zangrando and Allaria 10 ], laser-based seeding[ Reference Ratner, Abela, Amann, Behrens, Bohler, Bouchard, Bostedt, Boyes, Chow, Cocco, Decker, Ding, Eckman, Emma, Fairley, Feng, Field, Flechsig, Gassner, Hastings, Heimann, Huang, Kelez, Krzywinski, Loos, Lutman, Marinelli, Marcus, Maxwell, Montanez, Moeller, Morton, Nuhn, Rodes, Schlotter, Serkez, Stevens, Turner, Walz, Welch and Wu 11 ]). The Athos design wavelengths extend in the soft X-ray regime between 5 and 0.65 nm (250 eV to 1.9 keV energy) with expected pulse durations ranging from 30 fs r.m.s. to 250 as r.m.s. and have advanced control of the X-ray polarization[ Reference Abela, Alarcon, Alex, Arrell, Arsov, Bettoni, Bopp, Bostedt, Braun, Calvi, Celcer, Craievich, Dax, Dijkstal, Dordevic, Ferrari, Flechsig, Follath, Frei, Gaiffi, Geng, Gough, Hiller, Hunziker, Huppert, Ischebeck, Johri, Juranic, Kalt, Kaiser, Keil, Kittel, Kunzi, Lippuner, Lohl, Marcellini, Marinkovic, Loch, Orlandi, Patterson, Pradervand, Paraliev, Pedrozzi, Prat, Ranitovic, Reiche, Rosenberg, Sanfilippo, Schietinger, Schmidt, Schnorr, Svetina, Trisorio, Vicario, Voulot, Wagner, Worner, Zandonella, Patthey and Ganter 12 ]. The commissioning of the Aramis line began in August 2016, with first pilot experiments at the end of 2017 leading to the start of regular user operation in early 2019. Commissioning of the Athos line began in 2018 with first light generated at the end of 2019 and first user operation expected in 2021.
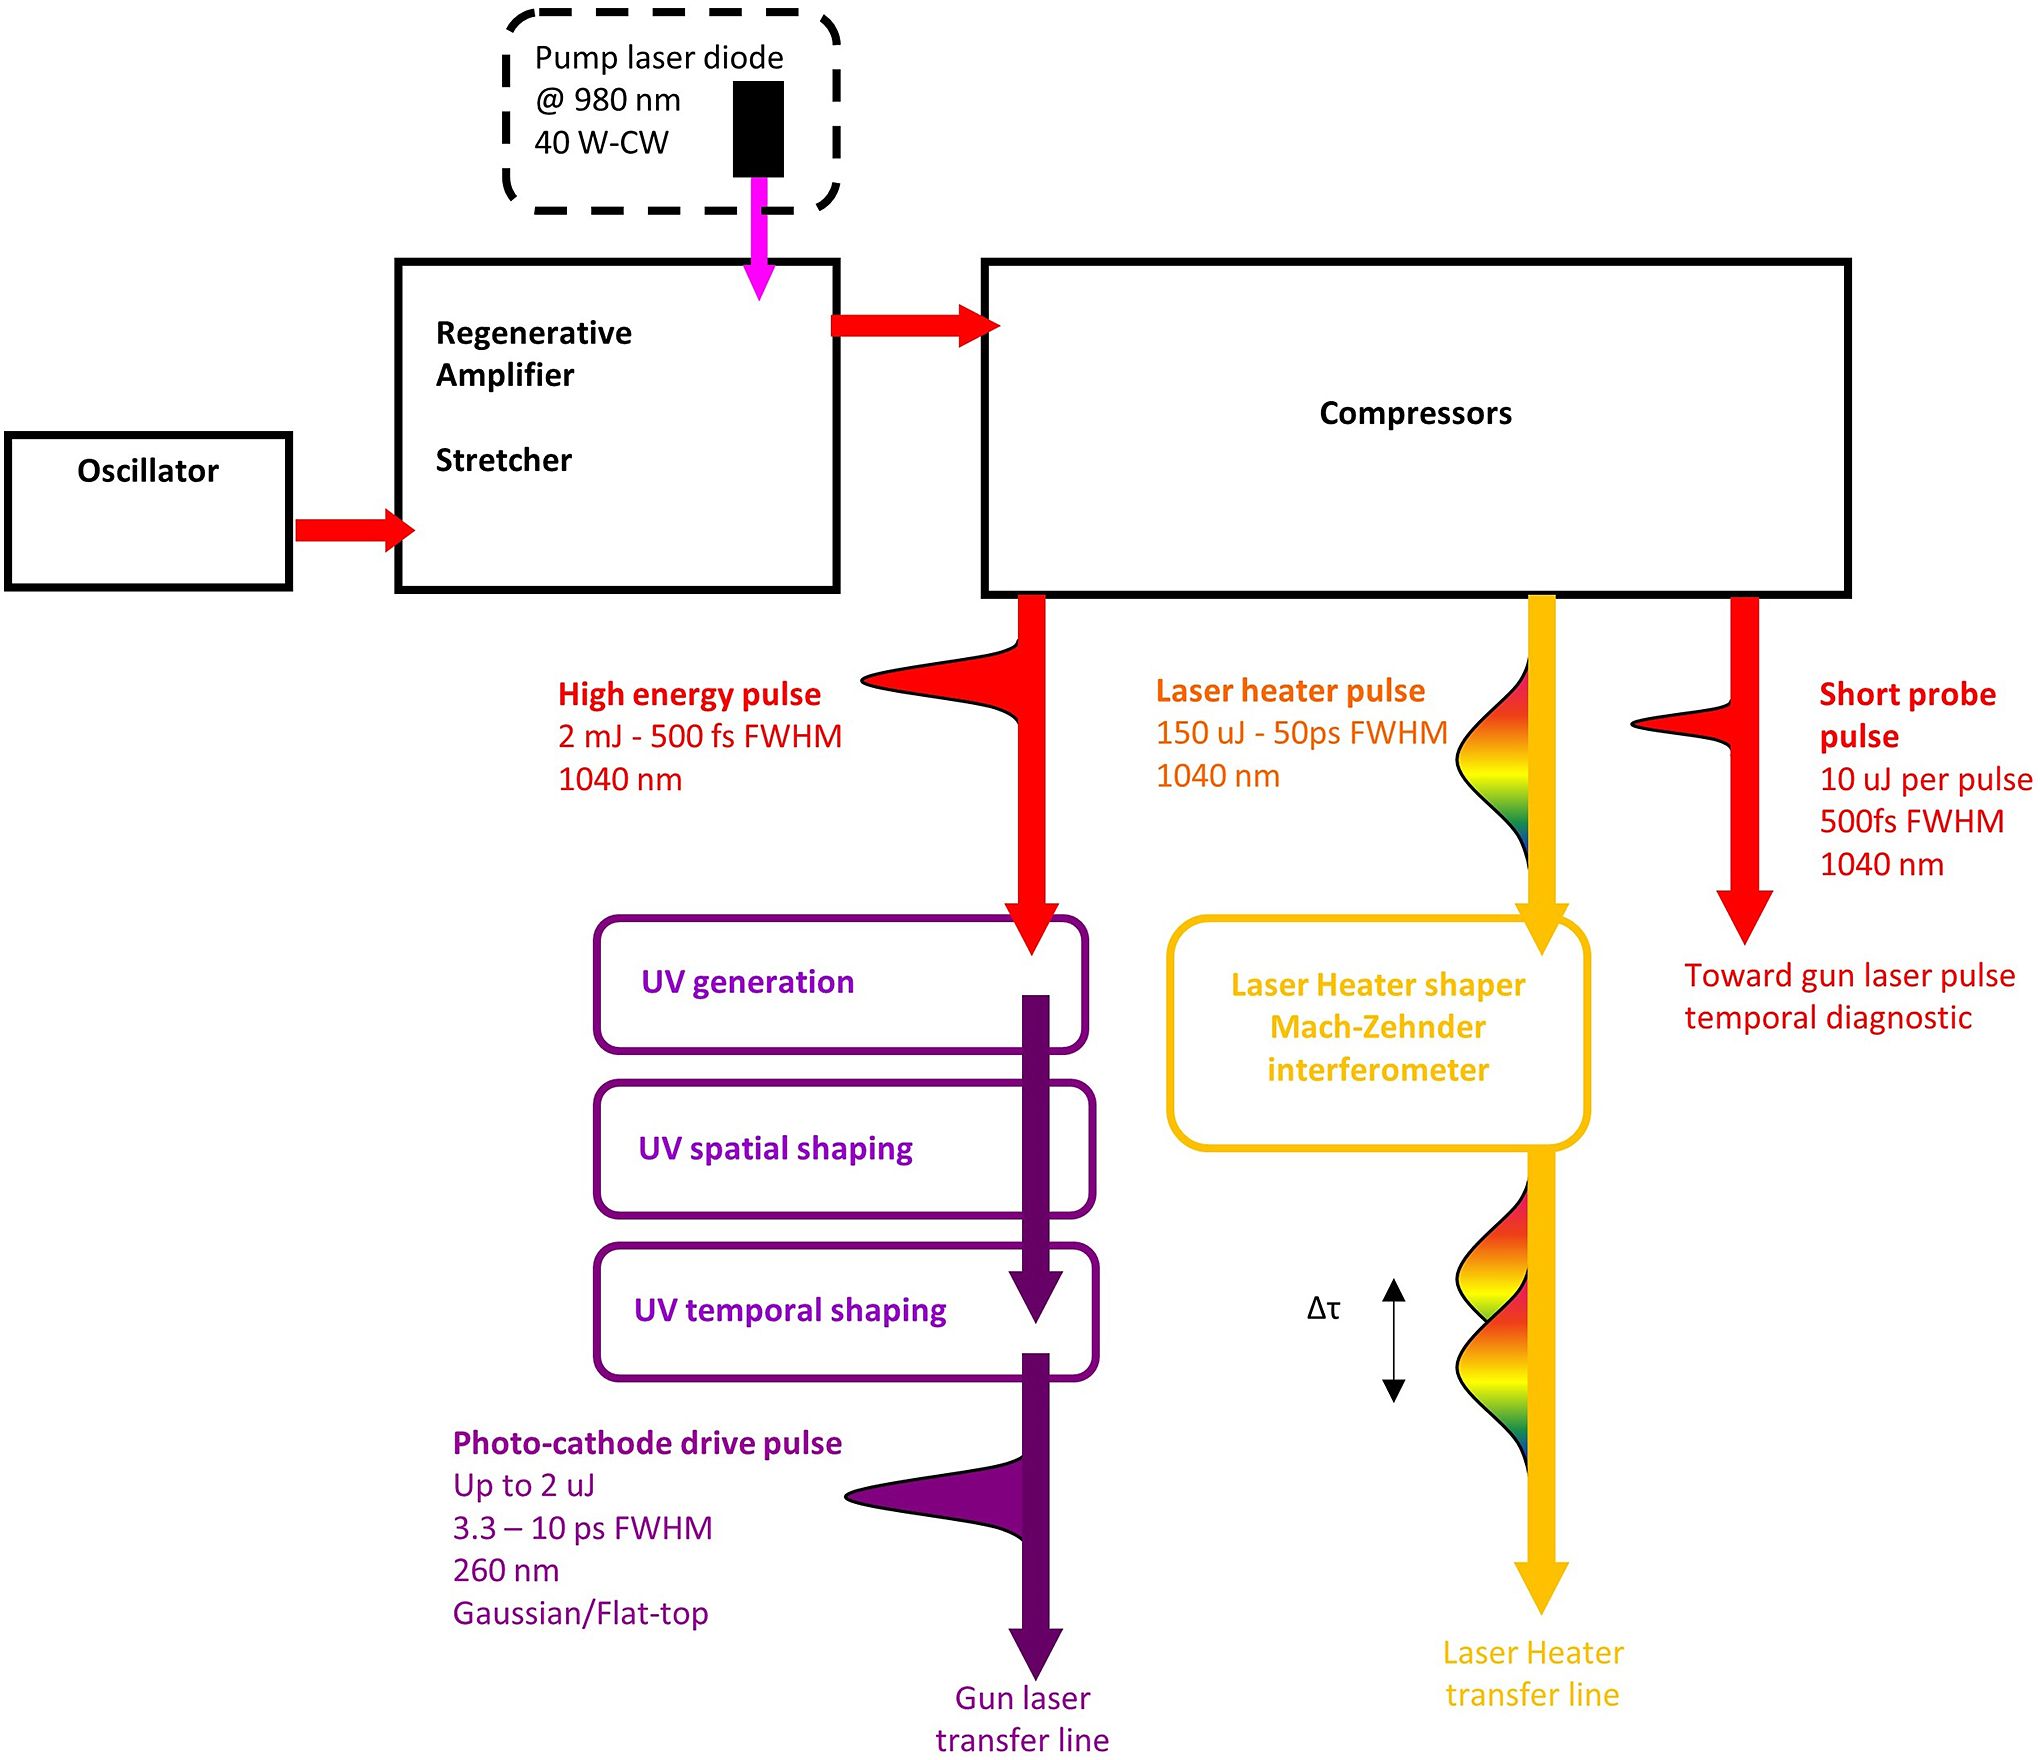
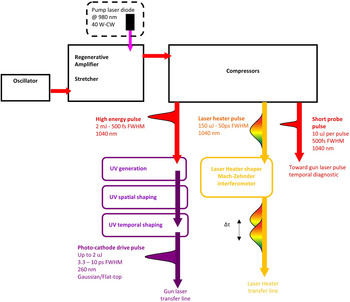
In order to produce the high brightness electron bunch required to drive the FEL at relatively low energies, SwissFEL uses an advanced photo-injector[ Reference Prat, Aiba, Bettoni, Beutner, Reiche and Schietinger 13 ] capable of delivering picosecond electron bunches at 250 MeV with a slice emittance of approximately 200 nm at a bunch charge of 200 pC. In addition, the photo-injector can produce two electron bunches separated by 28 ns to seed the Aramis and Athos undulators in parallel. Deep-UV (λ = 260 nm) laser pulses generate the electron bunches by photoemission from a Cs2Te photocathode. As a consequence of the electron dual-bunch temporal structure, the architecture of the SwissFEL photocathode laser consists of two, almost identical, photocathode drive laser (PCDL) systems. Each of the systems is capable of delivering three independent laser pulses: the UV-PCDL pulse, the so-called ‘laser heater’ (LH) pulse and a ‘short probe’ (SP) pulse, all coming from a single regenerative amplifier. Figure 1 shows the detailed overview of the system architecture and optical parameters.
Functional layout of one of the two SwissFEL PCDLs including the photocathode drive UV pulse, the laser heater (LH), and the short probe (SP) pulse.
In this paper, we give an overview of the SwissFEL, ytterbium-based, dual-PCDL that has been in routine operation since 2019. In Section 2, we give a detailed description of the system architecture, the spatial and temporal shaping, as well as the pure optical and ‘timing and synchronization’ performances. In Section 3 we provide an overview of the dual-PCDL optical layout and describe the performance with regard to electron bunch generation at the injector. Finally, we present an overview of the unique capabilities enabled by these PCDL/LH systems. Among multiple advances, we highlight a new two-color FEL emission mode demonstrated at Aramis that was enabled by the dual architecture. We also introduce future applications that may provide the potential to generate sub-fs electron bunches.
2 PCDL system overview
The dual-PCDL architecture developed over recent years at SwissFEL makes use of two compact, industrial-grade, ytterbium laser oscillators and amplifiers ensuring stable, reliable, and cost-effective operation. Thanks to low-cost pump diodes emitting at 980 nm this technological approach is a compelling alternative to the well-established yet more expensive Ti:sapphire (Ti:Sa) laser technology which is widely used at other FEL facilities such as LCLS or FERMI[ Reference Danailov, Demidovich, Ivanov and Sigalotti 14 , Reference Dowell, Castro, Emma, Frisch, Gilevich, Hays, Hering, Limborg-Deprey, Loos, Miahnahri and White 15 ].
2.1 Oscillator
In this section, we present a complete characterization of the PCDL oscillator: an industrial-grade Origami-10[ 16 ]; the optical platform has been developed by OneFive GmbH (now NKT Photonics) and the synchronization electronics by the Paul Scherrer Institute (PSI).
Optical setup for the characterization of the Origami-10 oscillator. F1 and F2, SM980 fiber outputs 1 and 2 with SC/APC connector; BS, beam splitter; P, Thorlabs S144C sensor + PM100 controller; A, APE Pulse Check autocorrelator; S, Ocean Optics Maya2000Pro-NIR spectrometer; C, Wincam UV-CCD.

(a) Deconvolved autocorrelation measurement of the oscillator pulse. (b) Measured spectral intensity.

2.1.1 Optical performance
The setup used to characterize the optical performance of the oscillator is shown in Figure 2. The oscillator has three outputs, the main one of which is free space and carries 139 mW output power at 71.4 MHz corresponding to 2.12 nJ per pulse. This is split via beam splitters in order to serve the various optical diagnostics. In addition, two single-mode fibered outputs (F1: 15.4 mW and F2: 14.5 mW) are available to stabilize and monitor the oscillator timing jitter.
The pulse temporal profile is recorded with a commercial autocorrelator (APE Pulse Check). As shown in Figure 3(a), the pulse duration is 194 fs at full width at half maximum (FWHM) corresponding to the transform limit. The temporal profile is free of pre- and post-pulses. The central wavelength is 1041.3 nm and the spectral width is 6.8 nm FWHM (Figure 3(b)). The spectrum is free of spectral ripples. This makes it suitable to seed recently developed Yb:CaF2 short-pulse amplifiers.
In order to confirm that the oscillator spatial beam quality is well-suited to seed a regenerative amplifier, the beam spatial properties have been measured. As can be seen in Figure 4, the output beam is symmetric, does not show any intensity hotspots and the ellipticity was calculated to be 0.93. We recorded a beam pointing stability of 9.5 μrad r.m.s. over 1 hour at 100 Hz repetition rate. Finally, in order to characterize the deviation from an ideal Gaussian beam, we measured the M 2 values in both horizontal and vertical planes: M 2 X = 1.04 and M 2 Y = 1.12.
To complete the optical characterization, we investigated the oscillator amplitude noise. The oscillator power was measured with an integrating sphere photodiode (PD) power sensor (Thorlabs S144C) over 12 hours. During the measurement, the laboratory access was closed in order to avoid any external disturbance. Figure 5 shows the variation of the oscillator main output power over time: the long-term amplitude stability is 1.07% peak–peak and 0.18% r.m.s. over 12 hours. The nominal resolution of the S144C detector (1 nW) allows us to state that the measurement is reliable.
To summarize, the oscillator delivers 194 fs FWHM pulses with a clean temporal and spectral profile. The output power is 139 mW at 71.40 MHz repetition rate. The beam quality is good and the amplitude stability is excellent. This oscillator is thus well-suited to seed a high-energy amplifier stage.
Beam profile of the oscillator output. As expected, the beam profile exiting from the oscillator is symmetric and has no intensity hotspot.

Oscillator output power versus time. The long-term amplitude stability is 1.07% peak–peak and 0.18% r.m.s. over 12 hours.

2.1.2 Oscillator timing jitter
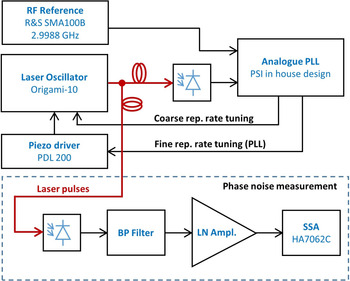
The PCDL oscillator repetition rate (RR) must be synchronized to the FEL optical master oscillator (OMO), the latter serving as the clock of the machine. All sub-systems must be accurately synchronized to this reference clock. A detailed description of the SwissFEL timing reference distribution system can be found in Refs. [Reference Milne, Schietinger, Aiba, Alarcon, Alex, Anghel, Arsov, Beard, Beaud, Bettoni, Bopp, Brands, Brönnimann, Brunnenkant, Calvi, Citterio, Craievich, Csatari Divall, Dällenbach, D’Amico, Dax, Deng, Dietrich, Dinapoli, Divall, Dordevic, Ebner, Erny, Fitze, Flechsig, Follath, Frei, Gärtner, Ganter, Garvey, Geng, Gorgisyan, Gough, Hauff, Hauri, Hiller, Humar, Hunziker, Ingold, Ischebeck, Janousch, Juranić, Jurcevic, Kaiser, Kalantari, Kalt, Keil, Kittel, Knopp, Koprek, Lemke, Lippuner, Llorente Sancho, Löhl, Lopez-Cuenca, Märki, Marcellini, Marinkovic, Martiel, Menzel, Mozzanica, Nass, Orlandi, Ozkan Loch, Panepucci, Paraliev, Patterson, Pedrini, Pedrozzi, Pollet, Pradervand, Prat, Radi, Raguin, Redford, Rehanek, Réhault, Reiche, Ringele, Rittmann, Rivkin, Romann, Ruat, Ruder, Sala, Schebacher, Schilcher, Schlott, Schmidt, Schmitt, Shi, Stadler, Stingelin, Sturzenegger, Szlachetko, Thattil, Treyer, Trisorio, Tron, Vetter, Vicario, Voulot, Wang, Zamofing, Zellweger, Zennaro, Zimoch, Abela, Patthey and Braun6, Reference Hunziker, Arsov, Buechi, Kaiser, Romann, Schlott and Orel17]. For the measurements that are shown in this paper, it is important to mention that the oscillator was not locked to the OMO but to an RF reference signal from a low-phase-noise microwave generator. The PCDL oscillator has a coarse (slow) and a fine (fast) repetition rate tuning actuators. The former is based on a built-in heating system and the latter is based on a cavity end mirror mounted on a piezo transducer. The coarse RR tuning is needed to keep the RR close to nominal within the piezo tuning range of ±600 Hz. This is done by means of the built-in heater changing the optical cavity length without mechanically moving components. The piezo control loop (PSI Analogue PLL) locks the RR to the 2.9988 GHz reference signal. This frequency represents the 42nd harmonic of the OMO RR and in the real setup (at the FEL facility) is extracted from the OMO pulse train. The stabilization system overview and the setup used for measuring the timing jitter of the optical oscillator are shown in Figure 6.
Measurement setup used for the free-running and locked timing jitter. BP Filter, 2.9988 GHz bandpass filter; LN Ampl., low-noise amplifier; PLL, phase-locked loop; SSA, signal source analyzer.

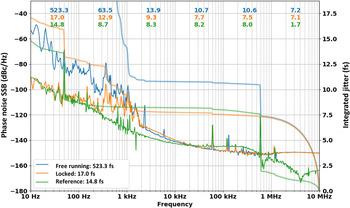
On the left axis is the measured absolute phase noise (in dBc/Hz) for the RF reference signal (green), the free-running (blue), and the locked (orange) Origami-10 laser oscillator. Measurements were performed using a Holzworth HA7062C SSA. The SSA carrier frequency was 2.9988 GHz and the number of correlations for obtaining one trace was set to 100. On the right axis is the integrated jitter for the reference signal, the free-running, and the locked laser oscillator. The numerical value of cumulated timing jitter (right to left) after each decade is indicated as well.

There are different methods for measuring the timing jitter of mode-locked lasers[ Reference von der Linde 18 , Reference Paschotta, Rudin, Schlatter, Spühler, Krainer, Zeller, Haverkamp, Telle and Keller 19 ]. Here we use a signal source analyzer (SSA) that measures the phase noise power spectral density of the signal under test (SUT). The SSA locks two low-phase-noise electronic oscillators to the SUT with a relatively low loop bandwidth. The mixed signals from each oscillator with the SUT are then correlated with each other. Correlated phase noise terms correspond to the phase noise of the SUT, while uncorrelated phase noise terms correspond to the phase noise of the electronic oscillators and cancel each other out. For the measurement of the Origami-10 timing jitter, a fiber-coupled optical output from the oscillator is sent to a PD with a stabilized low-noise bias voltage. To avoid damaging and saturation of the PD, the laser output was attenuated using a fiber-based variable optical attenuator. The PD signal is filtered with a band-pass filter with a 2.9988 GHz center frequency (42nd harmonic of the Origami-10 laser repetition rate), then further amplified with a low-noise amplifier (LN Ampl.), and measured with a Holzworth HA7062C SSA. Measuring at this 42 times higher frequency rather than measuring directly at the RR increases the jitter measurement sensitivity. The setup also allows locking of the Origami-10 to an RF reference and measurement of its timing. The RF reference provides a low-phase-noise signal of 2.9988 GHz for the analog laser PLL (developed at PSI) that is used to lock the Origami-10 oscillator effective repetition rate using its built-in piezo actuator. A low-noise amplifier (PiezoDrive PDL200) is used to drive the piezo actuator. Figure 7 shows the measured single sideband phase noises (in dBc/Hz) with respect to the offset frequency for the RF reference (green), the free running (blue), and the locked optical oscillator (orange). For each of them, the integrated timing jitter has been computed using the trapezoidal integration method. The numerical value of cumulated timing jitter (right to left) after each decade is also indicated. Only absolute phase noise/jitter was measured, and no relative measurements were made. The jitter performances with respect to the offset frequency span are summarized in Figure 7. One can see that the noise floor of the measurement (shot noise at PD saturation current and amplifiers) is reached already below 10 MHz, and thus we computed the integrated phase noise up to 10 MHz.
The RF reference we used has a total timing jitter of 14.8 fs r.m.s. over 10 Hz–10 MHz. The total Origami-10 free-running timing jitter was measured to be 523.3 fs r.m.s. over 10 Hz–10 MHz bandwidth, which is comparatively low in relation to Ti:Sa oscillators that we use at other places in the facility (they exhibit typically >2 ps r.m.s. integrated timing jitter over the same range).
The phase noise depends very much on environmental conditions (mainly mechanical vibrations below 50 Hz), the cooling technology that is used and the pump laser stability. As is apparent from Figure 7, the phase noise curves of the RF reference (green curve) and the free-running optical oscillator (blue curve) cross at a frequency of around 11 kHz. This would thus be the optimum phase-locking loop bandwidth. Adjusting the PID controller parameters of the laser PLL to yield a locking bandwidth up to 2 kHz, the closed-loop absolute jitter is reduced to about 17 fs r.m.s. over 10 Hz–10 MHz bandwidth. Furthermore, it is evident from Figure 7 that the contribution between 1 kHz and 10 MHz is only 9.3 fs r.m.s. for the locked Origami oscillator. This value includes a significant (dominant) contribution from the measurement setup and can be further reduced by optimizing the photodetector and/or measuring at a higher harmonic.
In summary, the absolute laser oscillator timing jitter is reduced from 523.3 fs r.m.s. to 17 fs r.m.s. (integrated from 10 Hz to 10 MHz, including spurs) indicating that the synchronization PID loop performs very well inside the locking bandwidth of a few kilohertz. This is to the best of the authors’ knowledge the best value achieved for such type of laser.
2.2 Amplifier
The choice of the laser gain medium and architecture has a direct effect on its final performance and reliability. Yb:CaF2 has desirable properties for the production of high-energy, UV femtosecond pulses (good thermal conductivity, broad emission bandwidth, adequate pumping wavelength). Moreover, by keeping the laser architecture compact, the system reliability is improved compared with a multi-stage Ti:Sa amplifier. Calcium fluoride with ytterbium doping (Yb:CaF2) was first used as an active laser medium for continuous wave (CW) systems in 2004[
Reference Petit, Doualan, Camy, Menard and Moncorgé
20
]. Its useful properties for laser amplification led to developments for short-pulse, high-energy laser systems up to the terawatt scale[
Reference Siebold, Hornung, Boedefeld, Podleska, Klingebiel, Wandt, Krausz, Karsch, Uecker, Jochmann, Hein and Kaluza
21
]. The Yb:CaF2 emits in the 1020–1060 nm spectral range allowing the generation of sub-500 fs pulses. The crystal absorption cross section has a pronounced and narrow band peak at 980 nm (Figure 8) which allows direct pumping with CW infrared diode modules developed for telecom applications. The Yb:CaF2 material fluorescence lifetime of 2.4 ms and thermal conductivity of 4.9 W $\cdot$
m-1
$\cdot$
m-1 $\cdot$
K-1[
Reference Druon, Ricaud, Papadopoulos, Pellegrina, Camy, Monocorgé, Courjaud, Mottay and Georges
22
] are well suited for the design of high-power lasers. The first is crucial, because it permits high-energy storage in regenerative amplifier cavities leading to high-energy pulses. The latter permits CW pumping with high average power while avoiding detrimental thermal effects. Thus, we chose the ytterbium technology for the SwissFEL PCDL.
$\cdot$
K-1[
Reference Druon, Ricaud, Papadopoulos, Pellegrina, Camy, Monocorgé, Courjaud, Mottay and Georges
22
] are well suited for the design of high-power lasers. The first is crucial, because it permits high-energy storage in regenerative amplifier cavities leading to high-energy pulses. The latter permits CW pumping with high average power while avoiding detrimental thermal effects. Thus, we chose the ytterbium technology for the SwissFEL PCDL.
Absorption spectrum of Yb:CaF2 at RT (black). The absorption peak around 980 nm (yellow window) allows direct pumping with CW diodes[ Reference Druon, Ricaud, Papadopoulos, Pellegrina, Camy, Monocorgé, Courjaud, Mottay and Georges 22 ].

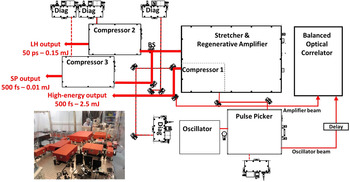
Figure 9 shows the Yb:CaF2 CPA laser system (custom S-Pulse HE – Amplitude Systèmes). After stretching (≈200 ps FWHM), the oscillator output is amplified in a regenerative amplifier up to 3.5 mJ pulse energy before compression. Owing to the previously mentioned properties of the Yb:CaF2 medium, it is possible to reach this high level of energy in a single amplifier stage. The regenerative amplifier ensures a very high output mode quality and energy stability. Moreover, all the components (stretcher, amplifier, and high-energy compressor) are packaged in hermetically sealed boxes as can be seen in Figure 9. This ensures a high mechanical stability of the system and also low sensitivity to environmental changes. The balanced optical correlator (BOC) used for measuring the amplifier output timing jitter and drift is also shown.
Layout of one of the PCDL systems, the various optical elements are packaged in sealed boxes. The overall footprint is 1.5 m × 2.5 m. BS, beam splitter; Diag, diagnostics module boxes that include Joule meter, camera, and optical fiber for spectrum acquisition.

The regenerative amplifier is pumped with a single CW diode module (18 W is effectively used out of the 40 W of the module at 980 nm). This direct pumping scheme combines several advantages. First an exceptionally high pumping efficiency because the material can be pumped with the fundamental radiation emitted by the diode stack. Second, a high reliability and a long lifetime (>40,000 hours) of the laser are achievable. Finally, high compactness and low operation cost (around €25,000/module) with respect to the typical Nd:YAG technology used to pump Ti:Sa systems. The regenerative amplifier brings the pulse energy from 0.7 nJ to 3.5 mJ with a build-up time of 3.9 μs in the regenerative amplifier’s cavity. After amplification, the beam is split in two: the first with 2.8 mJ pulses is sent to the high-energy compressor (compressor 1 in Figure 9); the second is used for the LH and the SP outputs and described later. The pulse temporal shape is Gaussian and compressed to 500 fs FWHM duration as shown in Figure 10.
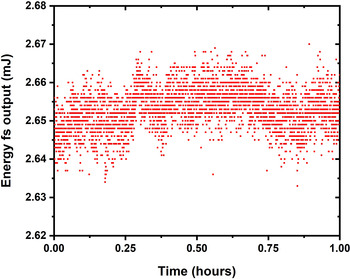
As shown in Figure 11, the average IR output energy in this arm was 2.65 mJ with an r.m.s. stability of 0.19% over 1 hour (measured with Gentec Maestro and QE50 pyroelectric detector). The CW pumping scheme and the saturation of the regenerative amplifier allow reaching a very high energy stability.
The beam profile was also measured (Figure 12) to be approximately Gaussian without hot spots. Finally, in order to characterize the deviation from an ideal Gaussian beam, we measured the M 2 values in both horizontal and vertical planes: M 2 X = 1.3 and M 2 Y = 1.16.
Autocorrelation trace (black) and Gaussian fit (red) of the amplifier's IR compressed pulse. The pulse duration is 500 fs FWHM.

Measured energy and stability of the high-energy output: system exhibits a very high stability of 0.19% r.m.s. over 1 hour.

Measured beam profile of the high-energy IR output.

The laser system is also capable of delivering two additional synchronized outputs: a dedicated compressor (Compressor 2; Figure 9) emits 50 ps FWHM stretched pulses (Gaussian in time) carrying an energy of 150 μJ for the LH. Finally, in order to temporally characterize the UV pulse (via a dedicated cross-correlator), the system provides a short IR probe (Compressor 3; Figure 9) with 500 fs FWHM long pulses (Gaussian in time) and moderate energy of 10 μJ.
2.3 Dual-PCDL architecture
As described in the introduction, the SwissFEL PCDL must deliver two deep-UV pulses separated by 28 ns in order to seed the hard and soft X-ray lines of the FEL. The deep-UV pulse duration, energy, and temporal shape must be independently adjustable for each line. The LH and SP pulses must be available as well. These requirements are fulfilled by using a second PCDL system as in the optical setup depicted in Figure 13. Since both the PCDL pulses and the LH pulses must reach the accelerator at a given time and with specific delays, an accurate and precise design of the complete setup has been performed using a CAD software (CATIA – Dassault Systèmes). The two laser systems, PCDLs 1 and 2, as well as the BOCs used to stabilize the amplified pulse arrival time are depicted in Figure 13 (red areas). A subsequent deep-UV generation stage via fourth harmonic generation (FHG), temporal shaping (via $\unicode{x3b1}$
-BBO pulse stacking or a UV grating stretcher) as well as spatial filtering (UV Fourier filtering) stages are displayed in detail in Figure 13 (blue areas). The performance of these is covered in the following sections. The two UV-PCDL pulses must be recombined and spatially shaped (via hard aperturing) before being relayed to the accelerator via an in-vacuum imaging transfer line (TL) (Figure 13, green area). The same recombination and imaging procedure is applied to the two LH pulses. It must be noted that the correct arrival time of both the photocathode and LH pulses for all operational modes is challenging and requires a careful design of the optical paths as well as automatic delay compensation using motorized delay stages and a Herriott Cell optical setup (Figure 13, yellow area).
$\unicode{x3b1}$
-BBO pulse stacking or a UV grating stretcher) as well as spatial filtering (UV Fourier filtering) stages are displayed in detail in Figure 13 (blue areas). The performance of these is covered in the following sections. The two UV-PCDL pulses must be recombined and spatially shaped (via hard aperturing) before being relayed to the accelerator via an in-vacuum imaging transfer line (TL) (Figure 13, green area). The same recombination and imaging procedure is applied to the two LH pulses. It must be noted that the correct arrival time of both the photocathode and LH pulses for all operational modes is challenging and requires a careful design of the optical paths as well as automatic delay compensation using motorized delay stages and a Herriott Cell optical setup (Figure 13, yellow area).
3D CAD layout of the SwissFEL dual-photocathode drive laser (PCDL) optical setup. The PCDLs 1 and 2 (red areas) are capable of delivering the temporally and spatially shaped, deep-UV pulses (blue areas and green area) as well as the laser heater (LH) and the short probe (SP) pulses for the two free electron laser (FEL) lines. The two UV-PCDLs and the two LH beams are recombined (green area) and sent towards the accelerator via two dedicated imaging transfer lines (TLs). The yellow area includes the LH Herriott cell used to delay the two LH pulses.

The dual-amplifier architecture increases the system flexibility and reliability with regard of the FEL operation and allows for exotic FEL modes of operation.
2.3.1 Deep-UV generation, temporal and spatial shaping
The PCDL requirements at the photocathode are listed in Table 1. For stable FEL operation, tight specifications, especially in terms of energy stability as well as spatial and temporal shape of the PCDL pulse, must be fulfilled. These are achieved by careful design of the harmonic conversion stage and by employing spatial and temporal pulse-shaping techniques that we describe in this section.
SwissFEL UV-photocathode drive laser pulse parameters.

2.3.2 Deep-UV generation
Deep-UV radiation is generated from the high-energy IR output using second and subsequent FHG in BBO non-linear crystals. The crystal angles and thicknesses have been calculated using the SNLO software[
23
]: the second harmonic crystal (θ = 23.2°/φ =0°, Type I) has a thickness of 1.5 mm and the fourth harmonic (θ = 49.3°/φ = 0°, Type I) a thickness of 0.75 mm. The fundamental IR beam has a beam diameter of 3.6 mm at 1/e
2 (corresponding to an intensity of 4.36 × 10¹⁰ W $\cdot$
cm-2 on the second harmonic generation (SHG) crystal). The SHG efficiency is 51% leading to a 1.15 mJ pulse at 520 nm. Subsequently, the SHG beam has a beam diameter of 3.2 mm at 1/e
2 (corresponding to an intensity of 2.85 × 10¹⁰ W
$\cdot$
cm-2 on the second harmonic generation (SHG) crystal). The SHG efficiency is 51% leading to a 1.15 mJ pulse at 520 nm. Subsequently, the SHG beam has a beam diameter of 3.2 mm at 1/e
2 (corresponding to an intensity of 2.85 × 10¹⁰ W $\cdot$
cm-2 on the FHG crystal). The IR to FHG efficiency is 24.3% leading to a 560 μJ pulse in the deep-UV (260 nm) with a duration of 560 fs FWHM. As shown in Figure 14, the output energy stability is 0.24% r.m.s. over 200 s (measured with Gentec Maestro and QE8SP pyroelectric detector).
$\cdot$
cm-2 on the FHG crystal). The IR to FHG efficiency is 24.3% leading to a 560 μJ pulse in the deep-UV (260 nm) with a duration of 560 fs FWHM. As shown in Figure 14, the output energy stability is 0.24% r.m.s. over 200 s (measured with Gentec Maestro and QE8SP pyroelectric detector).
Measured energy and stability of the UV output: system exhibits a very high stability of 0.24% r.m.s. over 200 seconds.

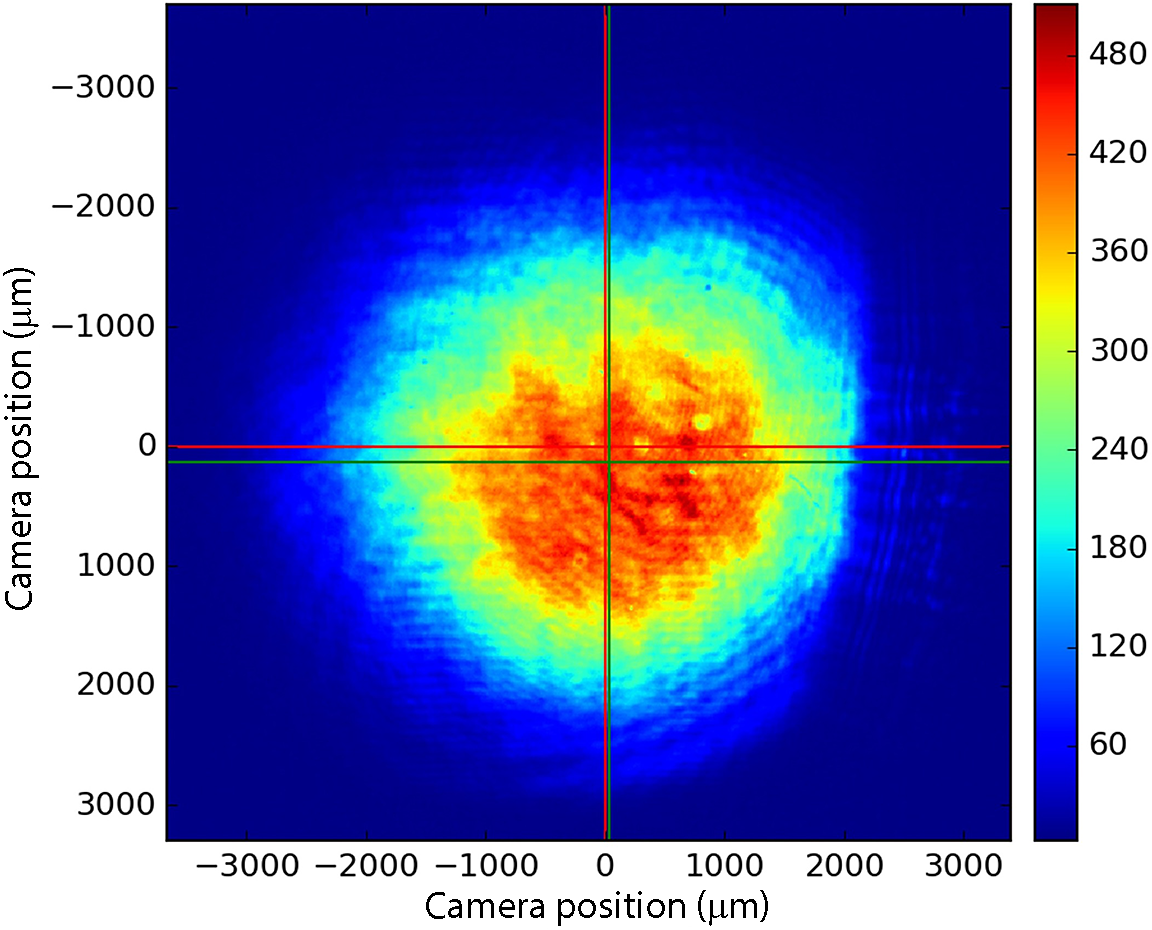
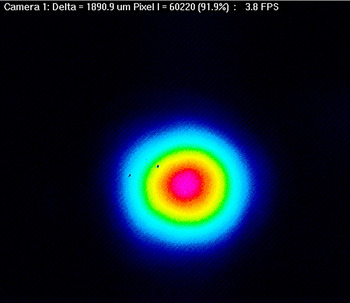
The measured UV beam profile (Figure 15) shows spatial structures that are typical for up-converted, high-energy laser beams. These structures grow during beam propagation and are detrimental for the photo-injector electron quality. Our application requires a spatially flat-topped and smooth UV beam profile on the cathode. In order to achieve this profile, Fourier filtering and spatial shaping of the UV beam are necessary.
Measured beam profile of the UV output.
2.3.3 Deep UV spatial cleaning and shaping
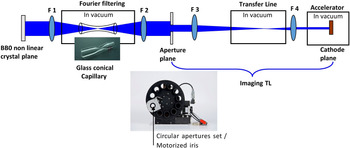
In order to produce a low-emittance electron beam, the PCDL must have a spatially flat-top intensity profile on the cathode plane. This is a very challenging issue, especially in the UV where both the non-linear conversion stages used to generate the UV radiation and the transport of the laser from the gun laser table down to the cathode (∼25 m) introduce distortions and high-frequency modulations on the UV beam profile. In order to obtain a circular and smooth beam profile after the transport, we use Fourier filtering in conjunction with aperture clipping of the beam. The optical setup is described in Figure 16. The spatial Fourier filtering is performed under vacuum, which is required to avoid non-linear effects (such as self-phase modulation) owing to the high intensity of the beam near the focus position that would deteriorate the pulse properties.
UV Fourier filtering using a glass capillary. The beam is then collimated and apertured in order to obtain a flat-top spatial intensity profile. This profile is then imaged onto the cathode plane by a two-lens imaging transfer line.

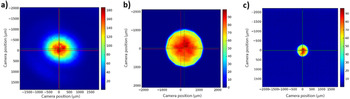
For the same reason, it is not possible to use metallic/ceramic pinholes: the laser would damage them and as a consequence ruin the Fourier filtering. Instead, a ‘bi-conical capillary’ is used: it is a hand-made capillary with inner diameter of approximately 200 μm (the laser spot size is 160 μm at 1/e 2) manufactured by Glass Müller AG, Schlieren - CH (Figure 16, upper photo). The fact that the spatial filter is made of glass allows it to resist the high laser intensity over extended periods of time and, therefore, it is an excellent and long lifetime Fourier filter. The capillary was replaced only after 3 years (∼25,000 hours of operation). After collimation and further propagation through the optical setup (the optional UV stretcher), the beam is hard clipped with a circular aperture (see the lower photo in Figure 16). This is a flat-top-like spatial intensity profile to be obtained and imaged onto the photocathode via a vacuum transfer line. Figure 17 shows the evolution of the UV beam profile: after the Fourier filtering, at the circular aperture, and onto the cathode. The overall efficiency of the Fourier filtering and the spatial aperturing including the transport losses owing to the diagnostic pickups is approximately 15%.
PCDL UV beam profile (a) after the Fourier filtering, (b) at the circular aperture, and (c) in the cathode plane.

2.3.4 Deep UV temporal shaping
As shown in Figure 1, the SwissFEL PCDL delivers a pair of picosecond, temporally shaped pulses to generate the photo-electrons at the cathode. The temporal pulse shape is programmable between Gaussian (with continuously adjustable duration between 3.3 and 10 ps FWHM) and flat-top (with two distinct durations of 3.7 and 10 ps FWHM). The flat-top pulses are especially desirable for lowering the electron beam emittance.
2.3.4.1 Gaussian
In order to obtain a Gaussian pulse with a variable duration, we designed a UV-grating based stretcher (parallel transmission gratings stretcher configuration). The stretcher makes use of high-efficiency transmission gratings (Ibsen Photonics). Table 2 summarizes the grating specifications. As shown in Figure 18(a), the typical pulse profile is Gaussian-like (6.6 ps FWHM in the shown case) and the stretcher allows delivery of pulses with a continuously variable duration between 3 and 8 ps FWHM (Figure 18(b)). The overall stretcher efficiency is 52% and it is also worth noting that after 3 years of operation the grating efficiency has not deteriorated.
(a) Temporal profile measurement and (b) pulse duration with respect to the stretcher’s gratings spacing for the UV PCDL pulse. The stretcher is used in a double-pass configuration.

UV gratings specifications.

2.3.4.2 Flat-top
In order to produce the desired flat-top temporal profile of the UV pulse, we applied temporal shaping in the time domain. The chosen technique consists of stacking individual replicas of orthogonally polarized pulses and is known as ‘pulse stacking’[
Reference Zhou, Ouzounov, Li, Bazarov, Dunham, Sinclair and Wise
24
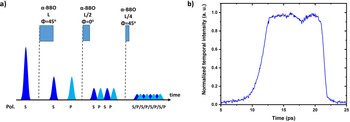
]. This technique has been proven to be one of the most efficient and robust for operation in large-scale research facilities. A schematic view of the stacking procedure is shown in Figure 19(a). A number N of birefringent crystals ( $\unicode{x3b1}$
-BBO here) of decreasing thickness are used to produce 2
N
replicas of a single Gaussian pulse equally spaced in time and orthogonally polarized. The thickness of the first crystal (L) is calculated to give the desired initial delay (T) between the two pulses generated along the ordinary and extraordinary crystal axis using
$\unicode{x3b1}$
-BBO here) of decreasing thickness are used to produce 2
N
replicas of a single Gaussian pulse equally spaced in time and orthogonally polarized. The thickness of the first crystal (L) is calculated to give the desired initial delay (T) between the two pulses generated along the ordinary and extraordinary crystal axis using
 \begin{align}T=\frac{L}{c}\left({n}_{\mathrm{o}}-{n}_{\mathrm{e}}\right).\end{align}
The temporal concatenation of the S and P polarized pulse replicas manifests as a flat-top like, picosecond pulse on the photocathode. Using two sets of $\unicode{x3b1}$
-BBO crystals allows generation of either 3.7 or 10 ps FWHM flat-top-like pulses. A typical example is depicted in Figure 19(b) where the pulse temporal profile is characterized with an optical cross-correlator. The application of these pulses in electron beam generation is described in Section 3.1.
$\unicode{x3b1}$
-BBO crystals allows generation of either 3.7 or 10 ps FWHM flat-top-like pulses. A typical example is depicted in Figure 19(b) where the pulse temporal profile is characterized with an optical cross-correlator. The application of these pulses in electron beam generation is described in Section 3.1.
(a) Principle of operation of the pulse stacking technique and (b) measured flat-top-like PCDL pulse temporal profile using an optical cross-correlator.

A limitation of the stacking technique arises from unavoidable amplitude modulations on the final profile which may negatively affect the electron beam dynamics. The length of the single stack is, in fact, limited by the possible interference pattern generated by the overlap of subsequent replicas of the same polarization state. Therefore, some modulations must be expected in the temporal electron bunch distribution owing to the fact that a discrete finite number of sub-pulses with limited length add up to the final profile.
2.4 Amplifier timing jitter/drift
The oscillator is phase locked to the machine OMO (as described in Section 2.1.2). The big advantage of Yb:CaF2 active medium for sub-fs amplified lasers is that they can be pumped directly by diode laser stacks at 980 nm, resulting in a high pump efficiency and making the laser very compact and cost-effective. The relatively large fluorescence lifetime of 2.4 ms makes the Yb:CaF2 crystal a very effective storage medium. However, the relative low gain of this laser crystal results in a build-up time of 3.9 μs in the regenerative amplifier corresponding to a travel distance of 1.17 km. This long distance makes the laser optical path highly susceptible to changes in environmental parameters such as temperature, pressure, and humidity, as well as mechanical vibrations. For the SwissFEL PCDLs, the minimum acceptable timing jitter of the pulse arrival time at the gun with respect to the OMO is about 40 fs r.m.s. in order to maintain stable shot-to-shot FEL emission[ Reference Beutner and Reiche 25 ]. As the laser arrival time is very susceptible to changes in environmental parameters, it is, thus, necessary to accurately measure and stabilize the path length immediately at the output of the laser amplifier. For such purpose, we developed a single-shot BOC coupled to an optical path length feedback loop to characterize and minimize the timing drifts of the PCDL. The BOC correlates part of the compressed amplified IR output with a subsequent pulse from the oscillator. A detailed study of the BOC, the optical path feedback loop design, and the performances are described in Ref. [Reference Dax, Divall, Hauri, Huppert, Romann, Vicario, Cavalieri and Trisorio26]. The BOC is also shown in the laser sketch shown in Figure 9.
Both the oscillator and the amplifier contribute to jitter and drift of the full laser system. Although the jitter of the amplifier is mainly determined by the oscillator synchronization quality, the drift can be accurately measured and compensated via a dedicated feedback. The measurement of the laser amplifier drift in time in reference to its seed oscillator is displayed in Figure 20 (blue curve). For correlation purpose, the laboratory air pressure (black), humidity (green), and temperature (orange) have also been recorded simultaneously. It is clear that there is a direct correlation between laser arrival time drift and air pressure as it is the only environmental parameter that is not stabilized in our laboratory. It should be noted that the temperature stability has been measured at the level of the optical table where the laser amplifier stands. We have several sensors in place over the optical setup and all of them measured consistent temperature stability. Such a stability has been achieved thanks to first an excellent air conditioning system for the laser laboratory, second the fact that the laser laboratory is underground, thus isolated from external fluctuations, and third that the laser system is encapsulated inside two laser housings. The variation of the temperature is fully correlated to the laser room temperature.
Arrival time drift of the amplifier’s output pulse relative to the oscillator pulse without active feedback measured over 48 hours (blue). For correlation purpose, the laboratory air pressure (black), humidity (green), and temperature (orange) have also been recorded simultaneously. One can see the direct correlation between laser arrival time drift and air pressure.

By employing balanced detection all amplitude fluctuations are cancelled so that only timing fluctuations are imprinted in the difference signal. Figure 21 shows the laser amplifier timing jitter signal relative to the seeding oscillator measured over 12 hours at a laser repetition rate of 100 Hz for the two PCDLs. Taking the r.m.s. values results in 4.5 fs r.m.s. for the timing jitter of the amplifier relative to the oscillator which is excellent. A detailed description of the BOC and the PCDL arrival time stabilization can be found in Ref. [Reference Dax, Divall, Hauri, Huppert, Romann, Vicario, Cavalieri and Trisorio26].
Single-shot PCDL 1 (red) and PCDL 2 (blue) timing jitter over 12 hours. The measurement was done using our balanced optical correlator (BOC). The measured time jitter is 4.5 fs r.m.s. over 12 hours.

2.5 Laser heater
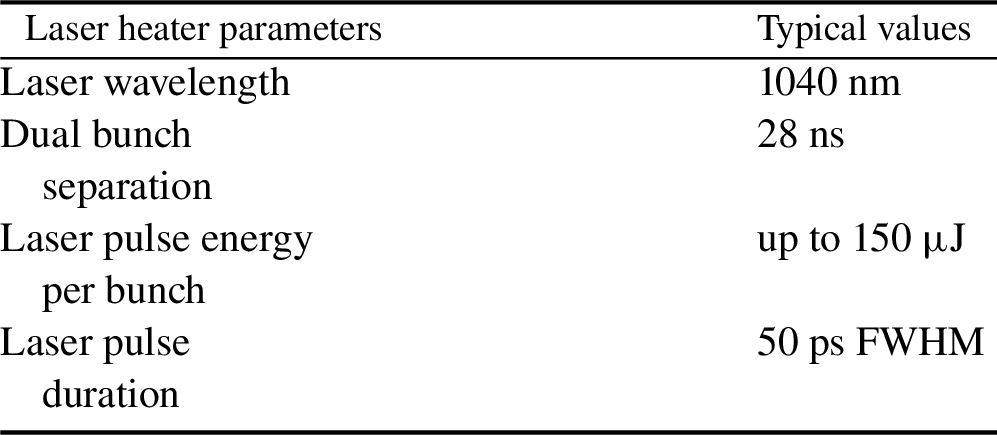
As described in the introduction, each PCDL also delivers an LH output beam in addition to the main photocathode drive beam. The LH output delivers Gaussian, 50 ps duration FWHM pulses that are overlapped in space and time with the electron bunch in the LH-chicane. The primary aim of the LH is to induce a controllable increase of the uncorrelated energy spread of the electron bunch. The heating suppresses microbunching instabilities which otherwise may limit the FEL performance[ Reference Pedrozzi, Calvi, Ischebeck, Reiche, Vicario, Fell and Thompson 27 , Reference Roussel, Ferrari, Allaria, Penco, Di Mitri, Veronese, Danailov, Gauthier and Giannessi 28 ]. Table 3 summarizes the main parameters of the system.
SwissFEL laser heater parameters.
Moreover, it was recently demonstrated that the use of a spectrally shaped LH laser pulse allows advanced optical control of the X-ray generation process[ Reference Marinelli, Coffee, Vetter, Hering, West, Gilevich, Lutman, Li, Maxwell, Galayda, Fry and Huang 29 ]. The manipulation of the spectro-temporal amplitude of the LH laser pulse allows control of the longitudinal energy spread of selected portions of the electron bunch. This the duration of the FEL photon pulse to be controlled and sliced with fs precision. The laser-shaping technique paves the way for flexible tailoring of complex multicolor FEL pulse patterns required for nonlinear multidimensional X-ray spectroscopy as well as novel multicolor diffraction imaging schemes[ Reference Marinelli, Coffee, Vetter, Hering, West, Gilevich, Lutman, Li, Maxwell, Galayda, Fry and Huang 29 ].
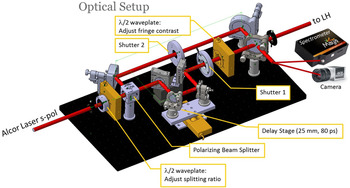
Temporal shaping can be achieved by spectrally shaping a chirped pulse. In particular, a controlled temporal modulation can be obtained by making use of the interference pattern of two replicas of the LH pulse. For this, a Mach–Zehnder-type interferometer was constructed (Figure 22). The input chirped beam is split into two independent arms, one with a motorized delay line in order to set the relative delay between the two replicas before they are recombined. Figure 23 shows the typical interference pattern obtainable with the LH shaper for various delays between the two replicas. The combined, structured pulse, can be used to limit the FEL emission to isolated regions of the electron bunch where the emittance has not been spoiled by interaction with peaks in the LH intensity profile. Accurate control of the modulation period may open new opportunities such as the generation of sub-fs FEL pulses[ Reference Marinelli, Coffee, Vetter, Hering, West, Gilevich, Lutman, Li, Maxwell, Galayda, Fry and Huang 29 ]. When the shaping capability is not required, the interferometer can be bypassed (by sending the LH beam into only one arm) and the output beam is then sent directly into the LH transfer line down to the accelerator.
Optical setup of the LH shaping scheme.

Recorded interference spectra for various delays between the two replicas.

3 Special FEL modes enabled by our PCDL
3.1 Flat-top electron bunch generation
As described previously, the PCDL is capable of delivering flat-top pulses in order to shape the temporal profile of the electron bunch. In order to optimize the flatness of the pulse shape in a direct and efficient manner, we developed a real-time feedback system using online measurement of the emitted electron bunch temporal profile. The results are summarized in this section. Once the electron bunch has been generated in the machine, its initial uncompressed temporal profile is measured (with the first bunch compressor straight, 330 MeV) by using an S-band transverse deflecting structure (TDS) built at PSI[
Reference Craievich, Ischebeck, Löhl, Orlandi and Prat
30
]. We performed measurements using 10 and 3.3 ps optical pulses. The measurements were performed at the lowest detectable charge (<1 pC) in order to minimize the space charge so that temporal profile of the electron bunch is an accurate replica of the PCDL pulse. The optimizer samples the bunch in temporal slices and computes first the response matrix of the system by adjusting each $\unicode{x3b1}$
-BBO crystal angle in turn and measuring the effect on the electron bunch temporal profile using the TDS measurement. After that, the optimizer iteratively moves each crystal angle to converge on a final temporal profile that approaches the targeted flat-top temporal profile. The mathematical method used by the optimizer is described in Ref. [Reference Boyd and Vandenberghe31]. The figure of merit (FOM) of the algorithm is the difference of the single slice flatness with respect of the average flatness of the entire number of slices. The optimization is typically completed within a few minutes. Figure 24 shows the optimized flat-top electron bunch temporal profile. This method is a powerful tool for automated optimization of the electron bunch properties required for the low-charge, short-pulse mode at SwissFEL[
Reference Ganter
32
].
$\unicode{x3b1}$
-BBO crystal angle in turn and measuring the effect on the electron bunch temporal profile using the TDS measurement. After that, the optimizer iteratively moves each crystal angle to converge on a final temporal profile that approaches the targeted flat-top temporal profile. The mathematical method used by the optimizer is described in Ref. [Reference Boyd and Vandenberghe31]. The figure of merit (FOM) of the algorithm is the difference of the single slice flatness with respect of the average flatness of the entire number of slices. The optimization is typically completed within a few minutes. Figure 24 shows the optimized flat-top electron bunch temporal profile. This method is a powerful tool for automated optimization of the electron bunch properties required for the low-charge, short-pulse mode at SwissFEL[
Reference Ganter
32
].
Following optimization, the charge stability at the injector was recorded for dual-bunch operation near 175 pC per bunch. Figure 25 shows the charge of bunch 1 (black) and bunch 2 (blue) over 3500 seconds. The charge stability is measured to be 1.01% and 1.04% r.m.s., respectively. The electron bunch centroid position was measured with the first beam positioning monitor of the machine over the same duration. The orbit stability is measured to be <5 μm r.m.s. for a typical beam size of 340 μm (diameter FWHM).
3.2 LH commissioning
Microbunching instabilities may be initiated by unwanted intensity modulation of the electron bunch and can be very detrimental to performance at FEL facilities, as the resulting distortion of the bunch phase space strongly deteriorates the FEL intensity. A way to mitigate this instability is through the use of the LH, which smooths the electron bunch by increasing its energy spread in a controlled way. More details about the LH design at SwissFEL are reported in Ref. [Reference Pedrozzi, Calvi, Ischebeck, Reiche, Vicario, Fell and Thompson27].
Here we present measurements of the LH commissioning in order to characterize its effect on the electron bunch downstream of the first compression stage only. In particular, the induced energy spread as a function of the LH laser energy has been measured directly and the uniformity of the heating along the longitudinal coordinate of the bunch was verified.
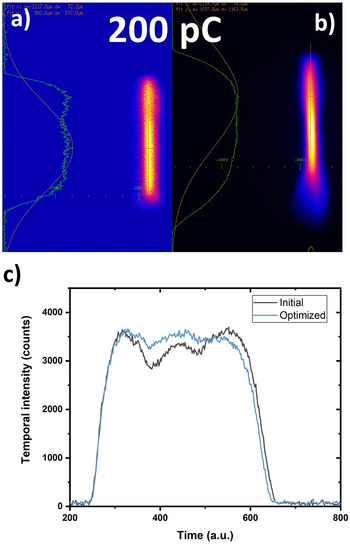
The Cs2Te photocathode was illuminated with a 7.5 ps FWHM-Gaussian laser pulse generating a 200 pC electron bunch. The emitted electron bunch was then propagated to the injector spectrometer located downstream of the first bunch compressor (300 MeV). In the spectrometer, the electron bunch was streaked using the S-band TDS described in Ref. [Reference Craievich, Ischebeck, Löhl, Orlandi and Prat30] and a 2D image of the electron bunch is recorded on a screen, allowing the bunch longitudinal phase space to be retrieved.
The LH laser was aligned onto the electron bunch (in space and time) and the bunch longitudinal phase space was measured at the injector spectrometer. Figure 26 shows the central part (about 1/3 of the full bunch length) along the bunch longitudinal coordinate (top) and the corresponding energy modulation when there is no LH (bottom). Energy modulations due to microbunching are clearly visible. It was verified that they were not artifacts of the measurement setup by repeating it at several bunch compression factors obtained by varying the energy chirp at a fixed R56, however this measurement is not shown here.
The same measurement, with the LH active was performed and the results are shown in Figure 27. It is evident from the comparison with Figure 26 that the structures previously observed in the energy distribution are strongly damped by the LH.
Streaked TDS image of the 200 pC, flat-top electron bunch (a) before and (b) after BBO crystals angle optimization, and (c) projected temporal profile before (black) and after (blue) optimization.

Charge of bunch 1 (black) and bunch 2 (blue) over 3500 s in dual-bunch operation mode.

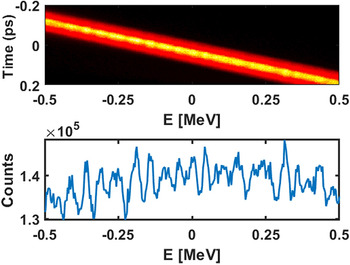
Top: Longitudinal phase space of the bunch core measured at the injector spectrometer. The TDC streaks proportionally the position of the bunch along the vertical direction. The dipole spreads the electrons along the horizontal axis proportionally to their energy. Bottom: Corresponding bunch energy profile. The compression factor is seven.

Top: Longitudinal phase space of the bunch core measured at the injector spectrometer. The TDC streaks proportionally the position of the bunch along the vertical direction. The dipole spreads the electrons along the horizontal axis proportionally to their energy. Bottom: Corresponding bunch energy profile with LH active (red) as a comparison with the profile without LH (blue). The compression factor is seven.

A more quantitative characterization of the effect of the LH on the electron bunch is obtained through measurement of the induced energy spread as a function of the LH laser energy. This measurement was performed on an uncompressed bunch to minimize the bunch slice energy spread, which optimizes the measurement resolution. From the transverse difference in size of the electron bunch in the x dimension σ x , known as the dispersion Dx and the energy of the bunch E 0, the energy spread ΔE can be written as
 \begin{align}\Delta E=\frac{E_0}{D_x}{\sigma}_x.\end{align}
Using the transverse bunch size measured with the LH engaged, σon, and the natural transverse bunch size measured with the LH off, σoff, the parameter σ x is given by
 \begin{align}{\sigma}_x=\sqrt{\sigma_{\mathrm{on}}^2-{\sigma}_{\mathrm{off}}^2}.\end{align}
The dependence of this parameter on the energy delivered to the LH is in qualitative agreement with measurements reported by other facilities, such as LCLS[ Reference Huang, Brachmann, Decker, Ding, Dowell, Emma, Frisch, Gilevich, Hays, Hering, Iverson, Loos, Miahnahri, Nuhn, Ratner, Stupakov, Turner, Welch, White, Wu and Xiang 33 ], Fermi[ Reference Spampinati, Allaria, Badano, Bassanese, Biedron, Castronovo, Craievich, Danailov, Demidovich, De Ninno, Di Mitri, Diviacco, Dal Forno, Ferrari, Fawley, Fröhlich, Gaio, Giannessi, Penco, Serpico, Spezzani, Trovò, Veronese, Milton and Svandrlik 34 ], and PAL[ Reference Lee, Han, Lee, Hong, Kim, Min and Ko 35 ], as shown in Figure 28.
To avoid the possibility that several regions in the bunch have different induced energy spreads, the LH must produce an additional energy spread that is as uniform as possible along the majority of the bunch length. This condition is necessary to efficiently damp the microbunching instability. Figure 29 shows the comparison of the horizontal bunch size, corresponding to the bunch energy spread of the streaked electrons imaged at the spectrometer screen with the laser LH engaged (LH on) and without LH (LH off). We observe that the amount of energy spread induced by the LH is nearly constant along almost the full bunch duration, i.e., the LH produces uniform heating along the bunch.
The LH induces energy spread on the electron bunch consistently to measurements reported by other FEL facilities.
3.3 Two-color FEL by emittance spoiler laser
X-ray pump, X-ray probe experiments employing a two-color FEL are expected to drastically reduce the temporal jitter with respect to standard optical pump X-ray probe scheme, while the two wavelengths can be tuned to excite and to explore different resonances[ Reference Serkez, Decking, Froehlich, Gerasimova, Grünert, Guetg, Huttula, Karabekyan, Koch, Kocharyan, Kot, Kukk, Laksman, Lytaev, Maltezopoulos, Mazza, Meyer, Saldin, Schneidmiller, Scholz, Tomin, Vannoni, Wohlenberg, Yurkov, Zagorodnov and Geloni 36 , Reference Callegari, Grum-Grzhimailo, Ishikawa, Prince, Sansone and Ueda 37 ]. Two-color FEL mode can be achieved by splitting the undulator tuning or by proper manipulation of the electron bunch current. At SPARC and LCLS two-color modes have been demonstrated by using two electron bunches, known as twin bunches, which are accelerated to slightly different energy and therefore emit FEL radiation peaked at two wavelengths[ Reference Ronsivalle, Anania, Bacci, Bellaveglia, Chiadroni, Cianchi, Ciocci, Dattoli, Di Giovenale, Di Pirro, Ferrario, Gatti, Giannessi, Mostacci, Musumeci, Palumbo, Petralia, Petrillo, Pompili, Rau, Rossi, Vaccarezza and Villa 38 , Reference Marinelli, Ratner, Lutman, Turner, Welch, Decker, Loos, Behrens, Gilevich, Miahnahri, Vetter, Maxwell, Ding, Coffee, Wakatsuki and Huang 39 ]. Alternatively, it is also possible to suppress the lasing from the central part of the bunch, using two current spikes[ Reference Bettoni, Prat and Reiche 40 ] or with double-slotted foil within the bunch as an emittance spoiler[ Reference Saa Hernandez, Prat and Reiche 41 ]. These bunch manipulation methods, however, have limited temporal and wavelength tunability. In addition, solid targets that spoil the electron bunch emittance, such as the slotted foil, present the disadvantage of significant radiation losses, preventing their application at high repetition rate X-ray FELs. In general, all the techniques described previously require either precious beam time to implement a complicated electron bunch shaping or an inefficient use of the undulator line, which eventually prevents the application of split-undulator schemes at harder X-rays.
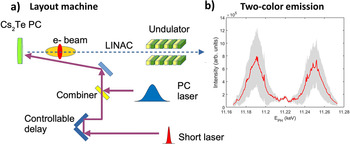
Here, we took advantage of our PCDL configuration to demonstrate a straight-forward method for the generation of a two-color FEL by spoiling the emittance with an additional photocathode laser pulse[ Reference Vicario, Bettoni, Lutman, Dax, Huppert and Trisorio 42 ]. At the photocathode two laser pulses are overlapped in space and time: the nominal photocathode laser and an additional shorter, picosecond pulse. The latter was used to locally increase the charge density and to increase the electron bunch emittance outside the parameter space required for FEL amplification. The emittance increase was preserved throughout the accelerator and in the undulator, effectively preventing FEL emission from the center of the bunch and allowing for two-color FEL emission. The part of the nominal electron bunch that does not overlap with the additional laser spoiler pulse still produces FEL emission, which can be centered at two wavelengths owing to linear energy chirp accumulated along the LINAC. The concept is depicted in Figure 30(a). A short laser pulse (emittance spoiler) was overlapped on the nominal photocathode laser pulse. At low energies, the excess of charge led to a localized increase in the emittance, which reduced and eventually prevented FEL amplification. Figure 30(b) shows the FEL spectrum integrated over 6000 consecutive pulses. The gray areas indicate the statistical distribution of the spectral intensity. The laser emittance spoiler mechanism is particularly efficient for an optimized FEL where most of the electron bunch contributes to the X-ray emission.
Induced energy spread on the bunch core measured at the injector spectrometer as a function of the LH laser energy.

Comparison of the horizontal transverse size along the bunch measured at the injector spectrometer. The natural size is removed according to Equation (2) for the case corresponding to the LH laser engaged (LH on) and turned off (LH off).

(a) Two-color FEL scheme. A short deep-UV laser is overlapped to the nominal PC laser spoiling locally the emittance. The emittance spoil is preserved during the electron acceleration and in the undulators, and this leads to a two-color FEL mode. (b) Two symmetric color FEL spectra recorded over 6000 consecutive shots. The gray area indicates the statistical scattering recorded over 6000 consecutive spectra.

In contrast to other beam-based current reshaping techniques, the present method delivers two-color X-rays using the optimal single-color FEL settings without dedicated accelerator and undulator retuning, thus saving beam time. Importantly, the method is directly applicable to high-average-power FELs and may even enable a type of lock-in detection for increased experimental sensitivity by switching between two-color and standard operation on a shot-to-shot basis. A detailed description of the approach and the experimental results can be found in Ref. [Reference Vicario, Bettoni, Lutman, Dax, Huppert and Trisorio42].
4 Conclusion
In this paper, we have reported on the innovative dual-photocathode laser scheme that has been developed at SwissFEL. The architecture is based on state-of-the-art ytterbium femtosecond laser systems that have proven to be extremely reliable, with a fractional operational readiness of more than 99% over the past 3 years. As reported, the pulse-to-pulse optical performance, timing jitter, and overall stability of the SwissFEL PCDLs are excellent, enabling efficient development of advanced modes of operation. Deep-UV pulse-shaping techniques are successfully implemented to generate temporally tailored Gaussian or flat-top PCDL pulses with variable duration and a flat-top spatial intensity profile. The dual-PCDL architecture was exploited for parallel generation of two electron bunches separated in time by 28 ns with independently controlled properties. The LH and the LH shaping method were successfully commissioned and are expected to be crucial for ultra-short pulse FEL modes in the near future. Finally, a new two-color FEL mode has been demonstrated, which also capitalized on the unique dual-PCDL scheme presented in this paper. Tailoring the SwissFEL electron bunch properties via the PCDL and LH will enable in the future the advent of more advanced FELs such as the generation of single or trains of sub-fs FEL pulses, multi-color FEL, and also the generation of fully coherent X-ray pulses via laser-based seeding.
Acknowledgments
The authors would like to thank Hans-Heinrich Braun, Kurt Bitterli, Helge Brands, Florian Buchi, Paolo Craievith, Chris Deutschendorf, Marta Divall, Eugenio Ferrari, Florian Löhl, Nicole Hiller, Markus Heiniger, Uwe Kolb, Raphael Perrass, Eduard Prat, Sven Reiche, Daniel Treyer, and Didier Voulot for their contributions and support in the technological developments and the machine shifts that have been necessary to perform the work presented in this paper.


 Open access