


Epidemiological studies have consistently shown inverse associations between whole-grain (WG) intake and risk of developing CVD( Reference Aune, Keum and Giovannucci 1 ), type 2 diabetes( Reference Qi, van Dam and Liu 2 ) and colorectal cancer( Reference Kyrø, Skeie and Loft 3 ). WG wheat and rye are the two main sources of WG intake in the Nordic countries( Reference Kyrø, Skeie and Dragsted 4 ). Among cereals, WG rye has the highest content and broadest composition of different dietary fibres( Reference Andersson, Andersson and Piironen 5 – Reference Hansen, Rasmussen and Bach Knudsen 7 ) and phytochemicals( Reference Andersson, Andersson and Piironen 5 , Reference Nurmi, Nyström and Edelmann 8 ). Differences in chemical composition and physiochemical properties between cereals may cause different health outcomes, and it is therefore relevant to study them separately. However, due to difficulties in assessing separate grains accurately in observational studies( Reference Kristal, Peters and Potter 9 , Reference Thompson and Subar 10 ), and because only a few dietary interventions have been conducted with whole grains from different cereals separately, such investigations are currently lacking to a large extent. Specific dietary biomarkers could facilitate such studies and could be used as a complement to conventional dietary assessment in epidemiological studies and to address compliance in dietary interventions( Reference Kristensen, Toubro and Jensen 11 , Reference Ross, Bruce and Blondel-Lubrano 12 ).
Alkylresorcinols (AR) are phenolic lipids mainly present in the bran of wheat and rye in common food items in the Nordic diet( Reference Tłuścik 13 , Reference Kozubek and Tyman 14 ). They are removed during the refining process but remain in WG products. AR are stable during food processing, absorbed mainly in the small intestine and present in a dose–response manner in the plasma of WG wheat and rye consumers( Reference Chen, Ross and Åman 15 ). Thus, AR concentrations in plasma have been evaluated and applied as a biomarker of total WG wheat and rye intake in various epidemiological studies( Reference Chen, Ross and Åman 15 – Reference Kyrø, Olsen and Landberg 17 ), and they are used as a tool to assess and judge compliance in WG intervention studies( Reference Marklund, Magnusdottir and Rosqvist 18 – Reference Ross, Bourgeois and Macharia 20 ). AR in wheat and rye mainly consist of a saturated and straight alkyl chain with an odd number of carbon atoms ranging from 17 to 25 (C17:0 to C25:0) attached to the resorcinol-type phenolic ring. AR C17:0 content is similar to C21:0 content in WG rye, but ten times less abundant in relation to C21:0 content in WG wheat. Thus, the C17:0/C21:0 ratio is associated with relative WG rye intake and has been used to evaluate specific grains in relation to intermediate end points( Reference Chen, Ross and Åman 15 , Reference Linko-Parvinen, Landberg and Tikkanen 21 , Reference Magnusdottir, Landberg and Gunnarsdottir 22 ). Due to its short half-life (5 h), use of plasma AR as a WG biomarker is problematic in populations with low and infrequent WG intake( Reference Aune, Norat and Romundstad 23 ). AR are accumulated and present in adipose tissue, and their concentrations are reported to correlate with WG intake estimated from food records over an intervention of 12 weeks( Reference Wu, Kolehmainen and Mykkanen 24 ) and reported WG bread intake over 1 year, estimated by FFQ( Reference Jansson, Landberg and Kamal-Eldin 25 ). However, no study so far has investigated the contribution of long-term WG wheat and rye intake and non-dietary factors to AR concentrations in adipose tissue among free-living men and women.
Thus, the aim of the present study was to evaluate AR in adipose tissue biopsies as a biomarker of long-term WG wheat and rye intake among free-living men and women. Correlations of AR concentrations in subcutaneous adipose tissue with estimates of long-term WG wheat and rye intakes based on FFQ repeated over a period of 14–17 years and with plasma AR concentrations as well as with non-dietary factors, including BMI, age and sex, were examined.
Methods
Participants
Data and measurements were obtained for women (n 109) and men (n 149) who participated in two clinical sub-studies: the Swedish Mammography Cohort-Clinical (SMC-C) and the Cohort of Swedish Men-Clinical (COSM-C; Fig. 1)( Reference Harris, Håkansson and Olofsson 26 ). Both are clinical sub-studies of two population-based prospective cohorts: the Swedish Mammography Cohort (SMC; clinicaltrials.gov: NCT01127698) and the Cohort of Swedish Men (COSM; clinicaltrials.gov: NCT01127711), respectively. Participants included in the present study were randomly selected among men and women whose subcutaneous adipose tissue samples had previously been thawed and analysed for fatty acid composition, and where more than 10 mg of sample and dietary data were available.
The Swedish Mammography Cohort (SMC) and the Cohort of Swedish Men (COSM), as well as the 109 women and 149 men used in the present study (SMC-C, Swedish Mammography Cohort-Clinical; COSM-C, Cohort of Swedish Men-Clinical)
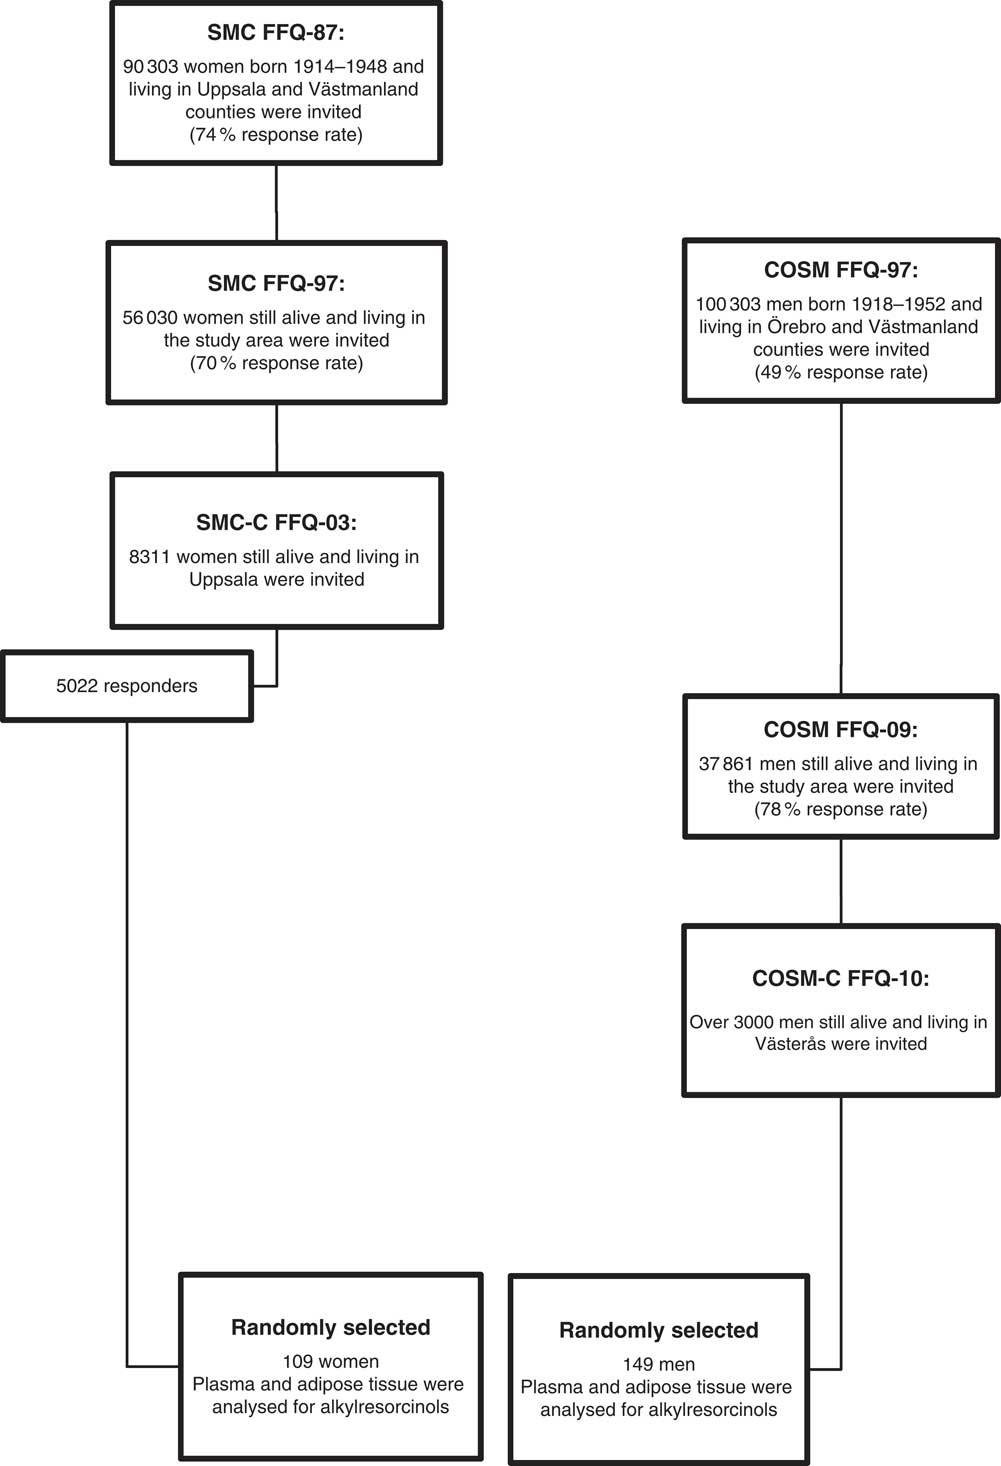
SMC comprises women living in the counties of Västmanland and Uppsala, central Sweden. All women born between 1914 and 1948 were mailed a questionnaire concerning diet (sixty-seven food items), height, weight, education and marital status between 1987 and 1990 (FFQ-87), and the response rate was 74 %. More comprehensive questionnaires on issues including dietary supplements, physical activity and smoking status were sent to all SMC participants who were still alive and residing in the study area during 1997 (FFQ-97)( Reference Wolk, Larsson and Johansson 27 ). Between 2003 and 2009, the SMC women living in Uppsala County were invited to the SMC-C and asked to fill out a 123-item diet and lifestyle questionnaire (FFQ-03) and to undergo a health examination that included: dual energy X-ray absorptiometry scan for estimation of bone density and body fat; recording of body weight, height, blood pressure, and waist and hip circumferences; and collection of adipose tissue biopsies, fasting blood and urine samples (65 % participated). Over a period of 17 years the women filled in three FFQ.
COSM was initiated in 1997 by inviting all men who were born between 1918 and 1952 and lived in the counties of Västmanland and Örebro, central Sweden( Reference Larsson, Giovannucci and Wolk 28 ). Men were asked to fill out a questionnaire on lifestyle, including diet (as in the SMC, FFQ-97). In total, 48 850 of men returned a completed questionnaire. A second FFQ was sent to all COSM members who were still residing in the study area in 2009 (FFQ-09). The COSM-C started in 2010 (ongoing), by inviting men from the COSM who lived in Västmanland County to complete a 132-item FFQ (FFQ-10) and a clinical examination. Over a period of 14 years the men filled in three FFQ.
Dietary intake from FFQ
Data on dietary intake were collected with self-administered semi-quantitative FFQ distributed in 1987, 1997 and 2003 for women and in 1997, 2009 and 2010 for men (FFQ-87, FFQ-97, FFQ-03 and FFQ-97, FFQ-09, FFQ-10, respectively). Questions were asked on predefined frequency of consumption (3/d, 2/d, 1/d, 5–6/week, 3–4/week, 1–2/week, 1–3/month or never) of WG products, including ‘crispbread’, ‘white bread’, ‘whole-meal bread’, ‘porridge’, ‘muesli’, ‘pasta’ and ‘pancake’, during the previous year. The reported frequency of WG food item intake per day was calculated and multiplied by age-specific portion sizes (based on records of scale-weighed portions in 213 women over 4 weeks and in 159 men over 2 weeks distributed over 1 year) in order to estimate the WG product intake (g/d), as described before( Reference Terry, Giovannucci and Michels 29 , Reference Khani, Ye and Terry 30 ). WG product intake was then converted to intakes of total whole grains (TWG), WG wheat (WGW), WG rye (WGR) and the sum of WG rye and wheat (WGR&W), using the mean content of total whole grains, WG wheat and WG rye from corresponding food products listed in the Swedish National Food Composition Database( Reference Bergström, Kylberg and Hagman 31 ).
Long-term WG intakes (intakes of WG products, TWG, WGR&W, WGR and WGW) during the years prior to adipose/plasma biopsy samplings were calculated as follows. For men, the mean of FFQ-09 and FFQ-10, i.e. 2 years prior to biopsy; and the mean of FFQ-97, FFQ-09 and FFQ-10, i.e. 14 years prior to biopsy. For women, the mean of FFQ-97 and FFQ-03, i.e. 7 years prior to biopsy; and the mean of FFQ-87, FFQ-97 and FFQ-03, i.e. 17 years prior to biopsy.
Alkylresorcinols in adipose tissue and plasma
Subcutaneous adipose tissue and venous blood samples were collected after a 12 h overnight fast. The subcutaneous adipose tissue samples were taken from the upper-outer quadrant of a buttock of participants with a needle attached to a vacuum tube and stored at −80 °C prior to analysis. Venous blood samples were collected into EDTA-coated evacuated tubes and centrifuged at 3000 g for 10 min at 4 °C. Plasma samples were aliquoted, protected from light and stored at −80 °C until analysis. AR in plasma (150 μl) and adipose tissue samples (11–14 mg) were analysed with a recently developed GC–MS method( Reference Wierzbicka, Wu and Franek 32 ). The intra- and inter-assay CV estimated by inclusion of a quality control sample (n 4) in every batch were <10 and 15 %, respectively. Plasma samples were missing for nineteen women. Total AR concentrations were calculated as the sum of the individual AR concentrations from C17:0 to C25:0 and evaluated as a biomarker of total WG rye and wheat intake in the diet. AR C17:0/C21:0 ratio was calculated as an indicator of the proportion of WG rye intake to total WG rye and wheat intake of the diet.
Statistical analyses
Selected features of participants from the two cohorts at biopsy were compared using Student’s t test. Concentration biomarkers were skewed and therefore log-transformed when used as dependent variables in statistical models or when comparing means with Student’s t test.
Spearman’s rank correlation coefficients between total AR in adipose tissue or plasma and FFQ-based WG intakes over different time periods were calculated. Variations in WG wheat and rye intake over 14 years and 17 years for men and women, respectively (FFQ-87, FFQ-97 and FFQ-03 for women; FFQ-97, FFQ-09, and FFQ-10 for men), were examined at group level using repeated-measures ANOVA. Intraclass correlations (ICC) using the %icc9 SAS macro( Reference Hertzmark and Spiegelman 33 ) were calculated to assess reproducibility, i.e. intra-individual fluctuation in WG intakes over time. Individual AR homologues in adipose tissue were correlated with WG intakes from single FFQ and compared with corresponding correlation coefficients for AR in plasma (adjusted for sex). Dietary (WGW and WGR from the single FFQ closest to biopsy) and non-dietary determinants (age, sex and BMI) of AR concentrations in adipose tissue or plasma were assessed by two multiple linear regression models. In Model 1, log AR concentration in adipose tissue or plasma was used as dependent variable; WGW and WGR intakes were energy-adjusted (residual method), divided into quartiles, centred by the median values of each quartile for each sex and used as continuous prediction variables. In Model 2, sex, BMI (entered as a continuous variable) and age (entered as a continuous variable) were added to Model 1 as covariates. The statistical software package SAS release 9.4 was used for all statistical analyses and two-sided P<0·05 was considered significant. All statistical analyses were done with missing data excluded.
Results
Characteristics of the 258 participants at the time when adipose tissue and plasma samples were taken (2003 for the women and 2010 for the men) are presented in Table 1. Compared with women, men were older (P<0·001). Total and individual AR homologue concentrations in adipose tissue were significantly higher (P<0·05) among men compared with women, whereas BMI, total and individual AR in plasma, and AR C17:0/C21:0 ratio in adipose tissue or plasma did not differ significantly between men and women.
Characteristics of the sub-sample of men (n 149) from the Cohort of Swedish Men-Clinical (COSM-C) in 2010 and women (n 109) from the Swedish Mammography Cohort-Clinical (SMC-C) in 2003 included in the present study
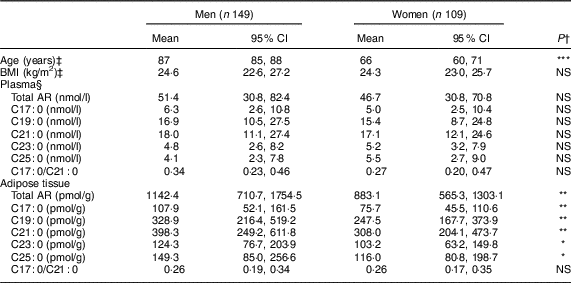
AR, alkylresorcinol.
*P<0·05, **P<0·01, ***P<0·001.
† Student’s t test was used to compare means between men and women. AR concentrations were log-transformed prior to Student’s t test.
‡ Variables were obtained or calculated from a 132-item FFQ for men (COSM-C) in 2010 and a 123-item FFQ for women (SMC-C) in 2003.
§ Plasma samples were missing for nineteen women.
The mean intakes of WG rye and wheat and their ICC are shown in Table 2. FFQ-based WG intakes and energy intake did not differ significantly between FFQ-97, FFQ-09 and FFQ-10 among men, while women reported higher WG intakes and lower energy intake in FFQ-87 than in FFQ-97 or FFQ-03. Modest ICC were found for intake of WG products (ICC=0·24–0·52), TWG (ICC=0·36–0·54), WGR (ICC=0·30–0·53), WGR&W (ICC=0·25–0·47) and energy (ICC=0·31–0·53) for both sexes. ICC of WGW were modest between FFQ-97 and FFQ-03 among women (ICC=0·47) but poor between FFQ-87 and FFQ-97 among women (ICC=0·18) as well as between all FFQ among men (ICC=0·10–0·28).
FFQ-based whole-grain (WG) and energy intakes, as well as intraclass correlations (ICC) between different FFQFootnote †, among free-living Swedish men (n 149) and women (n 109)
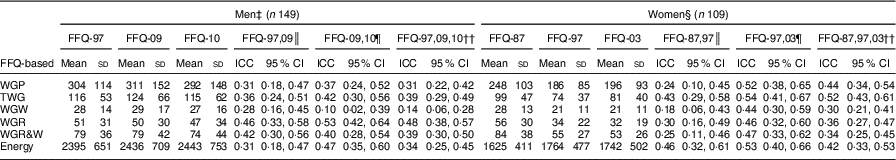
† Daily WG intake (g/d), including WG products (WGP), total whole grains (TWG), WG wheat (WGW), WG rye (WGR), and WG rye and wheat (WGR&W), and energy (kcal/d). All WG intakes among men in FFQ-10 were significantly higher (Student’s t test, P<0·001) than among women in FFQ-03.
‡ WGP, TWG, WGW, WGR, WGR&W and energy intakes in FFQ-97, FFQ-09 and FFQ-10 were not significantly different.
§ WGP, TWG, WGW, WGR and WGR&W intakes in FFQ-87 were higher than corresponding intakes in FFQ-97 or FFQ-03, while energy intake in FFQ-87 was lower than in FFQ-97 or FFQ-03.
║ Intraclass correlation between intakes from FFQ in 1997 and 2009 for men; 1987 and 1997 for women.
¶ Intraclass correlation between intakes from FFQ in 2009 and 2010 for men; 1997 and 2003 for women.
†† Intraclass correlation between intakes from FFQ in 1997, 2009 and 2010 for men; 1987, 1997 and 2003 for women.
In general, total AR concentration in adipose tissue was modestly to well correlated with WG intakes over a period of 14 years in men and 17 years in women (Table 3). Associations were overall stronger when mean intakes over longer time periods, rather than intakes from the single FFQ closest to sampling, were correlated with total AR concentration. Moreover, correlations were weaker for WGR and plasma AR when using WG intakes more distant from the blood sampling occasion. The correlations were also stronger for women than for men. Notably, TWG and WGR&W were more strongly correlated with AR in adipose tissue than was WG products, for both men and women. Similar findings were observed for WG intakes and plasma AR concentration, except for WGW, which was not correlated with plasma AR among men.
Correlations between FFQ-based whole-grain (WG) intakes and total alkylresorcinol (AR) concentrations in adipose tissue or plasma over 1, 2 or 14 years among free-living Swedish men (n 149) and over 1, 7 or 17 years among free-living Swedish women (n 109)Footnote †
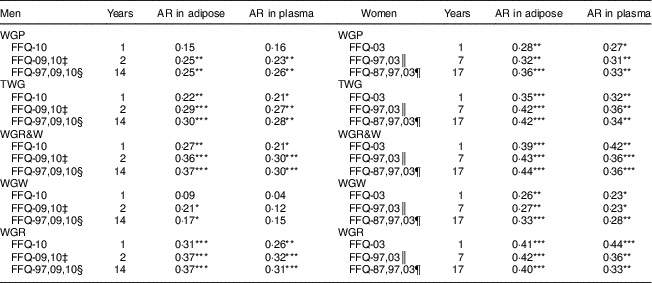
WGP, WG products; TWG, total whole grains; WGR&W, WG rye and wheat; WGW, WG wheat; WGR, WG rye.
*P<0·05, **P<0·01, ***P<0·001.
† Plasma samples were missing for nineteen women.
‡ Mean WG wheat or rye intake from FFQ in 2009 and 2010.
§ Mean WG wheat or rye intake from FFQ in 1997, 2009 and 2010.
║ Mean WG wheat or rye intake from FFQ in 1997 and 2003.
¶ Mean WG wheat or rye intake from FFQ in 1987, 1997 and 2003.
Individual AR homologue concentrations, especially shorter homologues, were significantly correlated with WG wheat and/or rye intakes from single FFQ, with correlation coefficient: WGR>WGR&W>WGW (Table 4). However, WGW was not associated with AR C21:0 in adipose tissue or with AR C19:0, C21:0, C23:0 or C25:0 in plasma. Overall, correlations for AR homologues in adipose tissue and plasma were stronger for shorter homologues than for longer homologues.
Spearman’s rank correlation coefficients between intakes of whole-grain (WG) wheat (WGW), WG rye (WGR) and WG rye and wheat (WGR&W) from the FFQ closest to the sample draw/aspiration (FFQ-10 for men and FFQ-03 for women) and alkylresorcinol (AR) concentrations in plasma or adipose tissue among free-living Swedish men (n 149) and women (n 109)Footnote †
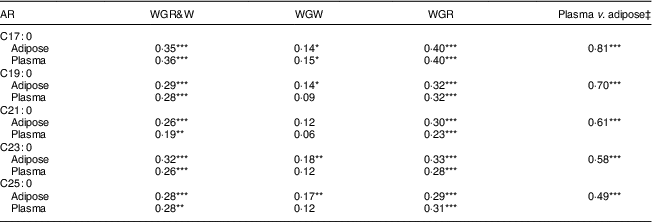
WGW and WGR were calculated from FFQ by multiplying the frequency of intake of every WG-containing item by its specific portion size and WG content (WG wheat content for WGW; and WG rye content for WGR); WGR&W was the sum of WGW and WGR.
*P<0·05, **P<0·01, ***P<0·001.
† n 239 for AR concentration in plasma; plasma samples were missing for nineteen women.
‡ The correlation coefficients between AR concentrations.
On examining potential determinants, it was found that energy-adjusted WGR was significantly associated with total AR concentration in adipose tissue in Model 1 and Model 2 (P<0·001) (Table 5). Total AR in adipose tissue increased by approximately 12 % per 10 g increment in daily energy-adjusted WGR intake (P<0·001). For women, total AR concentration in adipose tissue was approximately 61 % lower than for men (P<0·05) under similar energy-adjusted WGR and WGW intake and further adjusting for BMI and age in Model 2 (Table 5). In the present study, age, BMI or WGW did not appear to be a significant determinant of AR concentration in adipose tissue in models with both sexes (Table 5) and stratified by sex (data not shown). Total AR concentration in plasma was associated only with energy-adjusted WGR (about 11 % per 10 g increment, P<0·001) and not with WGW, sex, age or BMI.
Intakes of whole-grain (WG) wheat (WGW), WG rye (WGR) and non-dietary determinants of total alkylresorcinol (AR) concentration in adipose tissue and plasma among free-living Swedish men (n 149) and women (n 109)Footnote †
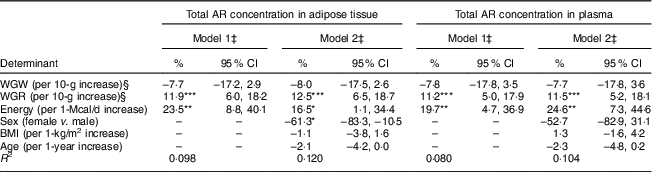
WGW and WGR were calculated from FFQ by multiplying the frequency of intake of every WG-containing item by its specific portion size and WG content (WG wheat content for WGW; WG rye content for WGR). Estimated effects (95 % CI) were calculated using general linear models with log-transformed total AR concentration as dependent variable.
*P<0·05, **P<0·01 ***P<0·001.
† Plasma samples were missing for nineteen women.
‡ Model 1 included energy-adjusted dietary determinants (with the residual method) and total energy intake as dependent variables; Model 2 included energy-adjusted dietary determinants (with the residual method), sex, age, BMI and total energy intake as dependent variables.
§ WGW and WGR were calculated from FFQ-10 for men and FFQ-03 for women.
Discussion
In the present study, we evaluated AR concentrations in adipose tissue as a long-term biomarker of WG rye and wheat intake by correlating intake data derived from repeated FFQ over 14 years (for men) or 17 years (for women) with AR concentrations in adipose tissue biopsies in free-living Swedish men and women. We also compared correlations with plasma AR concentrations.
Intakes of WG products, TWG, WGR and WGW were more than twice as high as reported for Swedish men and women in a previous Nordic study( Reference Kyrø, Skeie and Dragsted 4 ). This may be due to the participants being older than in the previous study, since higher age has been associated with higher intake of WG products( Reference Sandvik 34 ). The higher intake may also be due to inclusion of more food categories in the present study and because some products in these food categories contained WG wheat and/or rye, according to the Swedish National Food Composition Database. Except for FFQ-87 among women, participants in the present study reported relatively stable intakes of WG products, TWG, WGR and WGR&W across repeated FFQ, which is in agreement with reported intake of cereal fibre on occasions 1 year apart among SMC participants( Reference Khani, Ye and Terry 30 ) and of cereal fibre intake over a 4-year period among premenopausal US women (ICC≈0·50)( Reference Landberg, Townsend and Neelakantan 35 ). Higher intake of WG in FFQ-87 than FFQ-97 or FFQ-03 among female participants might have led to the poor ICC of WG intakes found between FFQ-87 and FFQ-97.
The AR concentrations in adipose tissue were similar to those reported in a previous study in Swedish women( Reference Jansson, Landberg and Kamal-Eldin 25 ) and in a Finnish intervention study including men and women( Reference Wu, Kolehmainen and Mykkanen 24 ). Plasma AR concentrations were within the range of what has been previously reported in other Nordic studies( Reference Landberg, Kamal-Eldin and Andersson 19 , Reference McKeown, Marklund and Ma 36 – Reference Kyrø, Olsen and Skeie 42 ). Plasma AR C17:0/C21:0 ratio was about 0·1 or more than 0·6 in subjects who mainly consumed WG wheat or WG rye, respectively( Reference Linko-Parvinen, Landberg and Tikkanen 21 , Reference Kyrø, Olsen and Skeie 42 – Reference Landberg 44 ). In the present study, AR C17:0/C21:0 ratios in adipose tissue and plasma were about 0·3, which is in agreement with a previous Swedish study( Reference Landberg, Kamal-Eldin and Andersson 45 ). Modest AR C17:0/C21:0 ratio suggests that both WG rye and WG wheat are included in the habitual diet of the participants, which agrees with the reported WGR and WGW from the FFQ.
TWG and WGR&W were more strongly correlated with AR in adipose tissue than was WG product intake, showing the advantage of deriving WG intakes instead of just using WG product intake as a proxy. A reason for the weaker correlations for WG product intake may also be the inclusion of ‘white bread’ in this category due to the presence of whole grains in several breads that fall into this category. This may have contributed to misclassification of the WG product intake, since most ‘white bread’ contains only minor amounts of whole grains. Correlation coefficients for WGR&W were not stronger than for TWG, which also includes WG oats with no AR. This could be due to low overall intake of WG oats and a lack of precision in estimating WG wheat. The strongest correlations were observed for WGR, probably due to the main source being crispbread (contributing 67–74 % of WGR), for which intake was stable (ICC=0·37–0·56). In contrast, the correlation between WGW and AR in adipose tissue was weak probably because WGW was derived mainly from whole-meal bread and pasta (contributing 58–73 % of WGW), for which the intakes were unstable (ICC=0·01–0·28). A reduction in random measurement error when using the mean of repeated FFQ instead of a single FFQ resulted in stronger correlations between intakes and AR in adipose tissue, despite including intakes over longer periods. This is in line with findings of a correlation between fatty acid intakes in repeated FFQ and corresponding fatty acids in erythrocytes( Reference Sun, Ma and Campos 46 ). Although the time interval between repeated FFQ was longer for women than for men, correlations between WG intakes and AR in adipose tissue were overall stronger for women, suggesting more accurate intake reporting of WG intakes and/or more stable intakes among women than men.
Among non-dietary determinants, age has in previous studies been suggested to be associated with higher plasma AR concentrations( Reference Ross, Bourgeois and Macharia 20 , Reference Landberg, Åman and Hallmans 47 ). Moreover, age has been shown to affect age-related central fat accumulation of some lipophilic compounds such as vitamin D in response to intake in elderly subjects( Reference Mazahery and von Hurst 48 , Reference Toth and Tchernof 49 ). However, we found that neither adipose tissue/plasma AR concentration nor body fat content measured with dual-energy X-ray absorptiometry (data not shown) was associated with age in the present study. One reason could be that the present study subjects were older and that the age range was rather narrower than in previous studies.
Sex has been shown to affect plasma AR concentration with higher concentrations in men than in women( Reference Ross, Bourgeois and Macharia 20 , Reference Montonen, Landberg and Kamal-Eldin 50 ), but this was not observed in the present study. However, adipose tissue biopsies from men contained significantly higher AR concentrations than those from women after adjusting for differences in WG intake. This strongly suggests sex-related differences in AR accumulation in adipose tissue and should be taken into account if using AR in adipose tissue as a biomarker. AR are believed to be metabolized similarly to γ-tocopherol( Reference Ross, Chen and Frank 51 ), which is cleared faster and leads to lower accumulation in women than in men( Reference Frank, Lee and Leonard 52 ). However, this was not supported by any differences in plasma AR concentrations between men and women in the present study. The adipose tissue AR concentration was lower among women, which suggests that the lower AR concentrations in adipose tissue could be due to mechanisms unrelated to plasma AR concentrations. Women, particularly postmenopausal women, usually have a larger body pool of fat than men( Reference Ley, Lees and Stevenson 53 ). A larger volume of distribution could explain the lower AR adipose tissue concentrations in women. Unfortunately, we did not have dual-energy X-ray absorptiometry measurements for men and therefore could not investigate whether this was the reason.
Because of longer anticipated turnover rate of AR in adipose tissue, we expected stronger correlations between long-term WG intake assessed by FFQ and AR in adipose tissue than for plasma( Reference Wu, Kolehmainen and Mykkanen 24 , Reference Strawford, Antelo and Christiansen 54 ). The finding that AR in adipose tissue correlated similarly as AR in plasma with estimated long-term WG wheat and rye intake could be due to regular and frequent WG consumption in the present population (Table 1). Under such conditions, plasma AR concentration also reflects long-term intake, as shown in previous studies on Swedish populations( Reference Andersson, Marklund and Diana 39 , Reference Landberg, Åman and Hallmans 47 ). Average WGR&W intakes from repeated FFQ were better correlated with AR in adipose tissue, but more weakly correlated with AR in plasma. This suggests that AR in plasma might be more prone to being affected by recent WG intake, although the difference was small. The fact that AR concentrations in adipose tissue and plasma were more weakly correlated with FFQ-based WG intake (r=0·22–0·42; Table 3) than with previously reported WG intake estimated with food records (r=0·60–0·72)( Reference Wu, Kolehmainen and Mykkanen 24 ) suggests that FFQ-based WG intake contains larger measurement errors, which might mask the potential difference between AR in adipose tissue and in plasma as a biomarker of long-term WG rye and wheat intake. Another possible reason is that AR in fasting plasma may to a large extent reflect AR liberated from the adipose tissue pool and longer homologues may be liberated to a lower extent than shorter homologues (Table 4), as reported for fatty acids( Reference Halliwell, Fielding and Samra 55 ).
Our study has several limitations. First, potential differences in performance of AR in adipose tissue and plasma may have been more easily detectable by comparing their correlations with estimated intake in a population with low and infrequent WG intake and using repeated biopsies. However, studies with such sampling are scarce. Second, misclassification of WG rye and WG wheat intake, particularly the latter, due to large variation of WG content in food products, is likely to be the reason for the poor correlations to adipose tissue AR concentrations, particularly for WG wheat( Reference Bergström, Kylberg and Hagman 31 ). Third, we lacked dual-energy X-ray absorptiometry data for men and therefore could not test the hypothesis that lower concentrations of AR in adipose tissue among women are due to large distribution volume. Fourth, since the adipose tissue available was scarce, the sample size of the present study was relatively small, thus results should be interpreted with caution.
The present study also has several strengths. First, we monitored intake of WG food products and calculated WG wheat and WG rye intakes over a long period, 14 years in men and 17 years in women, with repeated FFQ. Second, WG intake range in the current population was broad and diverse, which made it suitable for the present purposes. Moreover, we evaluated AR in adipose tissue as a long-term biomarker of WG wheat and rye intake in comparison with other exposure measurements, i.e. FFQ-derived WG intakes and plasma AR concentrations.
In summary, we found that AR in adipose tissue appears to be promising as a long-term dietary biomarker of WG rye intake, after adjusting for differences in sex. The lack of correlation between WG wheat and AR concentration is most likely due to large-scale misclassification of WG wheat intake by FFQ, errors inherent in the large variation in WG content in WGW products, combined with few questions in the FFQ and the fact that WG wheat contains much lower amounts of AR than WG rye( Reference Menzel, Kamal-Eldin and Marklund 56 ). Future studies should evaluate AR in adipose tissue as a long-term biomarker of WG wheat and rye intake in populations with more irregular WG intake.
Acknowledgements
Acknowledgements: The authors are grateful to Janicka Nilsson, Emma Myhré Herelius and Elisabeth Sekli, who assisted with AR analysis in plasma and adipose tissue. Financial support: This work was supported by the Swedish Research Council for Environment, Agricultural Sciences and Spatial Planning (FORMAS, 2011-520) and the Swedish Research Council – Medicine. The funders had no role in the design, analysis or writing of this article. Conflict of interest: None of the other authors declare any conflict of interest. Authorship: H.W. planned and conducted the study, including the analysis of AR in adipose tissue and plasma, derived WG intakes from dietary data, conducted the statistical analysis, and drafted the paper; N.A.M.O. and N.H. contributed to the analysis of dietary data, statistical analysis and drafting of the manuscript; A.W. and K.M. designed the cohorts, provided data and samples, and supervised the data interpretation and manuscript preparation; R.L. conceived the study and supervised analysis of samples and data, as well as manuscript preparation. All authors were involved in data interpretation and manuscript preparation. Ethics of human subject participation: This study was conducted according to the guidelines laid down in the Declaration of Helsinki and all procedures involving human subjects were approved by the Regional Ethical Review Board in Stockholm. Written informed consent was obtained from all subjects.


