


INTRODUCTION
How do the subordinate few persuade the dominant many? The question is central to understanding how statistical minorities overcome (or succumb to) the tyranny of the majority, especially when the cleavages cut across deeply entrenched national, racial, religious, and ethnic lines. Democratic theory argues that marginalized subgroups within majoritarian polities should pursue winning coalitions. Elite theorists of influence, however, find that average citizens and mass interest groups exert minimal power (Carmines and Stimson Reference Carmines and Stimson1989; Lenz Reference Lenz2013; Mills Reference Mills1956; Schattschneider Reference Schattschneider1960; Zaller Reference Zaller1992). Looking at effects on United States government policy, Gilens and Page (Reference Gilens and Page2014) find “mass-based interest groups and average citizens have little or no independent influence” (565). More pluralistic accounts of democratic politics find mass-based factions or interest groups can effectively represent their constituencies (Bishin Reference Bishin2009; Dahl Reference Dahl1961; Gillion Reference Gillion2012, Reference Gillion2013; Lee Reference Lee2002; Luders Reference Luders2010; Truman Reference Truman1951). Lee (Reference Lee2002), for example, challenges the model of a “one-way, top-down flow of political communication from elites on center stage to spectators in the audience” and finds that, at times, “oppositional counterpublics” of non-elite actors can shape mass opinion (18–9).
Evidence of “leading from below,” in which subordinate group activists overcome inequalities through collective action, such as via strikes, or with more solitary tactics, like self-immolation, has been documented by scholars in a variety of fields studying pluralism, political communication, and social movements (cf., Biggs Reference Biggs and Gambetta2005; Gamson Reference Gamson1975; Luders Reference Luders2010; Scott Reference Scott2008; Stephan and Chenoweth Reference Stephan and Chenoweth2008). Here, I propose the concept of agenda seeding to describe the way activists attempt to influence public opinion and politics by pushing issues onto news agendas and staging events that influence the valence of media coverage. I also propose and test a model of agenda seeding in the context of subordinate groups who are assumed to operate under constraints such as discriminatory laws, higher rates of poverty, and media that exhibit systematic bias (Davenport Reference Davenport2007). To overcome these barriers, marginal groups use disruptive tactics like protests to attract coverage and elevate their agendas in the public consciousness (Andrews and Edwards Reference Andrews and Edwards2004; Gamson and Wolfsfeld Reference Gamson and Wolfsfeld1993; Gillion Reference Gillion2013; Gitlin Reference Gitlin1980; Lee Reference Lee2002; Mazumder Reference Mazumder2018; McCombs and Shaw Reference McCombs and Shaw1972; Sears and McConahay Reference Sears and McConahay1973).
The model predicts that subordinate group protest strategies play a critical role in determining how minority concerns are framed by the majority-oriented press (Stephan and Chenoweth Reference Stephan and Chenoweth2008). Strategies that try to appeal to persuadable members of the majority, like nonviolent civil disobedience, are expected, on average, to generate more sympathetic coverage of subordinate group claims. The model also predicts a conditional effect of violence on media coverage. When peaceful protesters are the object of state or vigilante violence, mainstream media are expected to use issue frames that are especially effective for activists. Conversely, when subordinate group activists fight repression more forcefully, such as through violent resistance, media coverage is predicted to focus on dominant group concerns about order and sustaining the status quo social hierarchy. The effect of this minority-initiated agenda seeding influences whether elites, the mass public, and voters shift in favor of, or in opposition to, the political coalition more aligned with the subordinate group.
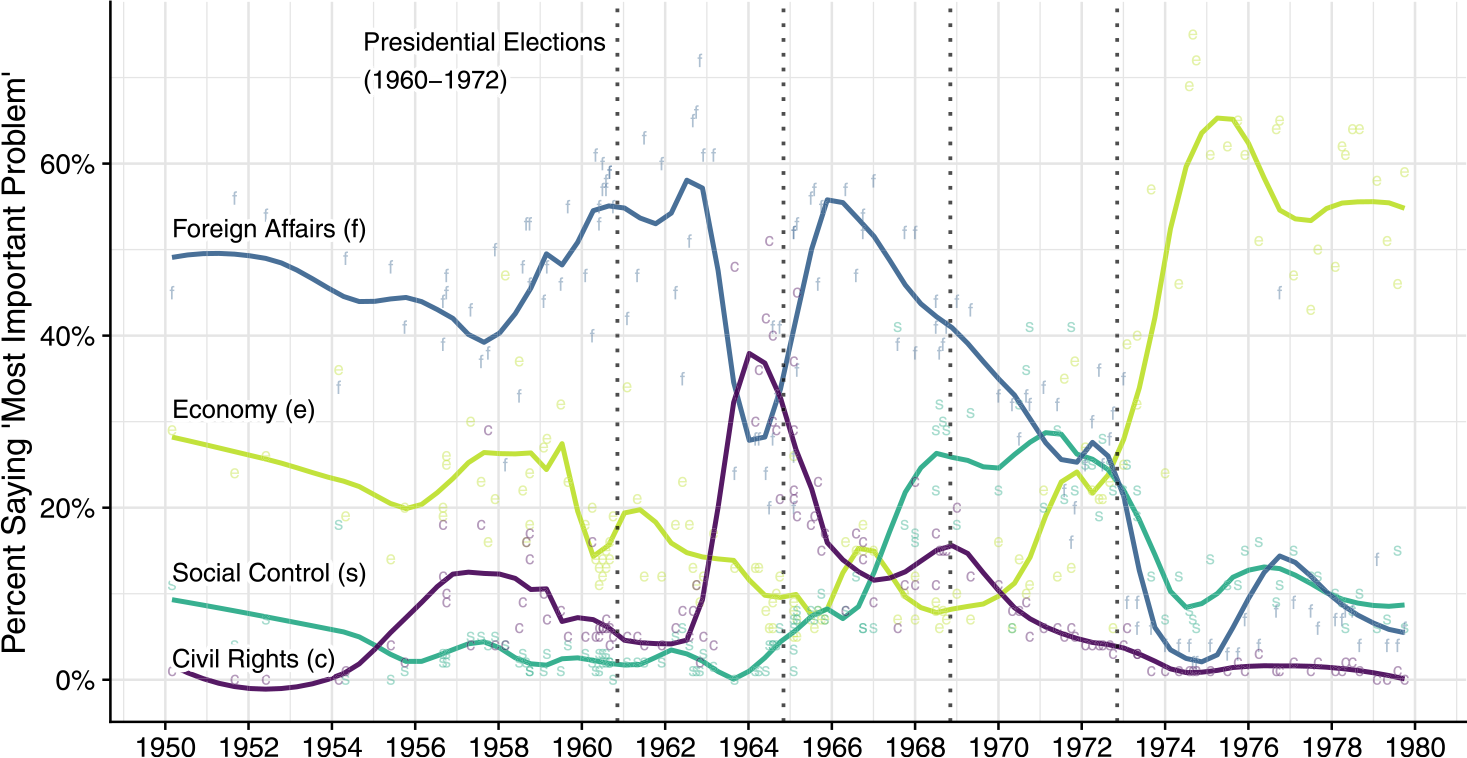
The United States in the 1960s and early 1970s offers a useful context in which to test competing elite and pluralistic models of public opinion and policy making. In that period, racial attitudes shifted dramatically on a range of issues (see Figure 1). At the same time, grassroots activists mobilized at a scale rarely before seen and elite political actors pushed for both landmark civil rights legislation and new forms of social control (Carmines and Stimson Reference Carmines and Stimson1989). Using a range of methods, I exploit fine-grained temporal and geographic variation in black-led protest activity to estimate effects on media and politics. Examining the relationship between protest activity and news coverage, congressional speech, public opinion, and county-level voting patterns, I find results consistent with the hypothesis that black-led protests during the 1960s are independently influencing media, elite discourse, mass white attitudes, and voting behavior. Further, I find that the types of protest tactics employed produce distinct reactions. Nonviolent black-led protests played a critical role in tilting the national political agenda toward civil rights and black-led resistance that included protester-initiated violence contributed to outcomes directly in opposition to the policy preferences of the protesters.Footnote 1
Public Opinion on the “Most Important Problem,” 1950 to 1979
Note: Scatter plot uses loess-smoothed trend lines. Each letter represents the percentage of people answering that a particular issue is the most important problem in America in a single poll. Data sources: Loo and Grimes (Reference Loo and Grimes2004) and Niemi, Mueller, and Smith (Reference Niemi, Mueller and Smith1989).
This analysis improves on the existing literature in a number of ways. First, in the 1960s, important variation in public opinion, news coverage, elite discourse, and voting, particularly about social control, is poorly explained by both elite-oriented and protest-focused theories of politics. I show that a focus on non-elite activists in conjunction with their choices of tactics better explains much of this variation. Second, among the most important choices made by activists is whether to adopt nonviolent or violent methods of resistance. Most prior work in American politics, however, has investigated effects of nonviolent or violent protest movements either in isolation or in combination without drawing meaningful distinctions between the two categories. In line with work in comparative politics and sociology, this study contrasts effects of protester-initiated tactics with particular attention to the multiple ways violence influences media coverage and voting behavior. Third, the mechanisms by which subordinate groups might influence political communication are often hypothesized without being directly tested. Lohmann (Reference Lohmann1993), for example, presents a game theoretic signaling model in which mass political action conveys information to political leaders but the signal is communicated without any reference to media. I show empirically that disruption seeds mainstream news agendas and that tactics influence the types of issue frames adopted by media. Fourth, most prior literature aggregates data by year and state or country obscuring substantial within-year and within-region variation. I use day-, week- and month-level time series and county-level geographical units to better identify causal effects of subordinate group protest movements. Finally, endogeneity is an issue for much of the prior literature. I apply Granger causality tests, a panel design with county fixed effects, placebo tests, and rainfall as an instrument for violent protest activity to plausibly identify causal effects of subordinate group mobilization.
WHAT EXPLAINS TEMPORAL AND GEOGRAPHIC VARIATION ON ISSUES OF RACE IN THE 1960S?
Figure 1 presents data on what Americans, when surveyed, indicated was the “most important problem” facing the country between 1950 and 1980.Footnote 2 Looking at issues of race, two trends are noteworthy. First, from 1950 into the early 1960s, the percentage of Americans responding that civil rights was the most important problem remained low. In the early 1960s, however, it spiked from approximately five percent in December 1962 to 48% in mid-1963 and then faded almost as quickly. Second, up until the mid-to-late 1960s, concern about “social control” as the most important problem remained in the single digits and then gripped the country to reach an initial peak of about 41% of respondents in August 1967 before declining rapidly after 1971.Footnote 3
The rapidly shifting attitudes observed in polls were also evident in swings in white voting behavior. In 1964, Republican presidential candidate Barry Goldwater promised “law and order” against “crime in the streets” but lost in a blowout to President Johnson, a champion of civil rights (Flamm Reference Flamm2005). By 1968, though, the tide had turned and Republican presidential candidate Richard Nixon successfully marshaled a “tough on crime” campaign to help win the White House. “Law and order” rhetoric had been popular in the South for decades (Finkelman Reference Finkelman1993; Murakawa Reference Murakawa, Lowndes, Novkov and Warren2008). It was not until the mid-1960s, however, that the slogan took root outside the old Confederacy. In 1966, for example, Ronald Reagan echoed Goldwater and ran on “law and order” to win the California gubernatorial race (Flamm Reference Flamm2005). In short, the 1960s saw rapid temporal and geographic variation in white concern for race-related policy, first with civil rights and later with the rise of a national coalition championing “tough on crime” policies.
ELITE AND PLURALISTIC THEORIES OF INFLUENCE
Whether this variation in elite discourse, public opinion, and voting behavior is better explained by theories emphasizing the role of elite actors or mass movements is unresolved. Fields like history and sociology often attribute a central role to activists but the consensus view in political science is elites dominate mass opinion (Iyengar and Kinder Reference Iyengar and Kinder1987; Lee Reference Lee2002; Lenz Reference Lenz2013; Zaller Reference Zaller1992). Through media, political elites influence what issues are top of mind, how issues are framed, and which stories are most prominently covered (Baumgartner and Jones Reference Baumgartner and Jones2010; Iyengar and Kinder Reference Iyengar and Kinder1987). Carmines and Stimson (Reference Carmines and Stimson1989), Weaver (Reference Weaver2007), and Zaller (Reference Zaller1992) emphasize the role of presidents and presidential candidates like Johnson and Goldwater in driving the public taste for civil rights and “law and order.” Figure 1, however, presents no evidence that trends in public opinion on civil rights and “social control” are shifting appreciably before the four presidential elections between 1960 and 1972 (see dotted vertical lines).
More pluralistic models provide evidence of lateral or bottom-up influences on policy makers and public opinion (Enos, Kaufman, and Sands Reference Enos, Kaufman and Sands2019; Gillion Reference Gillion2013; Lee Reference Lee2002; Luders Reference Luders2010; Mazumder Reference Mazumder2018; Wallace, Zepeda-Millán, and Jones-Correa Reference Wallace, Zepeda-Millán and Jones-Correa2014; Williamson, Skocpol, and Coggin Reference Williamson, Skocpol and Coggin2011). Lee (Reference Lee2002) builds on Dawson (Reference Dawson1994) and Key (Reference Key1949) to posit a theory of political communication in which elites remain influential but that also allows for “activated mass opinion,” in which non-elite counterpublics, in times of social and political contestation, serve as wellsprings of influence on mass opinion. However, Lee only investigates nonviolent protests, and therefore, neither models nor estimates differential effects of nonviolent versus violent protest. Gillion (Reference Gillion2012, Reference Gillion2013) and Gillion and Soule (Reference Gillion and Soule2018) show protests serve as an “informative cue” to Congress, presidents, the Supreme Court, and voters. These works offer compelling evidence that violence serves as a kind of signal amplifier but also do not model possible differential effects of violence. These studies contribute to our understanding of the changes in public opinion and legislative activity on civil rights in Figure 1 but offer limited insight into the possible relationship between protester-initiated violence and trends in public demand for social control. In addition, these studies attribute a central role to media, but the theory and evidence are underdeveloped. Lee, for example, documents year-level correlations between movement activism, New York Times coverage, and citizen letter writing but notes a more thorough examination is beyond the scope of the book.
Cloward and Piven (Reference Cloward and Piven1971) propose an “insurgency thesis” in which mass unrest induces concessions from elite actors attempting to buy off a movement. Empirical tests of the hypothesis have been contradictory. Some work finds evidence in favor of disruption increasing benefits. Gamson (Reference Gamson1975) finds “unruly groups” deploying violence are more successful, as compared with nonviolent groups but, critically, suggests this dynamic might only work in cases wherein “public sentiment neutralizes the normal deviance of the action” (88). Luders (Reference Luders2010) explains variation, particularly in local movement success, through the different types of costs imposed on protest targets, such as businesses and politicians. Other scholars find that political elites responded to the civil unrest through increased investments in social policy and other redistributive policies (Fording Reference Fording1997, Reference Fording2001; Hicks and Swank Reference Hicks and Swank1983). Fording (Reference Fording1997) finds that, under specific conditions, political violence by African Americans led to greater spending on Aid to Families with Dependent Children. Similarly, Skrentny (Reference Skrentny1996) finds that the sense of crisis following violent unrest helped shift white elites in business and politics to support programs like affirmative action. Enos, Kaufman, and Sands (Reference Enos, Kaufman and Sands2019) find violent protest in Los Angeles mobilized a subset of voters and caused a liberal shift in favor of certain education ballot initiatives. Other work points out significant methodological problems in prior research or finds no effect (Albritton Reference Albritton1979; Fording Reference Fording1997). More broadly, due to the focus on violent protest and elite responses, tests of the “insurgency thesis” offer little insight into effects of nonviolent disruption or how protest movements influence mass opinion (e.g., Figure 1) and voting behavior. Also, both Cloward and Piven (Reference Cloward and Piven1971) and Gamson (Reference Gamson1975) published in the first half of the 1970s (with Gamson’s study ending in 1945), precluding significant engagement with how the new mass medium of television might change potential costs and benefits of violent resistance.
Where the “insurgency thesis” suggests states respond with “carrots,” other work finds governments wield “sticks” in which efforts at repression may trump or complement those of redistribution (Button Reference Button1978). A number of studies find evidence that protests and civil disorders were associated with enhanced expenditures on policing and efforts at coercive control (Button Reference Button1978; Feagin and Hahn Reference Feagin and Hahn1973; Fording Reference Fording2001; Sears and McConahay Reference Sears and McConahay1973; Welch Reference Welch1975). More recent work also finds little independent effect of unrest on repression outside strategic use by elites (Weaver Reference Weaver2007). As with evaluations of the “insurgency thesis,” these studies tend to focus on effects of violent protests or emphasize elite responses and, as a result, fail to capture effects of nonviolent resistance or mass public reactions in opinion or voting.
Work in comparative politics and sociology is more attentive to differential effects of protest tactics, particularly with regard to the interaction between tactics and coalition formation. Rojas (Reference Rojas2006) finds the effectiveness of black-led protests in higher education depends on the level of disruption, with more disruptive protests inhibiting campus administration allies from supporting the movement agenda. Looking cross-nationally at social movements, Stephan and Chenoweth (Reference Stephan and Chenoweth2008) find that violent campaigns are successful about 26% of the time, whereas nonviolent efforts succeed about 53% of the time by maintaining legitimacy, attracting broad-based participation and co-opting potential opponents. Although the theory and evidence are attentive to the role of protest tactics in electoral politics, due to limitations of the data the study cannot test within-country variation in the reactions to those campaigns. Wilkinson (Reference Wilkinson2004) investigates violent interethnic protests in India and finds electoral incentives for mono-ethnic versus multi-ethnic coalitions play a significant role in determining whether politicians gin up or attempt to thwart emerging conflicts. Although Wilkinson applies the model to majority-led white-on-black race riots in the United States between Reconstruction and the 1950s, the work does not address how the model applies to minority-led nonviolent and violent protests of the 1960s and 1970s.
An interdisciplinary literature in history and American political development traces the partisan realignment on issues of race and finds evidence that, as early as the 1940s, Democrats were becoming the party of civil rights (Feinstein and Schickler Reference Feinstein and Schickler2008). Flamm (Reference Flamm2005) delineates how the early years of the “war on crime” were initially led by Democrats. Both Flamm and Weaver (Reference Weaver2007) highlight how, by the late 1960s, the issue had been largely captured by strategic conservatives. Hall (Reference Hall2005) traces a “long backlash” beginning in the 1940s, and Murakawa (Reference Murakawa, Lowndes, Novkov and Warren2008, 235) highlights the ways in which national political figures “explicitly and routinely addressed black civil rights in criminological terms” before the 1960s. Joseph (Reference Joseph2009, 708) challenges simple associations between “race riots [and] gun-toting militants” to document the breadth of black radical influence, from local anti-poverty organizing to helping elect a new generation of black mayors. These longer, more complex time horizons offer a helpful corrective but still leave open the puzzles of variation in timing and geography: why, for example, did “law and order” fail for Goldwater yet succeed for Nixon?
AGENDA SEEDING
To reconcile competing elite and pluralistic theories, I propose a model that recognizes elite dominance of political communication but focuses on the ability of activists to overcome asymmetries through tactics like disruption that appeal to news organizations and shape whether and how media cover their concerns. Society is conceived of as a stratified democracy with two groups, one a dominant majority and another a subordinate minority (Sidanius and Pratto Reference Sidanius and Pratto2001). Within this society, two political coalitions compete for power. One coalition, typically more conservative, is broadly aligned with the dominant group and supportive of extending the power of the majority. The second coalition, typically more liberal, is more egalitarian and supportive of the interests of the subordinate group (King and Smith Reference King and Smith2005). The dominant group-aligned coalition has disproportionate capacity to project power through institutions like the government and media, whereas the subordinate-aligned coalition operates under constraints such as discriminatory laws, social stigma, higher rates of poverty, within-group cleavages, state-sanctioned persecution, and greater barriers to collective action (Cohen Reference Cohen1999; Olson Reference Olson1965).
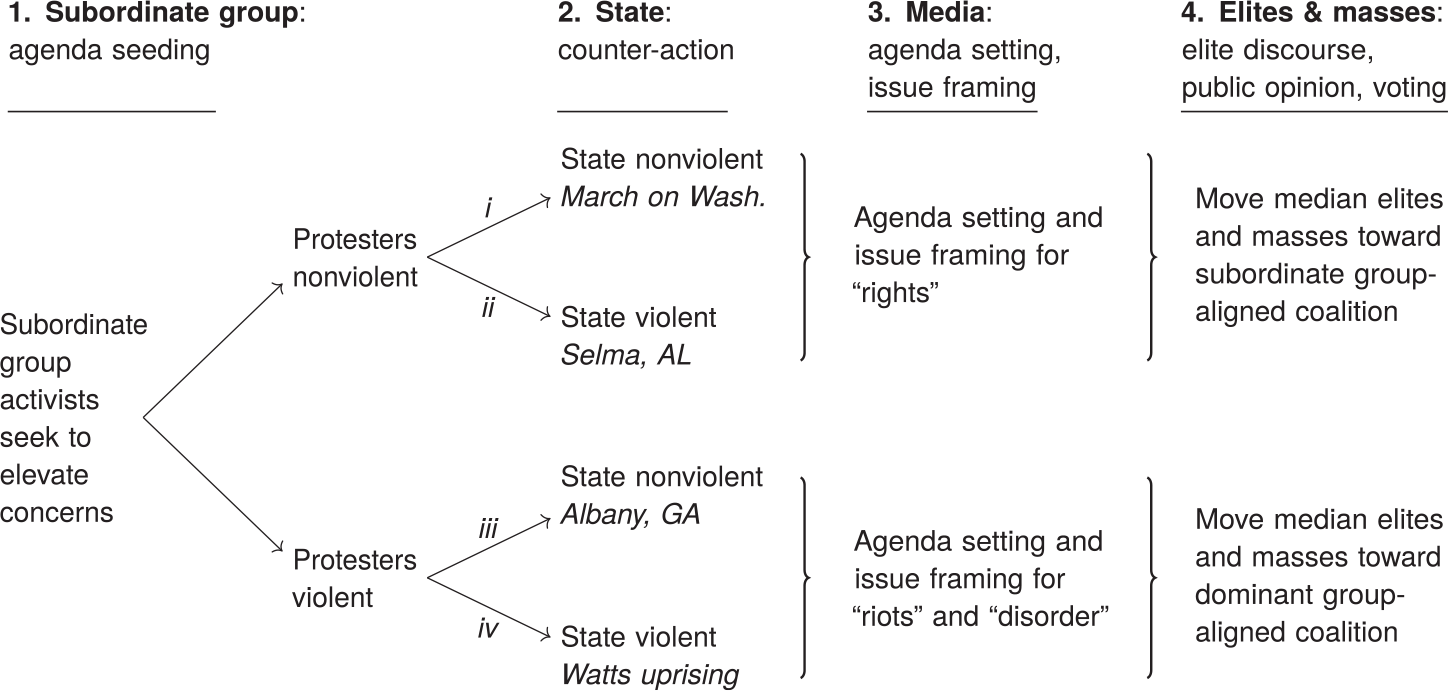
Figure 2 summarizes the model. In the first period, subordinate group activists attempt to raise awareness through agenda seeding that involves activists employing tactics, possibly nonviolent or violent, which might make the news. News organization still set public agendas but social movements, like any group seeking greater attention or publicity, attempt to entice media to prioritize their concerns. Southern civil rights protests, for example, were often planned for mornings so footage could be flown to New York in time to air nationally on the evening news (Torres Reference Torres2018). Similarly, movement leaders selected Selma, AL, as a site for voting rights protests partly for its proximity to television network affiliates in Montgomery (Torres Reference Torres2018).
Model of How Activist Agenda Seeding Influences Media and Politics
Media attention, however, can be sympathetic or hostile. Even presented with similar facts, different reporters and news organizations often structure stories in systematically different ways (Davenport and Litras Reference Davenport and Litras2003). Civil disobedience, for example, can be covered as a form of justifiable protest or unjustifiable criminality. Kinder and Kam (Reference Kinder and Kam2010) find that whether an issue can overcome societal biases to become salient depends significantly “on the ability of the issue to command the public’s limited and fickle attention and on how the particular issue is framed” (38). Activists, attuned to the ways in which media can frame an issue, routinely fought to craft narratives through a kind of political theater in which protests were “staged” and injustice “dramatized” (King Jr. Reference King1964; Lewis Reference Lewis2017).
In social science, framing is employed to describe a wide variety of concepts (cf., Benford and Snow Reference Benford and Snow2000). I rely on two definitions from the larger framing literature. First, in keeping with prior work in sociology on social movements, I use the term frame construction to refer to the process by which activist rhetoric and behavior contributes to how outside observers, particularly media, make meaning of an event (Gamson and Wolfsfeld Reference Gamson and Wolfsfeld1993; Gitlin Reference Gitlin1980; Goffman Reference Goffman1974). Though movement-initiated frame construction serves multiple purposes, including mobilizing members of the ingroup, for this paper, I focus on the role of frame construction in “garnering [or dampening] bystander support” (Snow and Benford Reference Snow and Benford1988). Second, I describe media framing, or frames in communication that influence public opinion, as issue framing (Chong and Druckman Reference Chong and Druckman2007; Sniderman and Theriault Reference Sniderman and Theriault1992). In addition, to minimize confusion between the two types of framing, I often refer to social movement frame construction as staging. Table 1 summarizes the terms and concepts.
Overview of Terms and Concepts
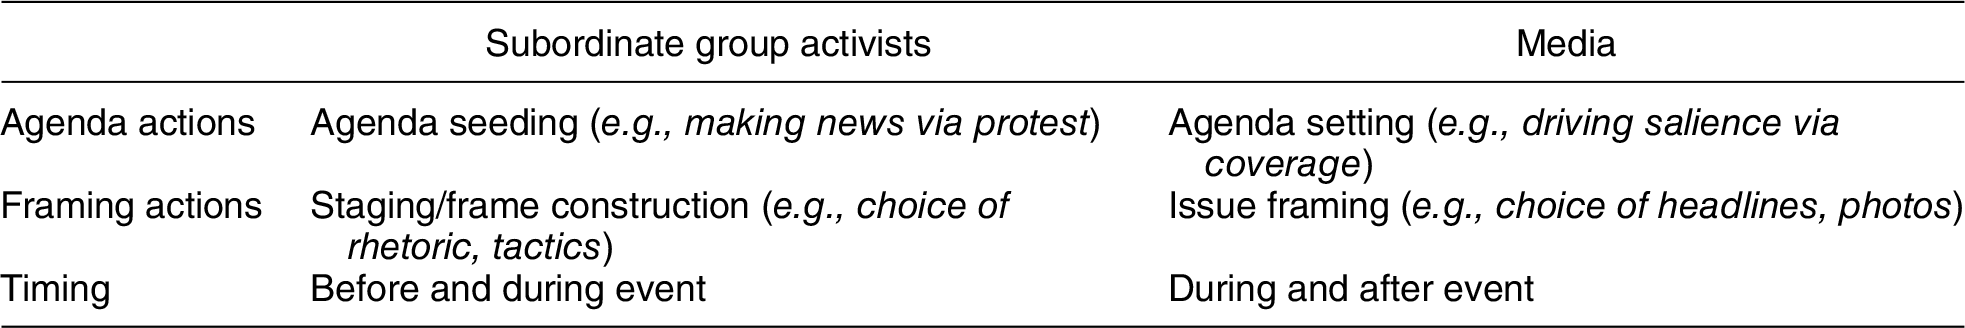
Movement-initiated staging or frame construction consists of the set of actions undertaken by subordinate group activists that influence the issue frames adopted later by the media. These actions could include everything from selecting which figures will embody a particular movement (e.g., Claudette Colvin or Rosa Parks), to recruiting particular types of protesters to be on the front lines of conflict (e.g., the Children’s Crusade in Birmingham) to crafting rhetorical appeals targeted to particular audiences (e.g., “Freedom Now!” or “Black Power!”). Among the most important forms of frame construction occur when movements, leaders, and protesters opt to endorse and/or initiate nonviolent or violent modes of resistance.
Initially, subordinate group leaders develop strategies amid enormous uncertainty. Activists are assumed to operate both with substantial constraints and with significant agency to advocate for particular approaches and tactics. Among the constraints, movement leaders confront incomplete information about which strategies will be most effective. In the 1960s, for example, the question of how to advance minority rights split architects of the black freedom struggle into two competing schools of thought, one more integrationist and the other more nationalist (Walton Reference Walton1971). The integrationist strategy focused on winning over persuadable members of the dominant group through tactics like nonviolent civil disobedience (Higginbotham Reference Higginbotham1994). King emphasized the critical role of the “white moderate” (1963). Bayard Rustin, a key organizer of the 1963 March on Washington, similarly argued for a kind of median white voter strategy (Frymer Reference Frymer1999):
[T]he country’s twenty million black people can[not] win political power alone. We need allies. The future of the Negro struggle depends on whether the contradictions of this society can be resolved by a coalition of progressive forces which becomes the effective political majority in the United States (Rustin Reference Rustin1965).
The nationalist strategy rejected the focus on white moderates and emphasized “community control” or building autonomous bases of power. Beginning in the mid-1960s, the influence of traditional civil rights leaders was challenged by black nationalists like Stokely Carmichael and Angela Davis. These leaders advocated for progress through the development of black-led institutions and rejected the contingent power of coalition politics in which black progress depended heavily on appeals to white conscience and funding (Carmichael and Hamilton Reference Carmichael and Hamilton2008; Davis et al. Reference Davis, Olsson, Glover and Carmichael1972; Francis Reference Francis2019). Self-governance and nonviolence were not incompatible, as evidenced by the Black Panther Party Free Breakfast for School Children Program that, at its peak, served about 20,000 children in 19 cities (Araiza Reference Araiza2009). In response to brutal repression, however, nationalist advocates typically favored some version of the idea that “Negroes meet violence with violence as a means of self-defense” (Williams Reference Williams1962, 1–2). Among nationalists, these more militant tactics were considered legitimate and essential tools in the repertoire of resistance against institutionalized racism (Carmichael and Hamilton Reference Carmichael and Hamilton2008).
In the second period of Figure 2, the state and vigilantes react to the subordinate group protest. Activists can control logistical matters like the timing and location of protests but are otherwise assumed to have no direct control over the state response. Within the model, though, activists control the issue frames adopted by the press. State counteractions, such as the use of force, influence the degree of coverage but are predicted to have little effect on the valence of reporting. When state-aligned agents engage in violent repression against nonviolent protesters, in keeping with comparative work, the model predicts media coverage will tend to be sympathetic to the activists (Stephan and Chenoweth Reference Stephan and Chenoweth2008). Conversely, when protesters employ violent tactics against nonviolent majority group actors, coverage will tend to be sympathetic to the dominant group-aligned agenda. When both protesters and the state engage in substantial violence, the “tie” is predicted to go to the dominant group and media coverage will focus on concerns about order maintenance. In short, violence is a double-edged sword. State repression both subjugates activists and is predicted to focus media attention on the concerns of nonviolent protesters. In contrast, violence by protesters can powerfully express discontent and offer a means of self-defense but, in the glare of mass media, is expected to strengthen the coalition of those looking to thwart minority demands.
In the first case, i, nonviolent protest is met with state actors trying to minimize or restrain the government and vigilante capacity for force. In the absence of violence, the agenda seeding effect of a protest may be diminished but the valence of coverage is predicted to remain focused on “rights.” Branch (Reference Branch1998, chap. 15), for example, quotes one reporter’s take on a nonviolent civil rights protest in Hattiesburg, MS, “… even an unprecedented picket line was a dull story. ‘In such situations, blood and guts are news’.” Nevertheless, the staging of nonviolent protesters confronting nonviolent state actors should, on average, help construct frames about collective action as claims for rights. The paradigmatic example of this case is the March on Washington. Roberts and Klibanoff (Reference Roberts and Klibanoff2007, chap. 20) highlight that the New York Times, “in the second paragraph of its coverage, called the [March on Washington] ‘the greatest assembly for a redress of grievances that this capital has ever seen.’ It added: ‘There was no violence to mar the demonstration’.”
In the second case, ii, when nonviolent protest is met by state or vigilante repression, activists might be injured or even killed but the resulting media coverage is predicted to help the larger movement and undermine the dominant group-aligned coalition. Consistent with Gillion (Reference Gillion2013), the volume of coverage is predicted to increase but the media narrative is expected to remain focused on “rights.” Roberts and Klibanoff (Reference Roberts and Klibanoff2007, chap. 16) note “movement leaders and some segregationist leaders were studying the press: how it reacted, what made news, and what did not. One thing was unambiguous: the greater the violence, the bigger the news, especially if it could be photographed or filmed.” Following these insights, civil rights leaders intentionally selected both Birmingham, AL, and Selma, AL, as theaters of battle in which to contest segregation under the expectation that the local police chiefs with “hair-trigger temper[s]” would respond in ways that could shock the consciences of otherwise indifferent white moderates (Roberts and Klibanoff Reference Roberts and Klibanoff2007, chap. 22).
In the third and fourth cases, iii and iv, subordinate group activists use violent tactics. Irrespective of the state response, dominant group media framing is predicted to focus on order maintenance concerns like “riots” and “disorder.” In Albany, GA, for example, black-led largely nonviolent efforts at desegregation occasionally escalated to include protester-initiated violence against the intentionally restrained force led by Chief of Police Laurie Pritchett. On July 24, the New York Times front page covered a protest of “2,000 angry Negroes” and reported that “[b]ricks, bottles and rocks were thrown towards more than 100 city policemen…” (Sitton Reference Sitton1962). Following the violence, King and other leaders called off additional protests and declared “a day of penance” (King Jr. Reference King1962).
Similarly, in the fourth case (i.e., iv), violent resistance confronts violent repression. In line with Gillion’s informative cue model, this scenario is predicted to generate significant attention (Gillion Reference Gillion2013). Unlike the informative cue model, however, staging an event with violence is predicted to nudge the media toward a focus on “riots” rather than “rights.” News coverage of most of the violent urban civil disturbances of the 1960s fits this type, with the 1965 Watts uprising as one high-profile example. In addition to the historical record, these predictions also build on experimental work that finds “extreme” protest tactics reduce popular support for a movement (Feinberg, Willer, and Kovacheff Reference Feinberg, Willer and Kovacheff2020; McLeod and Detenber Reference McLeod and Detenber1999). In short, whether or not the state engages in violent repression, activists using nonviolent tactics are predicted to seed more rights-focused issue frames and activists using violence are predicted to seed issue frames that emphasize disorder.
In the third period of Figure 2, reporters, editors, and media outlets make choices through headlines, prose, photographs, audio, and video that not only convey facts but also help audiences organize information about protests into larger conceptual buckets (Chong and Druckman Reference Chong and Druckman2007; Gamson and Wolfsfeld Reference Gamson and Wolfsfeld1993). Framing typically draws on preexisting cultural motifs, stories, and beliefs (Tarrow Reference Tarrow1992), and two recurring issue frames for black resistance were as either a legitimate effort to fight injustice or an illegitimate act of lawbreaking within a long tradition of representing black life as pathological (Murakawa Reference Murakawa, Lowndes, Novkov and Warren2008). Though majority-oriented media are likely to exhibit systematic bias against minority-led movements (Davenport Reference Davenport2009), news organizations are also guided by a range of incentives including a desire to increase profits and to tell noteworthy stories that help attract audiences. Gamson and Wolfsfeld (Reference Gamson and Wolfsfeld1993) note, “social movements often make good copy for the media. They provide drama, conflict, and action; colorful copy; and photo opportunities” (116–7).
In the fourth period of Figure 2, both elites and masses are exposed to media coverage that, in turn, shapes their attitudes and behavior. Media agenda setting raises protest activity into the public sphere and issue framing contributes to more “rights”-focused or more “order maintenance”-focused shifts among moderates in relevant outcomes like public opinion, elite discourse, and voting. Through tactics like disruption, subordinate groups are predicted to upend the normal dominant group focus of the media to achieve a form of punctuated pluralism in which their concerns temporarily come to the fore of the press and, by extension, public opinion and policy making.
EMPIRICAL STRATEGY
My goal is to estimate a causal effect of protests on voting, with attention to possible differential effects by tactic type. In addition, I aim to demonstrate a plausible mechanism via media coverage. I begin the analysis using three statistical methods to test for a relationship between disruption strategies and the ultimate outcome of interest, voting behavior. First, with county-level data, I use panel models with county fixed effects to control for any time-invariant characteristics. In addition, to address potential spatial correlation of errors, I run spatial panel models that control for characteristics of neighboring counties (Millo and Piras Reference Millo and Piras2012). Second, to address heterogeneity of units, I use various matching and weighting techniques to approximate treated and control groups that are similar on all observed covariates (though may still differ for unobserved covariates). Third, to further address endogeneity, I use rainfall in April 1968 as an instrumental variable that approximates random assignment of violent protests. Finally, to assess whether the estimated shifts in voting mattered in electoral politics, I run a counterfactual simulation of the 1968 presidential election.
The agenda seeding model makes specific predictions about the effects of subordinate group protests on dominant group voting behavior. Aggregate measures of county-level demographics and voting may not accurately reflect the individual-level behavior of white voters (King Reference King1997). Consequently, I conduct a variety of “homogeneous place” and placebo tests. The hyper-segregation of Americans by race offers one solution to the ecological inference problem through a form of extreme case analysis (Duncan and Davis Reference Duncan and Davis1953; Lau, Moore, and Kellermann Reference Lau, Moore and Kellermann2007). By limiting some statistical analyses to counties that are 90% white, county-level data on Democratic vote share serve as reasonably good estimates of individual-level white voting behavior.
To test the mechanisms by which protests are influencing politics, I again use multiple methods. First, I present plots to show the punctuated patterns of protest activity correspond closely to changes in front page news coverage, elite discourse, and public opinion. I also present results from Granger causality tests that estimate whether trends in protest activity, front page news coverage, congressional speech, and public opinion are able to forecast one another. As a further test of agenda seeding, I show that violence by activists, even when controlling for violence by police, increases coverage and prominence in the New York Times. In addition, I show that protest tactics influence the language and frames employed by reporters, again, even when accounting for state violence. Across all the tests, I show differential effects by disruption tactic. Though the model predicts protests influence politics through news coverage, I do not use a mediation model as I lack county-level measures of news in the 1960s. Table 2 presents an overview of the questions, methods, and data. Main findings are presented below in coefficient plots or figures. Regression tables and additional robustness checks appear in the Online Appendix.
Overview of Questions, Methods, and Data
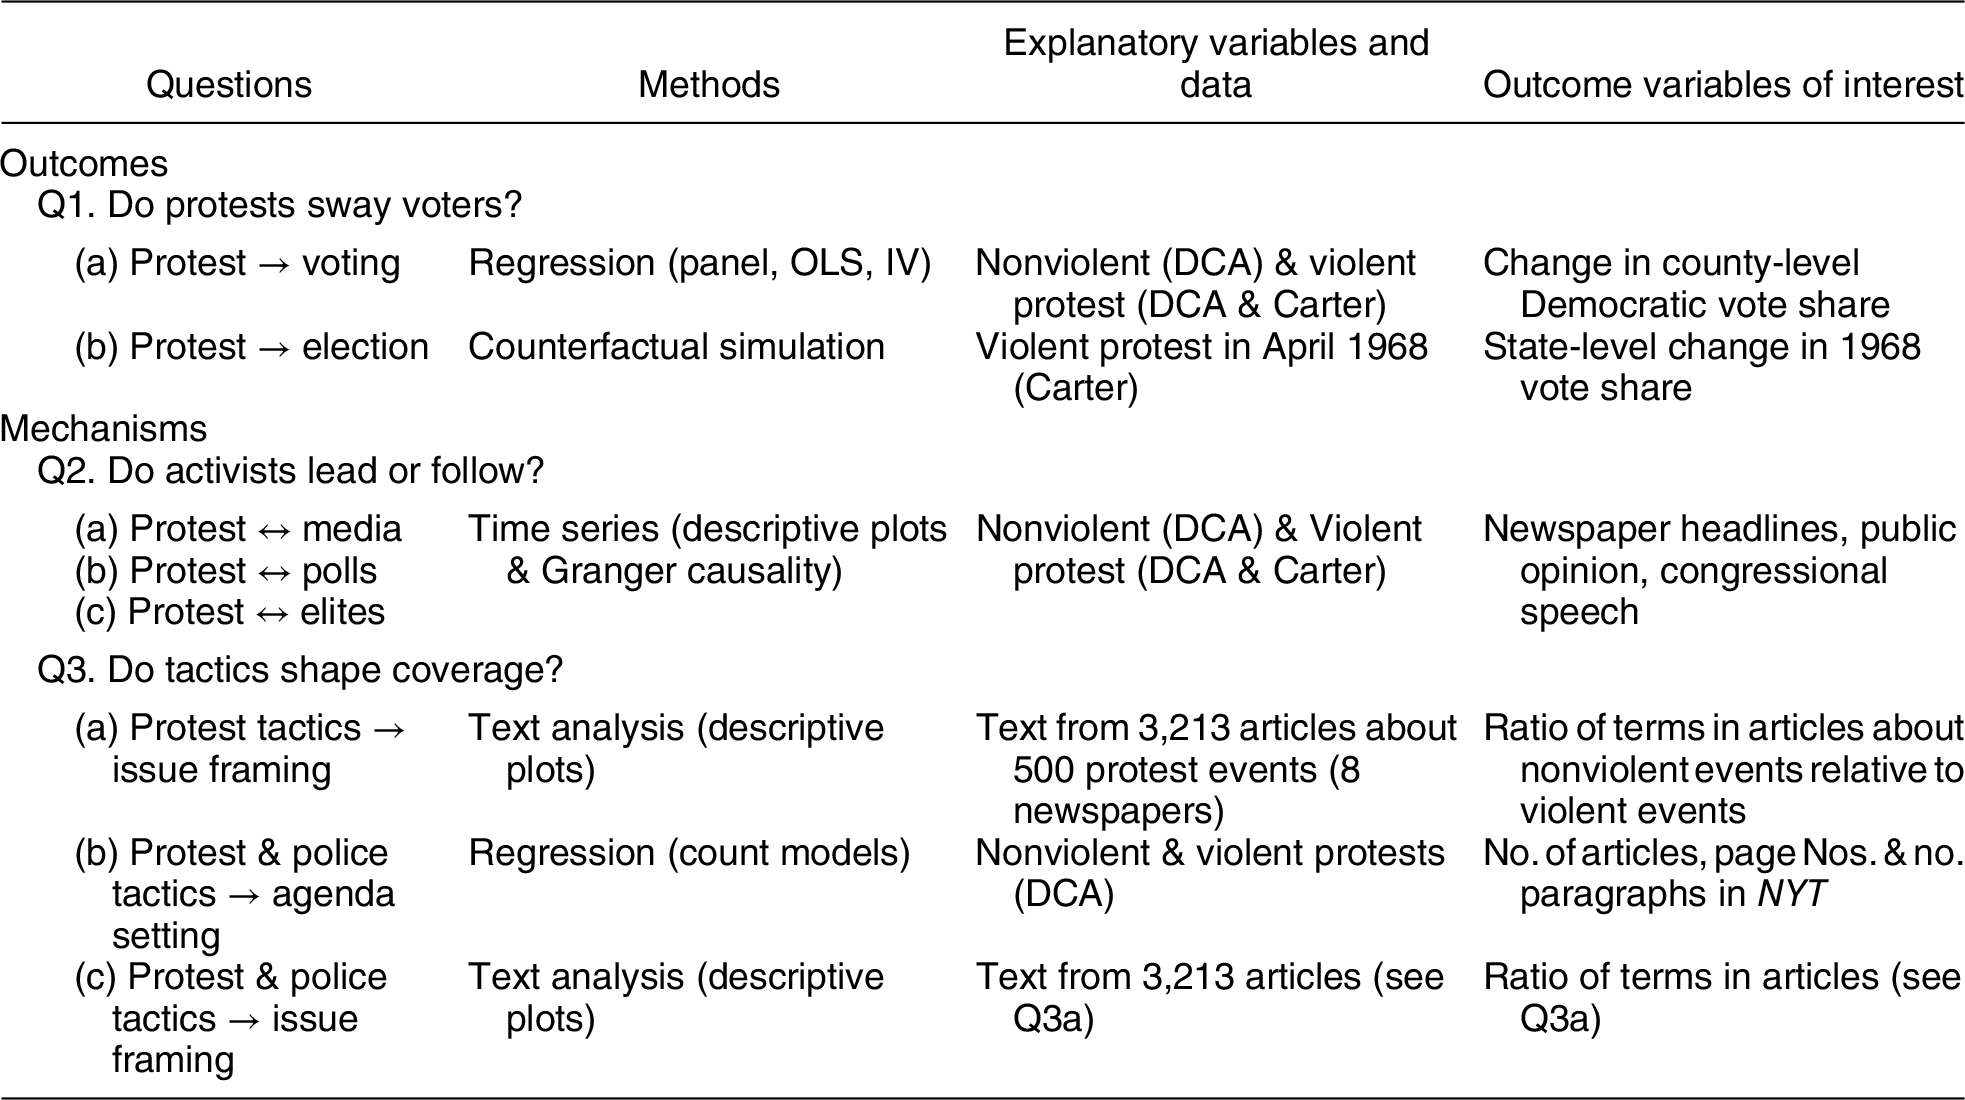
Note: All data from 1960–72 except Q1a OLS & IV and Q1b, which use data from 1968.
DATA AND VARIABLES OF INTEREST
To empirically test for agenda seeding, I use data on protests, news coverage, public opinion, congressional speech, and voting behavior. I also use a variety of data sets from government sources to provide county-level demographic information and historic rainfall.
Protests
The data on protests come from two distinct sources and differ in several important ways. The Dynamics of Collective Action (DCA) data cover protest activity between 1955 and 1995 for a wide range of groups and causes and include data on both nonviolent and violent protests (McAdam et al. Reference McAdam, McCarthy, Olzak and Soule2009). The data are from the New York Times Index and are human-coded for a variety of characteristics. Carter (Reference Carter1986) provides data exclusively on black-led protests from 1964 through 1971 that escalate to violence outside institutional settings such as colleges or prisons. I amend the Carter data to include one institutional protest in which violence occurs, the Attica prison uprising on September 9, 1971, because the scope and size of the event is comparable to some of the largest non-institutionalized violent protests. The results presented are robust to its exclusion. The Carter data build on decades of scholarship in sociology on the 1960s “urban riots” and draw on a wider range of sources to offer considerably more detail about event severity than the DCA data. The Carter data define a violent protest as an event that involves at least 30 participants and generates a detectable level of injury or property damage. For the analysis of nonviolent events, DCA data are used exclusively. For the analysis of violent protests, both DCA and Carter data are used, where possible, to replicate results. For the analyses of violent protests in April 1968, only the Carter data are used as the DCA data record few nonviolent or violent protests in the wake of King’s assassination. Both data sets provide the date, city, and state of each protest as well as several measures of the event’s intensity such as the number of participants, arrests, injuries, and deaths. I geocode all protests using city-level information, and the distance between protests and continental United States counties is measured as the shortest distance between the centroids.
Voting
Voting behavior is measured as the change in the county-level percentage of votes going to the Democratic Party in presidential elections between 1964 and 1972. The county-level voting data are drawn from Clubb, Flanigan, and Zingale (Reference Clubb, Flanigan and Zingale1986). I focus on Democratic vote share as the outcome variable because it offers a reasonable proxy for attitudes toward black interests and indicates both mass opinion and behavior. Beginning in the 1940s and continuing through the Civil Rights Act of 1964, Democrats emerged as the de facto party of African American voters (Carmines and Stimson Reference Carmines and Stimson1989; Feinstein and Schickler Reference Feinstein and Schickler2008). According to data published by Bositis (Reference Bositis2008, Table 1, 8; Reference Bositis2012), between 1936 and 1960 black party identification with Democrats averaged about 52%. Between 1964 and 1972, black party identification with Democrats averaged 83% (see Online Appendix). Exit polls in 1964, 1968, and 1972 presidential elections put the “nonwhite” vote for the Democratic Party at 94, 85, and 87%, respectively (Gallup Organization 2018). In the same period, Republican and third-party candidates like Barry Goldwater, Richard Nixon, and George Wallace made explicit appeals to whites who resented or were opposed to the Civil Rights Movement (Mayer Reference Mayer2002; Mendelberg Reference Mendelberg2001).
News Coverage
To measure the agenda seeding effects of nonviolent and violent protests, I collected 274,950 front page headlines between 1960 and 1972 from the following newspapers: Los Angeles Times, New York Newsday, Boston Globe, Chicago Tribune, Christian Science Monitor, Washington Post, and The Wall Street Journal. Headlines from the New York Times were collected but are excluded from the analysis as the DCA data are sourced from the Times Index. The presence of front page headlines, as opposed to other parts of a newspaper, is used as a sharp test for agenda seeding. This likely underestimates effects of protest on media as most news appears off the front page. Headlines are also meant to serve as a proxy for news coverage generally across print, radio, and television due to the challenges of collecting historical time series data from more ephemeral broadcast media. The text of the headlines was processed according to standard procedures (Grimmer and Stewart Reference Grimmer and Stewart2013). Headlines mentioning foreign countries were dropped and daily keyword counts were calculated for a range of terms related to “civil rights” and “voting rights” or “riots” and “attica” (to account for the Attica prison uprising).
In addition, to estimate an agenda seeding effect of protester violence when accounting for police violence, I exploit variation in the DCA data on the number of New York Times articles about each recorded protest, the number of paragraphs in each article, and the page number. To avoid conflating routine policing with more extreme forms of state repression, the police violence variable is coded as zero except when officers use “physical force” (coded as one) or “guns, tear gas, or other equipment” (coded as two).
To estimate whether protest tactics influenced media framing, I randomly selected 500 black-led protest events from the DCA data and searched a historical newspaper archive for any news articles published over the three days following the start of the disruption period that mentioned the city in which the event occurred and the word “negro” within 50 words of the terms “protest,” “demonstration,” “march,” “sit-in,” or “riot.” This search process returned 4,034 articles. As the DCA data use the New York Times as the primary reference for identifying protests, I remove all articles that reference the paper leaving 3,213 articles. After removing duplicates, classified ads and news summaries I digitized the full text to create a corpus of majority-oriented news media coverage of minority group-led protests.
Public Opinion
Mass opinion data are from surveys conducted by different companies between 1950 and 1980 in which subjects were asked to identify the “most important problem” facing America. The data are collected in Niemi, Mueller, and Smith (Reference Niemi, Mueller and Smith1989) and slightly revised in Loo and Grimes (Reference Loo and Grimes2004). Both the “civil rights” and “social control” measures combine open-ended responses.Footnote 4 Evidence suggests that many citizens conflated issues like violent protests and crime so I use the composite measure without adjustment (Flamm Reference Flamm2005). The polls occur at irregular months and, for time series analyses, missing data are imputed using linear interpolation with seasonal adjustment.
Elite Discourse
To measure elite discourse, I extract text from the Congressional Record between 1959 and 1973 to build a machine readable corpus and calculate the occurrence of certain keywords. This represents approximately 400,000 pages from the official record of the debates for the 86th to the 92nd sessions of Congress. To estimate trends, I create two indices. The first index counts the number of daily mentions of the phrases related to “civil rights” (as done for news coverage). The daily sum of the counts creates “civil rights index.” The same method is used to calculate a “social control index” using the keywords like “riot” and “antiriot” to account for proposed legislation.
Control Variables
Where appropriate, I control for variables that influence voting and for which data were available across three county-level censuses in 1962, 1972, and 1983. County-level demographic variables include the percentage of the population that has at least a high school diploma; the percentage of the population that is black, and, to account for nonlinearities in how the presence of African Americans in a county influences voting behavior, the same term squared;Footnote 5 and the median age. To account for some of the institutional and population-level variation across counties, I include terms for the logged per capita expenditures by local government, the percentage of the county population that lives in an urban setting, the logged total population, and the percent population growth. For economic factors, I include county-level median income, percent of the population that is unemployed and percentage of housing that is owner occupied. In keeping with prior literature on ethnic conflict and violent protests, I include a term for the percent of the county that is foreign born (Olzak and Shanahan Reference Olzak and Shanahan1996). Finally, a lagged term of the Democratic vote share from the prior presidential election is included. Where the census year data from 1962, 1972, and 1983 do not correspond to election years, I use linear interpolation to estimate the relevant values for 1964 and 1968.
RESULTS
Did Protests Cause Changes in Voting Behavior?
My initial goal is to identify a causal effect of protests on voting for or against the more egalitarian political coalition (i.e., Table 2, Q1a). I estimate the following linear model:
 $${\rm{DemShar}}{{\rm{e}}_{i,t}} = {\beta _1}{\rm{Protes}}{{\rm{t}}_{i,t}} + {\beta _2}{\rm{DemShar}}{{\rm{e}}_{i,t - 1}} + {\bi{\boldbeta }}{{\bf{X}}_{{\bf{i}},{\bf{t}}}} + {\alpha _i} + {\varepsilon _{i,t}},$$
where DemSharei,t is the vote share of Democratic Party in county i in the election occurring in year t. Protesti,t is a binary indicator of whether county i experienced a protest in year t. The vector Xi,t denotes other time-varying county characteristics, α i accounts for time-invariant county characteristics, and ε i,t is the county-clustered robust error that captures unobserved factors influencing voting in election-year t.
I am interested in the effect of protests that are spatially and temporally proximate to a particular county. For any given county-year, the protest “treatment” is calculated as a function of whether county i was within 100 miles of any protest that occurred within 730 days before the election in year t and exhibited a level of intensity in which at least 10 protesters participated (DCA data) or were arrested (Carter data). The distance threshold follows Wallace, Zepeda-Millán, and Jones-Correa (Reference Wallace, Zepeda-Millán and Jones-Correa2014) and is selected to approximate the geographic area in which local media might cover a proximate protest. For example, civil unrest in Newark might reasonably be covered in Philadelphia even though they are about 85 miles apart. The cut points of 10 participants and two years were selected as reasonable bounds for a protest that might get covered in the news and influence a voter. Results are robust to other reasonable specifications (see Online Appendix).
Are Protests Exogenous to Voting?
One concern with estimating causal effects of protests is that disruption activity might not occur at random. An early and substantial body of work in sociology found that black-led violent protest occurrence was highly idiosyncratic and the only consistent predictor was the presence of a black population (cf., Spilerman Reference Spilerman1976). More recent scholarship finds evidence that diffusion, movement organizations, black adult resources, and ethnic competition may also influence where protests occurred (Andrews and Biggs Reference Andrews and Biggs2006; Carter Reference Carter1986; McAdam Reference McAdam1982; Myers Reference Myers2000; Olzak and Shanahan Reference Olzak and Shanahan1996). Matching and weighting units create treated and control groups that look similar on all observed pretreatment characteristics but may not eliminate unobserved confounders.
Matching with time series, cross-sectional data, however, pose a challenge in that each observation is a county-year in which some units are systematically linked to one another (Nielsen and Sheffield Reference Nielsen and Sheffield2009). That is, a county in 1968 is related to that same county in 1972. Were we able to approximate an experiment, one approach would be to pick highly similar pairs of counties in the pre-protest period and then randomly assign the disruption “treatment” to one member of the pair. As the relevant unit of analysis is a county and protest activity is concentrated in time, one straightforward approximation is to match “treated” and “control” counties with similar pretreatment covariates for a single peak protest year, discard unmatched counties, and then run the panel model with the matched subset of counties across all time periods. This approach resembles matching with cross-sectional data by limiting “treatment” to one time period. I apply this approach assigning “treatment” and “control” categories to each county using the peak periods for nonviolent protest in the 1964 election cycle and violent protest in 1968. To prioritize balance on factors deemed most important in prior research, I match on five county-level characteristics: percentage of the county population that is black, foreign born, urban, log of the total population, and whether the county is in the Deep South. Matching was completed using logistic propensity score matching with a caliper of 0.1. Table 3 presents summary statistics for the matched nonviolent and violent protest data. Across all three data sets, observed pretreatment covariates in the “treated” and “control” categories are very similar.
Summary Statistics for Matched County-Level Data

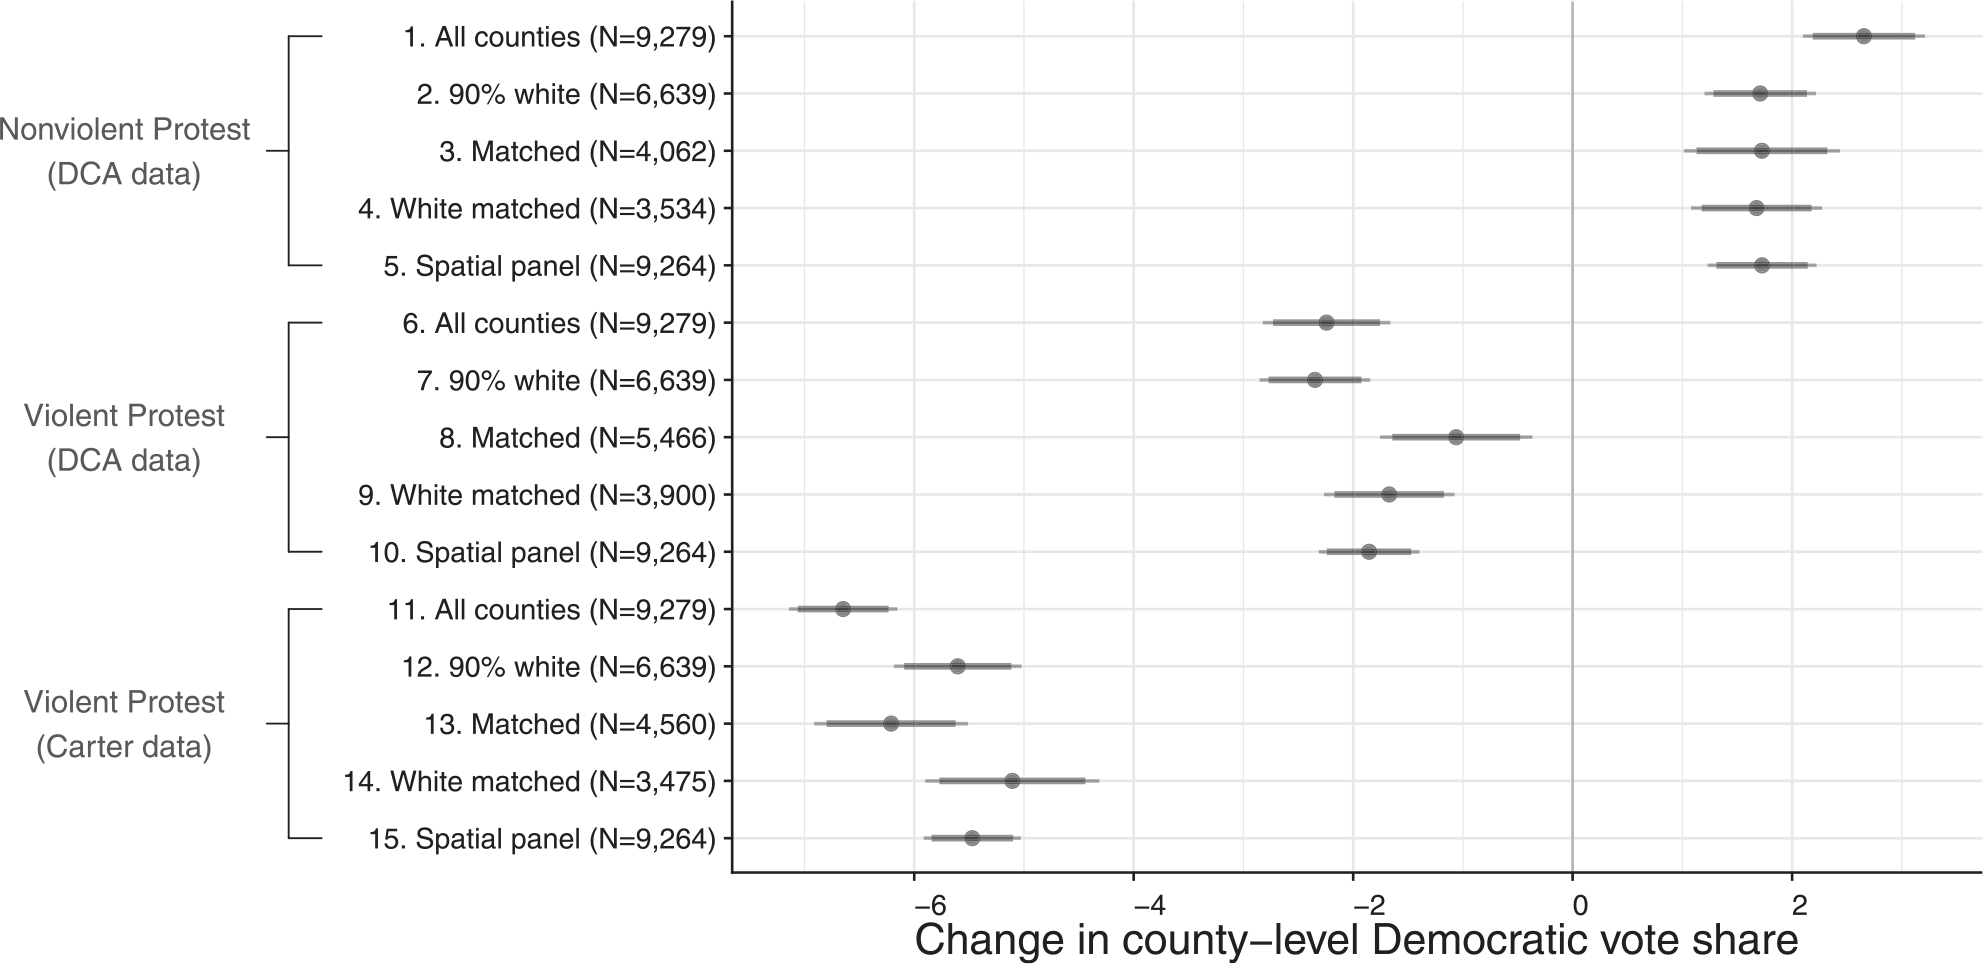
Figure 3 presents the results of 15 panel models estimating the effect of protests on change in county-level Democratic vote share. The results of models 1 through 5 indicate that moving from a 90% white “control” county not exposed to nonviolent protest activity to a similar “treated” county that was exposed caused an approximately 1.6 percentage point increase in Democratic vote share (all, p < 0.0001). Conversely, the results of models 6 through 15 suggest that moving from a 90% white “control” county not exposed to violent protest activity to a similar “treated” county that was exposed caused a 2.2 to 5.4 percentage point decrease in Democratic vote share (all, p < 0.0001). For the subset of counties which are at least 90% white in 1960 and for counties that are matched (or both), the effect of black-led protests on change in Democratic vote share hold. Likewise, the spatial error panel models account for potential correlation of error terms for each county with neighboring counties, and the results do not differ substantially. In sum, Figure 3 suggests results are not being driven by imbalance, model specification, or spatial correlation.
Panel Models of Effect of Protest on Change in Presidential Vote Share, 1964–72
Note: Each point represents a coefficient (along with the 90 and 95% confidence intervals) for the estimated effect of protests on change in county-level Democratic vote share in the presidential elections of 1964, 1968, and 1972 with county fixed effects. Models using DCA data measure protest activity using participants ≥10 and, with Carter data, arrests ≥10. Other specifications can be seen in the Online Appendix.
Did Violent Protests in April 1968 Cause a Decline in Democratic Vote Share?
To further assess the robustness of these results, I estimate several additional models. Following Collins et al. (Reference Collins, Margo, Vigdor and Myers2004), I work with the subset of 137 violent protests recorded in the Carter data that occur following the assassination of King in April 1968. To address possible bias introduced by heterogeneity of units, I estimate a variety of linear models with different matching and weighting methods. In addition, I use rainfall as an instrument for protest activity in April 1968 and estimate the effect of violent protests with a two-stage least squares model.
The OLS, matched, weighted, and second stage instrumental variable (IV) models all take the form:
 $${\rm{DemShar}}{{\rm{e}}_{i,1968}} = \alpha + {\beta _1}{\rm{Protes}}{{\rm{t}}_i} + {\beta _2}{\rm{DemShar}}{{\rm{e}}_{i,1964}} + {\bi{\boldbeta }}{{\bf{X}}_{\bf{i}}} + {\varepsilon _i}.$$
As in the panel model, DemSharei is the Democratic Party vote share in county i. Unlike the panel model, however, the only election of interest is the 1968 presidential election and, therefore, there is no year t subscript. Protesti is calculated as in the panel model except that only the 137 violent protests occurring in April 1968 are included to estimate whether a given county is “treated.” The control variables are the same as in the panel model except for the addition of a dummy variable for the South.Footnote 6 Across six OLS models, with and without matching, covariate balancing propensity score (CBPS) weights and subsetting for a 90% white population, counties proximate to a violent protest in April 1968, as compared with those that were not near an uprising, saw a 1.6 to 1.8 percentage point decrease in voting support for the Democratic presidential candidate in November 1968 (all p < 0.001, table in Online Appendix).
Instrumental Variable Models
To further address concerns about endogeneity, I use rainfall in April 1968 as an instrument to approximate random assignment of violent protests following King’s assassination. Prior scholarship finds bad weather decreases protest activity and public gatherings (Collins et al. Reference Collins, Margo, Vigdor and Myers2004; Collins and Margo Reference Collins and Margo2007; Madestam et al. Reference Madestam, Shoag, Veuger and Yanagizawa-Drott2013). For the IV model, in the first stage, Protesti is modeled as a function of average rainfall in millimeters from weather stations within a 50 mile radius of the county center. For the second stage, the predicted values of the first stage are used as the Protesti “treatment” to explain variation in county-level Democratic vote share.Footnote 7 As the most severe uprisings occur in the first few days following the assassination, I use more granular day-level rainfall data rather than rainfall for the whole month. The rainfall measures are taken from long-term daily precipitation records from the US Historical Climatology Network (Easterling et al. Reference Easterling, Karl, Lawrimore and Del Greco1999).
Figure 4 presents results of six two-stage least squares regressions in which cumulative county-level rainfall is used to predict violent protest activity and then the predicted violent protest activity is used to estimate the change in Democratic vote share in counties that are at least 90% white.Footnote 8 Models (1) and (2) use rainfall before King is assassinated on April 4th as a placebo test and suggest that the relationship between pre-assassination rainfall in April 1968 and Democratic vote share in November 1968 is not statistically distinguishable from zero. Models (3) and (4) use rainfall for the week following the assassination, in which about 95% of the protests occur, and finds violent protests caused a significant negative shift in the county-level vote share of about 5.6 to 7.9 percentage points (p < 0.05; p < 0.01, respectively).
IV Models of Effect of Violent Protests in April 1968 on White Vote Share
Note: Coefficient plot of estimated effects of violent protest in April 1968 on change in county-level Democratic vote share in presidential election in November 1968. Models 1, 2, 5, and 6 are placebo tests that use rainfall during period with few or no protests. Models 2, 4, and 6 use CBPS weights to match. Protests data source: Carter (Reference Carter1986). No analysis of nonviolent protests is included as the DCA data record few nonviolent or violent protests in April 1968.

Models (5) and (6) offer a second placebo test using rainfall in the period of April 11–30 when only five percent of protests occur and suggest there is no significant relationship between rainfall and voting in the absence of significant protest activity. The absence of a significant relationship between rainfall and Democratic vote share, except in the week in which 95% of protests occur, strongly suggests violent protests, and not potential confounders, caused the decrease in Democratic vote share.
What Were the Political Consequences of Violent Protests?
Was violent protest in 1968 pivotal to that year’s presidential election (i.e., Table 2, Q1b)? Evidence from historical sources suggests widespread concern among the mass public about crime and disorder. Weaver (Reference Weaver2007) notes that Members of Congress were deluged with “torrents of constituent mail” in favor the 1968 Safe Streets bill and that even liberal Democrats “felt compelled by public anxiety over crime and riots to vote for the bill” (257). Polling data from August 1968 finds 81% of respondents agreed with the statement “Law and order has broken down in this country” (Louis Harris and Associates, Inc. 1968).
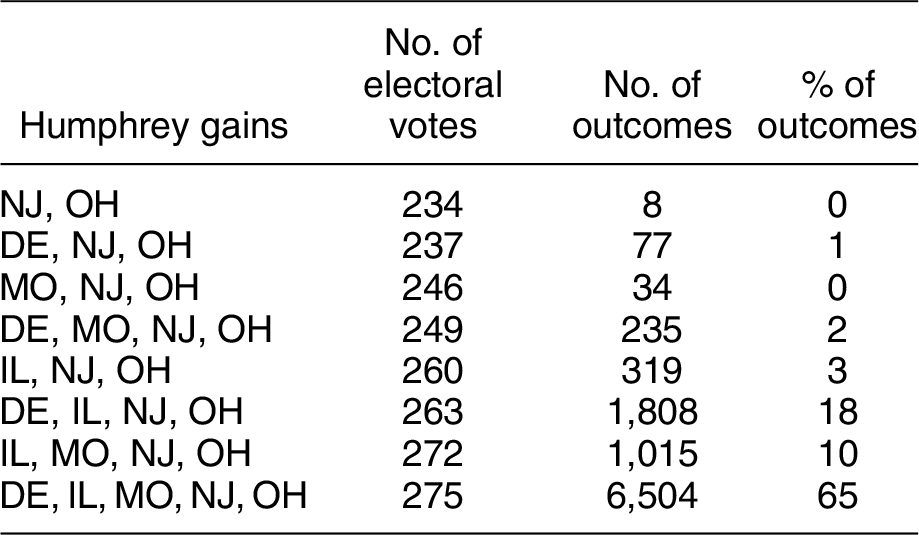
Table 4 presents the expected allocation of electoral votes in the 1968 presidential election under the counterfactual scenario that King had not been assassinated on April 4, 1968, and 137 violent protests had not occurred in the immediate wake of his death. To estimate this counterfactual, I simulate the 1968 election 10,000 times assuming no violent protests in April 1968. For each county exposed to violent protest activity, I calculate a counterfactual county-level Democratic vote share assuming Humphrey gained share at Nixon’s expense. The estimated increase is drawn from a random normal distribution with a mean of the original Democratic vote share plus 1.96 percentage points and a standard deviation of 0.25.Footnote 9 I then aggregate the county-level counterfactual vote totals to estimate the state-level vote totals and, ultimately, the winner of the state’s electoral votes. Across the simulations, there are eight unique outcomes and Humphrey wins in 7,519 out of 10,000 or about 75% of the simulations.
Results of 10,000 Counterfactual Simulated Elections
Note: Effect of violent protests on “treated” county-level Democratic vote share estimated at −1.96.
Under this counterfactual scenario, on average, I estimate that Humphrey would have won an additional 763,040 votes nationally (95% credible interval: 725,277, 801,741) and, in the modal outcome, a majority of the votes in five additional states: Delaware, Illinois, Missouri, New Jersey, and Ohio. These swing states would collectively have provided Humphrey with an additional 84 electoral votes and allowed him to win the 1968 election with a total of 275 electoral votes.Footnote 10
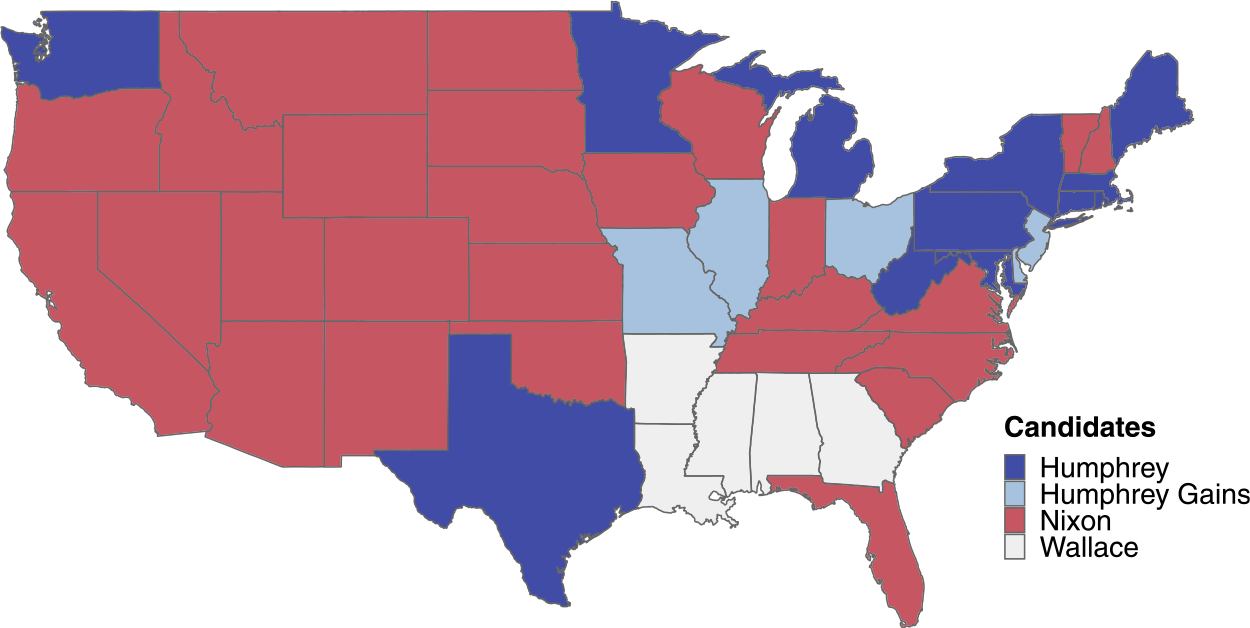
Figure 5 presents a map of the allocation of electoral votes in the 1968 presidential election under the counterfactual scenario of King not being assassinated and 137 violent protests not occurring in the wake of his death. As can be seen in Figure 5, none of the states Humphrey is estimated to pick up in the modal counterfactual scenario (i.e., Delaware, Illinois, Missouri, New Jersey, and Ohio) are Southern. Although Nixon is widely credited with having won the 1968 election with a “Southern Strategy,” in 1968 the third party candidacy of George Wallace carried the Deep South and Nixon only captures the Border South. Had Wallace been less competitive, it is exceedingly unlikely that segregationists in the Deep South would have switched to Humphrey, who was the lead sponsor and author of the Civil Rights Act of 1964. In short, the regions with the potential to swing between Humphrey and Nixon in response to violent protest were in the Midwest and Mid-Atlantic. Echoing King (Reference King1963) and Rustin (Reference Rustin1965), in 1964, nonviolent protests helped to grow the egalitarian coalition of white liberals, white moderates, and blacks to help the Democratic Party decisively win the presidency. In 1968, violent protests contributed to a split in that coalition in which white racial moderates from the Midwest and Mid-Atlantic opted for the “law and order” coalition and helped tip the presidency to the Republican Party.
Counterfactual Choropleth Map of the 1968 U.S. Presidential Election
Note: Choropleth map of the 1968 U.S. presidential election with electoral votes allocated under the counterfactual scenario of King not being assassinated and 137 uprisings not occurring in the wake of his death.
MECHANISMS
Are Activists Leading or following Elite Agendas?
How could protests change voting behavior? Almost no one directly observes a protest, and a large body of evidence suggests elites drive mass opinion (Canes-Wrone Reference Canes-Wrone2010; Lee Reference Lee2002; Lenz Reference Lenz2013; Zaller Reference Zaller1992). Might activists and voters simply be following elite cues? Or, alternatively, could protests—through indirect mechanism like media—co-opt typically elite channels of political communication to amplify marginal voices? To evaluate who is leading whom, I present descriptive plots and a summary of 48 Granger causality tests to assess the sequencing of black-led protests, news coverage, elite behavior, and mass opinion (i.e., Table 2, Q2). Figure 6 presents a scatter plot with loess-smoothed trend lines of nonviolent protest activity, front page news coverage, and public opinion on “civil rights” from 1960 to 1972. The left y-axis represents the scale for the percentage of respondents in a national survey saying that “civil rights” is the most important problem in America (i.e., a subset of data from Figure 1). In addition, the left y-axis presents the scale for the number of front page headlines, per month, that mentioned civil rights-related terms (as outlined above). The right y-axis also presents the scale for black-led nonviolent protest activity, calculated as the sum of the logged number of protesters, by month.
Nonviolent Protest Activity, Headlines and Public Opinion on “Civil Rights,” by Month
Note: Scatter plot with smoothed trend lines of nonviolent protest activity, news coverage of “civil rights” and public opinion about “civil rights” as the most important problem, aggregated by month.
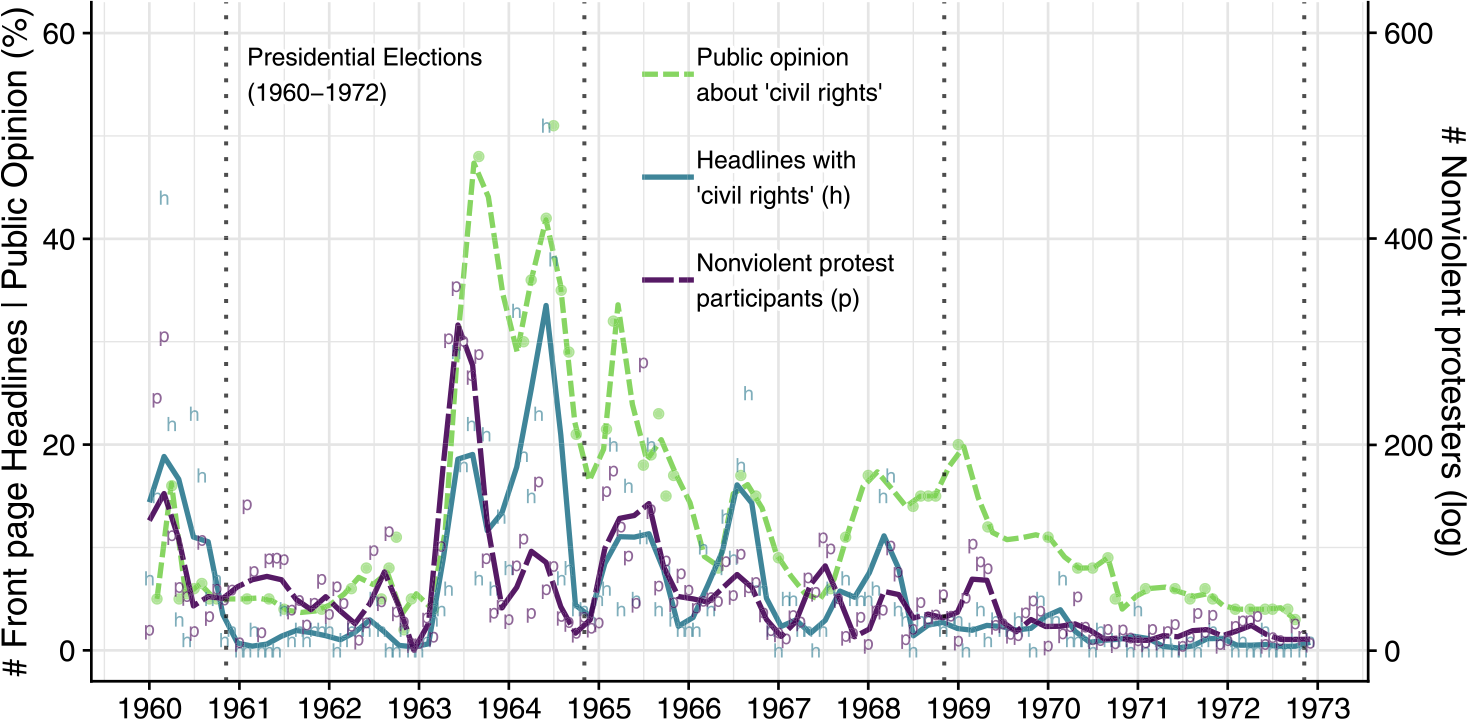
The data in Figure 6 show that front page headlines mentioning civil rights covary closely with periods of nonviolent protest mobilization. For example, news coverage of civil rights rises and falls coincident with waves of nonviolent protest in 1960 during efforts to integrate southern lunch counters and in 1963 during the buildup to the March on Washington (8/27/63). Similarly, the spikes in 1965 co-occur with the “Bloody Sunday” march in Selma, AL, in March (3/7/65) and precede the Voting Rights Act, which was enacted on August 6, 1965. Figure 6 also provides evidence that news coverage of civil rights rises coincident with periods in which civil rights legislation is being considered by Congress. The Civil Rights Acts of 1960 (5/6/1960), 1964 (7/2/1964), 1966 (died in the Senate on 9/19/66), and 1968 (4/11/68) also affirm the more elite-centered models of news coverage and public opinion. Although year-over-year changes in the three trends are substantial, Figure 6 also shows the significant within-year variation obscured in analyses limited to annual data.
Several prominent elite-centered theories suggest that presidential campaigns were critical in driving support for racial liberalism in the early 1960s and counter-mobilizations in the latter part of the decade (Carmines and Stimson Reference Carmines and Stimson1989; Weaver Reference Weaver2007; Zaller Reference Zaller1992). Figure 6 includes vertical dashed lines for dates of presidential elections between 1960 and 1972. The trend in news coverage and public opinion preceding a presidential election is either fairly flat or declining, suggesting that presidential candidates and campaigns were not moving mass opinion on civil rights. In short, the patterns in Figure 6 offer suggestive if not conclusive evidence that subordinate group protest activity is helping to seed news agendas on civil rights and that elite-led legislation also drives coverage. Figure 6 does not, however, support the proposition that presidential campaigns are playing an important role in increasing the salience of civil rights in the media or with the public.
Figure 7 presents trend lines for time series data between 1964 and 1972 on monthly violent protest activity, monthly front page headlines that mention “riots” (and related terms), and irregular monthly polling data on public concern about “social control.” From about 1964 to 1968, the periodicity and the magnitude of violent protest activity covaries closely with newspaper headlines that mention “riots” and the percentage of opinion poll respondents who say that that issues of “social control” are the most important problems facing America. From a low in 1964, we see a trend of rising concern in the summer followed by a decline in the winter. On April 4, 1968, King was assassinated and violent protest activity and newspaper headlines spiked dramatically. Public opinion also increases but with a significant lag which may be an artifact of the absence of polling data on this question between January 1968 and July 1968. In short, consistent with the proposed model, from 1964 to the peak in 1968 and decline through 1970, violent protest activity, headlines, and public concern for “social control” covary quite closely. From 1970 onward, as black protest activity declines significantly and anti-war protests become more prominent (e.g., Kent State shootings, 5/4/1970), the three trends are less synchronized except around the Attica prison uprising in September 1971.
Violent Protest Activity, Headlines on “Riots” and Public Opinion on “Social Control,” by Month
Note: Scatter plot with smoothed trend lines of violent protest activity, news coverage of “riots” and public concern about “social control,” aggregated by month. Violent protest activity in June 1967 and April 1968 exceeds 200 on arrests scale. For visualization, those two data points plotted at half of measured values.

The results in Figures 6 and 7 include very limited data on elite behavior (presidential election dates) and therefore cannot directly disambiguate between top-down and bottom-up models of media coverage and public opinion. To assess whether elite action is preceding or following protest activity, Figure 8 presents a plot of the relationship between weekly violent protest activity and weekly congressional speech mentioning the word “riot” and “antiriot” (and related terms). The pattern in 1964, 1965, 1966, and 1967 shows an initial spike in violent protest activity, followed by a spike in congressional speech mentioning “riots.” In 1968, during the week of March 3rd, the pattern is slightly different as Congress considered anti-riot legislation proposed by President Johnson. Johnson’s proposal failed to gain traction and congressional discourse about “riots” quickly drops. On April 4, 1968, King was assassinated and violent protest activity then reached record levels. The following week, in keeping with the pattern of earlier years, elite discourse spikes and, substantively noteworthy, an anti-riot proposal backed by conservative legislators was incorporated into the 1968 Civil Rights Act, which passed on April 11. In short, congressional discourse about “riots” mostly follows violent protest activity. The relationship between nonviolent protest activity and Congressional speech about “civil rights” and “voting rights” is presented in the Online Appendix.
Violent Protest Arrests and Congressional Speech on “Riots,” 1964–72, by Week
Note: Line plot of weekly counts of congressional speech using phrase “riot,” “antiriot,” and weekly, black-led violent protest arrests from 1964 to 1972. Data sources: Congressional Record and Carter (Reference Carter1986).

Who’s Leading Whom?
To further assess whether subordinate group staging of nonviolent or violent protests is influencing elite behavior, I conduct bivariate Granger causality tests. In simple terms, Granger causality tests evaluate whether data in one time series improve our ability to explain variation in another time series. For example, if rainfall yesterday is a useful predictor of rainfall today, a Granger causality test assesses whether including one additional variable in the model, such as yesterday’s temperature, significantly improves our prediction for rainfall today. Following Granger (Reference Granger1981), I regress lagged values of X against present values of Y while also controlling for lagged values of Y. If the full model with lagged X explains significantly more of the variation in Y than the reduced model (with just lagged Y), X is said to “Granger-cause” or forecast Y.Footnote 11
Figure 9 presents summary results for 30 bivariate Granger causality tests that assess whether trends in protest activity, front page headlines, congressional speech, and public opinion are predictive of each other. Arrows indicate the direction of the forecast and line weights indicate the degree of statistical significance (see legend). Contrary to models in which elites dominate political communication, Figure 9(A) also shows strong evidence of bottom-up effects in which subordinate group protests Granger-cause elite behavior. Put simply, nonviolent protest activity today is highly predictive of front page headlines and congressional speech about civil rights tomorrow. At the same time, consistent with an elite model, the results presented in Figure 9(A) suggest congressional speech and news coverage remain influential.
Two Diagrams Summarizing the Results of 48 Granger Causality Tests
Note:Granger causality test results summarized for (A) nonviolent protest activity and (B) violent protest activity. Arrows indicate whether one time series improves forecasting of the other. Results suggest both nonviolent and violent protest activity predict front page headlines and discussion in Congress. Nonviolent protest also predicts public opinion on civil rights. Line weights indicate statistical significance (see legend). No line between nodes indicates we fail to reject the null hypothesis of no additional predictive power. All tests used daily time series with lag of one day except for those involving public opinion which use monthly data (with interpolation). Estimates for effects of violent protests did not differ substantively across DCA and Carter data. Consequently, a third panel of six tests is not presented. In addition, no panels are presented for 18 placebo tests as only one result is significant.

Figure 9(B) tests the same relationships for violent protests and issues of social control like concern about “riots.” Again, consistent with the proposed model, trends in violent protest activity are predictive of trends in elite discourse and news coverage. Also, again, we observe some elite effects with congressional speech and news coverage forecasting other trends. Though Figure 7 suggests a strong relationship between patterns of violent protest activity and public opinion on “social control,” the Granger causality tests fail to reject the null hypothesis. This result might reflect the true absence of a relationship but could also be an artifact of issues such as that the two trends move together so closely that a lag of one month is insufficiently granular to detect how one trend predicts the other. In sum, the results of these Granger causality tests suggest that subordinate group activists can seed the agenda for news media and political elites.
I also conduct 18 placebo Granger tests to assess whether nonviolent protest activity forecasts news coverage of “riots,” public opinion about “social control,” and congressional speech about “riots.” Similarly, I test whether violent protest activity forecasts of news coverage, public opinion, and congressional speech about “civil rights.” Results in 17 of the 18 placebo Granger tests are not statistically significant (p > 0.05).Footnote 12 In other words, nonviolent and violent protest activity are only reliably predictive of language and attitudes that the dominant group associates with the particular tactics. This suggests the findings presented in Figure 9 are not simply spurious correlations. In addition, these placebo results suggest the specific pattern of nonviolent protest elevating concern about “civil rights” and violent protest driving concern about “riots” reflect meaningful relationships between tactics and terms employed by the press (full results in Online Appendix).
These findings are consistent with the predictions in Figure 2 that subordinate group agenda seeding helps to set mainstream news agendas and that the tactics employed significantly influence the issue frames adopted by the media. Cohen (Reference Cohen1963) argued the press “may not be successful much of the time in telling people what to think, but it is stunningly successful in telling its readers what to think about,” (13). The results presented in Figure 6 through Figure 9 broadly support Cohen’s insight. In the 1960s, however, this evidence suggests it was not just elites influencing media and mass opinion. Rather, the concerted efforts of black activists played a critical role in making the news.
Do Protest Tactics Shape Media Issue Frames?
Do different types of tactics produce different media issue frames (i.e., Table 2, Q3a)? Protests are typically contentious events in which media have considerable latitude to emphasize a range of interpretations (Davenport Reference Davenport2009). For example, both nonviolent and violent protests often involved illegal acts that could be described in terms that suggest either civil disobedience or criminal behavior. Similarly, no bright line distinguishes nonviolent and violent disturbances. Many nonviolent events were suffused with violence initiated by police and white civilians, while many events that escalated to protester-initiated violence often began as relatively peaceful, nonviolent affairs. This ambiguity allows for reporting to vary even for factually similar situations. Framing theory suggests that as journalists compose news stories, they rely on recurring organizing ideas and themes that structure how the public makes sense of a story and, often, imply particular public policies (Chong and Druckman Reference Chong and Druckman2007; Gamson and Wolfsfeld Reference Gamson and Wolfsfeld1993).
To further systematically test for a differential effect of protest tactics on how majority-oriented media frame these events, I selected 500 black-led protest events at random from the DCA data. Those protests included 385 events previously human-coded as nonviolent and 115 human-coded as occurring with some protester-initiated violence. A single event could be covered on multiple days and in multiple papers. On average, each query generated eight news articles for a total of 3,213 full-text documents after removal of any referencing the New York Times (2,461 nonviolent, 752 violent).Footnote 13 Those documents were converted to a machine readable format and the 25 most common terms from each corpus of articles was identified. Term frequencies were then calculated separately within the nonviolent or violent subsets and a ratio of nonviolent to violent term frequencies was estimated.
Figure 10 presents the ratios of 30 top stemmed term frequencies between the events previously human-coded as including nonviolent or violent protest tactics.Footnote 14 The top 15 rows of Figure 10 are terms that appear with greater frequency in articles about nonviolent events relative to violent events and the bottom 15, the inverse. The upper row of Figure 10 indicates that the term “march” is among the most common terms in articles covering nonviolent events and that it is about two-and-a-half times as common in articles about nonviolent versus violent events (21.3 ≈ 2.5).
Ratio of Term Frequencies in Articles about Protests Coded as Protester Nonviolent or Protester Violent

Similarly, the bottom row of Figure 10 indicates that the term “shot” appeared about three times as often in articles in which protester tactics were coded as violent as compared with those coded as nonviolent (21.6 ≈ 3). Stemmed terms like “presid[ent]” and “student” appeared with only slightly different frequencies in both sets of articles. Figure 10 also indicates that articles about nonviolent events were considerably more likely to include terms like “demonstr[ation],” “civil_right[s],” and “protest.” Likewise, articles about events that included protester violence were much more likely to include terms like “night,” “violenc[e],” and “polic[e].”
Term frequencies, however, only offer a crude sense of the content of the articles. Looking at the top terms in context further reinforces the results presented in Figure 10. For example, a seemingly neutral stemmed term like “store” is employed very differently depending on the event. In articles about events coded as nonviolent, about 46% do so when a store is the object of a boycott, sit-in or lunch counter protest. For events coded as including protester violence, “store” co-occurs in about 77% of the articles with “riot” and in about 54% with the stem “loot.” Similarly, the stem “nation” is part of the two-word phrase “national guard” in about 24% of the articles about nonviolent events and 52% of the articles about violent events.
What About Police Violence?
Do protester tactics influence media coverage even when accounting for police violence (i.e., Table 2, Q3b)? I assess whether events that include protester violence (compared with nonviolent protests) increase media attention even when controlling for the presence of serious violence by police. Violence by protesters is predicted to seed news agendas whether or not the state engages in repression. Figure 11 uses variation in the DCA data to test the relationship between violence and three measures of New York Times coverage of black protests: articles per event, paragraphs per article, and page number. Using Poisson count regression, each outcome is modeled as a function of a binary variable for protester violence, a measure of police violence (on a scale of zero to two), an interaction of the two violence variables, and year fixed effects to account for possible time trends in coverage. In line with civil rights leaders, Gillion (Reference Gillion2013), and the agenda seeding model, violence by activists, even when accounting for police violence, is significantly associated with more articles, longer articles, and stories positioned closer to the front page (full results in Online Appendix).
Marginal Effects of Police and Protester Violence on New York Times Coverage

Do Police Tactics Shape Media Issue Frames?
The previous results show police violence associated with increased coverage of protests, but does repression change how protests get framed by media (i.e., Table 2, Q3c)? The agenda seeding model outlined in Figure 2 predicts protester tactics, not police response, drive issue framing. To test for an effect of police violence, Figure 12 presents a subset of the news data in Figure 10 and focuses on the two cases in which only protesters or police use violence (i.e., cases ii and iii from Figure 2). Consistent with predictions, the results in Figure 12 suggest violent repression against nonviolent protesters remained associated with “rights” framed coverage, whereas violent protests met by a restrained state were associated with “riots” framed articles. In short, independent of police repression, black-led nonviolent events were able to repeatedly construct frames conveying a fight for rights. Despite widespread anti-black racism, media routinely covered these disruptions as legitimate civil disobedience within dominant group norms. While individual nonviolent activists were harmed by police violence, the joint effect of increased coverage and greater “rights” framing actually often hurt the white supremacist cause and helped the larger civil rights movement. Conversely, events in which protester-initiated violence occurred, irrespective of police response, were much more likely to construct frames that played to dominant group biases and invoke language associated with disorder and social control.
Ratio of Term Frequencies in Articles (Protesters Nonviolent and State Violent/Protesters Violent and State Nonviolent)

DISCUSSION
Consistent with the proposed model, the evidence presented suggests (1) subordinate group activists are able to overcome political asymmetries to seed their concerns in news agendas, (2) activist tactics play a critical role in how the media frame issues, and (3) through their effects on media agenda setting and issue framing, nonviolent and violent protests contribute to different political outcomes. For elites, the crises around subordinate group political violence may have produced a desire for more generous social policy (Enos, Kaufman, and Sands Reference Enos, Kaufman and Sands2019; Fording Reference Fording1997; Skrentny Reference Skrentny1996) but, it appears, not without also increasing popular support for repression. Put another way, it may be that nonviolent and violent tactics can both generate policy “carrots” but the latter also greatly increases the risks of durable legislative “sticks.”
Some work on effects of political violence also suggests nonlinear or U-shaped relationships between disruption and political outcomes such that small “doses” potentially lead to beneficial outcomes and large “doses” lead to more repression (Berrebi and Klor Reference Berrebi and Klor2008). The results on political violence presented here draw inferences from a period in which more than 750 black-led protests escalated to violence, but it is entirely possible that fewer violent protests by a subordinate group might produce substantively different or null effects. In addition, the evidence here cannot address individual-level psychological processes. Prior scholarship in social psychology, though, finds feelings of intergroup sympathy and decreased ethnocentrism will tend to trigger less egoistic, more altruistic, and less hierarchical attitudes (Batson et al. Reference Batson, Polycarpou, Harmon-Jones, Imhoff, Mitchener, Bednar, Klein and Highberger1997); contribute to conflict resolution through more peaceful, democratic means (Sirin, Villalobos, and Valentino Reference Sirin, Villalobos and Valentino2016; Tuschman Reference Tuschman2013); and reduce ethnic bloc voting (Bishin et al. Reference Bishin, Hayes, Incantalupo and Smith2016).
Conversely, experimental work finds “extreme” protest tactics can undermine popular support for a movement by reducing “feelings of identification with the movement” (Feinberg, Willer, and Kovacheff Reference Feinberg, Willer and Kovacheff2020; McLeod and Detenber Reference McLeod and Detenber1999; Simpson, Willer, and Feinberg Reference Simpson, Willer and Feinberg2018). Increased ethnocentrism in the dominant group likely increases antipathy to outgroups and motivates greater concern for maintaining the existing social hierarchy (Behrens, Uggen, and Manza Reference Behrens, Uggen and Manza2003; Kinder and Kam Reference Kinder and Kam2010; Sidanius and Pratto Reference Sidanius and Pratto2001). More generally, a range of work finds news media often primes audiences with “crime scripts” that heighten negative affect toward African Americans and may induce feelings of fear (Banks and Hicks Reference Banks and Hicks2016; Gilliam and Iyengar Reference Gilliam and Iyengar2000; Marcus et al. Reference Marcus, Sullivan, Theiss-Morse and Stevens2005).
The model presented here may be more applicable to left-of-center, egalitarian-oriented movements than right-of-center, hierarchy-oriented groups due to different agendas and media dynamics (Williamson, Skocpol, and Coggin Reference Williamson, Skocpol and Coggin2011). Social movements also have effects beyond agenda seeding such as through development of local institutions and long-term capacity building among activists. Finally, although many patterns of ethnic conflict are likely to be similar across regime types, this theory and evidence addresses protests in ethnically heterogeneous democratic (or semi-democratic) states like Britain, Canada, and India and may not generalize to more homogeneous democracies with less social stratification or more authoritarian polities that lack electoral politics or an independent media. That said, almost all democracies now face growing levels of migration and immigration that contribute to greater ethnic heterogeneity, hierarchy, and contestation.
CONCLUSION
This article presents a systematic analysis of protest tactics on public opinion, elite discourse, and voting behavior with particular attention to causal identification. While strong research designs have shown effects of political violence on voting (c.f., Berrebi and Klor Reference Berrebi and Klor2008; Getmanksy and Zeitzoff Reference Getmanksy and Zeitzoff2014) and protests on social policy (Fording Reference Fording1997), and economic development (Collins and Margo Reference Collins and Margo2007), along with Enos, Kaufman, and Sands (Reference Enos, Kaufman and Sands2019), this paper is among the first to estimate a causal effect of protests on voting. The theory and results suggest that subordinate group activists, not just elites, can seed local and national agendas and construct frames in ways that grow or shrink egalitarian coalitions through strategic disruption and choice of tactics.
Critically, in the case of the 1960s black freedom struggle, these results suggest that nothing in the contest between the more egalitarian and order-maintenance political coalitions was inevitable. These findings suggest that the “transformative egalitarian” coalition identified by Rustin (Reference Rustin1965), King and Smith (Reference King and Smith2005) and others was fragile but, in the absence of violent protests, would likely have won the presidential election of 1968. In this counterfactual scenario, the United States would have elected Hubert Humphrey, lead author of the Civil Rights Act of 1964, rather than Richard Nixon. In the absence of white antipathy to black uprisings, the “law and order” coalition would not have carried the day and, possibly, not developed a durable campaigning and governing strategy for the next half century.
Around the world, subordinate group activists confront powerful dominant groups and face difficult choices about whether and how to assert their interests. Strategies like nonviolent disruption can grow sympathetic coalitions but may also result in humiliation, injury, and death at the hands of police, soldiers, and vigilantes. More nationalist-oriented strategies like responding to police violence in-kind can directly counter repression and capture the attention of elites but risk alienating potential allies and provoking even greater social control. In the 1960s, African American activists and thinkers deliberated over both strategies. Ella Baker (Reference Ransby2003) and Bayard Rustin (Reference Rustin1965) helped organize nonviolent civil disobedience while Malcolm X argued, “I don’t call it violence when it’s self-defense, I call it intelligence” Malcolm X Reference John Henrik1969. A substantial body of work in political science suggests we should expect no meaningful political consequences to follow subordinate group agitation. The results of this article suggest that statistical minorities in stratified democracies can overcome structural biases to influence and frame the news, direct elite discourse, sway public opinion, and win at the ballot box. For subordinate groups in democratic polities, though, tactics matter. An “eye for an eye” in response to violent repression may be moral, but this research suggests it may not be strategic.
SUPPLEMENTARY MATERIAL
To view supplementary material for this article, please visit https://doi.org/10.1017/S000305542000009X.
Replication materials can be found on Dataverse at: https://doi.org/10.7910/DVN/HVRCKM.


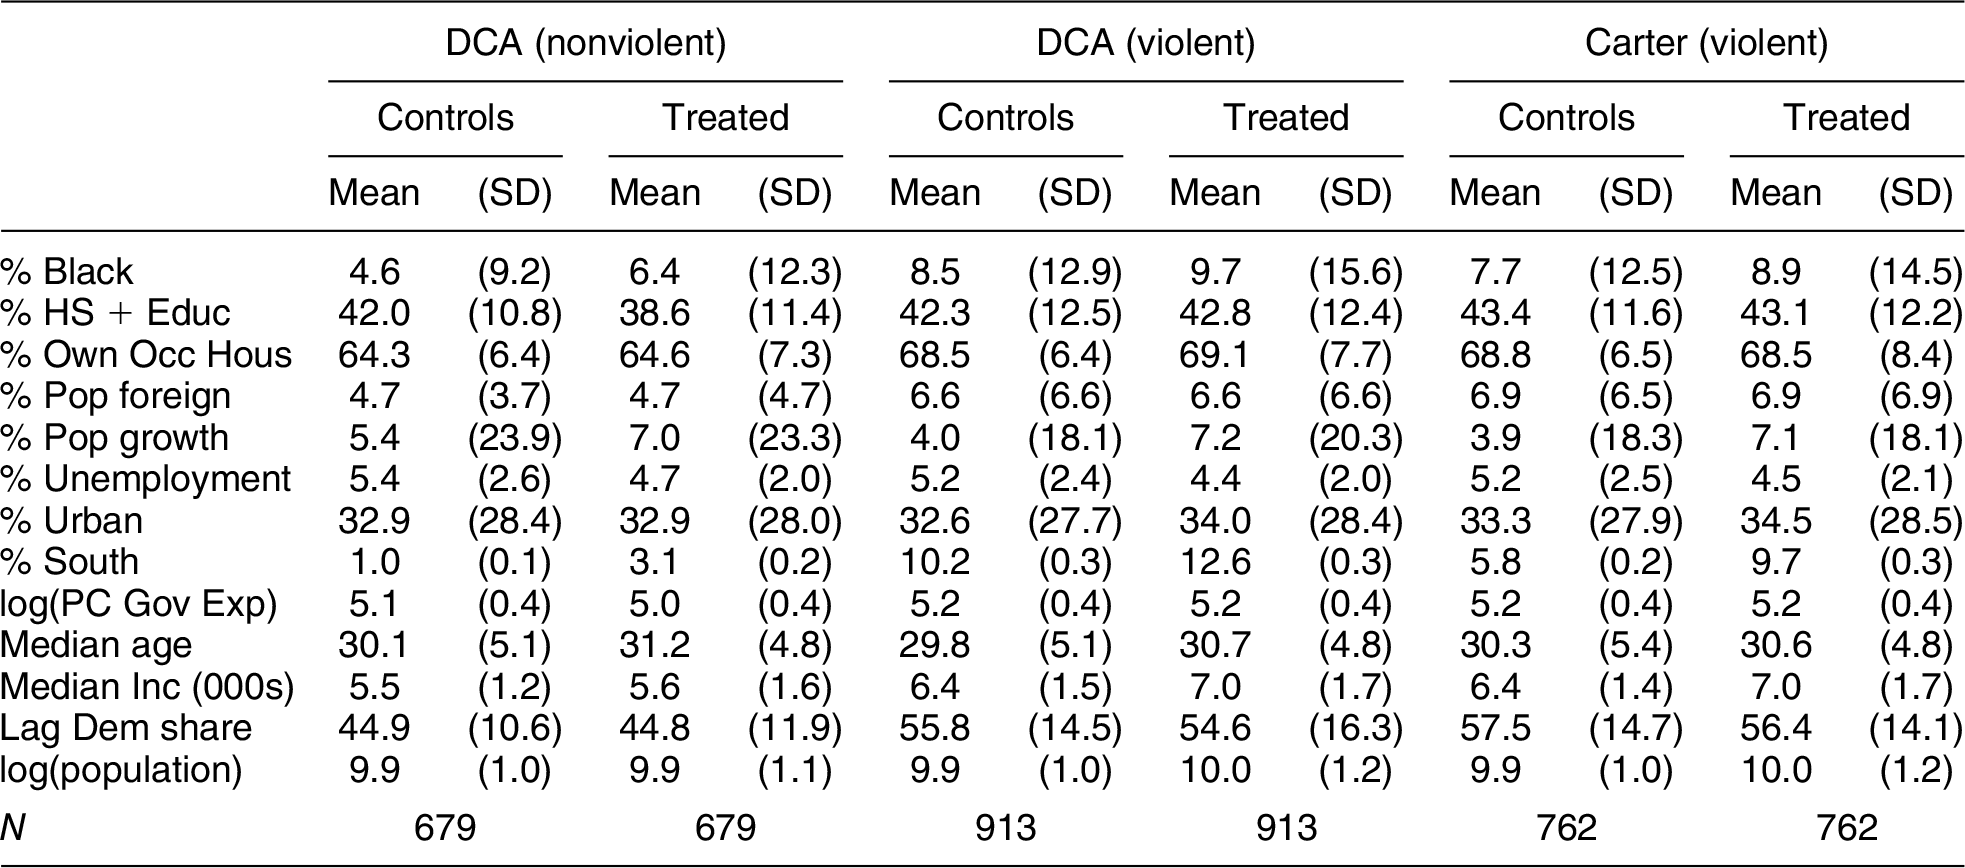


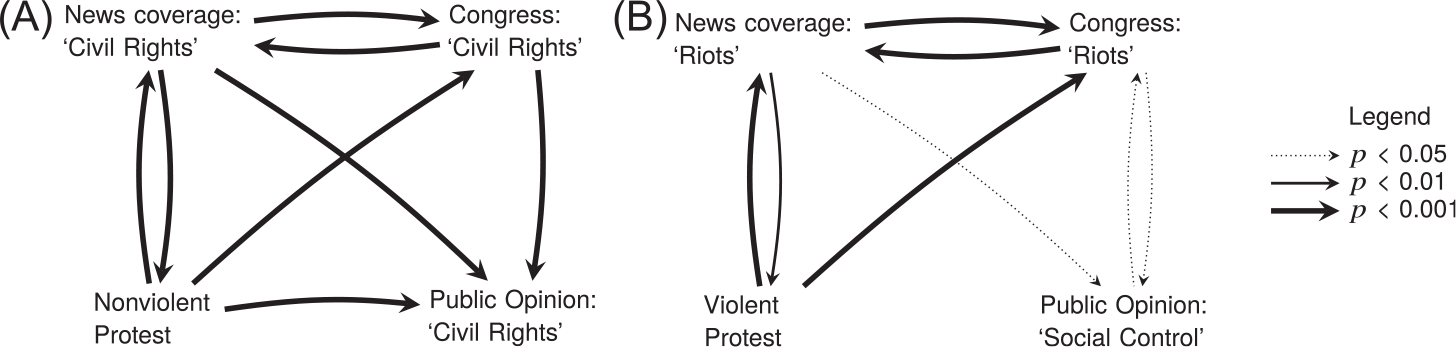


 Open access
Comments
No Comments have been published for this article.