


Dietary proteins are well known to induce insulin secretion both with and without carbohydrate co-ingestion in healthy(Reference van Loon, Saris, Verhagen and Wagenmakers1–Reference Calbet and Holst7) and diabetic subjects(Reference Manders, Wagenmakers, Koopman, Zorenc, Menheere, Schaper, Saris and van Loon8, Reference Manders, Koopman, Sluijsmans, van den Berg, Verbeek, Saris, Wagenmakers and van Loon9). Dietary proteins are also found to induce glucagon secretion(Reference Calbet and MacLean5, Reference Calbet and Holst7, Reference Rocha, Faloona and Unger10, Reference Hall, Millward, Long and Morgan11). The balance between the insulin and glucagon response is important for the regulation of postprandial substrate oxidation(Reference Claessens, Calame, Siemensma, Saris and van Baak12, Reference Lejeune, Kovacs and Westerterp-Plantenga13) and also plays a role in cholesterol metabolism(Reference McCarty14–Reference Hubbard, Kosch, Sanchez, Sabate, Berk and Shavlik16). It is therefore interesting to know how this ratio can be affected by the type and dose of a protein and its form (intact or hydrolysed). We have demonstrated previously that the magnitude of the glucagon response varies more with the protein type than the magnitude of the insulin response does, which was influenced more by carbohydrate co-ingestion(Reference Claessens, Calame, Siemensma, van Baak and Saris17).
Spiller et al. (Reference Spiller, Jensen, Pattison, Chuck, Whittam and Scala18) and Kabadi(Reference Kabadi19) have looked at the effect of protein dose on insulin and/or glucagon secretion previously. In the former study the effect of a protein range between 0 and 49·9 g absolute protein with a carbohydrate load of 58 g on plasma insulin was tested. The protein source was a mixture of intact milk and soya protein(Reference Spiller, Jensen, Pattison, Chuck, Whittam and Scala18). Kabadi, on the other hand, studied the effect of 0·25 to 2 g protein hydrolysate/kg body weight (BW), of which the composition and degree of hydrolysis was not clearly stated on insulin and glucagon secretion(Reference Kabadi19). While Kabadi found that insulin secretion was more affected by amount of protein hydrolysate than glucagon secretion, Spiller et al. did not find a clear effect of protein dose on insulin secretion(Reference Spiller, Jensen, Pattison, Chuck, Whittam and Scala18). Whether this difference is due to the protein form, protein source or due to co-ingestion of carbohydrates is not clear. Proteins can be ingested as intact protein, protein hydrolysates or as free amino acids. A faster increase in plasma amino acids after consumption of protein hydrolysate compared with intact protein has been suggested for casein, but not for proteins from other sources such as whey protein(Reference Calbet and Holst7). Protein hydrolysates containing mainly di-, tri- and tetra-peptides have also been found to be absorbed faster than free amino acid mixtures of the same composition both in rats(Reference Poullain, Cezard, Roger and Mendy20) and human subjects(Reference Grimble, Keohane, Higgins, Kaminski and Silk21). Furthermore, the chain length of peptides has an important influence on the absorption rate of partially hydrolysed proteins(Reference Grimble, Keohane, Higgins, Kaminski and Silk21). Short peptides containing two and three amino acids can be absorbed by specific PEPT1 transporters and be hydrolysed intracellularly after absorption(Reference Grimble, Keohane, Higgins, Kaminski and Silk21–Reference Daniel23). Some of these short peptides may escape intracellular hydrolysis, since recently low concentrations of circulating bioactive di- and tri-peptides have been reported(Reference Foltz, Meynen, Bianco, van Platerink, Koning and Kloek24).
In addition, protein source has also been found to influence the absorption rate. This has led to the grouping of proteins into fast and slow digestible proteins(Reference Dangin, Boirie, Garcia-Rodenas, Gachon, Fauquant, Callier, Ballèvre and Beaufrère4, Reference Hall, Millward, Long and Morgan11, Reference Boirie, Dangin, Gachon, Vasson, Maubois and Beaufrere25, Reference Dangin, Boirie, Guillet and Beaufrere26). In this regard, fast digestible proteins are soluble and ingested and absorbed fast, while slow digestible proteins clot in the stomach and lead to a slower gastric emptying and intestinal absorption(Reference Boirie, Dangin, Gachon, Vasson, Maubois and Beaufrere25).
Little is known about the effect of protein fractionation on hormonal and metabolic responses and how these effects are influenced by the source of protein. Previously, van Loon and colleagues recommended the use of protein hydrolysate rather than intact protein to stimulate insulin secretion because protein hydrolysate consumption resulted in a faster increase in plasma amino acid concentrations(Reference van Loon, Saris, Verhagen and Wagenmakers1). However, this recommendation is based on comparison of responses to intact protein (casein) and protein hydrolysates (whey, pea and wheat) from different sources.
The aim of the present study was to investigate the responses of glucagon and insulin to ingestion of different amounts of intact and hydrolysed proteins. Soya and whey protein were chosen as examples of a fast vegetable(Reference Luiking, Deutz, Jakel and Soeters27) and a fast animal protein(Reference Boirie, Dangin, Gachon, Vasson, Maubois and Beaufrere25).
Subjects and methods
Subjects
Twenty-four healthy non-obese male subjects participated in the present study. Twelve subjects participated in the trials in which soya protein and its hydrolysate were tested (age 28 (sem 2·9) years, weight 72·2 (sem 2·8) kg, height 1·82 (sem 0·04) m, BMI 24·0 (sem 0·9) kg/m2). Another twelve subjects participated in the trials in which whey protein and its hydrolysate were tested (age 23·8 (sem 1·3) years, weight 79·8 (sem 2·6) kg, height 1·89 (sem 0·03) m, BMI 22·0 (sem 0·4) kg/m2). All subjects were informed about the nature and risks of the experimental procedures and informed consent was obtained. The local medical ethical committee approved the study.
Experimental design
The study consisted of two sets of six trials. In the first set of trials intact soya protein (SPI) and soya protein hydrolysate (SPH) were tested in three concentrations each (0·3, 0·4 and 0·6 g/kg BW; energy density 5, 7 and 10 kJ (1·2, 1·6 and 2·4 kcal)/kg BW, respectively). In the second set of trials intact whey protein (WPI) and whey protein hydrolysate (WPH) were tested in the same three concentrations. In both sets of trials subjects consumed all six drinks in random order (by means of Latin-square randomisation). All protein and hydrolysate beverages were sweetened with aspartame and the pH of all beverages was adjusted pH 3·3–3·5 in a standard way with citric acid. Protein hydrolysates were made via an enzymic procedure and the molecular-weight profiles of both hydrolysates are depicted in Table 1. The amino acid composition of the hydrolysates was determined by HPLC analysis (Lithium system; Jeol Inc., Tokyo, Japan) of free amino acids after precipitation of large peptides and proteins and compared with results of standard samples. Amino acid profiles of the different test drinks are given in Table 2. SPI and SPH beverages were uniformly vanilla flavoured, while WPI and WPH beverages were uniformly chocolate flavoured. Since both flavours did not contain any carbohydrates or other energy-containing ingredients, addition of the flavours did not add carbohydrates or energy to the test drinks. Beverages ( ± 250 ml) were offered in opaque drinking bottles in order to obtain single-blind trials. Testing days were separated by at least 2 d. At testing days, subjects came to the laboratory after an overnight fast and were asked to avoid heavy physical activity the day before the trials and to keep their eating pattern as constant as possible.
Molecular-weight profiles of soya and whey protein hydrolysates (%)

Amino acid composition of soya and whey protein hydrolysates (percentage total dry product)

* Asx = asparagine+aspartic acid; Glx = glutamate+glutamine.
Protocol
After at least 10 h fasting, subjects reported to the laboratory where a Teflon catheter (Baxter BV, Utrecht, The Netherlands) was inserted into an antecubital vein and a resting blood sample was drawn (t = 0). Then subjects were offered the test drink, which they had to consume as quickly as possible within 5 min. Blood samples were drawn 15, 30, 60, 90 and 120 min after finishing the test drink.
Blood analyses
Blood was collected in EDTA-containing tubes for glucose, insulin, glucagon, lactate and urea analysis. EDTA blood to which aprotinin (5 kIU/ml blood; Sigma-Aldrich Chemie BV, Zwijndrecht, The Netherlands) was added was used for glucagon analysis. After collection the blood sample was centrifuged at 1000 g at 4°C for 10 min. Samples of plasma were frozen immediately in liquid N2 and stored at − 45°C. Glucose was analysed with the COBAS FARA semi-automatic analyser (Roche Diagnostica, Basel, Switzerland). Insulin was analysed by RIA (Human Insulin Specific RIA kit, LINCO, St Charles, MO, USA), as was glucagon (Glucagon RIA kit; LINCO).
Statistics
All data are expressed as mean values with their standard errors for twelve subjects per group. Plasma glucose, insulin and glucagon responses were calculated as total area under the curve (AUC) (AUC above – AUC below baseline). Statistical analyses were performed by using SPSS for Mac OS X software (SPSS Inc., Chicago, IL, USA). To analyse whether intact protein induced different responses (as total AUC) from protein hydrolysates a mixed-design ANOVA was used with protein form (intact, hydrolysate: two levels) and amount of protein (0·3, 0·4, 0·6 g/kg BW: three levels) as within-subject factors and protein form × amount of protein as an interaction term. When these tests revealed that protein form or amount of protein induced significantly different total AUC regarding insulin, glucagon, glucose, lactate or urea more extensive mixed-design ANOVA analyses were used to determine at what time point differences were situated. In these extended analyses amount of protein was included in the model as a between-subject variable, with protein form (two levels) and time (0, 15, 30, 60, 90, 120 min: six levels) as within-subject factors.
To analyse the effect of ingestion of different amounts of protein and protein hydrolysate on hormonal and metabolic responses a mixed-design ANOVA was used with amount of protein (three levels) and time (six levels) as within-subject factors and amount of protein × time as an interaction term. Protein form was inserted in the model as a between-subject variable. At a P level of 0·05 or less, results were considered significantly different.
Results
Intact protein v. protein hydrolysate
Soya protein
Mixed-design analysis showed that SPI induced significantly higher total AUC for insulin than SPH (P = 0·018) (Fig. 1). Further analyses revealed that the difference over time between SPI and SPH was due to a difference in the initial rise in insulin concentrations (Fig. 2). No significant interaction terms were found. Total AUC for glucagon was also significantly higher after SPI compared with SPH (P < 0·001) (Fig. 1) while the interaction between protein form and amount of protein was not significant (P = 0·196). Further analyses showed that, like for insulin, SPI induced a faster increase in glucagon compared with SPH (Fig. 2). With respect to total AUC for glucose, no overall effect of protein form was found for soya (P = 0·146).
Total areas under the curve (AUC) for insulin (a and b), glucagon (c and d) and glucose (e and f) after ingestion of intact protein or protein hydrolysate at 0·3 (■), 0·4 ( ) or 0·6 (
 ) g/kg body weight (BW) with soya (a, c and e) or whey (b, d and f) as the protein source. Values are means, with their standard errors represented by vertical bars. * Mean value is significantly different from that for 0·6 g/kg BW (P < 0·05). † Mean value is significantly different from that for 0·4 g/kg BW (P < 0·05). ‡ Mean values are significantly different from those for the hydrolysed protein (independent of protein load) (P < 0·05).

Insulin (a and b), glucagon (c and d) and glucose (e and f) responses after ingestion of intact and hydrolysed soya (a, c and e, respectively) or whey protein (b, d and f, respectively). ( ), Intact proteins; (
 ), hydrolysed proteins. Values are means, with their standard errors represented by vertical bars. * Significantly different slope from the corresponding hydrolysed protein (P < 0·05).

Whey protein
In the case of whey protein no significant difference regarding total AUC for insulin between WPI and WPH was found (P = 0·754) (Fig. 1). Also total AUC for glucagon was not significantly different between WPI and WPH (P = 0·249) but the interaction between protein form and amount of protein was significant (P = 0·002), showing that total AUC for glucagon increased significantly more with increasing protein amount after WPH than WPI (P = 0·004 for 0·3 v. 0·4 g/kg BW, P = 0·001 for 0·3 v. 0·6 g/kg BW and P = 0·560 for 0·4 v. 0·6 g/kg BW). With respect to total AUC for glucose, no overall effect of protein form was found (P = 0·980).
Dose–response effect of proteins and protein hydrolysates
Soya protein
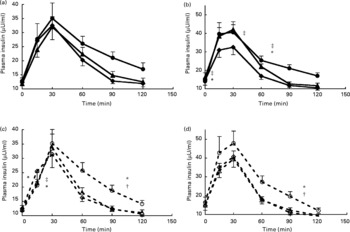
The overall test of mixed-design ANOVA analysis showed that there was a significant increase in total AUC for insulin with increasing amount of soya protein (P = 0·001) (Fig. 1). Further analyses showed that, for SPI, amount of protein and time induced both significant differences in insulin responses (P = 0·031 and P < 0·001, respectively). The interaction between amount of protein and time was not significant (P = 0·262), showing that the pattern of insulin changes over time was not significantly influenced by the amount of protein (Fig. 3). Tests of within-subject contrasts showed that differences were present between 0·3 and 0·6 g SPI/kg BW (P = 0·011) and between 0·4 and 0·6 g SPI/kg BW (P = 0·041) but not between 0·3 and 0·4 g/kg BW (P = 0·963) (Fig. 1). In case of SPH, similar results were found (P = 0·022, P = 0·05 and P = 0·897, respectively). The interaction term amount of protein × time for SPH was also significant (P = 0·010), with the difference being that a higher protein load mainly resulted in a faster rise in plasma insulin but in general also in a slower decrease (Fig. 3c).
Insulin responses with increasing protein dose for intact soya protein (a), intact whey protein (b), hydrolysed soya protein (c) and hydrolysed whey protein (d). (), Intact protein 0·3 g/kg body weight (BW); ( ), intact protein 0·4 g/kg BW; (
 ), intact protein 0·6 g/kg BW; (
 ), hydrolysed protein 0·3 g/kg BW; (
 ), hydrolysed protein 0·4 g/kg BW; (
 ), hydrolysed protein 0·6 g/kg BW. Values are means, with their standard errors represented by vertical bars. * Significantly different slope for 0·3 v. 0·6 g protein/kg BW (P < 0·05). † Significantly different slope for 0·4 v. 0·6 g protein/kg BW (P < 0·05). ‡ Significantly different slope for 0·3 v. 0·4 g protein/kg BW (P < 0·05).
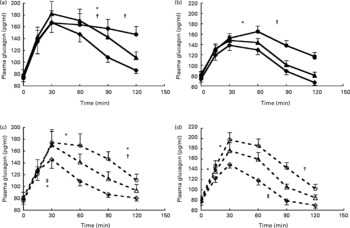
The overall test for total AUC for glucagon was also significant (P < 0·001) (Fig. 1) and further analysis over time showed that both for SPI and SPH the effects of protein amount (P < 0·01), time (P < 0·001) and protein amount × time (P < 0·001) were significant. Tests of within-subject contrasts showed that differences for both SPI and SPH were found between 0·3 and 0·4 g/kg BW (P < 0·05), and 0·3 and 0·6 g/kg BW (P < 0·01), and only for SPH between 0·4 and 0·6 g/kg BW (P = 0·05) (Fig. 1). Figure 4 a, c show that consumption of increasing amounts of soya protein did not affect the initial rise in plasma glucagon significantly but ingestion of SPI and SPH at 0·6 g/kg BW induced a sustained increase in plasma glucagon.
Glucagon responses with increasing protein dose for intact soya protein (a), intact whey protein (b), hydrolysed soya protein (c) and hydrolysed whey protein (d). (), Intact protein 0·3 g/kg body weight (BW); (), intact protein 0·4 g/kg BW; (), intact protein 0·6 g/kg BW; (), hydrolysed protein 0·3 g/kg BW; (), hydrolysed protein 0·4 g/kg BW; (), hydrolysed protein 0·6 g/kg BW. Values are means, with their standard errors represented by vertical bars. * Significantly different slope for 0·3 v. 0·6 g protein/kg BW (P < 0·05). † Significantly different slope for 0·4 v. 0·6 g protein/kg BW (P < 0·05). ‡ Significantly different slope for 0·3 v. 0·4 g protein/kg BW (P < 0·05).
Analysis of total AUC for glucose showed no significant differences with increasing protein loads.
Whey protein
Also for whey protein, increasing amounts of protein induced significantly higher total AUC for insulin (P < 0·001) (Fig. 1). Further analysis showed that for WPI insulin responses were significantly higher after 0·4 and 0·6 g WPI/kg BW compared with 0·3 g WPI/kg BW (P = 0·002 and P = 0·001) but not between 0·4 and 0·6 g WPI/kg BW (P = 0·060) (Figs. 1 and 3b). The interaction term amount of protein × time was also significant for WPI (P = 0·007), with the difference being that a higher protein load mainly resulted in a faster rise in plasma insulin but in general also in a slower decrease. No significant effect of amount of protein was found for WPH (P = 0·064 for the overall test).
The overall test for total AUC for glucagon was also significant for whey protein (P < 0·001 in both cases) (Fig. 1). Figure 4b shows that, like for soya protein, consumption of increasing amounts of intact protein did not affect the initial rise in plasma glucagon significantly but ingestion of 0·6 g WPI/kg BW induced a sustained increase in plasma glucagon. Ingestion of increasing amounts of WPH did result in a faster rise in plasma glucagon after 0·6 v. 0·3 g WPH/kg BW but also in a faster decrease between 90 and 120 min after consumption (Fig. 4d).
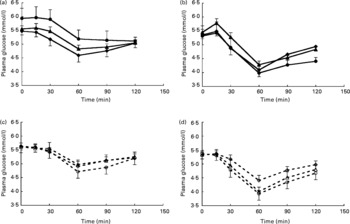
Analysis of total AUC for glucose showed that for whey protein total AUC for glucose significantly decreased with increasing protein loads (P = 0·001) (Fig. 1) although the overall test for analysis of patterns over time did not reach significance (P = 0·054) (Fig. 5).
Glucose responses with increasing protein dose for intact soya protein (SPI) (a), intact whey protein (WPI) (b), hydrolysed soya protein (SPH) (c) and hydrolysed whey protein (WPH) (d). (), Intact protein 0·3 g/kg body weight (BW); (), intact protein 0·4 g/kg BW; (), intact protein 0·6 g/kg BW; (), hydrolysed protein 0·3 g/kg BW; (), hydrolysed protein 0·4 g/kg BW; (), hydrolysed protein 0·6 g/kg BW. Values are means, with their standard errors represented by vertical bars. There were no significant differences between different concentrations of SPI, SPH, WPI or WPH as determined by repeated-measures ANOVA analysis.
Discussion
In the present study ingestion of SPI was found to result in a more rapid increase in insulin and glucagon concentrations than ingestion of its hydrolysed form, while no significant differences were found for whey protein. Furthermore, glucagon responses increased with protein load in a dose-dependent way for both intact soya and whey protein and their hydrolysates. Insulin concentration appeared to be less influenced by protein load than glucagon.
Intact protein v. protein hydrolysate
A fast vegetable (soya protein(Reference Luiking, Deutz, Jakel and Soeters27)) and a fast animal protein (whey protein(Reference Boirie, Dangin, Gachon, Vasson, Maubois and Beaufrere25)) were studied. We expected for both proteins that protein hydrolysates would induce faster insulin and glucagon responses than intact protein, because di- and tri-peptides are efficiently taken up and further hydrolysed into free amino acids by enterocytes(Reference Smith and Morton22, Reference Daniel23, Reference Rérat, Nunes, Mendy and Roger28, Reference Sleisenger and Kim29). Calbet & Holst reported more rapid increases in plasma amino acid concentrations after ingestion of hydrolysates(Reference Calbet and Holst7). Energy density, rather than solute osmolality, affects gastric emptying(Reference Calbet and MacLean6, Reference Brouns, Senden, Beckers and Saris30). Although we did not measure plasma amino acid profiles, this would suggest that the gastric emptying rate for an intact protein and protein hydrolysate at similar protein dose should be similar. This might not be the case for proteins that, in their intact form, clot in the stomach and in this way delay gastric emptying. Because of that feature, these proteins might be digested and absorbed more slowly. Until now, the only protein known to form clots in the stomach is casein. As might be expected, the more rapid increase in plasma amino acids after consumption of the hydrolysed v. intact protein in human subjects has only been described for casein(Reference Calbet and Holst7). In contrast to our hypothesis, SPI induced a faster increase in both insulin and glucagon, which resulted in significantly higher total AUC after SPI than SPH. However, the size of the difference between SPI and SPH is small and is unlikely to be of physiological significance. In the case of whey protein, no significant difference in insulin or glucagon response, expressed as total AUC, was found, which is in agreement with the study of Calbet & Holst(Reference Calbet and Holst7). The molecular-weight profiles of SPH and WPH were similar, showing that in theory similar amounts of di- and tri-peptides should have been present in both types of hydrolysates. The observation that both protein hydrolysates contained similar amounts of free amino acids (3 and 2·5 % of WPH and SPH, respectively) supports this assumption. Although we do not have a clear explanation for the more rapid response in SPI compared with SPH it could be that soya protein is metabolised in a different way from whey protein. It has been reported that the biological value of soya protein is inferior to that of casein(Reference Luiking, Deutz, Jakel and Soeters27). The biological value of whey protein has not been studied as extensively as that of soya protein and casein. The protein quality is thought to be dependent on the degree and velocity by which the protein is digested, absorbed as amino acids, and retained in the gut as newly synthesised protein(Reference Luiking, Deutz, Jakel and Soeters27). SPI seems to be ingested and absorbed by the splanchnic area rapidly and also degraded rapidly in the liver into urea, resulting in reduced uptake by the peripheral tissues (like skeletal muscle)(Reference Luiking, Deutz, Jakel and Soeters27, Reference Bos, Metges, Gaudichon, Petzke, Pueyo, Morens, Everwand, Benamouzig and Tomé31, Reference Fouillet, Mariotti, Gaudichon, Bos and Tome32). It is possible that consumption of partly hydrolysed soya protein results in an even faster absorption of free amino acids and in an even more reduced uptake by peripheral organs. When amino acids are rapidly removed from circulation, their insulin- and glucagon-stimulating capacity might be reduced. Although this hypothesis should be studied more carefully, this might explain why for soya protein the intact form induced faster insulin and glucagon responses than its hydrolysed form.
Dose–response effect of intact protein and protein hydrolysates
The effect of protein dose on insulin or glucagon responses has been studied poorly. In the present study we found a dose-dependent relationship between protein load and insulin and glucagon response, although the dose effect was more pronounced for glucagon than for insulin (Figs. 1, 3 and 4). Spiller and colleagues studied the effect of increasing intact protein (mixture of milk and soya protein) (0, 15·8, 25·1, 33·6 and 49·9 g) with a constant carbohydrate load ( ± 58 g) on insulin concentrations(Reference Spiller, Jensen, Pattison, Chuck, Whittam and Scala18). This study showed that the protein–carbohydrate mixtures induced significantly higher insulin responses than the carbohydrate load alone, which is similar to previous findings from our group(Reference Claessens, Calame, Siemensma, van Baak and Saris17), but they did not find an effect of protein dose. Kabadi studied the effect of increasing amounts of amino acid mixtures (0·25, 0·5, 1 and 2 g/kg BW) without carbohydrates on both insulin and glucagon secretion(Reference Kabadi19). This study did find a dose-dependent increase of insulin and glucagon concentrations, in agreement with the present study, although in their study insulin was affected more by protein load than glucagon(Reference Kabadi19). The fact that Spiller et al. did not find a dose effect on insulin is unlikely to be due to the dose range studied, which was similar to ours. An explanation could be that the maximal capacity for insulin secretion by pancreatic β-cells was reached already when the lowest amount of protein was co-ingested with the carbohydrate load(Reference Spiller, Jensen, Pattison, Chuck, Whittam and Scala18).
Furthermore, we found that glucagon responses were more dependent on protein load and that this effect was more pronounced for the hydrolysed proteins as compared with the intact proteins. This is also in agreement with the observation of Rérat et al. who reported that, in pigs, insulin production was less influenced by amount of protein than glucagon production(Reference Rérat, Nunes, Mendy and Roger28). Consumption of increasing amounts of proteins will cause higher concentrations of plasma amino acids, which are associated with higher plasma glucagon levels(Reference Calbet and MacLean5). Kabadi, on the other hand, suggested the opposite(Reference Kabadi19). The much higher protein amounts used by Kabadi could explain these conflicting findings. As Kabadi suggested already, the increase in plasma glucagon may have reached a plateau with the protein meal of 1 g/kg BW(Reference Kabadi19). Since our highest protein load was far below 1 g/kg BW this might explain why in the present study we did find a dose-dependent increase in plasma glucagon concentrations. Because proteins are generally not very tasteful, especially when hydrolysed, and difficult to dissolve, we have chosen a maximum protein load of 0·6 g/kg BW. Furthermore, this dose might still be applicable for practical use. Like in the present study, though, Kabadi also found sustained glucagon concentrations over 3 h after ingestion(Reference Kabadi19). The prolonged stimulation of glucagon might be due to the fall in glucose concentrations after protein consumption due to the protein-induced insulin response. Therefore, differences in glucagon responses to different protein loads might be indirectly enlarged by insulin-induced reductions in glucose concentrations.
It has previously been demonstrated that when proteins and carbohydrates are co-ingested, the effect on insulin concentrations are synergistic(Reference Calbet and MacLean5, Reference Claessens, Calame, Siemensma, van Baak and Saris17). If and at which dosages a maximal insulin response is reached remains to be investigated. How carbohydrate co-ingestion would affect protein-induced glucagon secretion is likely to depend on the carbohydrate dosage, since glucagon secretion is controlled by both plasma amino acids and the change in glucose concentrations(Reference Schwartz, Clutter, Shah and Cryer33).
In conclusion, we found that insulin and glucagon concentrations increased more and faster after intact soya protein than after its hydrolysate, while no difference between intact whey protein and its hydrolysate were found. Therefore, no general recommendation with respect to the use of intact protein or hydrolysates to stimulate a rapid insulin and glucagon response can be made because differences between intact protein and its hydrolysate may be protein specific. Although protein hydrolysation did not influence insulin and glucagon responses substantially in the present study, where we tested only fast digestible proteins, it is likely that for casein, a slow digestible protein, the intact protein does induce different hormonal responses from the hydrolysed form.
Within the dose range studied (0·3–0·6 g/kg BW), insulin and glucagon both increased dose dependently but the effect was more pronounced for glucagon than for insulin.
Acknowledgements
The studies described in this article, that were performed in the laboratories of the authors, were financially supported by Kerry Bio-Science, Almere, The Netherlands. W. H. M. S. was the principal investigator and designed the study together with M. C. who performed the study. M. C. and M. A. v B. interpreted the data and wrote the initial draft of the manuscript. W. H. M. S., M. C. and M. A. v B. provided substantive editorial comments on manuscript drafts. There are no conflicts of interest.
The authors would like to thank Dr W. Calame and Dr A. D. Siemensma from Kerry Bioscience for their contributions and fruitful discussions.



