

Introduction and recording process
Current approaches in Roman epigraphy include using 3D modelling techniques to record artefacts and share the data online. Although the full potential of 3D modelling for such tasks has yet to be realised, methods such as shape from shading, reflectance transformation imaging or the exaggerated shading technique have been applied to enhance inscriptions virtually, in order to provide better clarity for epigraphic texts (e.g. Rusinkiewicz et al. Reference Rusinkiewicz, Burns and DeCarlo2006; Earl et al. Reference Earl, Beale, Martínez and Pagi2010).
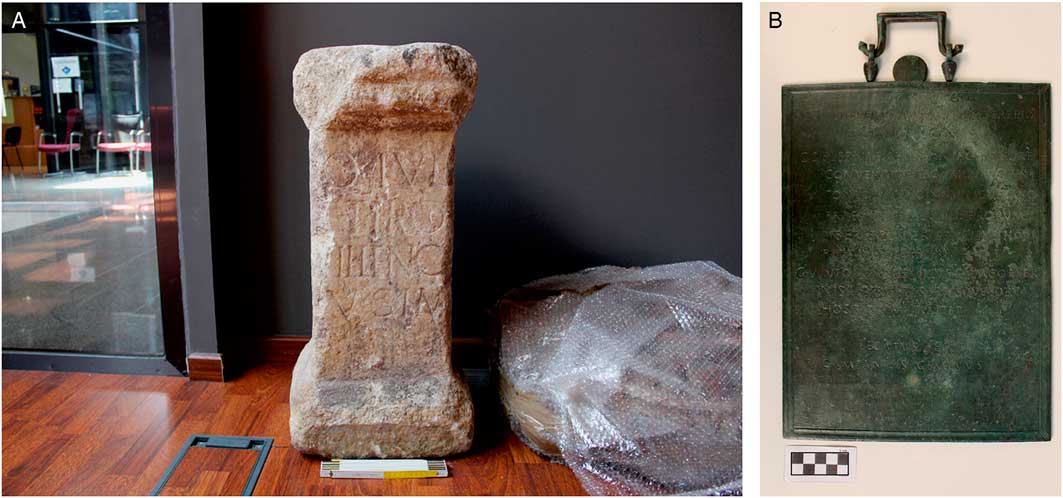
We propose the application of non-photorealistic rendering (NPR) techniques to extract text information from 3D models of Roman inscriptions, using line drawings to represent 3D shapes. Two inscriptions from Galicia in north-west Spain are considered here. The first is a votive altar from Viloira (Rodríguez Colmenero Reference Rodríguez Colmenero1997: nº 130) (Figure 1: A); the second, a hospitality tabula from Castromao (Rodríguez Colmenero Reference Rodríguez Colmenero1997: nº 610) (Figure 1: B). Structure from motion photogrammetry was used to create the 3D models (following Verhoeven Reference Verhoeven2011; Agisoft Reference Agisoft2012). Photographs were taken using a Canon EOS 1200D reflex camera, and the 3D models were created with the commercial software Agisoft Photoscan.
A) Viloira’s votive altar; B) Castromao tabula. Photographs by the authors.
Line drawings for automatic extract text information
The use of multiple line drawings such as edges, silhouettes or contours to bring geometry and shading in scenes or objects are techniques widely used in art. While artists may utilise their visual perception and experience to make their own decisions concerning which lines are relevant for indicating expressiveness, we employ computer-generated line-drawing techniques to produce effective drawings through mathematical algorithms (Rusinkiewicz et al. Reference Rusinkiewicz, Cole, DeCarlo and Finkelstein2008). Some of them are well known, such as the canny edge detector, already applied for archaeological purposes; rock art engravings, for example (Díaz-Andreu et al. Reference Díaz-Andreu, Brooke, Rainsbury and Rosser2006).
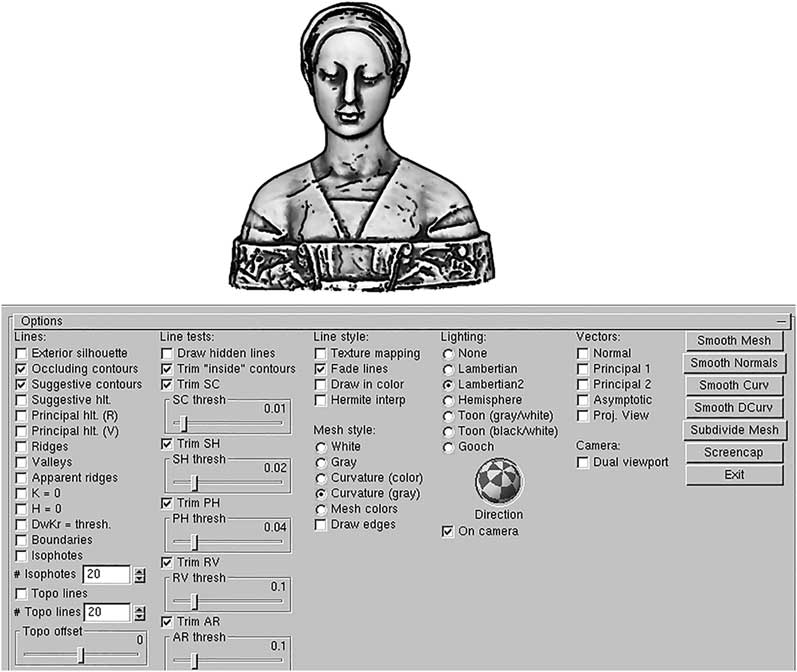
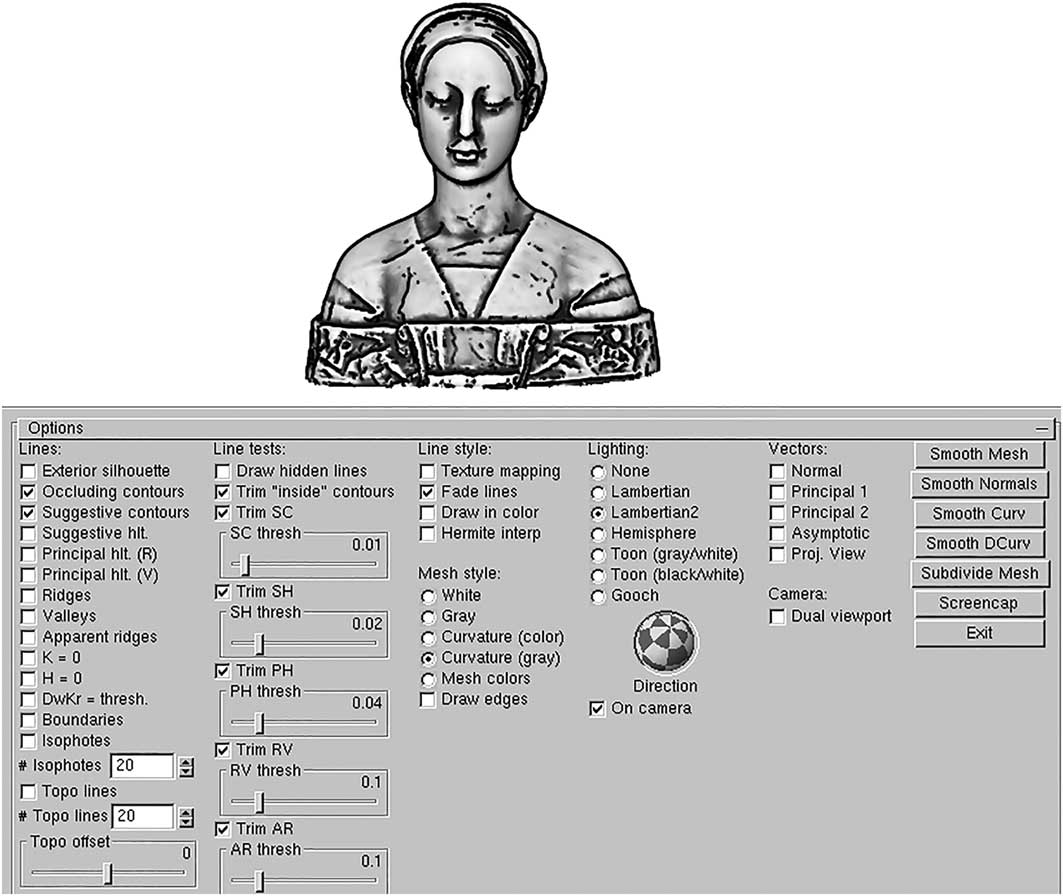
We used real-time suggestive contours (RTSC) software (http://gfx.cs.princeton.edu/proj/sugcon/) to generate automatic drawing lines over 3D models. This software includes algorithms to compute drawing lines, such as occluding and suggestive contours, suggestive and principal highlights, ridges, valleys and apparent ridges, among other functions (DeCarlo et al. Reference DeCarlo, Finkelstein, Rusinkiewicz and Santella2003; DeCarlo & Rusinkiewicz Reference DeCarlo and Rusinkiewicz2007; Judd et al. Reference Judd, Durand and Adelson2007) (Figure 2).
3D model of Laurana’s bust, produced using real-time suggestive contours (RTSC) software, showing suggestive and occluding contours.
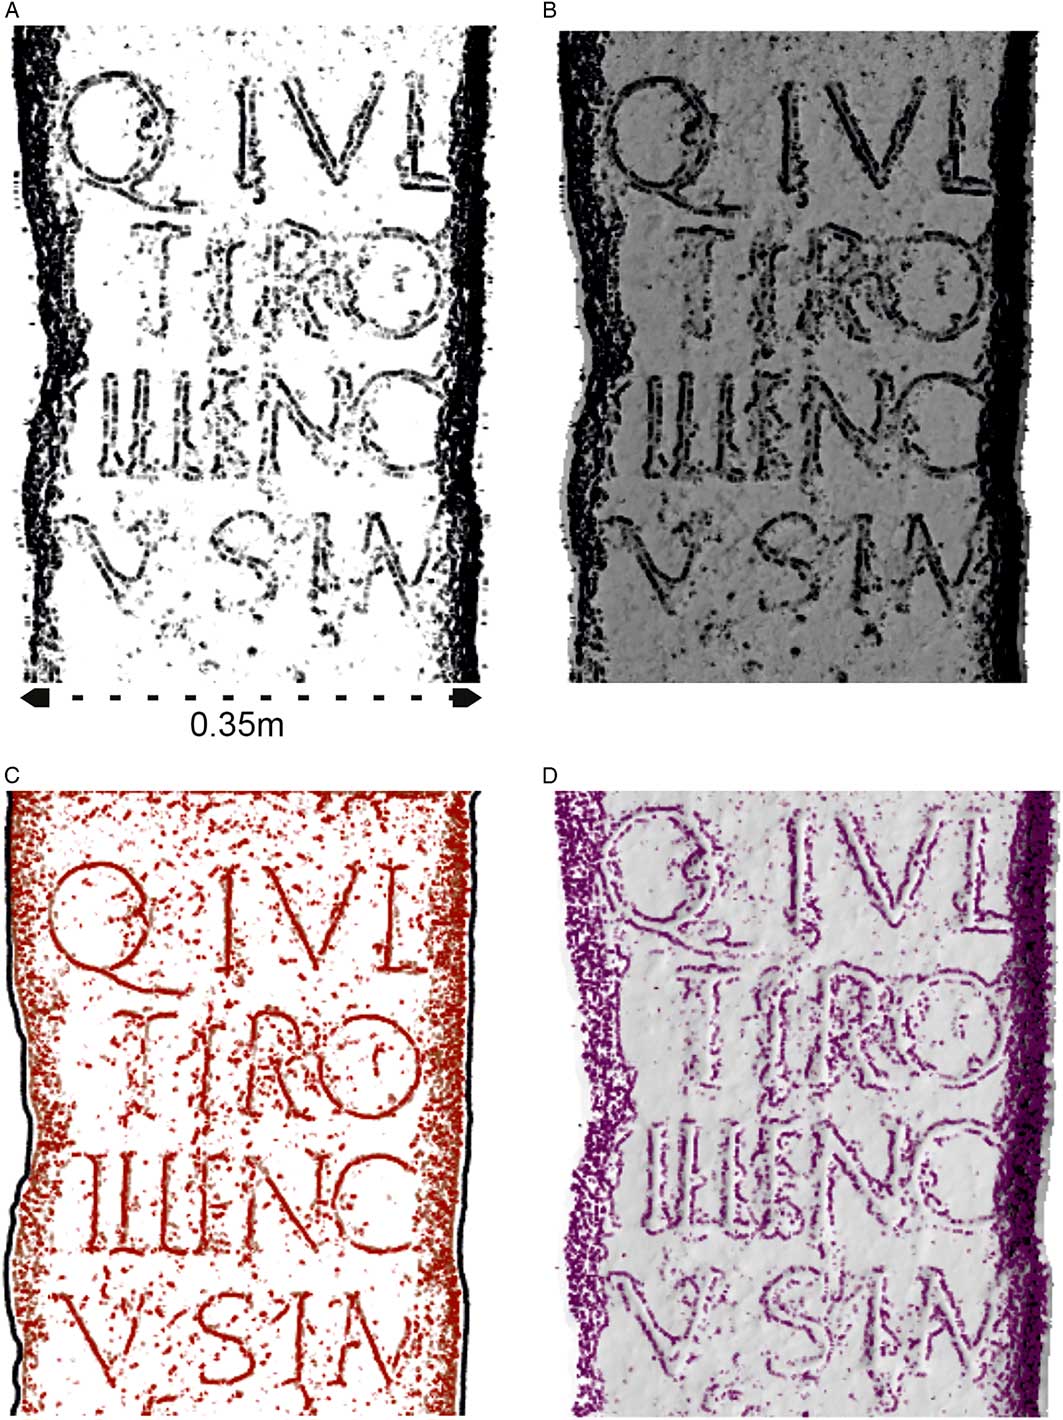
Application of line drawings over the Viloira altar’s 3D model shows that different lines can be employed to extract the epigraphic text of the inscription (Figure 3). We first applied a digital smoothing tool to the 3D model to eliminate the microsurface details, preserving both occluding and suggestive contours to enhance the letters (Figure 3: A). The text can be more clearly depicted by using the curvature (grey) and the Lambertian lighting, as shown in Figure 3 (B). Principal highlights (threshold: 0.00179) and valleys (threshold: 0.0804) (Figure 3: C), or only the ridges (threshold: 0.625) (Figure 3: D), can also be applied.
Viloira’s 3D model with different line drawing types: A) occluding contours and suggestive contours; B) occluding contours and suggestive contours, with the mesh coloured by curvature (grey) and Lambertian lighting; C) principal highlights and valleys; D) ridges. Images extracted from RTSC software.
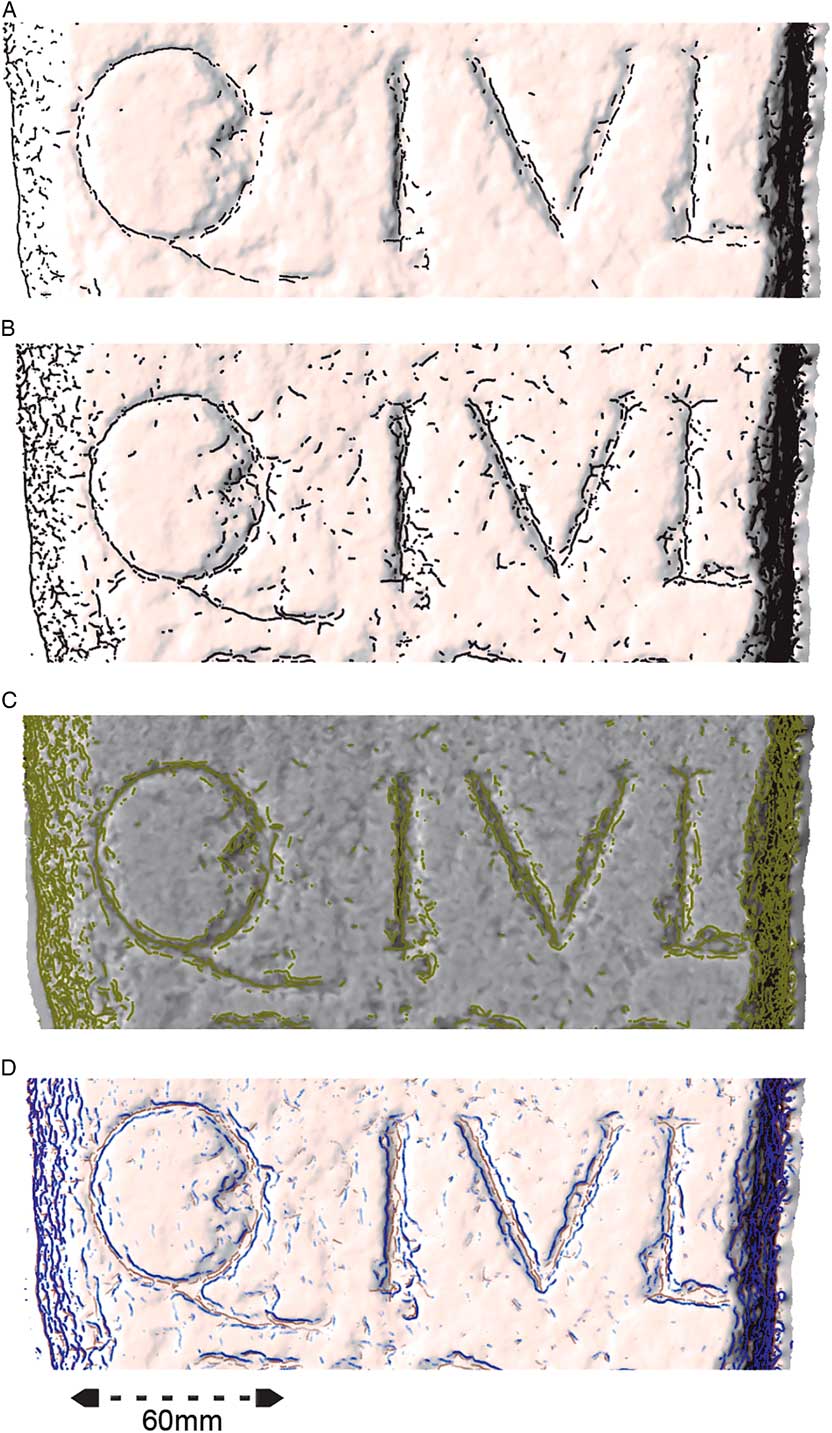
A critical aspect of the procedure is the delineation of the threshold, the value modifying the extent to which lines are drawn, so it changes the results. Figure 4 shows how the threshold affects the line drawing creation, centred on the first line ‘Q(uintus) Iul(ius)’. In Figure 4 (A–B), valleys are represented with different threshold values that modified how lines convey the letter shapes. The lower the threshold, the more noise was introduced, although the letters were better defined. The application of apparent ridges (Figure 4: C)—another type of contour—seems to enhance the letters, although better results were obtained by combining suggestive contours (blue) and valleys (brown) (Figure 4: D).
Detail of the text Q(uintus) Iul(ius): A) valleys (threshold: 0.161); B) valleys (threshold: 0.0848); C) apparent ridges (threshold: 0.0179); D) suggestive contours (threshold: 0.00536) and valleys (threshold: 0.0714). Images extracted from RTSC software.
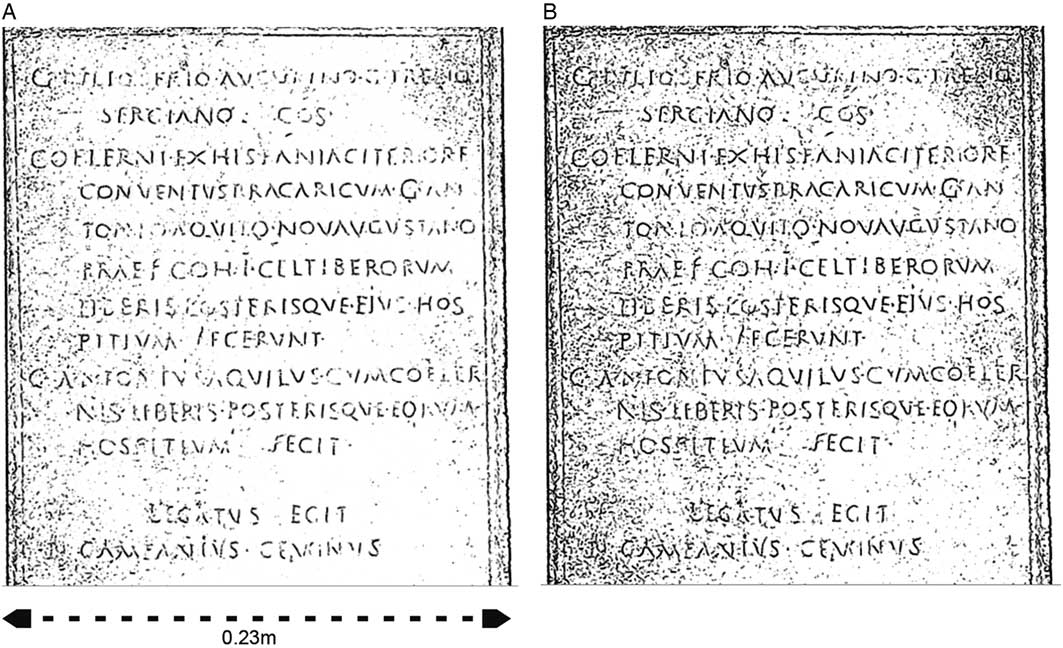
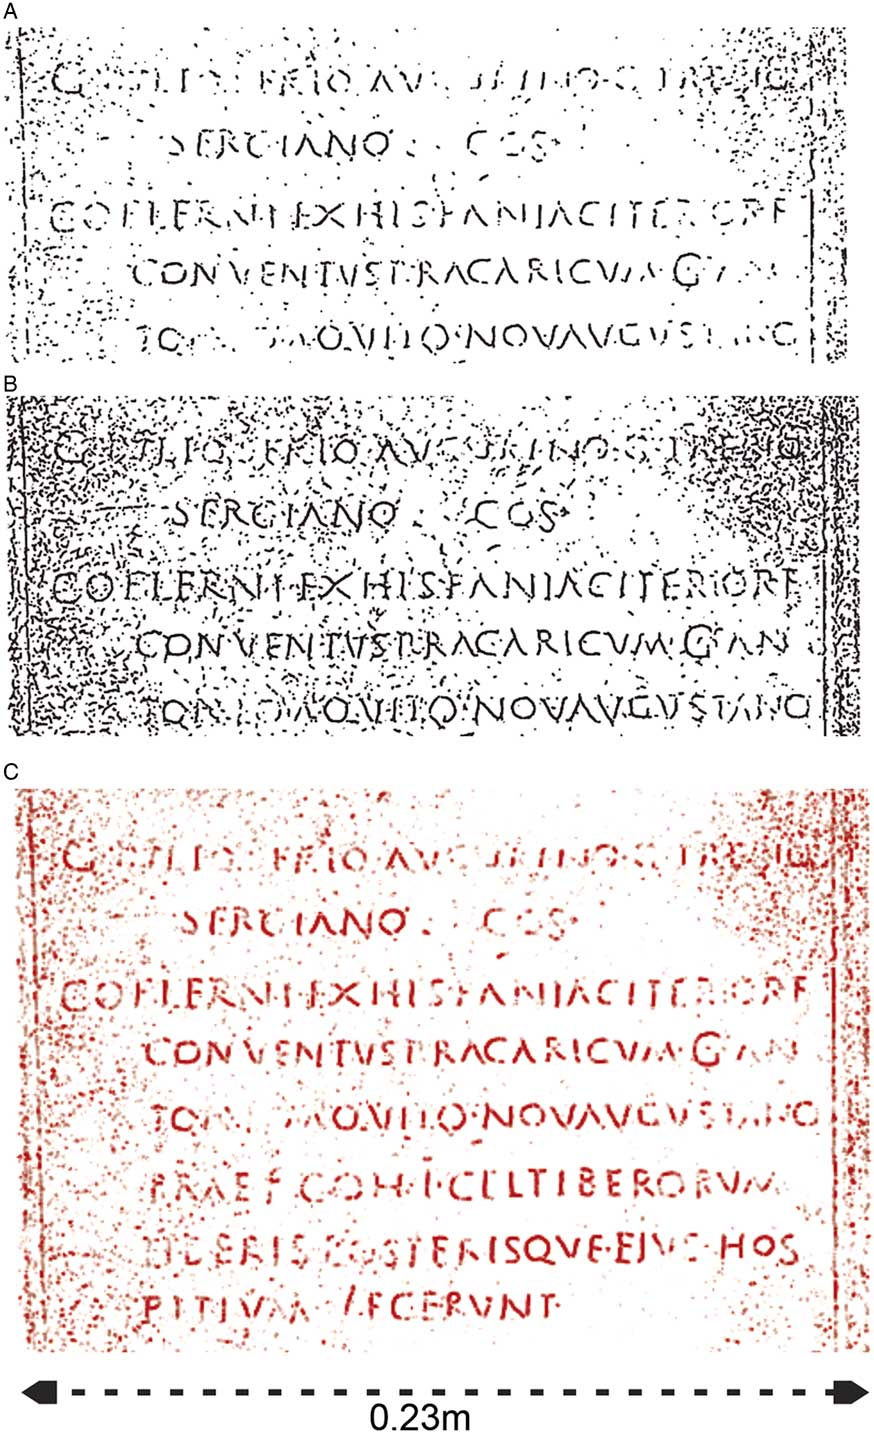
Analysis of the Castromao tabula provides clearer results. The use of only valley lines highlights the inscribed text, the threshold level once again proving critical (Figure 5). Although a high threshold eliminates much of the noise, some letters are not visible (Figure 5: A). Reducing the threshold value (Figure 5: B) makes the whole text readable, but generates more noise. This is also apparent in Figure 6, which focuses on the top of the plaque. A combined approach with principal highlights and valleys is the best way to visualise the letters, although, again, the threshold influences the results strongly (cf. Figure 6: A–B). The colour version is recommended for better results (Figure 6: C).
Valley lines of Castromao tabula: A) threshold: 0.272; B) threshold: 0.17. Images extracted from RTSC software.
Detail of the first lines of the Castromao tabula, using principal highlights and valleys to enhance the letters: A) principal highlights threshold: 0.0268; valley threshold: 0.29; B) principal highlights threshold: 0.0268; valley threshold: 0.129; C) coloured version: principal highlights threshold: 0.0268; valley threshold: 0.129. Images extracted from RTSC software.
Conclusions
We propose the application of new techniques to study the surface of 3D epigraphic models. A combination of different line types seems the most useful approach in highlighting textual information, although high noise results when applying this to extremely deteriorated inscriptions. It is necessary to use NPR approaches to complement traditional and computer-aided epigraphic methods.
Acknowledgements
The authors thank the Council of O Barco de Valdeorras and the Archaeological Museum of Ourense for the access to the inscriptions. The 3D model of Laurana’s bust was obtained from MeshLab (http://meshlab.sourceforge.net).