


Introduction
On 25 May 2020, George Floyd was killed by police in Minneapolis, Minnesota. Scenes of a White police officer kneeling on a Black man's neck ignited widespread protests, not only against police brutality and racism, but also against wider, long-term, systemic racism affecting Black people. These demonstrations, and the public conversations around them, have focused attention on how racism has shaped contemporary society. In this article, we use computational text analysis to explore how ideas of racism have influenced the history of archaeology.
Topics relating to race and racism have long been discussed in the humanities and social sciences, but how have archaeologists engaged in these discussions? There have been prominent archaeological studies of racism that address the long history of race and racism in human societies (e.g. Orser Reference Orser1998; Gosden Reference Gosden2006; Mullins Reference Mullins2006; Voss Reference Voss2008; Matthews & McGovern Reference Matthews and McGovern2015; Hall Reference Hall2015). We wonder, however, how representative of the wider discipline these are. To understand how the majority of archaeologists have engaged with racism over time, we investigate the conference abstracts of 41 annual meetings of the Society for American Archaeology (SAA). We use these textual data to investigate how often, and in what contexts, archaeologists use terms relating to racism, applying a variety of computational text analysis methods at corpus, document and sentence levels. To explore the responsiveness of SAA meeting presentations to contemporary social issues relating to race, we model relationships between word frequencies in annual meeting abstracts and social events related to anti-Black racism, such as the assassination of Martin Luther King in 1968 and the 1992 riots in Los Angeles triggered by police brutality against Rodney King.
Methods and materials
To investigate the contexts in which archaeologists write about racism, we examine the texts of abstracts from meetings of the Society for American Archaeology. Using keywords related to racism (‘race’, ‘racial’, ‘racism’ and ‘racist’), we analyse word frequencies and proportions, topic models, word similarities, keyword-in-context, and linear regressions with dates and frequencies of social events related to anti-Black racism. Our R code and data files are openly available online at: https://doi.org/10.17605/OSF.IO/2N3RF. All the results and figures presented here can be reproduced using the code and data in our compendium.
We obtained the texts of 68 176 abstracts of oral presentations and posters from SAA annual meeting programmes by downloading them from the SAA website (https://www.saa.org/annual-meeting/programs/abstract-archives, as of July 2020). This archive contains data for 41 meetings held in 1962–1994 and 2004–2020. The website provides no explanation for the missing records between 1995 and 2003. The data include a mix of searchable text PDF files and image-based PDF files; we converted the latter to PNG files and then extracted text from the image files into plain text files using optical character recognition by means of the tesseract package (Ooms Reference Ooms2022). The PDFs with searchable text were converted into plain text files using the pdftools package (Ooms Reference Ooms2020). Further details of these file, image and text processing steps are available at: https://doi.org/10.5281/zenodo.4971836.
We imported the plain text files into R and used the quanteda package (Benoit et al. Reference Benoit2018) to prepare and analyse the text. We removed punctuation, numbers and stopwords (e.g. ‘the’, ‘a’, ‘and’) of little semantic value to our question. Following standard practice in text analysis, we divided each annual programme into 5000-word segments (‘documents’) to generate units of analysis that are large enough to measure word co-occurrences and short enough to contain a small number of distinct themes (Jockers & Mimno Reference Jockers and Mimno2013; Sbalchiero & Eder Reference Sbalchiero and Eder2020; Uglanova & Gius Reference Uglanova, Gius, Karsdop, McGillivray, Nerghes and Wevers2020). We explored a range of different segment sizes and found that 5000 words (approximately 15 abstracts) resulted in highly coherent and interpretable results. We then constructed a document feature matrix (Imai Reference Imai2018), where rows represent documents, columns correspond to words, and cell values are the frequency of words in each document.
The purpose of our corpus level (i.e. the entire set of documents) analysis is to understand the broad chronological and thematic patterns reflecting how archaeologists have engaged with racism. We use two methods at this level: word frequencies and topic modelling. For word frequencies, we selected a group of keywords commonly used when discussing racism: ‘race’, ‘racial’, ‘racism’ and ‘racist’. We then compute the frequency of these keywords per year and examine their proportion in relation to the total number of words per year to discern the general patterns of keyword use over time.
Topic modelling is an unsupervised machine-learning technique that automatically identifies groups of related words, known as topics (because they are often similar to manually identified topics), within a corpus. Topics generated by this procedure may be interpreted as themes or concepts present in the corpus. We use the Latent Dirichlet allocation topic modelling algorithm (Blei Reference Blei2012), which is widely employed in large-scale text analysis and information extraction (Hall et al. Reference Hall, Jurafsky, Manning, Lapata and Ng2008). The Latent Dirichlet allocation implementation contained in the stm package (Roberts et al. Reference Roberts2014) is applied to a document feature matrix that includes words (i.e. features) occurring a minimum of 50 times in total and across a minimum of two documents.
The Latent Dirichlet allocation algorithm infers topic clusters from a statistical model of word distributions that assumes that each document contains a mixture of a given number (specified in advance) of topics. To find the optimal number of topics in our corpus, we examined the co-occurrences of ‘anchor words’ after projecting them onto a low-dimensional space, as described by Mimno and Lee (Reference Mimno, Lee, Moschitti, Pang and Daelemans2014). This resulted in an estimate of 80 topics for our specific corpus. While every word is included in every topic, what makes a topic distinctive is the ranking of each word in that topic. The output generated by Latent Dirichlet allocation allows us to describe each document (i.e. each set of 15 abstracts or 5000-word segments of each programme) as a unique mixture of topics. This enables us to see which topics are most prominent in the corpus overall, and how the popularity of the different topics in the corpus changes over time, from document to document (e.g. from year to year). We analyse the topics by extracting the highest ranked words associated with each topic, and then by examining topics that include our race-related keywords to identify the themes associated with racism in the abstracts. Finally, we assess the popularity of race-related topics in the corpus over time.
At the document level (i.e. chunks of 5000 words), we analyse words associated with our keywords using similarity statistics. We compute the pairwise Jaccard similarity between words that occurred a minimum of 100 times in total and across a minimum of five documents. If two words have a high similarity, their proportion of counts relative to all word counts over time follow similar trajectories (Jockers Reference Jockers2013). To gain insights into the use of keywords related to racism in SAA abstracts, we visualise the top 20 words with the strongest similarities to each of our keywords.
At the sentence level, we use keyword-in-context analysis to explore how the keywords are used in their sentence contexts in the abstracts. This technique is premised on an observation from linguistics that the meaning of a word can be inferred from its neighbours in a sentence (Jockers Reference Jockers2013). We use a window size of five words around each keyword and visualise the 20 most informative context words occurring before and after each keyword in sentences in the abstracts. We identify the most informative words before and after each keyword by ranking all words in the window by their ‘term frequency-inverse document frequency’ (tf-idf). This tf-idf ranking method increases the weight of rarer words relative to very commonly used words, so that the most informative words are highly ranked (Silge & Robinson Reference Silge and Robinson2017).
To explore the relationships between the use of racism-related keywords in SAA abstracts with societal events around race-related issues, we compute negative binomial regression models (Friendly & Meyer Reference Friendly and Meyer2015), with the annual frequency of events relevant to anti-Black racism as the predictor variable and the frequency of keywords as the response variable. Our source of relevant social events is the ‘Timeline of African-American history’ on Wikipedia (https://en.wikipedia.org/wiki/Timeline_of_African-American_history, accessed on 1 June 2021), which lists 709 events between 1526 and 2021. These events include court decisions affecting Black people or notable Black individuals, major protests relating to the treatment of Black people, major accomplishments by Black public figures and notable crimes with Black victims. We explore lag values of one to six years in our models to allow for a delay between the occurrence of a social event and reactions to it appearing in SAA meeting presentation abstracts. There is usually an eight-month gap between the deadline for abstract submissions and the annual SAA meeting, so we do not model the relationship between societal events and abstracts within the same calendar year.
Results
At the corpus level, keywords relating to racism are rare but have been continuously used, especially in the 2000s, with minor variations (Figure 1). The keywords have generally very low frequencies, indicative of their overall rarity in archaeology discourse. After 2005, as the number of presentations at SAA annual meetings increased, so do the proportion of abstracts that mention racism. The proportion of abstract text related to racism increases after 2015 and decreases after 2018, following the overall trend in the total number of abstracts.
A) Total number of all words per year; B) average word counts for all words per abstracts per year; C) proportion of race-related keywords per year, defined by the total number of our four keywords divided by all words in each year (figure by the authors).

Still at the corpus level, our topic model output shows that the highest ranked words in the top 20 most frequently mentioned topics in the corpus are not closely related to racism (Figure 2). Race-related keywords appear in only four out of the 80 topics detected. Although these four topics are prominent, the keywords are not highly ranked, occurring only in the tail of the keyword distribution. Topics including race keywords relate to heritage and politics, local history and community projects, and the individual and landscapes. Our time series analysis shows high variability in the most abundant topics, but not for those containing race keywords, which show only a slight increase in the late 2000s.
Visualisations of the topic model: top left panel) the top 20 topics most frequently detected in the corpus of Society for American Archaeology abstracts. The seven words next to each bar are the terms most prominent in that topic; top right panel) all topics that contain race-related keywords; bottom panel) changes in the abundance of topics that include race-related keywords over time, on a background of all topics shown as grey lines (each data point is one document) (figure by the authors).

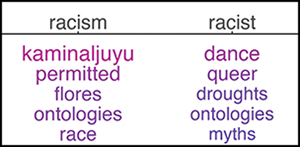
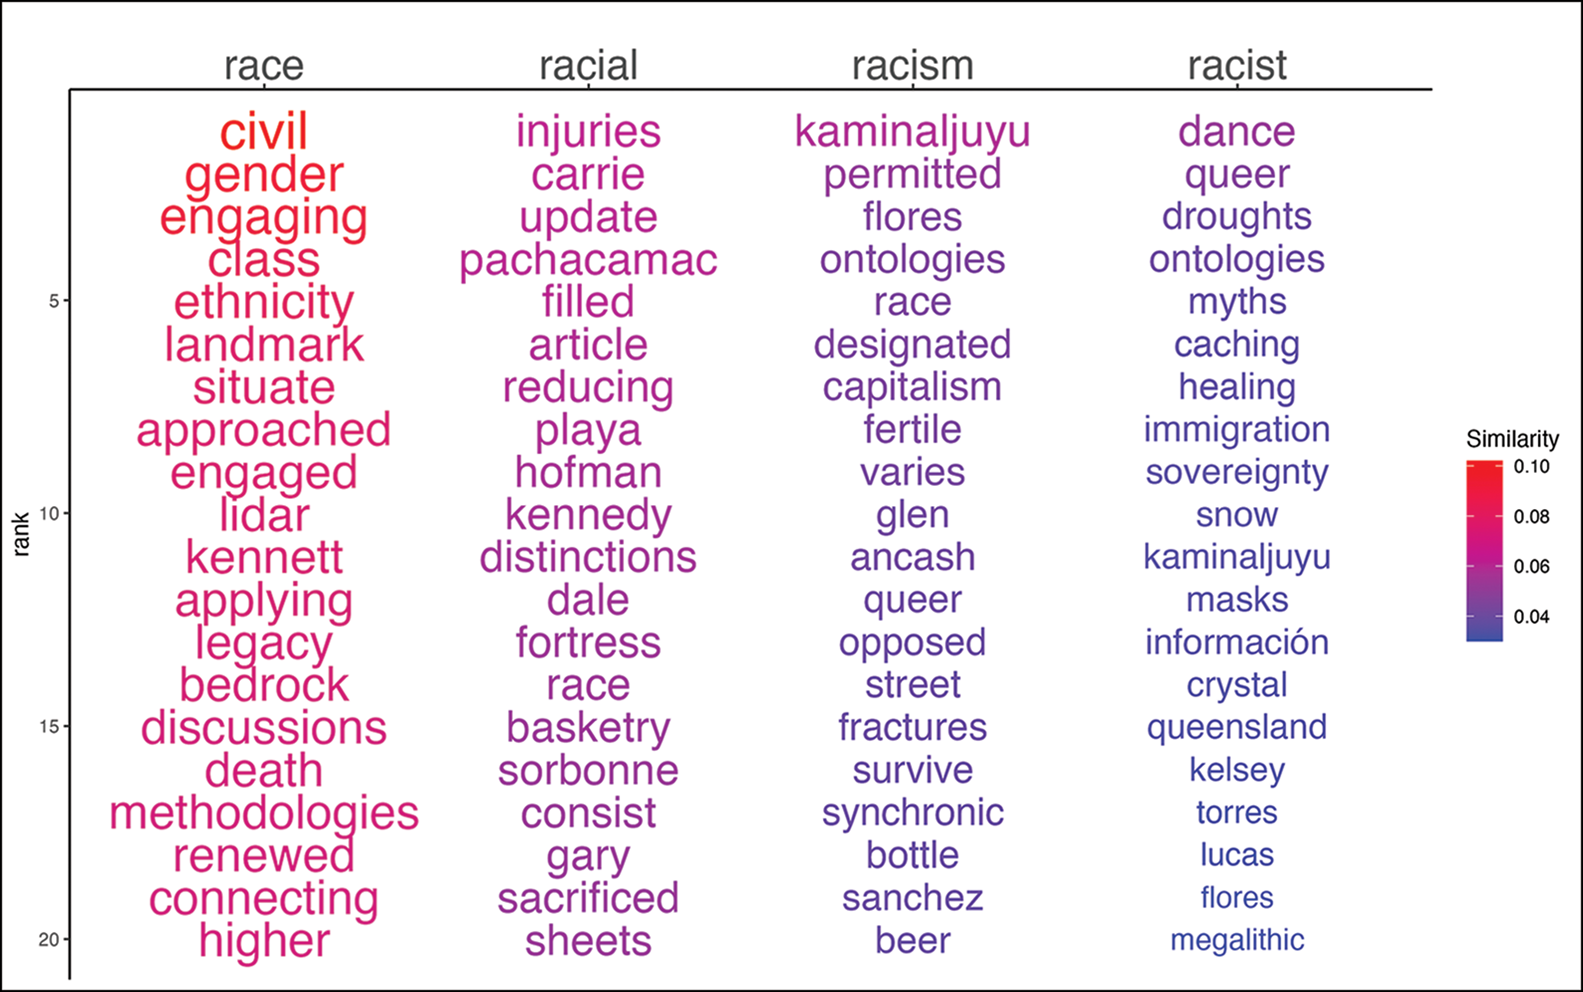
At the document level, word similarity analysis shows that the use of race-related keywords intersects with related social issues, especially ‘race’ which also has the highest similarity values of all our keywords (Figure 3). For example, we see ‘gender’ and ‘class’ associated with ‘race’, and ‘sovereignty’ and ‘queer’ with ‘racist’. We also observe, however, that most words identified as highly similar are not semantically related to our keywords, which indicates that, where race keywords were used in abstracts, they are usually a minor aspect of the main topic and are often a passing mention in the context of broader systemic issues, such as gender, class and inequality.
Visualisation of word similarity within documents. The colour and size of the words represent the strength of the similarity (a value of 1 indicates identical words). For example, ‘race’ and ‘racial’ are close to ‘civil’ and ‘injuries’ (figure by the authors).
The keyword-in-context analysis shows that our keywords are often located directly adjacent to semantically relevant words (Figure 4). We can infer from these results that archaeologists recognise the European colonial origins of racial thinking (e.g. ‘colonial’ and ‘colonialist’ appearing as top context words in Figure 4), and how it has resulted in social and economic segregation and inequality. As with the word similarity results, the keyword-in-context results reveal that race is typically discussed in combination with intersecting social issues; indeed, the word ‘intersection’ is often used by archaeologists when writing about race.
Output from the keyword-in-context analysis. The words in red in the centre of each panel are our keywords. The words to the left and right of these are the top 15 context words that appear immediately before or after the keyword in the abstracts. The larger font is used for words that appear more frequently (figure by the authors).

We found a significant temporal correlation between archaeologists writing about racism and racism-related historical events in America in the form of a slight negative relationship at the one-year lag (Figure 5) following such events. This suggests that fewer discussions of racism took place in the year following a given societal event, although the effect is minor. There are non-significant negative relationships for 2–6 year lagged correlations (p >0.05). Overall, we found no substantial relationships between the volume of discussion of racism in archaeological research at SAA meetings and the number of relevant contemporary events.
Top left) frequency of African-American historical events over time; top right) estimates and their 95 per cent confidence intervals for each linear model of the annual frequencies of racism keywords in Society for American Archaeology abstracts and counts of African-American historical events. Significant relationships are indicated when the confidence interval excludes zero; lower panels) negative binomial models with lags of 1–6 years to explore the effect of delays between an historical event and its effect on archaeological research (figure by the authors).

Discussion
Few archaeologists will be surprised that race and racism have not been major topics at SAA annual meetings. But when these topics are addressed, what are the contexts of the discussions? Our topic model shows that racism keywords are notably present in a small number of automatically detected topics but are not highly weighted in any of them. In other words, they are not part of a readily distinguishable discrete topic but are part of the background mixtures of words that define the topics in the SAA corpus. From our close reading of the abstracts, we find that the weak appearance of race-related topics in our topic model is explained by racism keywords being most frequently mentioned in passing, typically being listed along with other broad structural issues, such as class and economic conditions. To validate this observation, we examined all trigrams (three consecutive words in a sentence) starting with ‘race’, and found that the most frequent are ‘race, class, and’ (n = 8), ‘race and class’ (n = 6), ‘race and gender’ (n = 5), with all but one of these combinations appearing after 2004.
Our word similarity results confirm this observation about race and broader social issues, but also reveal some unique details not observed in the topic model. We see some negative associations, for example between ‘racial’ and ‘injuries’. One example is an abstract from 2016 by John Crandall that explores American violence and westward expansion using bioarchaeological data to document injuries sustained in race-related conflicts from the mid-seventeenth to the early twentieth century. Another unique detail from this analysis is the intersection of race and Indigenous issues, with ‘sovereignty’ ranking as highly similar to ‘racist’. Robert O'Boyle, Erich Longie and Dianne Desrosiers’ 2017 abstract about the Dakota Nation illustrates this by noting how racist practices have displaced Indigenous people and diminished their culture.
The results of the topic model and word similarity analysis both show that race-related topics are generally highly diluted at the corpus and document level, and are ‘washed out’ by other topics and similar terms not closely related to racism. Close reading of the abstracts reveals that much of this is due to the multiple meanings of ‘race’, where race can also mean competition. For example, we see the phrases ‘space race’, ‘race to the North Pole’, and, in the earliest appearances of the word in the 1970s, ‘race of maize’, as well as other uses relating to maize varieties (i.e. landraces). By contrast, our sentence-level data provide much richer and specific contextualisation of how archaeologists write about race topics. We find coherent engagement with a comprehensive breadth of issues relating to racism. A notable result from the keyword-in-context analysis—not seen in our other results—is the association of ‘African’ and ‘Black’ with ‘racist’. This confirms that in the rare sentences where these keywords occur, archaeologists use them to engage with a wide range of broader themes surrounding racism, especially Black and African experiences of racism. An example of this is Kenneth Nystrom and Christina Hodge's 2016 abstract on structural racism and the use of African-American bodies for anatomy courses in the nineteenth-century US. Similarly, Carly Fant and Kenneth Nystrom's 2019 abstract reports their study on human remains from a nineteenth-century African-American population in Newburgh in New York, which found linear enamel hypoplasia, a pathology potentially indicative of the history of racism and inequality. Notably absent from the results at the topic level is any indication of discussion of racism relating to Indigenous and Asian groups.
Contextualisation of our quantitative results with the examples given above reveals that archaeological engagements with racism appear to be dominated by historical archaeology case studies. This raises the possibility that more extensive engagement with race-related topics might be found at conferences more specifically focused on historical archaeology. To explore this, a comparison of our SAA data with equivalent data from abstracts of the Society of Historical Archaeology (SHA) meetings would be ideal, but only SHA data from 2012 onwards are currently available. We obtained a more comparable dataset of 1122 abstracts from the SHA journal Historical Archaeology dating from 1967–2020. Although this is a much smaller sample, and race-related keywords only appear 79 times (with 60 per cent of these occurring after 2010), the proportion of keywords to the total word count is nearly ten times higher than in the SAA abstracts (Figure 6). This supports our observations that discussions of racism by archaeologists are more frequent in the context of historical archaeology (Orser Reference Orser1998; Matthews & McGovern Reference Matthews and McGovern2015) and suggests that historical archaeologists and organisations such as the SHA are likely to be leaders in anti-racist initiatives to diversify their professional community. These organisational and structural initiatives of the SHA (Mullins Reference Mullins2012) may, in turn, benefit other archaeological organisations where racism is less often discussed.
Boxplot showing the distributions of the proportions of race keywords per year in Society for American Archaeology meeting abstracts compared with abstracts in the journal Historical Archaeology (each data point is one year). Note that the vertical axis has a logarithmic scale (i.e. the difference between the two groups of proportions is approximately a factor of ten) (figure by the authors).

Although our results show that there was no positive correlation between discussions of racism at SAA annual meetings and recent societal events (Figure 5), when we focus only on the subset of events that involve large-scale protests (n = 26), we find a significant positive relationship at a five-year lag (p = 0.029). Nonetheless, the R2 values are low, indicating that the societal events do not alone explain the presence of race terms. Furthermore, this relationship is strongly influenced by just three years (2013, 2014 and 2020), and the abstracts containing race-related keywords in these years do not specifically reference any recent, wider societal events. A causal relationship here is therefore far from certain, although historical archaeologists appear to be more responsive to current events in their work. We found significant positive relationships between race-related keywords in Historical Archaeology abstracts and societal events at two- and three-year lags, strongly influenced by abstracts published after 2007 (see code and data available at: https://doi.org/10.17605/OSF.IO/2N3RF).
The death of George Floyd and the rise of the Black Lives Matter movement in 2020 ignited discussion of racism throughout archaeology and many related professional communities (Ali et al. Reference Ali2021; Cronin et al. Reference Cronin2021). One prominent example is the ‘Archaeology in the Time of Black Lives Matter’ webinar, which attracted an audience of 2000 people. Co-organised by the Society of Black Archaeologists and others in late June 2020, the webinar featured six Black scholars discussing anti-Blackness in archaeology and future challenges, and directions to transform the discipline (Flewellen et al. Reference Flewellen2021). Sapiens, an online anthropology magazine funded by the Wenner-Gren Foundation, presented a series of nine webinars related to contemporary issues of racism, titled ‘From the Margins to the Mainstream: Black and Indigenous Futures in Archaeology’ (Colwell Reference Colwell2020). Many professional organisations issued statements acknowledging systemic anti-Black racism, and committing to action to address it, including the editors of the SAA's four publications (Advances in Archaeological Practice, American Antiquity, Latin American Antiquity and SAA Archaeological Record), who vowed to include more Black, Indigenous and People of Colour in their publishing activities (Gamble et al. Reference Gamble2020). Will these commitments result not only in anti-racist strategies among our community and professional structures, but also in greater engagement with racism as a research topic? Future analyses similar to those presented here may help address these questions. Moreover, combined with citation analysis, they may establish whether and (if so) how specific archaeological publications on issues related to racism have influenced later work.
Conclusion
Based on the limited presence of racism-related research identified in an analysis of almost 70 000 abstracts spanning 41 meetings of the SAA, we conclude that concepts of race and racism have rarely been discussed at this major annual gathering of archaeologists. At the corpus and document level, discussion of racism in archaeology abstracts has been minor, and racism is usually only mentioned in passing along with other social issues. Engagement with these topics, however, has been increasing since 2014 as overall participation in SAA annual meetings increased. This may suggest a potentially growing awareness of issues of race in archaeology, perhaps influenced, in part, by contemporary protest events. Despite the rarity of the topic, at the sentence level we can see that archaeologists recognise race-related issues as one of the major systemic inequalities embedded in society.
Our computational analyses of a large dataset of archaeological text supports previous studies which have concluded that archaeologists rarely participate in discussions of racism in their professional work (Gosden Reference Gosden2006; Hall Reference Hall2015). One reason for the lack of archaeological research on these topics may be that direct material evidence related to traditional concepts of racism is rarely encountered in the normal work of most archaeologists (Babson Reference Babson1990). It may also be because modern archaeology is derived from Western systems of colonial extraction and is practised by a largely homogeneous profession comprising predominantly White people who have long ignored and marginalised subaltern groups (Blakey Reference Blakey2020; Ike et al. Reference Ike, Miller and Hartemann2020; White & Draycott Reference White and Draycott2020), rather than collaborated with them to understand their pasts. Exceptions to this can be found, especially among historical archaeologists, for example those who study lifeways of enslaved or impoverished African-Americans (e.g. Orser Reference Orser1998; Mullins Reference Mullins2006; Matthews & McGovern Reference Matthews and McGovern2015). The rarity of discussions of racism among archaeologists may signal the discomfort many researchers feel about issues of race in the present (Matthews & McGovern Reference Matthews and McGovern2015).
The killing of George Floyd, and many other similar tragic deaths, renews our focus on the question: should we be concerned by the low level of engagement with racism by archaeologists? We believe we should, because it shows our neglect of important explanatory factors of past human experiences, and our failure to recognise how present conditions shape the stories we tell about the past. Recent archaeological discussions on the theme of anti-racism suggest a growing concern with this low level of engagement, and an emerging recognition that much more work is needed. Longino (Reference Longino2002) argues that acknowledging the social character of science and explanatory plurality is vital to ensure the best and most useful explanations of phenomena. More thorough archaeological investigation of the evidence for, and effects of racism will ensure that our explanations benefit from a more comprehensive understanding of a force that has profoundly shaped our society (Babson Reference Babson1990). This is also likely to lead to changes in our profession's practices, demographics and power relations, resulting in greater equality and inclusivity in archaeology (Franklin et al. Reference Franklin, Dunnavant, Flewellen and Odewale2020). Our study provides a novel toolkit and an initial baseline for future work to measure these changes, and can be applied to examine other aspects of identity, such as gender and sexuality.
Acknowledgements
We thank the Society for American Archaeology for making the abstract texts openly available online. We are grateful to two anonymous reviewers for feedback that improved our article.
Funding statement
This research received no specific grant from any funding agency or from commercial and not-for-profit sectors.


 Open access