

Our genome is the product of millions of years of evolution in which it slowly adapted to ensure reproductive success under the environmental selective pressures imposed upon our species(Reference Eaton and Konner1). Evolutionary medicine predicts that many complex degenerative diseases originate from unfavourable changes in our environment that, in the light of our long generation time, are too rapid to cause appropriate adaptation of our slowly adapting genome(Reference Eaton and Eaton2). Such genetic adaptations are also unlikely to occur, since these unfavourable changes exert little selection pressure. That is, they do not cause death before reproductive age, but rather reduce years in health at the end of the life cycle(Reference Eaton and Konner1, Reference Eaton, Eaton and Konner3). Our, nevertheless, increased life expectancy originates mostly from technological achievements (e.g. the introduction of public health sanitation, the prevention of (childhood) infections, famine, homicide and tribal warfare)(Reference Hill, Hurtado and Walker4), which diminish the influence of certain unfavourable conditions of existence. Since the agricultural revolution (some 10 000 years ago) and notably since the industrial revolution (some 200 years ago), we have introduced numerous unfavourable changes into our environment and lifestyle. These factors include changes in diet, physical activity, stress, sleep duration and environmental pollution among others. Important dietary and environmental changes, especially in affluent countries, that may adversely affect health and well-being include a decreased n-3/n-6 fatty acid ratio, combination of high intakes of SFA and carbohydrates(Reference Volek, Fernandez and Feinman5), introduction of industrially produced trans fatty acids, reduced exposure to sunlight, lower intakes of vitamins D and K, imbalanced intake of antioxidants, high intakes of carbohydrates with high glycaemic indices and loads, and little dietary fibre. Together, with a sedentary lifestyle, these dietary alterations gave rise to an unprecedented body composition characterised by increased fat mass and sarcopenia(Reference Eaton, Eaton and Konner6). These culturally driven environmental changes have exceeded the flexibility of our epigenotype to adapt and have resulted in a maladapted phenotype, primarily after reproductive age.
It has been hypothesised(Reference Eaton and Konner1) that the range of optimal nutrient combinations to support good health are present in the foods that were consumed by our Paleolithic ancestors who were living from 2·5 million to 10 000 years ago. Their diets and environment represent the selective pressures under which our genome evolved. The fish oil fatty acids EPA and DHA (and their derivatives), vitamin D (1,25-dihydroxyvitamin D) and vitamin A (retinoic acid) are examples of nutrients that act in concert, while each of these has multiple actions(Reference Bensinger and Tontonoz7, Reference Chawla, Repa and Evans8). Consequently, the criteria for establishing optimum nutrient intakes via randomised controlled trials (RCT) with single nutrients at a given dose and with a single end point have serious limitations. They are usually based upon poorly researched dose–response relationships, and typically ignore many possible nutrient interactions and metabolic interrelationships. For instance, the adequate intake of linoleic acid (LA) to prevent LA deficiency depends on the concurrent intakes of α-linolenic acid (ALA), γ-LA and arachidonic acid (AA). Consequently, the nutritional balance on which our genome evolved is virtually impossible to determine using the reigning paradigm of ‘evidence-based medicine’ with RCT. Nutritional research rather needs an organisational template that focuses on the optimal homeostasis. This template may be obtained from the reconstruction of Paleolithic diets. Disparity between the range of nutrients found in the current Western diet and reconstructed Paleolithic diets will provide a direction for guiding future dietary interventions.
The composition of Paleolithic diets may be derived from many disciplines, including biology, archaeology, anthropology, comparative anatomy, genetics, food science and (patho)physiology. For instance, the sites at which the fossil remains of our hominin ancestors have been discovered suggest that the evolution to anatomically modern humans took place in a long-chain n-3 fatty acid-rich diet in an East African land–water ecosystem(Reference Broadhurst, Cunnane and Crawford9–Reference Stewart12). Additionally, the last Out-of-Africa diaspora, starting some 100 000 years ago, largely took place via the coastal lines(Reference Stringer13), including crossing to the Americas via the Bering Strait(Reference Wang, Lewis and Jakobsson14). Compared with hunting in the savannah, obtaining food from these ecosystems is relatively easy, and the foods are rich in haeme Fe, iodine, Zn, Cu, Se, vitamins A and D, and n-3 fatty acids from both vegetables and fish, which are collectively referred to as ‘brain-selective nutrients’(Reference Crawford15, Reference Cunnane16). Epidemiological data as well as landmark trials with n-3 fatty acid consumption or fish consumption demonstrated favourable outcomes for CHD(Reference de Lorgeril, Salen and Martin17–Reference Marchioli, Barzi and Bomba19), (postpartum) depression(Reference Hibbeln20, Reference Hibbeln21), homicide mortality(Reference Hibbeln21) and neurodevelopment(Reference McCann and Ames22). The importance of dietary long-chain PUFA (LCP) is also supported by the low capability to synthesise LCP during the entire life cycle(Reference Plourde and Cunnane23), suggesting that ancestral human intakes of AA, EPA and DHA were sufficient for survival and reproductive success. The recently discovered polymorphisms(Reference Caspi, Williams and Kim-Cohen24) of fatty acid desaturases 1 (FADS1, also named Δ5-desaturase) and 2 (FADS2, Δ6-desaturase), with lower activities in their conversion of ALA and LA to LCP, add to the notion that at the time of the first occurrence of these mutations, intakes of dietary LCP compensated for the concomitantly lower LCP synthesis.
Eaton et al. (Reference Eaton and Konner1, Reference Eaton, Eaton and Konner3, Reference Eaton25, Reference Eaton, Eaton and Sinclair26) were the first to reconstruct a Paleolithic diet. They assumed a savannah-type diet with non-selective consumption of animals, implying that all the available organs were consumed. This model was further refined by Cordain et al. (Reference Cordain, Miller and Eaton27, Reference Cordain, Watkins and Mann28), who assumed a savannah diet with multiple subsistence ratios and an ‘optimal foraging’ strategy. ‘Optimal foraging’ assumes the preferred consumption of energy-dense foods(Reference Cordain, Watkins and Mann28–Reference Goldstone, de Hernandez and Beaver30) (e.g. by the selective consumption of plants with high fat percentages and the selective consumption of energy-dense animal organs, such as brain and bone marrow). Compared to contemporary intakes, both the models(Reference Eaton, Eaton and Sinclair26–Reference Cordain, Watkins and Mann28) suggested lower carbohydrate and higher intakes of protein and LCP. None of the earlier models separately evaluated food intake from the land–water ecosystem, which is the presumed niche of our ancestors(Reference Broadhurst, Cunnane and Crawford9–Reference Broadhurst, Wang and Crawford11, Reference Stringer13, Reference Wang, Lewis and Jakobsson14) and an abundant source of EPA and DHA.
We estimated the dietary macronutrient (carbohydrate, protein and fat) and fatty acid compositions for four foraging strategies ascribed to Paleolithic hunter–gatherer/scavengers who foraged in the savannah (Model 1), a land–water ecosystem (Model 4) and a combination of both (Models 2 and 3). The aim was to determine the composition and range of dietary macronutrients and fatty acids under which the human genome evolved, and which would likely support modern day health and well-being. In contrast to Eaton et al. (Reference Eaton, Eaton and Sinclair26), our modelling of the savannah diet assumed selective consumption of organs, and when compared to the savannah diet as used by Cordain et al. (Reference Cordain, Watkins and Mann28), we additionally varied the contributions from muscle, marrow and brain. Our purely aquatic foraging strategy (Model 4) has not been previously evaluated. For the reconstruction, we differentiated between selective (Models 1 and 3) and non-selective (Models 2 and 4) consumption of meat. Within each model, we varied the plant/animal subsistence ratios, the meat/fish ratios (Models 2 and 3), the fat contents of the plants, meat and fish consumed (Models 2–4) and the muscle/marrow/brain ratios (Models 1 and 3). The final outcome was subjected to certain pathophysiological constraints, since not all the dietary combinations were considered to be compatible with health. In evolutionary terms, health may be defined as an evolutionary fitness to survive up to the reproductive age and beyond for successful reproduction and to take care of the young (the so-called grandmother hypothesis(Reference Hawkes, O'Connell and Jones31, Reference Sear, Mace and McGregor32)), respectively.
Methods
Background for the models
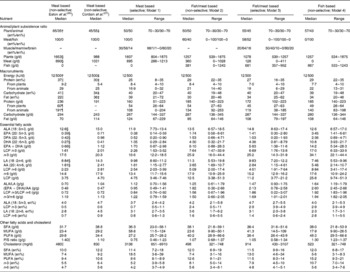
For the calculation of the average macronutrient and fatty acid intakes, we divided the diet into two main components (i.e. plant and animal foods). In contrast to earlier models(Reference Eaton, Eaton and Sinclair26, Reference Cordain, Watkins and Mann28), we subdivided the animal food into meat and fish, in which the former was further subdivided into five edible components, namely skeletal muscle, brain, marrow, liver and adipose tissue. Additional organs (e.g. kidney, adrenals, spleen, heart and blood) were considered to be of minor interest. These organs were not included due to limited data on nutrient compositions and a relatively small contribution to overall weight. Since we aimed at investigating the possible ranges of nutrient intakes from multiple Paleolithic diets, we included a wide, but certainly possible, range of variables. In all the models (see below), the plant/animal food ratios in energy % (en%) were varied from 70/30 to 30/70 en%/en%, which is in the range of the most commonly observed hunter–gatherer subsistence ratios(Reference Eaton, Eaton and Sinclair26, Reference Cordain, Miller and Eaton27). The fat contents by weight (g/100 g edible material; g%) of all plants, meat and fish were varied from 2·5 to 5·0, 5·0 to 30 and 2·5 to 10·0 g%, respectively, for which justification is given in each particular section below. The information on macronutrient and fatty acid contents of the edible material were obtained from the literature, Internet food databases(33) and our own data. Detailed information on energy and fat contents and the fatty acid compositions of the various foods and their literature references are given in supplementary Table S1 (available online only at http://journals.cambridge.org). Table 1 presents the means, as compiled from these raw data. Using the above-mentioned approach, we calculated the outcomes of four different models, representing four foraging strategies ascribed to early Homo genus and assuming a daily energy intake of 12 500 kJ.
Mean energy, fat contents and fatty acid compositions of the edible parts of foods available to our Paleolithic ancestors

Origin, origin of the investigated foods; species/specimen, ratio of investigated numbers of species and specimen; ALA, α-linolenic acid; DPA, docosapentaenoic acid; LCP, long-chain PUFA; LA, linoleic acid; AA, arachidonic acid; SFA, sum of all SFA; MUFA, sum of all MUFA.
Description of the models
Model 1 describes a selective hunter–gatherer/scavenger savannah diet that is composed of plant and animal foods that are effectively available in the savannah, while the consumption of aquatic food was excluded. The employed hard data are in supplementary Table S1 (available online only at http://journals.cambridge.org) and Table 1. ‘Selectivity’ implies that only the skeletal muscle, marrow and brain were consumed from the animal food, and the liver and adipose tissue were not consumed. The intakes were varied between 98 and 0 en% (skeletal muscle), 1 and 80 en% (bone marrow) and 1 and 20 en% (brain) of the total meat intake. Model 2 describes a non-selective hunter–gatherer/scavenger savannah/aquatic diet that contains plant and animal foods that are available in the savannah and in an aquatic environment. In accordance with Eaton et al. (Reference Eaton, Eaton and Sinclair26), this model assumes that the whole animal carcass was consumed (i.e. non-selective), including most animal organs, and also the skin and the head in the case of fish. The meat and fish intakes were varied from 100 to 0 and 0 to 100 en% of total animal consumption, respectively. For calculating the fish intake, we used the energy, fat and fatty acid contents of East African lake and marine fish because of their specific fatty acid compositions(Reference Kuipers, Fokkema and Smit34, Reference Kuipers, Smit and van der Meulen35). Model 3 describes a selective hunter–gatherer/scavenger savannah/aquatic diet. This model assumes a diet from aquatic resources and the selective scavenging of muscle, bone marrow and brain from savannah animals. The meat and fish intakes were again varied from 100 to 0 and 0 to 100 en% of total animal consumption, respectively. In this model, we varied the intakes as muscle, bone marrow and brain from 0 to 50 en% (muscle), 40 to 80 en% (bone marrow) and 10 to 20 en% (brain) of total meat intake. In this model, the fat contents of fish and plant were both set at 5 g%, while the average fat contents of the combined muscle/marrow/brain in meat varied from 10 to 30 g%. Model 4 describes a non-selective hunter–gatherer/scavenger aquatic diet that is composed of plants and fish, while the consumption of meat was not included. Consequently, the fish intakes were 100 % of animal foods in all applied subsistence ratios. The fat content of fish was varied from 2·5 to 10·0 g%. For calculating the energy, fat and fatty acid content of aquatic foods consumed, we only applied data for East African fish species.
Justification for the models
The range of the subsistence ratios applied in our models needed an evaluation because of the absence of accurate data on human nutritional (plant/animal en%/en%) subsistence ratios in the Paleolithic diets. Unfortunately, plant/animal (en/en%) subsistence ratios cannot be simply derived from gathering/hunting subsistence ratios. Anthropological studies that differentiate between gathering and hunting often include gathered plant foods as well as unimportant(Reference Stewart, Lee and DeVore36) and small(Reference Lee, Lee and DeVore37, Reference Murdock38) animal foods into ‘gathering’. They also report the contribution of gathering as a percentage of subsistence economy rather than en%. Secondly, in contrast to common belief, hunting probably played a less dominant role from a nutritional point of view compared with gathering, and on average, it makes up 35 % of the subsistence base for present-day worldwide hunter–gatherers, independent of latitude or environment(Reference Cordain, Miller and Eaton27, Reference Lee, Lee and DeVore37). For example, hunting by some surviving hunter–gatherers is still not very successful: the probability for a kill in !Kung bushmen is only 23 %(Reference Lee, Lee and DeVore37), and the subsistence of Hadzabe, as described by Woodburn(Reference Woodburn, Lee and DeVore39), consists of 80 % plant foods. In the Paleolithic, however, hunting might have been more productive, due to both higher animal biomass and hunter–gatherers not being displaced to marginal environments, unattractive for crop cultivation or cattle. Consequently, we chose the employed ratios within the range of the most commonly observed hunter–gatherer subsistence ratios(Reference Eaton, Eaton and Sinclair26, Reference Cordain, Miller and Eaton27).
The justification for the employed energy densities is obtained from the common misconception that members of present-day affluent societies are taller than our ancestors. The average height of Paleolithic human subjects would have placed them within the tallest 15 % of our population(Reference Roberts, Stringer and Parfitt40). Our former nomadic lifestyle as a hunter–gatherer was characterised by vigorous physical activity and lean body mass in contrast to the present-day sedentary lifestyle and worldwide increasing BMI. The anatomical features and physical activity of pre-agricultural humans probably demanded a greater energy intake than necessary for current Western populations. The total energy expenditure was estimated to be 10 000 kJ/d(Reference Leonard and Robertson41) for Homo habilis, and 8961 kJ/d for !Kung bushmen(Reference Lee, Lee and DeVore37), but was probably somewhat higher for early Homo sapiens (Reference Cordain, Gotshall and Eaton42). Energy intakes should be in concordance with the physical activity level that represents the ratio between the variable total energy expenditure and the constant RMR. A typical physical activity level in the Paleolithic would be 1·74, compared with 1·4 for a typical sedentary American and 1·75 as recommended by the WHO(Reference Eaton and Eaton43). The daily energy expenditure, as physical activity, in the Paleolithic, however, was estimated to be 5193 kJ, with a total energy intake of 12 144 kJ, but sedentary humans consume 8500 kJ/d, while they spend only 2324 kJ/d on physical activity. Adjustment of the energy intake to the current physical activity level would, however, inherently imply lower nutrient intakes (i.e. LCP and micronutrients), compared with the intakes by our Paleolithic ancestors. To preclude underestimation of Paleolithic nutrient intakes, we therefore employed the daily intake of 12 500 kJ/d.
We employed selective hunter–gathering/scavenging (i.e. including brain and bone marrow) in Models 1 and 3, but non-selective hunter–gathering/scavenging (i.e. including all edible organs) in Models 2 and 4. Selective organ consumption would increase both the fat (hence the energy) and the LCP contents of the meat (Tables 1 and 2). To elucidate this net effect of selective organ consumption, we modelled the influence of increased organ tissue consumption(Reference Blumenschine and Cavallo44–Reference Lupo47) on the macronutrient and fatty acid intakes. The exclusion of liver and adipose tissue in Models 1 and 3 is obtained from the observation that scavenged leftovers from carnivore kills seldom contain energy-dense organs such as the liver and adipose tissue(Reference Blumenschine and Madrigal45). Liver and adipose tissue are the first to be consumed by the obligate carnivore, while the head and bones are the most likely leftovers because of their inaccessibility(Reference Blumenschine and Cavallo44). Although it has been suggested that, apart from the remaining muscle meat(Reference Blumenschine and Cavallo44–Reference Cordain, Watkins and Florant46, Reference Bunn and Ezzo48), tool-using hunter–gatherer scavengers(Reference Bunn and Ezzo48) could have had selective access to brain and marrow(Reference Blumenschine and Cavallo44–Reference Lupo47) for the main period of human evolution, it seems unlikely that brain or marrow would have been as easily accessible for consumption as aquatic LCP-rich animal foods, especially for women and children. Although both marrow and brain are sizeable, energy-dense organs(Reference Blumenschine and Madrigal45–Reference Lupo47) (supplementary Table S2, available online only at http://journals.cambridge.org), a substantial contribution from marrow and brain to any regular diet seems unlikely with regard to their sizes and perishability. The high marrow/brain (80/20 en%/en%) contribution to the total meat en% was therefore included to investigate one of the possible ranges of nutrient intakes, rather than the most realistic or average. From approximately the middle Stone Age on, after humans became top predators, not only brain and marrow but also liver and adipose tissue would have become more frequently accessible (i.e. Model 2). The selective consumption of energy-dense organs (fat) is consistent with the optimal foraging theory, and their preferential consumption was indeed observed in present day hunter–gatherers (RS Kuipers and MF Luxwolda, personal observations). In support of optimal foraging, it was recently shown that after fasting, the human brain responded more actively to pictures of high-energy foods compared with low-energy foods(Reference Goldstone, de Hernandez and Beaver30).
Total energy from all macronutrients, and contributing percentages of protein and fat to the total energy content for plants, meat and fish at different fat contents
The table reads as follows: plants with 5 g% fat contain 2924·6 kJ (699 kcal)/100 g, of which 14 en% is from protein and 24 en% from fat; the remainder (i.e. 62 en%; not shown) is from carbohydrates. The models are composed of plant fat percentages varying from 2·5 to 5·0 g%; those of meat varied from 5·0 to 30·0 g% and of fish from 2·5 to 10 g%. ‘Non-selective’ implies the following weight percentages: skeletal muscle, 90·2 g% containing 3·0 g% fat; brain, 1·0 g% with 9·1 g% fat; bone marrow, 3·0 g% with 51·0 g% fat; liver, 3·8 g% with 6·7 g% fat and adipose tissue, 2·0 g% with 84·2 g% fat. The cumulative fat content of this combination amounts to 5·0 g%. ‘Selective’ implies some combination of muscle/marrow/brain.
* Extrapolated (see text).
Plant composition
The macronutrient composition and energy value of plant foods (Table 2) were derived from Eaton et al. (Reference Eaton, Eaton and Sinclair26) (fat 19 en%; protein 13 en% and carbohydrate 68 en%) and Cordain et al. (Reference Cordain, Miller and Eaton27) (fat 24 en%; protein 14 en% and carbohydrate 62 en%). They assumed a range from 469 kJ/100 g at 2·1 g% plant fat(Reference Eaton, Eaton and Sinclair26) to 699 kJ/100 g at 5 g% plant fat(Reference Cordain, Miller and Eaton27, Reference Brand-Miller and Holt49). For Model 1, we adopted a 2·5 g% plant fat figure, while for Models 2–4, we varied the fat contents of plant from 2·5 to 5 g%. Cordain et al. (Reference Cordain, Miller and Eaton27) used a mean plant fat content of 5 g%, as derived from 829 wild plant foods consumed by Australian Aboriginals(Reference Brand-Miller and Holt49). The fatty acid compositions of plant foods (Table 1) were derived from Guil et al. (Reference Guil, Torija and Gimenez50), as also used by Eaton et al. (Reference Eaton, Eaton and Sinclair26), with additional data for African vegetables such as terrestrial leaves, seeds, roots, tubers, nuts and fruits(Reference Ezeagu, Petzke and Lange51–Reference Wehmeyer, Lee and Whiting55). Edible seaweed, sea grasses and algae(Reference Bhaskar, Kinami and Miyashita56–Reference Norziah and Ching59), like insects(Reference Oyarzun, Crawshaw and Valverde60, Reference Stanley-Samuelson and Dadd61), were not included, but they are shown for comparison in supplementary Table S1 (available online only at http://journals.cambridge.org). Marine plants, terrestrial plants and insects have comparable fatty acid contents, except for the somewhat higher LCP and lower precursor contents in marine plants.
Justification for using the range of plant fat percentages in our models may be obtained from examples of currently consumed plant foods in East Africa. Tubers consumed by the Hadzabe in Tanzania contain up to 5 g% fat(Reference Vincent54). Although indigenous to North America, Congolese tribes consume avocados that contain 19 g% fat(Reference Rocquelin, Tapsoba and Mbemba53). Coconuts contain 46 g% fat and could have been available to our ancestors(Reference Kuipers, Smit and van der Meulen35), while palm nuts and peanuts contain 46 and 49 g% fat, respectively(Reference Rocquelin, Tapsoba and Mbemba53). Nigerian wild plant seeds contains up to 59 g% fat(Reference Ezeagu, Petzke and Lange51), nuts consumed by Australian Aborigines contain on average 29 g% fat(Reference Brand-Miller and Holt49) and the !Kung Bushmen consumed fat-rich mongongo nuts (57 g% fat) as staple food when available(Reference Wehmeyer, Lee and Whiting55). The preference of nuts or fatty fruits above low-fat leaves is consistent with optimal foraging(Reference Ulijaszek29–Reference Hawkes, O'Connell and Jones31).
Meat composition
Non-selective meat consumption
Animal foods were subdivided into muscle, brain, bone marrow, liver and adipose tissue/separable fat. About 50 % of the total body weight of game animals is edible(Reference Ledger62). For the calculation of the energy density and the energy contributions of protein and fat from an average edible portion of non-selectively consumed meat, we assumed the following weight distribution and fat contents: skeletal muscle 90·2 g% containing 2·9 g% fat; brain 1·0 g% with 9·1 g% fat; liver 3·8 g% with 6·7 g% fat; bone marrow 3·0 g% with 51·0 g% fat and adipose tissue 2·0 g% with 84·2 g% fat(Reference Eaton, Eaton and Sinclair26, Reference Blumenschine and Madrigal45, Reference Cordain, Watkins and Florant46, Reference Rocquelin, Tapsoba and Mbemba53, Reference Crawford63–Reference Sinclair, Slattery and O'Dea70). The cumulative fat percentage of a non-selectively consumed portion of meat amounts to 4·89 g/100 g(Reference Eaton, Eaton and Sinclair26), which was rounded to 5·0 g% fat for practical purposes, with a corresponding energy density of 549 kJ/100 g (see Table 2). For the various fat contents of non-selectively consumed meat (i.e. 2·5–10 g%), we calculated the energy densities and the energy contributions of protein and fat. For meat, the relationships between energy density and fat content, and between energy from protein and fat content, are linear, as noted previously by Cordain et al. (Reference Cordain, Miller and Eaton27). The employed relationships are presented in equations (1) and (2) as follows(Reference Cordain, Miller and Eaton27):
The fat contents of meat (in en%) were calculated by considering 100 en% minus the protein en%. The final outcomes are presented in Table 2.
Selective meat consumption
The energy density and the contributions of protein and fat from an average portion of selectively consumed meat were calculated at three different fat contents (i.e. 10·0; 19·0 and 30·0 g%). These fat percentages were derived from three different combinations of muscle, marrow and brain, i.e. 50/40/10, 20/64/16 and 0/80/20 en%/en%/en%, respectively. Justifications for these combinations are obtained from the observation (see Results section) that protein intakes exceed the stated protein constraint (see below) from about 50 en% muscle consumption. Since brain and bone marrow have similar total weights (supplementary Table S2, available online only at http://journals.cambridge.org)(Reference Blumenschine and Madrigal45–Reference Lupo47), but bone marrow has about four times higher energy density (Table 1), we kept the bone marrow/brain constant at a ratio of 4 en%/en%.
The calculations of the fat content (g%), energy from all macronutrients (kJ/100 g), and protein and fat contributions (in en%) may be illustrated as follows. A ratio of 20/64/16 en%/en%/en% from muscle, bone marrow and brain, respectively, implies that for each 4188 kJ selectively consumed meat of this composition 838, 2680 and 670 kJ are derived from muscle, bone marrow and brain, respectively. Using the energy densities of these organs as given in Table 1, the energy quantities translate into 838/452 = 185 g muscle, 2680/2043 = 131 g bone marrow and 670/528 = 127 g brain. These figures add to a total of 443 g selectively consumed meat, of which 41·7 g% is derived from muscle, 29·6 g% is derived from marrow and 28·7 g% is derived from brain. The total fat content of this 443 g portion was calculated by using the fat contents of the individual organs as given in Table 1, yielding 19 g% fat (see Table 2). The energy contribution from all macronutrients and the contribution from protein were subsequently calculated by using equations (1) and (2), respectively (see earlier), yielding 1072 kJ/100 g selectively consumed meat and 30 en% from protein. The fat content (in en%) was calculated by considering 100 en% minus the protein en%. The fat content (g%), energy from all macronutrients (kJ/100 g), and protein and fat contributions (in en%) for the 50/40/10 and 0/80/20 en%/en%/en% compositions were calculated in a similar manner. These calculations needed extrapolation for the 0/80/20 composition, since the original data of Cordain's(Reference Cordain, Miller and Eaton27) equation (2) did not consider fat percentages above 25 g%. The final outcomes of the calculations for each of the organ combinations for selectively consumed meat are presented in Table 2.
Justification for the use of variable fat percentages in our models is obtained from the available data from East African animal and hunter–gatherer studies. The nutrient composition of the various tissue compartments in animals is variable. For instance, the fat content of skeletal muscle from game animals is much lower than that of livestock(Reference Cordain, Watkins and Florant46, Reference Crawford63, Reference Ailhaud, Massiera and Weill71), and ranged from 2·0 g% in the Ugandan Eland(Reference Crawford and Woodford67) to 4·6 g% in monkey bush meat from Zaire(Reference Rocquelin, Tapsoba and Mbemba53) in our database, but it can be as high as 25 g% in domestic cattle(Reference Crawford63). The fat content of bone marrow strongly depends on season and the animal's age and physical condition(Reference Blumenschine and Madrigal45, Reference Cordain, Watkins and Florant46). Also the size of the adipose tissue mass of game animals is dependent on season, condition and age(Reference Blumenschine and Madrigal45–Reference Lupo47). In contrast to the afore-mentioned organs, the fat contents of liver and brain are rather constant(Reference Cordain, Watkins and Florant46). In view of this variance and the optimal foraging theory(Reference Ulijaszek29–Reference Hawkes, O'Connell and Jones31), we varied the average fat content of the consumed whole carcass edible meat from 5·0 to 10·0 en%, and to a maximum of 30·0 en% for (very) selective organ consumption in Models 1 and 3 to calculate the energy value and the macronutrient and fatty acid compositions of the possible diets. It is important to realise that the consumption of ‘meat’ containing 30 g% fat does not refer to consumption of lean muscle meat only, since the maximum lean meat fat% of some East African mammal species was 13·0 g% in a female hippopotamus in Ledger's classical study(Reference Ledger62). We rather point at the selective consumption of fatty organs as the brain and bone marrow or liver and adipose tissue. Secondly, selective hunting would be part of optimal foraging strategies(Reference Ulijaszek29–Reference Hawkes, O'Connell and Jones31), meaning that hunter–gatherers would spend more effort in hunting fat animals than in hunting lean animals. With reference to the employment of a wide range of dietary fat, we emphasise that the present study is rather designed to show the range of possible dietary intakes from a constantly changing environment in the past than to point at one specific dietary composition.
Fish composition
At various body fat contents of fish (i.e. 2·5; 5·0; 7·5 and 10·0 g%), we calculated the energy density and the contributions of protein and fat (in en%). From the USDA food database(33), we found that the energy densities for fish correlate excellently with the corresponding body fat contents (Fig. 1). Using the linear relationship energy density (kJ/g) = 0·3663 × body fat (in g%)+3·4246 (R 2 0·9425), we subsequently calculated the energy densities at the various body fat contents of fish. The corresponding energy contributions of protein were calculated from the following equation(Reference Cordain, Miller and Eaton27):
The fat contents of fish (in en%) were calculated by considering 100 en% minus the protein en%. The final outcomes are presented in Table 2.
Relation between body fat (in g%) and energy density (in kJ/g) for fish. All the data on freshwater fish are derived from the USDA Internet database (n 87), accessed on 15 August 2008(33). y = 0·3663x+3·4246; R 2 0·9425.
Justification for the employed fat percentages from fish may be obtained from the following data. The fat content of most pelagic fish is about 2·5 g%, but African catfish have fat contents above 10 g%(Reference Pauletto, Puato and Angeli72). In most studies, the fat content is derived from the analyses of the fillet, while Pauletto et al. (Reference Pauletto, Puato and Angeli72) specifically examined a portion including the fat-rich skin (37–44 g% of total fat)(Reference Ackman73). In addition to the consumption of skin, the first part of a fish to be consumed by Africans is the head, which contains 10–17 g% of total fat(Reference Ackman73). Another 3·5–6 g% of fat may come from the consumption of the backbone(Reference Ackman73). Although large fish were reportedly caught with bare hands back to 2 million years ago(Reference Stewart12), especially in smaller fish, the skin would have been a substantial part of the total edible portion. For instance, we estimate that 2–20 g% fat would be derived from the whole consumption of a 10 cm fish with a diameter of 3 cm and a 2 mm skin. Taking these assumptions into account for the approximation of the average fat content of the fish consumed by early humans, we varied the average fat content of fish in our models from 2·5 to 10·0 g%. Since ‘you are what you eat’ also applies to fish, we only used fatty acid data on East African fish species. The differential fatty acid status of worldwide and East African fish species(Reference Broadhurst, Cunnane and Crawford9, Reference Kuipers, Fokkema and Smit34, Reference Kuipers, Smit and van der Meulen35, Reference Pauletto, Puato and Angeli72, Reference Ackman73) are presented in supplementary Table S1 (available online only at http://journals.cambridge.org). Data for the fatty acid composition of some other typical marine animals, such as crustaceans, cephalopods and certain marine reptiles, birds, mammals, including their eggs, livers and adipose tissue are presented in supplementary Table S1 (available online only at http://journals.cambridge.org), but they are not included in the models. The fatty acid compositions are quite similar to that of the employed African fish species.
Calculation example
The example assumes a 12 500 kJ/d diet that is composed of 70 en% plant (containing 2·5 g% fat) and 30 en% animal food. The latter is composed of 15 en% fish with 2·5 g% fat and 15 en% meat. The meat was either non-selectively consumed with 5 g% fat or selectively consumed with 19 g% fat.
Macronutrient composition
The protein contribution from plants in this example would be 12 500 kJ/d × 70 en% × 13 en% (Table 2) = 1143 kJ/d. Similarly, the protein contribution from meat would be 12 500 × 15 % × 66 % (Table 2) = 1244 kJ/d, while the protein contribution from fish is 12 500 × 15 % × 77 % (Table 2) = 1453 kJ/d. Taken together, the total protein intake from this 12 500 kJ/d diet would be 1143+1244+1453 = 3840 kJ/d, which equals 30·6 en% of total energy intake. The corresponding fat and carbohydrate intakes were 2747 kJ/d (21·9 en%) and 5980 kJ/d (47·5 en%), respectively.
The macronutrient contribution for 19 % fat in selectively consumed meat is calculated in a similar manner. The protein contribution from plants would again be 1143 kJ/d (see earlier). The protein contribution from meat would be 12 500 × 15 % × 30 % (Table 2) = 565 kJ/d, while the protein contribution from fish would again be 1453 kJ/d (see earlier). Taken together, the total protein intake from this 12 500 kJ/d diet would be 1143+565+1453 = 3161 kJ/d, which equals 25·2 en% of total energy intake. The corresponding fat and carbohydrate intakes were 3425 kJ/d (27·3 en%) and 5980 kJ/d (47·5 en%), respectively.
Fatty acid composition: arachidonic acid as an example
Table 3 shows the outcome of the AA content per 100 g of consumed meat, as calculated by assuming non-selective and selective meat consumption, respectively. Data for all other fatty acids given in Table 1 were also calculated (not shown). The employed AA data in plants and fish are presented in Table 1.
Arachidonic acid (AA) content of 100 g consumed meat assuming non-selective (whole carcass) consumption or selective organ consumption
* Organ, contribution (in g) of the indicated organ to the consumption of 100 g meat at different foraging strategies.
† Fat, gram fat per 100 g of indicated organ.
‡ AA, g AA per 100 g fat in indicated organ.
§ Calculated.
∥ Data from Eaton(Reference Eaton, Eaton and Sinclair26) (organ contribution) and the literature (fat g% and AA g%; supplementary Table S1 (available online only at http://journals.cambridge.org)).
¶ Calculated (organ contribution) and data from the literature (fat g% and AA g%; supplementary Table S1 (available online only at http://journals.cambridge.org)).
A 12 500 kJ/d diet with 70 en% from plants corresponds with 8794 kJ/d from plants. The energy density from plants at 2·5 g% fat is 469 kJ/100 g (Table 2), which translates the 8794 kJ/d into an intake of 8794/4·69 = 1875 g plants/d. The plants were assumed to contain 2·5 g% fat with an AA content of 0·64 g/100 g fat (Table 1), which implies a total daily AA intake of 1875 × 2·5/100 × 0·64/100 = 0·30 g from plants. Similarly, 15 en% from fish with 2·5 g% fat translates into 12 500 × 15/100 × 100/436 × 2·5/100 × 8·45/100 = 0·91 g AA/d (Table 2). The daily amount of meat from non-selective consumption at 15 en% would be 12 500 × 15/100 × 100/549 = 344 g meat (Table 2). With an average content of 203 mg AA per 100 g non-selectively consumed meat (Table 3), this figure adds up to 344 × 0·203/100 = 0·70 g AA/d. Assuming selective consumption of meat, the daily intake of AA would become 12 500 × 15/100 × 100/1072 (Table 2) × 0·254/100 (Table 3) = 0·45 g. Taken together, the intake of AA in this example from plants, fish and non-selectively consumed meat would be 0·30+0·91+0·70 = 1·91 g, while for selective meat consumption, the intake would be 0·30+0·92+0·45 = 1·67 g AA/d. Additional calculation of the daily intakes of all other fatty acids and subsequent normalisation to g/100 g fatty acids gave rise to the dietary fatty acid composition (detailed data not shown).
Constraints
Since not all dietary combinations are compatible with good health, we introduced two pathophysiological constraints. First, the contribution of protein is not allowed to exceed 35 en%, since this may cause ‘rabbit starvation’, probably by exceeding the maximum capacity of the liver to convert the excess nitrogen into urea(Reference Rudman, DiFulco and Galambos74). Some studies even suggest that in adult male hunter–gatherers the protein intake may be closer to 40–50 en%(Reference Lieb75). The constraint to restrict the average protein intake at 35 en% seems, however, justified by the hunter–gatherer observations(Reference Speth and Spielmann76). Secondly, LA intakes were to be above 1·0 en% to prevent LA deficiency, especially in children. This constraint is derived from the original data of Burr & Burr(Reference Burr and Burr77), as revisited by Cuthbertson(Reference Cuthbertson78), who even stated that ‘the minimum requirements for LA are in fact less than 0·5 % of calories’; and set at a minimum requirement of at least 1·0 % of energy as LA to prevent biochemical LA deficiency. In animals, the minimum requirement for LA could also be met by γ-LA and AA(Reference Holman79), which would actually imply that the currently employed constraint for LA would be superfluous for any diet containing substantial amounts of LCP n-6 (see also Discussion). In addition to these two constraints, we tested whether the reconstructed diets provide the daily intake of 450–500 mg EPA+DHA/d to lower CHD risk, as recommended by the UK Scientific Advisory Committee on Nutrition, the WHO and International Society for the Study of Fatty Acids and Lipids(Reference Givens and Gibbs80).
Results
Means and ranges of the models
The extremes for Models 1, 2 and 3, i.e. the 70/30 and 30/70 en%/en% plant/animal subsistence ratios, are depicted in Figs. 2 and 3, respectively. For Model 1, a total of 105 different diets were evaluated. Of these, seventy-one (68 %) diets met the protein constraint, and thereafter all the models met the LA constraint and the EPA+DHA recommendation. For Model 2, we evaluated a total of 1320 different diets, of which 674 (51 %) diets met the protein constraint, and thereafter all the models met the LA constraint and the EPA+DHA recommendation. Model 3 considered a total of 165 different diets, of which 115 (70 %) diets met the protein constraint, and thereafter all the models met the LA constraint and the EPA+DHA recommendation. Model 4 is an extreme of Model 2 (or 3), and describes plant and fish intakes only. Since the model is two-dimensional, instead of multidimensional, it is not depicted separately. The model evaluated forty options, of which twenty-two (55 %) options met the protein constraint, and thereafter all the models met the LA constraint and the EPA+DHA recommendation.
The courses of the protein (total energy from protein, –●–, en%) and linoleic acid (LA) intakes (–♦–, in en%) and the α-linolenic acid (ALA)/LA (–▲–) and (EPA+DHA)/arachidonic acid (AA) ratios (–■–, in g/g) with changing composition of animal food at a 70/30 en%/en% plant/animal subsistence ratio. Animal food was composed of organ meat (skeletal muscle, brain, bone marrow, liver and adipose tissue) and fish. Meat consumption was either selective (Models 1 and 3) or non-selective (Model 2). The shorthand notation on the X-axis indicates plant/muscle/marrow/brain (Model 1) and plant/meat/fish (Models 2 and 3). Note the differences of the left and right scales of the Y-axes. The range of dietary combinations within the box in Model 1 was used for the construction of Model 3 (see text). Horizontal lines depict the employed protein ( < 35 en%) and LA (>1·0 en%) constraints. The data for Model 1 (a selective hunter–gatherer/scavenger savannah diet) were calculated by assuming the selective consumption of plant, muscle, bone marrow and brain with the fat contents of 2·5, 2·9, 51·0 and 9·1 g%, respectively. Their intakes were varied between 98 and 0 en% (skeletal muscle), 1 and 80 en% (bone marrow) and 1 and 20 en% (brain) of the total meat intake. The data for Model 2 (a non-selective hunter–gatherer/scavenger aquatic diet) were calculated by assuming non-selective consumption of edible meat with the following weight distribution and fat contents: skeletal muscle 90·2 g% containing 2·9 g% fat; brain 1·0 g% with 9·1 g% fat; bone marrow 3·0 g% with 51·0 g% fat; liver 3·8 g% with 6·7 g% fat and adipose tissue 2·0 g% with 84·2 g% fat(Reference Eaton25, Reference Blumenschine and Madrigal45, Reference Cordain, Watkins and Florant46, Reference Rocquelin, Tapsoba and Mbemba53, Reference Ledger62–Reference Naughton, O'Dea and Sinclair69). The fat percentages were 5 g% for plants, 5·0 g% for fish and 7·5 g% for whole carcass meat (left panel of Model 2), and 5 g% for plants, 7·5 g% for fish and 5·0 g% for whole carcass meat (right panel of Model 2). The data for Model 3 (a selective hunter–gatherer/scavenger savannah/aquatic diet) were calculated by assuming the selective consumption of muscle, bone marrow and brain with the fat contents of 2·9, 51·0 and 9·1 g%, respectively. The meat and fish intakes were varied from 100 to 0 and 0 to 100 en% of total animal consumption, respectively. The intakes from muscle, bone marrow and brain were varied (from left to right panel of Model 3) from 0 to 50 en% (muscle), 40 to 80 en% (bone marrow) and 10 to 20 en% (brain) of total meat intake. The fat contents of fish and plants were both set at 5 g%, while the average fat contents of the combined muscle/marrow/brain in meat varied from 10 (left panel of Model 3) to 30 g% (right panel of Model 3).
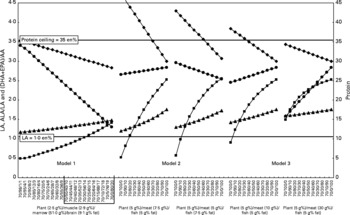
The courses of the protein (–●–) and linoleic acid (LA) intakes (–♦–, in en%) and the α-linolenic acid (ALA)/LA (–▲–) and (EPA+DHA)/arachidonic acid (AA) ratios (–■–, in g/g) with changing composition of animal food at a 30/70 en%/en% plant/animal subsistence ratio. For legend: see Figure 2.

Fig. 2 represents data for Model 1 at a 70/30 en%/en% plant/animal subsistence ratio, assuming the following fat contents: plants 2·1 g%, muscle 3·0 g%, bone marrow 51 g% and brain 9·1 g%. The contribution of muscle/marrow/brain to the consumed meat (in en%) was varied from 98/1/1 to 0/80/20 en%/en%/en%. The shorthand notations of these extremes (see X-axis labels) would be 70/98/1/1 to 70/0/80/20, in which the first figure represents the en% from plants, and the last three figures represent the en% contributions from muscle/marrow/brain in the remaining 30 en% animal food (i.e. only meat in Model 1), all at the fixed fat contents (in g/100 g material). The data in this example show that replacing muscle for bone marrow and brain (i.e. X-axis from left to right) causes a decrease in the contributions of LA and protein (both in en%), and increases in the ALA/LA and (EPA+DHA)/AA ratios (both in g/g). All the investigated meat compositions within the depicted 70/30 en%/en% plant/animal example of Model 1 complied with < 35 en% protein, >1·0 en% LA constraints and met the >450 mg EPA+DHA recommendation. Similarly, Fig. 3 shows data for Model 1 at the 30/70 en%/en% plant/animal subsistence ratio. The fat contents of plant, muscle/marrow/brain and the animal compositions were the same as described previously. The protein constraint was met from a ratio of 30/50/40/10. All the animal compositions complied with the energy constraints for LA and the 450 mg EPA+DHA recommendation.
For Model 2, examples are shown for 5 g% fat in plants, 5·0 g% fat in fish and 7·5 g% fat in whole carcass meat (Model 2, Figs. 2 and 3, left panels), and for 5 g% fat in plants, 7·5 g% fat in fish and 5·0 g% fat in whole carcass meat (Model 2, Figs. 2 and 3, right panels). The meat/fish compositions were varied from 100/0 to 0/100 en%/en% of total animal food. As shown in Fig. 2 in the left panel, for Model 2, the compliance with the protein and LA constraints and the EPA+DHA recommendation was reached for all dietary compositions.
Finally, for Model 3, examples are shown for the 70/30 en%/en% (Fig. 2) and 30/70 en%/en% (Fig. 3) plant/animal subsistence ratios, but here at 50/40/10 (left panels) and 0/80/20 (right panels) for the muscle/marrow/brain ratios. The fat contents were 5 g% for plants, 10 g% for meat and 5 g% for fish (left panels), and 5 g% for plants, 30 g% for meat and 5 g% for fish (right panels). Justifications for these fat percentages are obtained from the application of the protein constraints to Model 1 in Fig. 3, which fixed the muscle/marrow/brain ratios in meat between 50/40/10 and 0/80/20, and also consequently fixed the fat percentages.
Table 4 presents the medians (ranges) from all the investigated models together with the original data from the savannah diet as used by Eaton et al. (Reference Eaton, Eaton and Sinclair26) for a 65/35 en/en% plant/animal subsistence ratio and from Cordain et al. (Reference Cordain, Miller and Eaton27) for a 45/55 en/en% plant/animal subsistence ratio. All the data presented from Model 1 complied with the protein and LA constraints and met the EPA+DHA recommendation. All the data presented from Models 1–4 (Table 4) complied with the protein and LA constraints, and after application of these constraints, all the models also met the EPA+DHA recommendation.
(Medians and ranges)
ALA, α-linolenic acid; DPA, docosapentaenoic acid; LCP, long-chain PUFA; LA, linoleic acid; AA, arachidonic acid; P/S, polyunsaturated/saturated.
* Values in the models of Eaton et al. (Reference Eaton, Eaton and Sinclair26) and Cordain et al. (Reference Cordain, Miller and Eaton27) without references were calculated by using the present models. Protein, carbohydrate and fat contents were converted into kJ/g using conversion factors of 19·68; 17·50 and 39·53 kJ/g, respectively. Some of the calculated data on LCP, LCP n-3 and LCP n-6 from the literature may suffer from underestimaton, since authors seldomly give information on the complete fatty acid profile used to calculate these sums. Also for some fatty acid contents, more data were available in the literature than for others. As a consequence, for example, the sum of EPA+DPA+DHA (all regularly given) might be higher than the sum of LCP n-3 (seldomly given).
† Adapted from Eaton et al. (Reference Eaton and Eaton2).
‡ Adapted from Cordain et al. (Reference Cordain, Miller and Eaton27).
§ Adapted from Cordain et al. (Reference Eaton, Eaton and Sinclair26).
∥ Adapted from Eaton et al. (Reference Eaton, Eaton and Konner3).
¶ Adapted from Frassetto et al. (Reference Frassetto, Morris and Sellmeyer102).
Model outcomes
Model 1, selective hunter–gatherer/scavenger savannah diet
All the models met the EPA+DHA recommendation. It was found that with the exception of the 70/30 en%/en% plant/animal subsistence ratio, all the investigated dietary options were limited by the 35 en% protein ceiling. This ceiling was reached when more than 45 en% of animal food was consumed as muscle meat. LA, AA and EPA+DHA intakes increased with decreasing intakes of plants, whereas ALA intakes decreased. At low intakes of plants, only those options with high intakes of bone marrow and brain, relative to muscle, fulfilled the < 35 en% protein constraint. At 70 en% intake from plants, 0 en% from muscle, 80 en% from bone marrow and 20 en% from brain, the intakes of bone marrow and brain would be 141 and 148 g/d, respectively. At the lowest intake of plants (i.e. 30 en%) and at contributions of muscle, bone marrow and brain ranging from 0 to 50, 40 to 80 and 10 to 20 en%, respectively, the intakes on a weight basis of muscle, bone marrow and brain ranged from 0 to 867, 189 to 344 and 181 to 328 g/d, respectively. LA intakes ranged from 2·83 to 3·52 en% in a 70 en% plant food diet and from 2·69 to 4·30 en% in a 30 en% plant food diet. With protein and LA complying with their recommendations, the intakes of EPA+DHA ranged from 0·88 to 1·63 g/d at 70 en% plant food and from 2·20 to 2·98 g/d at 30 en% plant food, while the (EPA+DHA)/AA ratios ranged from 0·41 to 1·41 and 0·77 to 1·40 g/g, respectively.
Model 2, non-selective hunter–gatherer/scavenger savannah/aquatic diet
In this model, several plant/(meat/fish) ratios that were investigated at different fat percentages fulfilled the two constraints. All the options that met these constraints also met the EPA+DHA recommendation. Also here, the options became restricted by the protein ceiling, when the intake of animal food increased. Reaching the protein ceiling proved to be dependent on the fat contents of the meat and fish consumed, as can be concluded from Figs. 2 and 3. Not unexpectedly, these indicate that the lower the fat content of the animal foods (i.e. the leaner the meat), the sooner the protein ceiling is reached. Since LA is relatively abundant in plants, muscle and liver, but not in fish (Table 1), the constraint for LA (>1·0 en%) could not be reached if 70 en% was consumed as animal food that is composed of high-fat meat (e.g. 100 en% meat with ≥ 7·5 g% fat) in combination with low-fat plants (e.g. 2·5 g% fat) (Fig. 2, left panel for Model 2). For Model 2, Figs. 2 and 3 show that the slope of the (EPA+DHA)/AA curve steepens with increasing fat content in fish and decreasing fat content in meat. This steepening of the (EPA+DHA)/AA curve takes place at an increase of both the EPA+DHA and AA intakes, indicating that the EPA+DHA content of the various dietary options, and not the AA content, is the most variable factor in determining the (EPA+DHA)/AA ratio in Model 2.
Model 3, selective hunter–gatherer/scavenger savannah/aquatic diet
Model 3 combines the favourable foraging strategies for hunting, gathering and scavenging from Models 1 and 2. All the dietary options that met the constraints for protein and LA also met the EPA+DHA recommendation (Table 4). The protein ceiling becomes limiting at the combination of low plant intake and the consumption of low-fat meat, as can be concluded from Fig. 3 (left panel). This limitation became circumvented by the consumption of high-fat meat (Fig. 3, right panel), while it also becomes circumvented by the consumption of high-fat plants and fish (data not shown).
Model 4, non-selective hunter–gatherer/scavenger aquatic diet
In this model, 55 % of the investigated plant/fish ratios that were investigated at different fat percentages fulfilled the protein constraint. All the options meeting this constraint also met the LA constraint and the EPA+DHA recommendation.
Discussion
We estimated the medians and ranges of the dietary macronutrient and fatty acid compositions for multiple foraging strategies ascribed to Paleolithic hunter–gatherer/scavengers living in the savannah, the land–water ecosystem and the combinations of both. Most importantly, we found that the macronutrient composition averaged 25–29 en% (range 8–35) from protein, 39–40 en% (range 19–48) from carbohydrate and 30–39 en% (range 20–72) from fat. These outcomes indicate moderate-to-high protein and fat intakes, with moderate carbohydrate intakes. Compared with the current Western intakes and recommendations, the fatty acid composition was high in SFA (range of medians 11·4–12·0; total range 6·8–19 en%), and moderate-to-high in MUFA (5·6–18·5; 3·1–39 en%) and PUFA (8·6–15·2; 8·1–21 en%). The PUFA were high in ALA (3·7–4·7; 2·1–5·8 en%), low in LA (2·3–3·6; 1·7–6·2 en%), and high in LCP (4·75–25·8; 3·38–51·3 g/d), both LCP n-3 (2·26–17·0; 1·47–33·9 g/d) and LCP n-6 (2·54–8·84; 1·91–17·4 g/d). Consequently, the ALA/LA ratio (1·12–1·64; 0·61–1·79 g/g) was remarkably higher compared with the present ALA/LA ratio (ALA/LA = 0·09(Reference Ervin, Wright and Wang81)). The LCP n-3/LCP n-6 ratio (0·84–1·92; 0·22–3·07 g/g) was comparable to the current ratio (0·85(Reference Ervin, Wright and Wang81)), but the absolute intakes of both LCP n-3 and LCP n-6 were remarkably higher.
Our ecological niche
From 1·9 million to 200 000 years ago, hominins tripled their brain mass relative to body mass, which is usually expressed in terms of the encephalisation quotient. The predominantly vegetarian Australopithecines were estimated to have an encephalisation quotient of 1·23–1·92, while the Homo genus has an encephalisation quotient of 1·41–4·26(Reference Broadhurst, Cunnane and Crawford9). The Ardipithecus ramidus may have persisted in a more closed wooded habitat(Reference White, Ambrose and Suwa82), but the Australopithecines are assumed to have left the forest to enter the open(Reference Washburn, Lancaster, Lee and DeVore83), where they were able to introduce more energy-dense animal food into their diets at the expense of energy-poor plants(Reference Sailer, Gaulin and Voster84). Improvement of dietary density and quality may have enabled an increase in brain size, while it also provided the higher energy needs for the expanding, metabolically expensive, brain. It has been hypothesised that the brain growth was preceded by the development of a sizeable adipose tissue compartment(Reference Wells85) to ensure continuous availability of energy, which is also known as ‘the survival of the fattest’(Reference Cunnane and Crawford86). Other physical adjustments might have been necessary, since the adult primate brain usually consumes 8–9 % of the total RMR, while this amounts to 20–25 % in anatomically modern humans(Reference Leonard, Robertson and Snodgrass87). One of these adjustments is the loss of muscle(Reference Leonard, Robertson and Snodgrass87). Additional energy reallocation might have come from adjustment of the gastrointestinal tract. The size of our current gastrointestinal tract comprises only 60 % of that expected for a similarly sized primate, probably because of its devotion to easily digested energy-dense foods rather than a fibre-rich, bulky and consequently energy-poor vegetarian diet that requires a large colon(Reference Milton88). The trade-off with the energetically expensive gastrointestinal tract is also known as the ‘expensive tissue hypothesis’ as proposed by Aiello & Wheeler(Reference Aiello and Wheeler89).
Brain expansion necessitates not only energy for its growth and maintenance but also the availability of building blocks such as AA and DHA, and many other factors, collectively referred to as ‘brain-selective nutrients’ (or ‘brain food’)(Reference Broadhurst, Cunnane and Crawford9, Reference Crawford15). The question is what ecological niche would have supported the growth of our brain and especially the increment of DHA within a species characterised by the low capacity to synthesise DHA but high DHA needs. Comparison of the brain ethanolamine phosphoglycerols of forty-two species shows an almost identical LCP pattern that, independent of encephalisation quotient, is composed of about equal percentages of AA and DHA(Reference Broadhurst, Cunnane and Crawford9). A low dietary DHA intake by rats lowers DHA in the frontal cortex, down-regulates DHA turnover and increases AA turnover, which is a condition that has been related to neuroinflammation(Reference Rao, Ertley and DeMar90). Accretion of DHA in the brain of newborn baboons(Reference Hsieh and Brenna91) and newborn humans(Reference Makrides, Neumann and Byard92) depends on the postnatal dietary DHA supply during the brain growth spurt, which occurs from the last trimester up to 2 years after birth in humans. An experiment with diets varying in ALA, LA, AA and DHA administered to female mice from 3 d before conception showed that, in contrast to the relatively static maternal brain, the growing fetal brain is extremely sensitive to low maternal dietary DHA(Reference van Goor, Dijck-Brouwer and Fokkema93). Many RCT that aimed at the consequences of low DHA in the brain of human newborns have been performed. The results are at most inconclusive(Reference McCann and Ames22), but various recommendations for DHA intakes by formula-fed and breast-fed infants have been issued(Reference Koletzko, Lien and Agostoni94).
Taken the afore-mentioned results together, it seems clear that the evolution of our brain growth is unlikely to have been hampered by poor availability of dietary DHA, which is abundant in the brain of the animals that we might have consumed in the savannah, but notably the food that is available in a land–water ecosystem. Our derivation from the land–water ecosystem is strengthened by the African(Reference Broadhurst, Cunnane and Crawford9) and European(Reference Erlandson10) fossil records and the many pathophysiological consequences of a low DHA status and a low intake of ‘brain food’ in general. The many indications for the exploitation of aquatic resources by early hominins date back as far as 2·3–2·0 million years ago in Semliki River, Zaire(Reference Erlandson10). Collection of aquatic foods is still a daily practice in East Africa, and picking up, clubbing, spearing or killing aquatic animals from a distance(Reference Isaac95) seem to be much easier than either scavenging or hunting game on the Serengeti plains(Reference Broadhurst, Cunnane and Crawford9). Contrary to the popular belief, our ancient ancestors did not need fishing gear to benefit from the abundance of LCP n-3 and LCP n-6 in such ecosystems, where it is relatively easy to hunt and gather anything ranging from spawning (cat)fish, shellfish, crustaceans and cephalopods (lobster, crab, shrimp, squid, octopus, etc.) to sea urchins, amphibians, birds and reptiles and their respective eggs(Reference Erlandson10). All of these species ultimately receive their LCP n-3 from plankton via the local food chain(Reference Sargent96). We seem to have experienced a diminishing consumption of food from this ecosystem since the Out-of-Africa diaspora(Reference Simopoulos97). For instance, analysis of 13C-collagen from bones(Reference Richards, Schulting and Hedges98) showed a sharp shift from a marine-based diet to a terrestrial-based diet in Britain at the onset of the Neolithic (4000 years ago). Also the consumption of animal brain is conceivable, but may not solely be responsible because of its lack of many other constituents of ‘brain food’, notably iodine(Reference Cunnane16). Abundantly available iodine is characteristic for marine ecosystems. The wide occurrence of iodine deficiency in people living in the inland suggests that hominin encephalisation likely occurred in the land–water ecosystem. Although some traditional inland hunter–gatherers might circumvent this problem by organ consumption, including the iodine-rich thyroid of their prey, many ‘modern’ humans, living far from the land–water ecosystem, have abolished organ consumption and may consequently suffer from iodine deficiencies if the element is not added to common salt.
Macronutrients
Total protein intake from the presumed Paleolithic diet contributed 25–29 en% of the daily energy intake (range 8–36), which is remarkably higher than the average present-day intake of 15 en% in the USA(99), at the high range of 10–35 en% as recommended by RDA of the National Institute of Medicine(100), somewhat lower than was reported by Eaton et al. (Reference Eaton, Eaton and Sinclair26) (37 en%) and comparable to the 30en% (range 19–35) as reported by Cordain et al. (Reference Cordain, Miller and Eaton27). The current estimate may be rated as a moderate-to-high-protein diet. On a weight basis, the protein intake from a 12 500 kJ Paleolithic diet was estimated at 160–185 g/d (range 51–223) (RDA for adults 46–52 g/d(100)), of which animal protein was 108–140 g/d, and plant protein was 45–54 g/d. By contrast, modern humans consume less than one-half that amount of animal protein (i.e. 64–68 g/d), and about two-thirds that amount of plant protein (i.e. 32–36 g/d) from an average diet of 10 850 kJ for men and 7312 kJ for women(Reference Smit, Nieto and Crespo101, Reference Frassetto, Morris and Sellmeyer102). Our models show that a Paleolithic diet results in a moderate carbohydrate intake of 39–40 en% (range 19–48), which is similar to the intake of 41 en% in Eaton's model(Reference Eaton, Eaton and Sinclair26). The 34 en% (range 22–40) intake in Cordain's model(Reference Cordain, Miller and Eaton27) was somewhat lower than current estimates, because of an assumed higher animal food intake at the expense of carbohydrate-rich plants. Current carbohydrate intakes in affluent countries average 49 en% for men and 52 en% for women(99), while the recommendations range from 40 to 65 en%(100). From 1971 to 2000, carbohydrate intakes in the USA have increased (men, from 42 to 49 and women, from 45 to 52 en%) at the expense of fat (men, from 37 to 33 and women, from 36 to 33 en%), saturated fat (men, from 14 to 11 and women, 13 to 11 en%) and protein (men, from 17 to 16 and women, from 17 to 15 en%)(99). This may at least partially originate from the advice to lower the fat intake, especially SFA, and to replace by intake of carbohydrates(100). In our models, a moderate-to-high 30–39 en% (range 20–72) was obtained from fat, which is comparable with the current Western intakes of about 33 en%(99), at the high range of the recommended 20–35 en%(100), higher than the 22 en% fat intake in the model of Eaton et al. (Reference Eaton, Eaton and Sinclair26), but comparable with the 36 en% (range 28–58 en%) in the model of Cordain et al. (Reference Cordain, Miller and Eaton27).
Beasley et al. (Reference Beasley, Ange and Anderson103) showed that a carbohydrate intake in the low range of the recommended en% (i.e. 48 en%), together with a protein intake (25 en%) at the high range of recommended en% and a fat intake at the recommended average en% (27 en%) reduces self-reported appetite, compared with diets with higher carbohydrates (58 en%) or high unsaturated fat (37 en%). In addition, compared with three other diets, the low-carbohydrate/high-protein ‘Atkins’ diet proved superior for weight loss within a 1-year randomised trial performed with overweight premenopausal women(Reference Gardner, Kiazand and Alhassan104). The effect is likely to be caused by better dietary adherence(Reference Alhassan, Kim and Bersamin105), which was obviously superior in those receiving the high-protein Atkins diet(Reference Gardner, Kiazand and Alhassan104, Reference Alhassan, Kim and Bersamin105). A high-protein diet induces satiation via the anorectic hormone peptide YY(Reference Batterham, Heffron and Kapoor106) and satiety by its high diet-induced energy expenditure. The latter amounts to 0–3 % for fat, 5–10 % for carbohydrate and 20–30 % for protein, and is needed for intestinal absorption, initial metabolism and storage of the nutrient products that are not immediately utilised. The concomitant oxygen consumption and rise in body temperature lead to a feeling of oxygen deprivation, which promotes satiety(Reference Westerterp-Plantenga, Nieuwenhuizen and Tome107). Similar appetite-controlling effects may be expected from the Paleolithic diets (Table 4), which contain even lower carbohydrate, but higher fat, compared with the low-carbohydrate/high-protein diet as used by Beasley et al. (Reference Beasley, Ange and Anderson103). The Paleolithic diets have, however, higher carbohydrate, similar protein and lower fat, compared with the ‘Atkins diet’ as used by Gardner et al. (Reference Gardner, Kiazand and Alhassan104). The high volume of the Paleolithic diet, that is partially composed of bulky fibre in vegetables and fruits, may also enhance satiety and satiation(Reference Rolls108).
The weight-controlling effect of a Paleolithic diet was indeed shown by Osterdahl et al. (Reference Osterdahl, Kocturk and Koochek109), who in an uncontrolled study with healthy adults, demonstrated a decrease in weight, BMI and waist circumference after 3 weeks ad libitum consumption of a Paleolithic-like diet (i.e. 6633 kJ/d; carbohydrate 40, protein 24, fat 36 en%), compared with their baseline usual diet (10 377 kJ/d; carbohydrate 54, protein 14, fat 30 en%). Similarly, improved reduction in weight, BMI and waist circumference were shown in the study of Jonsson et al. (Reference Jonsson, Granfeldt and Ahren110), who performed a 2 × 3 months cross-over study in type 2 diabetic patients receiving a Paleolithic diet (6620 kJ/d; carbohydrate 32, protein 24, fat 39 en%) or a Diabetes diet (7864 kJ/d; carbohydrate 42, protein 20, fat 34 en%). In a randomised trial in patients with IHD plus glucose intolerance or type 2 diabetes, Lindeberg et al. (Reference Lindeberg, Jonsson and Granfeldt111) showed a reduced energy intake after ad libitum consumption of a Paleolithic diet (5628 kJ/d; carbohydrate 40, protein 28, fat 27 en%) compared with an ad libitum Mediterranean-like Consensus diet (7517 kJ/d; carbohydrate 52, protein 21, fat 25 en%). The studies of Osterdahl et al. (Reference Osterdahl, Kocturk and Koochek109), Jonsson et al. (Reference Jonsson, Granfeldt and Ahren110) and Lindeberg et al. (Reference Lindeberg, Jonsson and Granfeldt111) suggest that the underlying reduced energy intake was due to improved appetite control. They may also have been accompanied by improved body composition, since studies on high protein intakes during body weight loss and subsequent maintenance have shown preserved or increased fat-free mass at the expense of fat mass, and an improved metabolic profile(Reference Westerterp-Plantenga, Nieuwenhuizen and Tome107). Contrary to widespread belief, high-protein diets do not have adverse effects on bone mass and especially if the diet is also rich in fruits and vegetables(Reference Hunt, Johnson and Fariba Roughead112). They are more likely to promote bone health and reduce the incidence of osteoporotic fractures(Reference Westerterp-Plantenga, Nieuwenhuizen and Tome107).
The current carbohydrate intake in affluent countries is not only high compared with that of our Paleolithic ancestors, but there is also a marked qualitative difference. In the era before the agricultural revolution, the majority of carbohydrates were derived from fresh fruits and vegetables, together with roots and tubers, and very little were derived from cereal grains or refined carbohydrates with high glycaemic indices (e.g. highly processed grains, sucrose and fructose)(Reference Eaton and Konner1). For hunter–gatherers, wild honey provides the only type of the so-called ‘empty calories’ (high-energy food without essential amino acids, essential fatty acids or micronutrients), but it is only seasonably accessible and accounts for no more than 0·4–1·2 en% in the studied foragers(Reference Eaton, Eaton and Konner3). Food products with high glycaemic loads, especially when consumed in isolation, cause transient hyperinsulinaemia (which is associated with CHD) and postprandial hypoglycaemia (which is associated with increased hunger and lowered satiety)(Reference Barclay, Petocz and McMillan-Price113–Reference Last and Wilson115). There is increasing evidence that carbohydrates, especially refined carbohydrates with high glycaemic indices, and food products with high glycaemic loads play important roles in the aetiology of the diseases associated with the metabolic syndrome, such as type 2 diabetes mellitus and CHD(Reference Barclay, Petocz and McMillan-Price113–Reference Last and Wilson115).
Evidence for the beneficial effects of Paleolithic diets may also be derived from their influence on classical CHD risk factors. The uncontrolled study of Osterdahl et al. (Reference Osterdahl, Kocturk and Koochek109) showed favourable effects on systolic blood pressure and plasminogen activator inhibitor-1, while the study of Jonsson et al. (Reference Jonsson, Granfeldt and Ahren110) in type 2 diabetic patients resulted in lower HbA1c, TAG and diastolic blood pressure, and higher HDL-cholesterol, when compared with the Diabetes diet. The trial of Lindeberg et al. (Reference Lindeberg, Jonsson and Granfeldt111) in patients with IHD showed a larger improvement in glucose tolerance, independent of decreased waist circumference, for a Paleolithic diet, when compared with a Mediterranean-like Consensus diet. In an uncontrolled trial, Frassetto et al. (Reference Frassetto, Schloetter and Mietus-Synder116) showed that consumption of an isoenergetic Paleolithic type of diet (11 311 kJ/d; carbohydrate 38, protein 30, fat 32 en%) for 10 d improved blood pressure, arterial distensibility, insulin sensitivity, and total, HDL- and LDL-cholesterol in healthy sedentary human subjects, when compared with their baseline usual diet (9933 kJ/d; carbohydrate 44, protein 18, fat 38 en%). Importantly, there were no statistically significant changes in energy intakes, activity levels and body weight, showing that the improved CHD risk profile was unrelated to weight reduction.
Dietary cholesterol
Current recommendations for the intake of cholesterol range from ‘as low as possible’ to < 300 mg/d(100). Estimated intakes from the models of Eaton et al. (Reference Eaton, Eaton and Sinclair26) and Cordain et al. (Reference Cordain, Miller and Eaton27) (recalculated from our data) were 480 and 830 mg/d, respectively, while the current estimates from Models 2–4 are 498, 914 and 523 mg/d. The sizeable intakes of cholesterol in Models 1 and 3 are derived from very high amounts of cholesterol in brain (2037 mg/100 g)(33) and marrow (119·6 mg/100 g)(Reference Kunsman, Collins and Field117), compared with an average amount of 65·9(Reference Eaton, Eaton and Konner6) in meat and 60·2 mg/100 g(33) in fish. The estimated Paleolithic cholesterol intakes are well above the present intakes of 320 mg/d in the USA(Reference Klein118) and the proclaimed ‘high cholesterol intakes’ of Japanese men (446 mg/d) and women (359 mg/d)(Reference Klein118). Hunter–gatherers(Reference O'Keefe, Cordain and Harris119) have low serum total cholesterol and LDL-cholesterol, typically ranging from 2·1 to 3·6 and 1·0 to 1·8 mmol/l, respectively, that do not increase with age(Reference Mann, Roels and Price120). The pastoral living Maasai have high intakes of fat (about 300 g/d), SFA and cholesterol (about 600 mg/d) from both milk and meat. Yet they exhibit low serum total cholesterol (about 3·3 mmol/l) with extensive atherosclerosis with lipid infiltration and fibrous changes of their aortas, together with intimal thickening of their coronary arteries. They are nevertheless virtually free from signs of CHD, they have smaller hearts, their blood pressure exhibits only a slight tendency to increase with age, they have low BMI, and they are remarkably fit(Reference Mann, Shaffer and Rich121). The currently estimated cholesterol intakes by our ancient ancestors, and data from the Japanese and the Maasai do not support the limitation of dietary cholesterol intake to 300 mg or ‘as low as possible’. Cholesterol intakes above these recommendations might at most be disadvantageous by their interaction with other unfavourable changes in diet or lifestyle.
Fatty acids
SFA
The average (range) SFA intake from our reconstructed diets was 11·4 (7·2–18), 12·0 (6·9–19), 11·5 (9·9–16) and 12·0 (6·8–17) en% for Models 1–4, respectively. It is currently recommended to maintain the SFA intake ‘as low as possible’ and preferably below 10 en%. The association that is usually presented to illustrate that SFA are hypercholesterolaemic(100) is not only characterised by high inter-individual variation, but also by a slope that indicates that 1 en% SFA increases serum total and LDL-cholesterol by no more than 0·052 and 0·036 mmol/l, respectively(Reference Clarke, Frost and Collins122). It was recently concluded that there is insufficient evidence that SFA is causally related to CHD risk(Reference Mente, de Koning and Shannon123). Replacement of SFA by carbohydrates at low total fat intake might even be associated with greater CHD progression(Reference Mozaffarian, Rimm and Herrington124).
A SFA (notably 16 : 0)-rich diet might only be hypercholesterolaemic in the context of a carbohydrate-rich diet. When carbohydrate is replaced by SFA, the increase in HDL-cholesterol is even higher compared with the replacement by MUFA or PUFA, although a significant decrease in the total cholesterol/HDL-cholesterol ratio is only observed when carbohydrates are replaced by PUFA and MUFA(Reference Mensink, Zock and Kester125). Volek et al. (Reference Volek, Fernandez and Feinman5) not only showed that a SFA-rich carbohydrate-restricted hypoenergetic diet (carbohydrate 12 en%, fat 60 en%, SFA 36 g), compared with a hypoenergetic low-fat diet (carbohydrate 56 en%, fat 34 en%, SFA 12 g; both 6281 kJ), was superior in improving CHD risk factors but also showed that the subjects consuming the carbohydrate-restricted SFA-rich diet had lower SFA in serum TAG and cholesteryl esters. It seems that a carbohydrate-rich diet prolongs circulatory exposure to SFA, causing a more intense interaction with toll-like receptors 4 and 2(Reference Davis, Gabler and Walker-Daniels126), and thereby the release of proinflammatory cytokines such as monocyte chemoattractant protein-1 by adipocytes(Reference Schaeffler, Gross and Buettner127). This mimicking of lipopolysaccharide action by SFA may trigger the hyperlipidaemia of sepsis(Reference Hudgins, Parker and Levine128). It is increasingly acknowledged that metabolism and inflammation are intimately related(Reference Bensinger and Tontonoz7). The saturated lauric acid (12 : 0) exhibits a significant decrease in the total cholesterol/HDL-cholesterol ratio when 1 en% carbohydrates are replaced by lauric acid. Isoenergetic replacement of 10 en% of the average US diet by carbohydrates causes a higher increase of the total cholesterol/HDL-cholesterol ratio than butter, while coconut oil decreases this ratio(Reference Mensink, Zock and Kester125). It is possible that our ancient ancestors living in tropical areas at the sea experienced all benefits of the combination of moderate carbohydrate and SFA intakes, and that they had abundant access to coconut-derived lauric acid, which is not only readily absorbed but also known for its anti-microbial properties(Reference Kuipers, Smit and van der Meulen35).
MUFA
In Models 2 and 4, the MUFA intakes (i.e. 7·4 and 5·6) are somewhat lower and equal to those from the models of Eaton (7·4) and Cordain (9·2), and on the low side, when compared with the worldwide intakes ranging from 8 en% in parts of China(Reference Zhou, Stamler and Dennis129) to more than 20 en% in the Mediterranean(Reference Matalas130). The average MUFA intake in Model 3 (i.e. 13·0 en%) is similar to the 13 en% in the USA(Reference Rudman, DiFulco and Galambos74), while the 18·5 en% in Model 1 is intermediate to this 13 en% and the high intakes in the Mediterranean. Populations consuming high-MUFA diets show low incidence of CHD(Reference Tunstall-Pedoe, Kuulasmaa and Mahonen131). However, although Japanese have low (9 en%) MUFA intakes(Reference Zhou, Stamler and Dennis129), they also have low CHD risk(Reference Sugano and Hirahara132). When replacing SFA by MUFA (11 en%) or carbohydrate (20 en%), MUFA provided a greater risk reduction in CHD than did carbohydrate(Reference Berglund, Lefevre and Ginsberg133), while replacement of 1 en% carbohydrates with cis-MUFA caused a steep decrease in the total cholesterol/HDL-cholesterol ratio(Reference Mensink, Zock and Kester125). Taken together, it seems that MUFA are notably beneficial at isoenergetic low-to-moderate carbohydrate intakes.
α-Linolenic acid and linoleic acid
In our models, the median ALA consumption and its range (Table 4) indicate that the mixing of fish and the introduction of selective consumption of meat into the savannah-derived Paleolithic diets as used by Eaton et al. and Cordain et al. (Reference Eaton and Konner1, Reference Eaton, Eaton and Sinclair26–Reference Cordain, Watkins and Mann28) increases the ALA intake to an average of 3·7–4·7 en% (range 2·1–5·8). The models also show consistently low LA intakes (2·3–3·6, range 1·7–6·2 en%). After employment of the protein constraint, it proved unnecessary to additionally employ the 1·0 en% LA constraint, since all of the remaining options within the four foraging strategies provided over 1·0 en% of LA.
The average daily intake of ALA for British omnivores was 0·4 en% (1·3 g/d) and 0·7 en% (2·2 g/d) for vegans(Reference Sanders134), which are both remarkably lower than the ALA intakes from the current and earlier Paleolithic diets as used by Eaton and Cordain. It is possible that the easily recycled(Reference Cunnane, Ryan and Lin135) dietary ALA constituted an important precursor for the synthesis of SFA, MUFA, cholesterol and ketone bodies for energy generation. The higher ALA intakes, compared with LA, might additionally explain why ALA is β-oxidised twice as fast as LA(Reference Cunnane136). High ALA intakes from a Paleolithic diet might also be in line with the indications that ALA plays an important role in CHD prevention(Reference Stark, Crawford and Reifen137). Anti-inflammatory effects of a high ALA intake include reductions in C-reactive protein, soluble intercellular adhesion molecule 1, soluble vascular adhesion molecule 2, IL-6, IL-1β and TNF-α(Reference Stark, Crawford and Reifen137, Reference Zhao, Etherton and Martin138). Inconclusive evidence for the role of ALA in CHD(Reference Mente, de Koning and Shannon123) might be explained by low intakes of ALA in combination with relatively high LA intakes, and it would be consistent with the stronger evidence linking increased ALA intake to low CHD risk, as observed for the subjects with low fish intakes(Reference Djousse, Arnett and Carr139). The current models with ALA/LA ratios ranging from 0·61 to 1·79 g/g (Table 4) reassert the unfavourable ALA/LA ratio in the Western diet, while such ratios were also used in many, if not all, intervention trials.
The LA intake of the models did not exceed 6·2 en%. These outcomes are comparable with the calculated intakes from the models of Eaton et al. (Reference Eaton, Eaton and Sinclair26) and Cordain et al. (Reference Cordain, Miller and Eaton27). It is currently advised to augment the LA intake to 5–10 en%, since it was concluded that aggregate data from RCT, case–control and cohort studies, and long-term animal feeding experiments indicated that these intakes reduce CHD risk(Reference Harris, Mozaffarian and Rimm140). This, recently reinforced, advice by the American Heart Association has promoted the daily LA intake in Western countries to 4–9 en%(Reference Ailhaud, Massiera and Weill71). It also caused an increase in LA content in the breast milk to >15 g% in many Western countries(Reference Ailhaud, Massiera and Weill71), which is significantly higher compared with the 4·2–5·2 g% LA in the milk of traditionally consuming Tanzanian populations(Reference Kuipers, Smit and van der Meulen35). Our data indicate that such an LA status cannot be achieved without the consumption of refined vegetable oils. These have never been part of the diet on which our genome has been evolved to what it currently is. Correction of our current high CHD risk, by the introduction of nutrient intakes that have never been reached in the past, harbours the risk of introducing new imbalances. Employing the Hill criteria for causality, Mente et al. (Reference Mente, de Koning and Shannon123) recently concluded that there is insufficient evidence that PUFA are causally related to CHD risk. In addition, it seems that the RCT with positive outcomes have been conducted at 11–21 en% LA(Reference Harris, Mozaffarian and Rimm140) in which LA, sometimes also combined with increased ALA, fish or cod liver oil, replaced SFA. High intakes of LA, but not AA(Reference Ramakers, Mensink and Verstege141), have been related to the aetiology of ulcerative colitis(Reference Hart142), while LA intake was positively associated with a risk of severely depressed mood(Reference Wolfe, Ogbonna and Lim143) and homicide(Reference Hibbeln21). Studies with human endothelial cells suggest that LA might promote inflammation through activation of NF-κB, and increased production of TNF-α, IL-6 and other inflammatory mediators(Reference Calder144). The high prevalence of CHD, hypertension, type 2 diabetes mellitus and obesity in Israel, also referred to as the ‘Israelian paradox’(Reference Yam, Eliraz and Berry145), might be related to the nationwide 8–12 % higher PUFA intakes in Israel, compared with other Western countries. Ailhaud et al. (Reference Ailhaud, Massiera and Weill71) considered the decreasing dietary ALA/LA ratio, due to both an increase in LA and a decrease in ALA, in Western diets as a possible cause of obesity. Finally, it has become clear that the current high LA intake causes inhibition of the conversion of ALA to EPA and DHA, and thereby contributes to our currently low LCP n-3 status(Reference Angela Liou and Innis146).
Long-chain PUFA
In Models 2–4, the average sum of the intakes of the fish oil fatty acids EPA and DHA were 6·1 (range 0·88–28·3), 5·8 (range 1·38–11·6) and 14·2 (range 5·34–28·3) g/d. Because of the inclusion of food from the land–water ecosystem, these figures were much higher than those from the models of Eaton et al. (Reference Eaton, Eaton and Sinclair26) and Cordain et al. (Reference Cordain, Miller and Eaton27). The calculated average AA intakes of 3·65, 2·84 and 5·46 g/d (ranges 1·69–10·7; 1·15–4·61; 2·14–10·7), respectively, are also considerably higher compared with the intake of 1·81–2·41 g/d (range 1·15–2·77) of the savannah models.
In Model 2, the high LCP n-3 intake (median 7·64 g/d) is about half the intake of Inuit who have lifetime consumption of about 14 g LCP n-3/d(Reference Feskens and Kromhout147), while in Model 4 the intake of 17·0 g LCP n-3/d is even somewhat higher. The similarity between the LCP n-3 contents in the milk of Tanzanian mothers with high daily consumption of freshwater fish from Lake Victoria(Reference Kuipers, Smit and van der Meulen35) and the LCP n-3 contents in the milk of Canadian Inuit(Reference Innis and Kuhnlein148) adds to this notion. Both the model outcomes are also in line with the estimates of Broadhurst et al. (Reference Broadhurst, Wang and Crawford11) who calculated a daily intake of 29 g fish oil from a 9196 kJ diet by current native Africans living on the shore of Lake Malawi. With a 15 g% average EPA+DHA content of the local fish, this would imply an intake of at least 6 g LCP n-3/d, which is remarkably comparable with the intakes from Models 2 and 3. Crawford et al. (Reference Crawford, Bloom and Broadhurst149) estimated the daily intake of contemporary populations living at East African lakes (Lakes Nyasa and Turkana) at 1–4 g LCP n-3 and 0·5–1·0 g AA, respectively. All of the above-mentioned data suggest that in the Paleolithic era the intakes of EPA plus DHA greatly exceeded those currently recommended in Western societies (450–500 mg/d(Reference Mozaffarian and Rimm150, Reference Psota, Gebauer and Kris-Etherton151)), while also the AA intake was much higher than the present-day intake (about 200 mg/d(Reference Astorg, Arnault and Czernichow152)). Of interest is the lower (EPA+DHA)/AA ratio in African fish (2·67 g/g) and consequently in the fish-based Paleolithic diets (1·82–2·60 g/g), compared with Northern latitude fish (7·48 g/g in cold water fish; 8·74 g/g in European fish) (supplementary Table S1, available online only at http://journals.cambridge.org). It seems that many, if not all, intervention trials have been conducted with high (EPA+DHA)/AA ratios and certainly with relatively low absolute amounts of (EPA+DHA), while the intake of AA is usually ignored.
Our finding of high LCP intakes compared with the parent precursors LA and ALA and the knowledge that about 75 g% of dietary LA and ALA is fully β-oxidised, even under extreme dietary LCP n-3 deficiency(Reference Cunnane, Ryan and Lin135), put the fatty acid desaturase (FADS) polymorphisms(Reference Xie and Innis153), the concept of ‘essential fatty acid deficiency’ and also the n-3/n-6 ratio into different perspectives. In contrast to the present, both the FADS polymorphisms and our difficulty to synthesise DHA might have been unimportant in the past. The chain elongation/desaturation pathway might not have been used at all, and LA and ALA deficiency might never have occurred. LA deficiency may be defined clinically in terms of symptoms such as a scaly dry skin and reproductive failure(Reference Collins, Sinclair and Royle154), and ALA deficiency may be defined in terms of numbness, paraesthesia, weakness, pain and blurred vision(Reference Holman, Johnson and Hatch155), while these deficiencies are biochemically characterised in terms of the accumulation of Mead acid(Reference Mead156) or an increased Mead acid/AA ratio(Reference Cunnane136). Neither symptoms nor Mead acid accumulation will occur when the intakes of AA and DHA are high, since these would inhibit fatty acid desaturase 1 and 2 activities. Also the specific function of LA in the synthesis of skin ceramides might be conserved and thereby skin's water barrier function, since dietary AA might in such circumstances become retroconverted to LA(Reference Hansen, Jensen and Wettstein-Knowles157). Retroconversion of DHA to EPA(Reference Conquer and Holub158) and possibly to ALA may also have occurred. Since under these conditions neither LA nor ALA would be essential, it was suggested(Reference Cunnane136, Reference Le, Meisel and de Meijer159) to consider AA and DHA as the genuine essential fatty acids. It would also imply that the presently employed constraint of 1·0 en% LA would be superfluous, and that the vigorously debated ‘healthy’ dietary n-3/n-6 ratio(Reference Simopoulos97) and the currently depicted (EPA+DHA)/AA ratio might have been unimportant in the past. AA, EPA and DHA might under these circumstances not compete with each other, but rather jointly compete with other fatty acids causing full saturation of tissues with LCP. This is currently not the case. For instance, Hsieh et al. (Reference Hsieh and Brenna91) showed that raising the DHA content in milk from 0·3 to 1·0 g%, both at 0·7 g% AA, caused an increase in DHA in virtually all the investigated brain regions of the newborn baboon without affecting their AA contents. This suggests that newborns in Western countries have low DHA in brain, since many of their mothers have DHA contents in the range of 0·3 g% in milk(Reference Kuipers, Fokkema and Smit34). Finally, Angela Liou & Innis(Reference Angela Liou and Innis146) recently showed that minimum LA requirements for AA synthesis are below 3·8 en%, and suggested that the encountered twofold inter-individual variance of AA status might be due to FADS polymorphism. The estimated AA intakes by our Paleolithic ancestors suggest that neither of these problems might have been of importance in the past.
The suggested high dietary intakes of LCP, notably those of AA, raise questions regarding their toxicities. In a recent study, it was concluded that estimated DHA intakes of up to 315 mg/d by 1- to 6-month-old infants are safe, and that no consistent adverse effects in platelet function, lipid levels, in vivo oxidation parameters, glycaemic control or immune function have been observed in adults consuming up to 7·5 g DHA/d(Reference Lien160). Inuit(Reference Feskens and Kromhout18, Reference Innis and Kuhnlein148) and the many fish-eating populations in other countries, including Africa(Reference Kuipers, Fokkema and Smit34, Reference Kuipers, Smit and van der Meulen35), are living testimony of this thesis. AA is, however, invariably feared for its role in coagulation and inflammatory reactions. A human feeding study with 6 g AA/d (supplemented as ethyl ester) was terminated because of a marked increase in in vitro platelet aggregation(Reference Seyberth, Oelz and Kennedy161). In subsequent well-controlled studies, Nelson et al. (Reference Nelson, Schmidt and Bartolini162) observed no changes in blood coagulation, thrombotic tendencies or immune functions(Reference Kelley, Taylor and Nelson163), but also observed a small increase in neutrophil count and immune response to influenza vaccine(Reference Kelley, Taylor and Nelson164), together with increases in thromboxane, PGI2(Reference Ferretti, Nelson and Schmidt165), PGE2 and leukotriene B4 (Reference Kelley, Taylor and Nelson163) in healthy male adults consuming 1·5 g AA for 50 d. They attributed the near absence of changes in the immune functions tested to derive from the opposing effects of PG and thromboxanes. Recently, Kusumoto et al. (Reference Kusumoto, Ishikura and Kawashima166) showed that supplementation of 840 mg AA/d for 4 weeks did not affect metabolic parameters or platelet function. Moreover, the ‘proinflammatory’ AA is also needed for the synthesis of AA-derived lipoxines, which are pro-resolving and mediate the switch to the synthesis of the anti-inflammatory resolvins and protectins synthesised from EPA and DHA(Reference Serhan167). It should finally be noted that all these studies were performed with high AA, low LCP n-3 supplements. In our models, the increase in EPA+DHA is more pronounced compared with the increase in AA (see ratio (EPA+DHA)/AA in Figs. 2 and 3), with increasing LCP intakes. Other studies relating AA with or without concomitant EPA+DHA intakes to eicosanoid production showed that dietary AA enhanced in vivo eicosanoid production(Reference Whelan, Li and Birdwell168), while even low doses of AA were able to reverse EPA+DHA-induced decreases in PGI2 and thromboxane A2 production(Reference Sanigorski, Sinclair and Hamazaki169). Although short-term AA-rich meat diets did not affect platelet aggregation, thromboxane B2, PGI2 or thromboxane A2 production(Reference Mann, Sinclair and Pille170), O'Dea et al. (Reference O'Dea and Sinclair171) showed a rise in bleeding time after the consumption of LA- and AA-rich meat and fish. Together, the health effects of AA are still controversial, and there is as yet insufficient evidence to decide whether high AA, with or without concurrent high LCP n-3 intakes, are harmless or beneficial(Reference Calder144, Reference Calder172), but high intakes of AA clearly need caution. However, it is likely that at high dietary AA and DHA intakes, the surpluses will for a great deal be used for retroconversion, energy generation or both, although to our knowledge no hard data are available in support of this notion.
Limitations
The outcome of our models should be viewed upon as indicative for the range of the dietary compositions of our ancestors, since we have obviously no hard data on their foraging strategies and the nutrient compositions of the plants and animals that they consumed. Our data rely on the comparability of the compositions of contemporary foods with the foods available in the Paleolithic and on the representativeness of the foods that have been analysed. Whether our earliest ancestors employed cooking remains controversial, but its employment would have increased the digestibility of certain plant foods and consequently the availability of certain nutrients. While for fish species an increasing amount of literature on energy density, macronutrient content and fatty acid composition is available, comparable literature on wild animals and plants is scarce or inaccessible. With respect to East African plant specimens, the literature provides even less information. For example, the AA contents of plants are derived from a single publication, and those analyses were not confirmed by MS. Despite the even higher AA content of seaweed and insects, the AA contents of many plant foods are probably lower, and their AA contents certainly warrant further studies. In other words, a better approximation of the Paleolithic diet would be possible when more complete information on fatty acids in African nuts, fruits, roots, bulbs, gums and tubers would become available. There is no evidence that our ancestors used fishing gear before 300 000 years ago(Reference Erlandson10). However, there is circumstantial evidence that fish up to 1 m in length were caught bare handed, when spawning during the rainy periods or when trapped in pools during drought(Reference Stewart12). Nevertheless, the current use of the fatty acid composition of East African fish might not be appropriate, and in reality might better be described by some combination of the fatty acid compositions of a variety of animals living in the land–water ecosystem, who ultimately receive their LCP from plankton. Apart from fish, however, we could not recover any data on the fatty acid composition of such African species. Taken together, an increasingly complex multidimensional model differentiating between African plant foods (seaweeds, nuts, seeds etc), land animals (all edible organs) and marine animals (fish, shellfish, eggs) and in which all separate intakes and nutrient compositions are varied within their most realistic ranges, would certainly improve the current estimates. Finally, due to differences in environmental circumstances, Paleolithic and modern humans might have had different benefits from the intake of fatty acids, such as AA. High AA intakes might confer unfavourable effects in Western societies, where morbidity and mortality stem mostly from chronic diseases with inflammation and thrombosis, but might have been favourable to Paleolithic humans who were mainly confronted with morbidity and mortality from infection and trauma. The latter suggests that AA might have conferred antagonistic pleiotrophy in the past.
Conclusions
We found that the macronutrient composition of the presumed Paleolithic diet averaged 25–29 en% (range 8–35) from protein, 39–40 en% (19–48) from carbohydrate and 30–39 en% (20–72) from fat. These data imply that Paleolithic diets provided moderate-to-high protein and fat intakes, and moderate carbohydrate intakes. The fatty acid composition was moderate-to-high in MUFA and PUFA, but relatively high in SFA. The PUFA were notably high in ALA, LCP n-3 and LCP n-6, but low in LA, compared with the current Western intakes and recommendations. With the previous limitations in mind, the current data reflect the nutritional balance on, and selection pressure under which, our genome evolved. Our models reveal consistent differences between estimated Paleolithic macronutrient and fatty acid intakes and those found in contemporary Western diets as well as recommendations. Together with other human-caused environmental changes, these disparities are likely to play an important role in the aetiology of Western disease. For example, the dyslipidaemic effect of (hyper energetic) carbohydrates, the positive relation between protein intake, satiety and satiation as well as the many beneficial effects attributed to LCP suggest a beneficial role for the consumption of Paleolithic-like diets. These diets do not as much affect our life expectancy, but rather affect our years in good health. Interestingly, many of the dietary disparities are at present heavily debated, suggesting that both the approaches via intervention trials and evolutionary medicine identify critical dietary factors that are important to current Western diseases. We suggest that the present data represent a unique and powerful rationale for the design of future intervention studies.
Acknowledgements
None of the authors had any financial or personal conflict of interest to declare. No funding was received for this study. The authors' responsibilities were as follows: R. S. K. and M. F. L. collected all the literature data for the reference database. Together with D. A. J. D.-B., R. S. K. and M. F. L. composed the first version of the manuscript. After finishing the first version, the other authors were asked to contribute to the paper, for their longstanding and previous experience on the same subject. We thank both anonymous reviewers and S. C. Cunnane for their thorough review of our manuscript.
Units
‘Plant’ refers to any edible component from the kingdom of Plantae and Fungi, while ‘animal’ refers to edible components from the kingdom of Animalia. For meat consumption, only 50 g% of the total carcass weight was considered as edible material(Reference Ledger62). The weights of the consumed organs are therefore presented as a percentage of the total edible material, i.e. 3·8 g% for the liver, rather than as a percentage of total carcass weight (i.e. 1·9 g% for the liver). Plant food and fish were considered to be consumed completely. Fat contents are consistently presented as g/100 g edible material (g%). Fat contents refer either to the specific fat% of a particular organ (e.g. the brain) or to the fat% of all edible material (i.e. the fat% of all combined edible material, including lean meat, brain, liver, bone marrow and adipose tissue). Plant/animal and meat/fish ratios and ratios between skeletal muscle, brain, bone marrow, liver and adipose tissue are given in en%. Fatty acid compositions are given in g/100 g fatty acids (g/100 g, g%). Organ weight contributions to selectively and non-selectively consumed meat are presented as g/100 g meat.


