




Introduction
Economic literature has traditionally interpreted sharecropping as a feudal relic and an obstacle to the development of agriculture (Marshall, Reference Marshall1920; Sereni, Reference Sereni1947); Marshall’s theories have been partially corroborated in studies of African and Asian countries (see: Mukhamedova and Pomfret, Reference Mukhamedova and Pomfret2019). Nevertheless, the contract persisted, a phenomenon often described as the Marshallian paradox (see: Mukhamedova and Pomfret, Reference Mukhamedova and Pomfret2019), which opened the way to alternative interpretations (Cheung, Reference Cheung1968; Cohen and Galassi, Reference Cohen and Galassi1990; Allen and Lueck, Reference Allen and Lueck1992; Jonsson, Reference Jonsson1992).
A similar debate also concerns the Tuscan case; some scholars emphasize inefficiency (Sereni, Reference Sereni1947; Pazzagli, Reference Pazzagli1973; Giorgetti, Reference Giorgetti1974; Lachmann, Reference Lachmann2000), others highlight adaptability (Galassi, Reference Galassi1986; Biagioli, Reference Biagioli2000; Zanibelli, Reference Zanibelli2024, Reference Zanibelli2025).
One way to test the actual capacity of sharecroppingFootnote 1 to sustain processes of agrarian change is to examine specific cases of territorial transformation in which the contract played a central role. The present study is relevant because it proposes an interpretation of sharecropping within institutional theory (North, Reference North1990). Sharecropping is understood as a complex set of formal and informal rules and customary practices (Zanibelli, Reference Zanibelli2025) that structured social and economic life at the territorial level and played a crucial role in planning and coordinating land reclamation through the farm system, while remaining adaptable to broader economic transformations.
Land reclamation and colonization processes therefore represent relevant fields of inquiry for studying the phenomenon also from a comparative macro perspective, because reclamation operations can be identified as tools aimed at promoting processes of agricultural modernization through the employment of specialized technicians tasked with redesigning space in a functional and rational manner.
The term ‘internal colonization’ refers to a process of economic and territorial transformation affecting marginal areas. This process involves the redefinition of rights of access to and use of land, the reorganization of productive and social structures, and the establishment of new settlements. Within this theoretical framework, the literature distinguishes between forms of colonization driven by public intervention and more spontaneous processes linked to peasant initiative (Smith, Reference Smith1969). In the European context, such dynamics were often associated with the cultivation of marginal lands and the transformation of collective rights, also with the aim of containing migratory flows. In England, processes of enclosure and the improvement of waste lands have been interpreted as alternatives to emigration (Griffin, Reference Griffin2023). Analogous patterns have been identified in post-unification Italy, where the reclamation of these areas functioned as a strategy to mitigate emigration to the Americas, while also improving the social conditions of the populations inhabiting these regions (Novello, Reference Novello2025).
Population dynamics within agricultural farms are particularly significant in central Italy (Corona, Reference Corona1997). It is important to consider the interplay between land reclamation and population density to measure the efficacy of the sharecropping model, which is characterized by dispersed housing and a scattered population.
In line with these insights, this contribution focuses on the long-term effects of sharecropping as an agricultural colonization institution (and tool) in Tuscany during the transition from the modern to the contemporary era. It seeks to address the following questions: (1) Were the pre-unification Tuscan institutions capable of promoting development models that responded to the structural, social, and economic needs of a territory undergoing reclamation? (2) Was the Tuscan mezzadria, centred on the fattoria system, able to contribute to the process of reclamation and colonization through a successful business? (3) In the long run, can elements that contribute to success be identified to assess the effects of introducing large sharecropping farms on crop distribution and productivity (Cohen and Galassi, Reference Cohen and Galassi1990; Martinelli, Reference Martinelli2014: see the Total Factor Productivity – TFP in the study area; Zanibelli, Reference Zanibelli2025)?
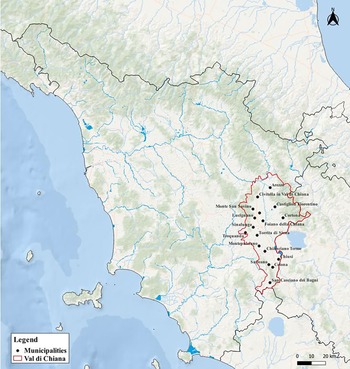
The analysis was carried out in the Tuscan Val di Chiana, a reclaimed area encompassing 17 municipalities across Arezzo and Siena (Figure 1). These were selected based on the classification of agricultural zones in the Catasto Agrario of 1929 and for some subsequent administrative classifications.Footnote 2
The area of the Tuscan Val di Chiana.
Source: Own elaboration based on GIS technology.
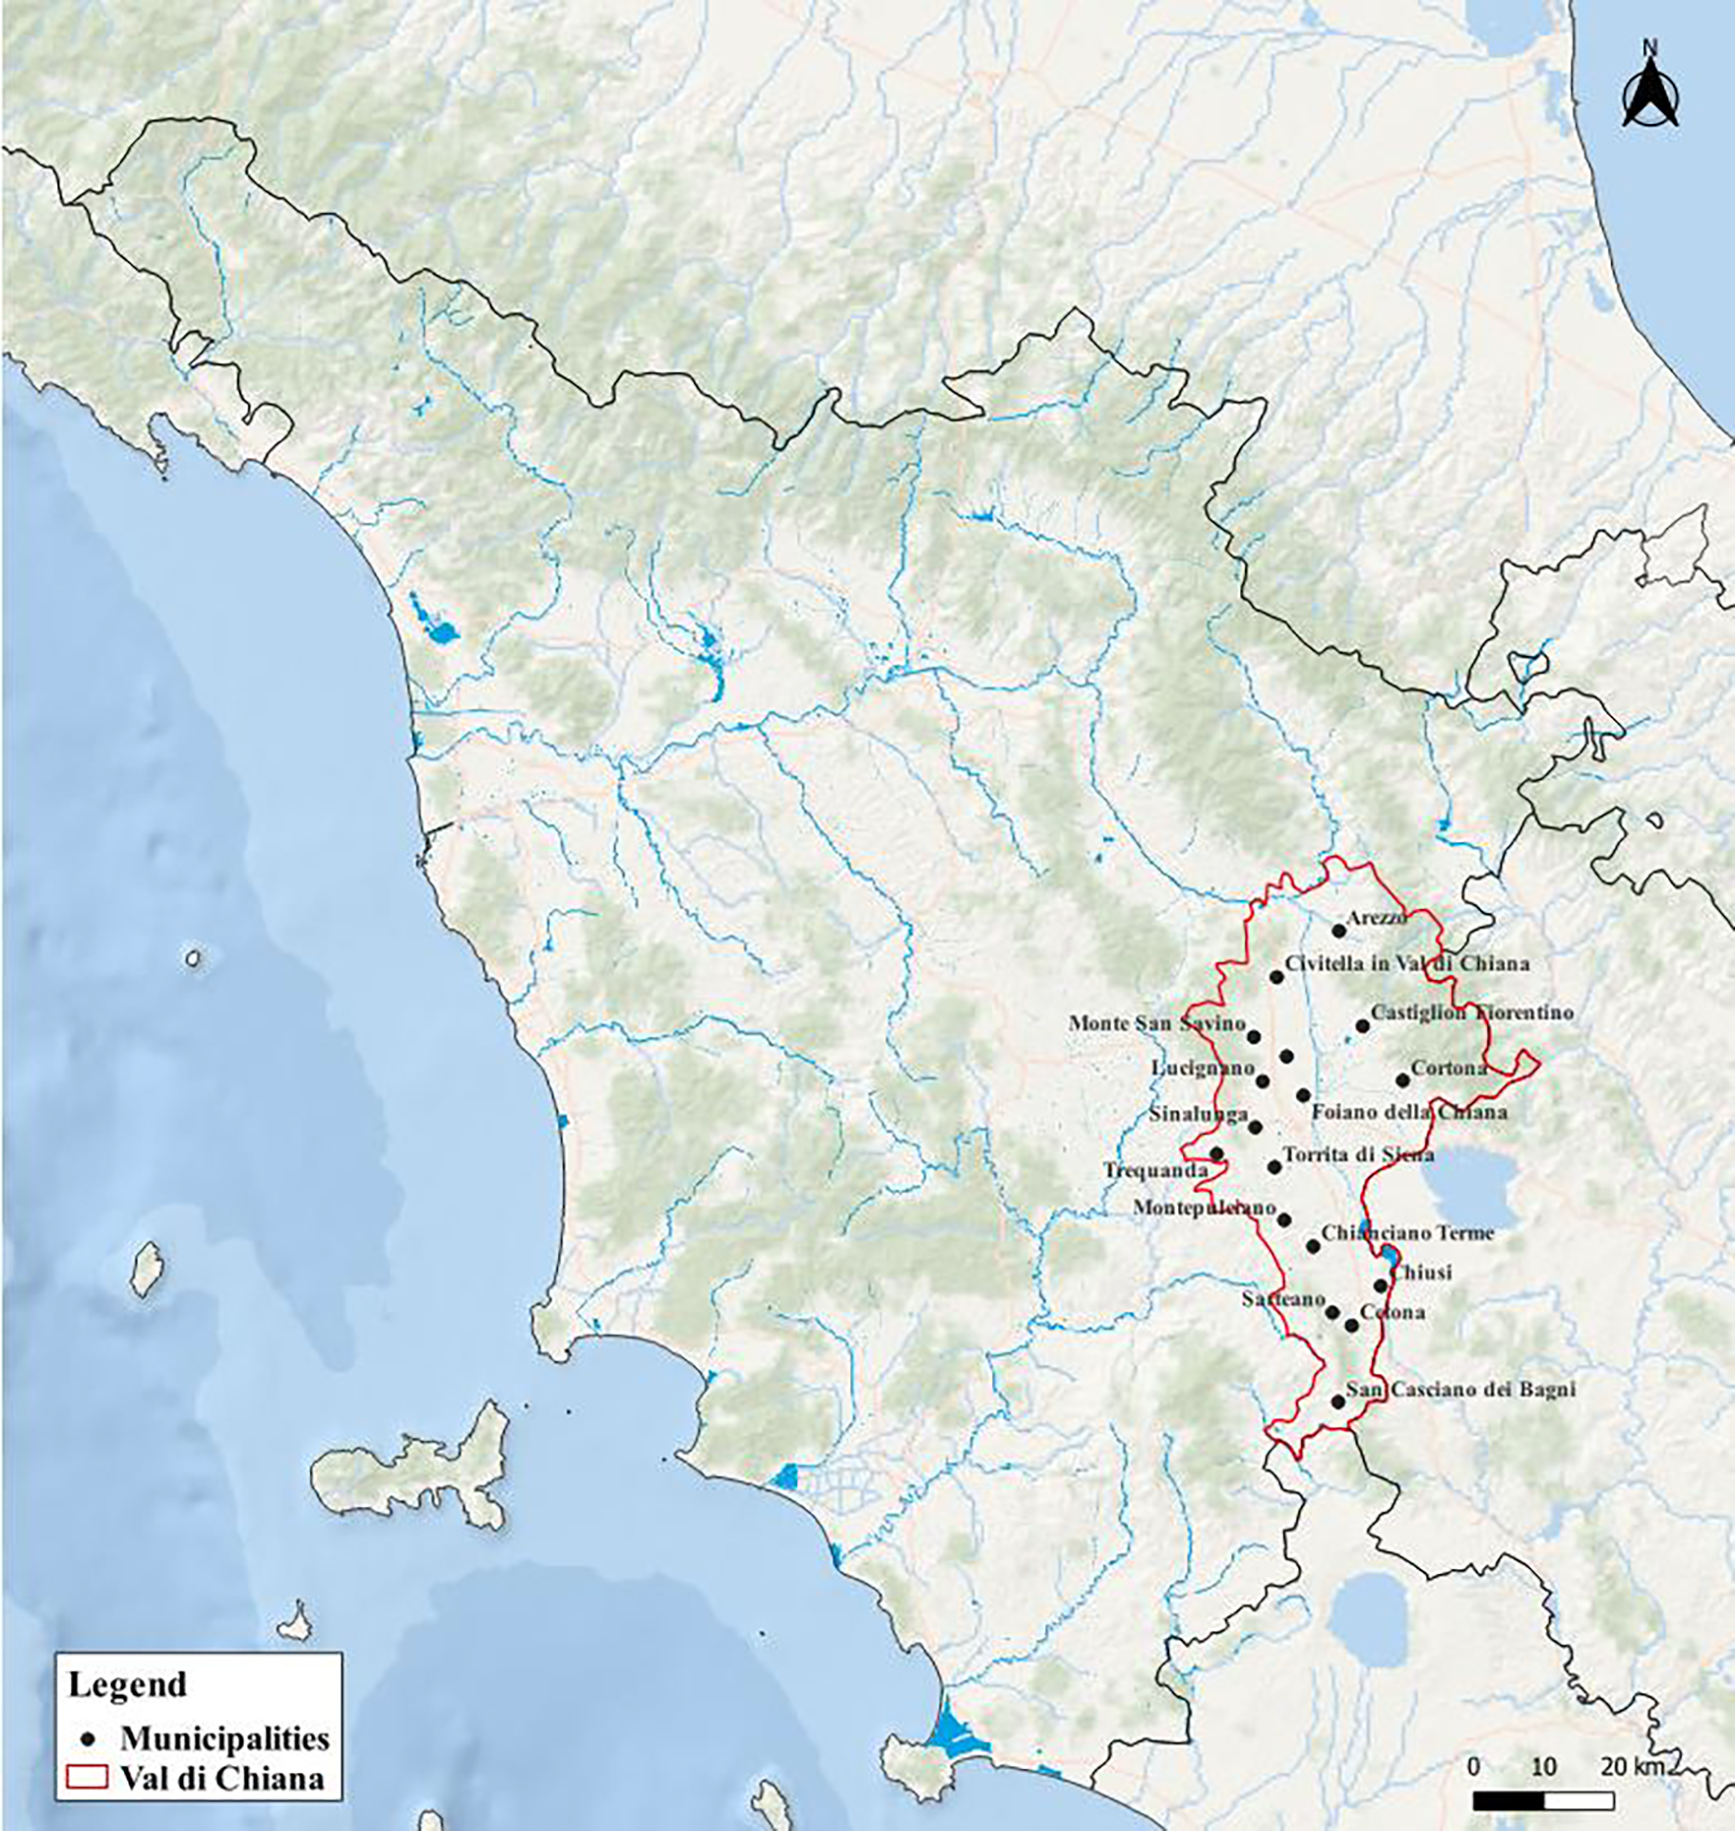
Figure 1. Long description
The map depicts the Tuscan Val di Chiana region in Italy, with a focus on the Val di Chiana area outlined in red. Various municipalities within this region are marked with black dots and labeled, including Arezzo, Civitella in Val di Chiana, Castiglion Fiorentino, Cortona, Foiano della Chiana, Torrita di Siena, Montalcino, Chiusi, Cetona, San Casciano dei Bagni, Chianciano Terme, Montepulciano, Lucignano, Sinalunga, and Trequanda. The map also shows rivers and geographical boundaries, providing a detailed view of the area’s layout and key locations.
The scarcity of long-term information has encouraged synchronic approaches; making a diachronic perspective, integrating quantitative and qualitative methods, is essential for understanding agrarian transformations after reclamation.
This research contributes to deepening the studies on reclamation in a global perspective because, unlike reclamation projects oriented toward smallholder farms, the Val di Chiana shows how sharecropping shaped labour distribution and agrarian change. It is crucial to prioritize the examination of internal colonization processes, particularly in Italy during the early post-unification period. During this era, significant interventions were limited to subsidies for the construction of farmhouses and villages in reclaimed areas (Protasi and Sonnino, Reference Protasi and Sonnino2003). In contrast, the case examined in this study proposes a novel structural framework and an innovative approach to the management of reclaimed land.
The key element of this study is that analysing farms’ accounting records (income, production value, and land improvement expenditures) allows us to measure the intensity of the fattoria system in agricultural colonization processes. This facilitates the comparison between company and municipal-provincial data. The micro-scale case study is therefore employed as a lens to capture the heterogeneity of Italian agriculture and enrich macro-level studies. The data utilized in this research are derived from a variety of statistical and archival sources.Footnote 3 The methodology used is based on an integrated qualitative and quantitative approach developed through in-depth source analysis, including cartographic processing (using GIS technology).
This contribution is organized as follows: a worldwide theoretical review of land reclamation and colonization (with a particular focus on Tuscan sharecropping); the presentation of the Val di Chiana case as a laboratory for examining the ability of sharecropping to drive agricultural transformation processes; the double analysis (company and territorial scale), to test the effects of sharecropping in agrarian colonization; an analysis of the results achieved; and finally, the conclusions.
Theoretical and historical framework: reclamation and the role of sharecropping in the processes of colonization and agrarian change
Literature has explored various aspects of land reclamation. Among these, the ability to promote agricultural growth and development processes (Slicher van Bath, Reference Slicher van Bath1963; Giorgetti, Reference Giorgetti1968; Jacobbsonn, Reference Jacobsson2024), responsiveness, among other things, to the nutritional demands of the population (Bevilacqua and Rossi-Doria, Reference Bevilacqua and Rossi-Doria1984); the social and economic function of wetlands prior to reclamation, which were essential to community life thanks to hunting and fishing (Cavallo, Reference Cavallo2015); the need for long-term conservation interventions (Barone et al., Reference Barone, Gambi and Rossi-Doria1985, particularly the contribution by Gambi); changes in land management (Jepsen et al., Reference Jepsen, Kuemmerle, Müller, Erb, Verburg, Haberl and Reenberg2015) and the transformation into arable lands (Chisholm, Reference Chisholm2006); dynamics of population process (Protasi and Sonnino, Reference Protasi and Sonnino2003) and the managerial capacity of a ‘reclaimed’ territory as a potential test of the actual effectiveness of institutional action in territorial governance.
Jepsen et al. (Reference Jepsen, Kuemmerle, Müller, Erb, Verburg, Haberl and Reenberg2015) identify several phases (regimes) of land management, from feudal agriculture to environmental awareness (decline of agricultural labourers).
Applying this framework, the periodization for Northern Italy reveals that the “Innovations and rights” phase concluded in the years following the Great War, marking the onset of the “intensification” phase. The Fascist period was characterized by political and economic interventions in agriculture, particularly in land reclamation and agricultural transformation operations. Technicians such as Arrigo Serpieri and Giuseppe Tassinari contributed to these interventions, whose statistical results require careful comparison with pre- and post-Fascist local archival data, as was done in this contribution. The “industrialization” phase commenced following World War II and was consolidated through the Common Agricultural Policy (CAP) and subsequent specialization in Made in Italy products. The advent of this final phase is typically ascribed to the 1980s.
The chronology (Jepsen et al., Reference Jepsen, Kuemmerle, Müller, Erb, Verburg, Haberl and Reenberg2015) immediately reveals divergences within the Mediterranean area. Although Spain is divided into three macro-regions, two of these (East-North and Northwest) appear to lag slightly behind Northern Italy while remaining ahead of Southern Italy. France, while anticipating the transition from the “innovations and rights” to the “intensifications” phase around 1870, initiates the “environmental awareness” phase concurrently with the regions of Northern Italy. Portugal exhibits a structural similarity to that of Southern Italy, albeit with a delayed onset of the “industrialization” phase. Finally, Greece displays a structure broadly comparable to that of Spain (East) (Jepsen et al., Reference Jepsen, Kuemmerle, Müller, Erb, Verburg, Haberl and Reenberg2015).
One key aspect that immediately emerges regarding the Italian peninsula is the significant disparity in land reclamation between the north and south (Barone et al., Reference Barone, Gambi and Rossi-Doria1985).
Regarding the Tuscan case, land reclamation policies were characterized by different peculiarities throughout history (Barsanti and Rombai, Reference Barsanti and Rombai1986): 1) Medici viewed these interventions, always funded by the State, as necessary containment measures when inevitable; 2) Pietro Leopoldo saw reclamation as a starting point for the development of productive forces. It was then that land recovery works also became linked to the abolition of rights of commons, the so-called usi civici, fishing rights, and gathering rights that burdened common lands (for a general overview on the topic, see Bonan, Reference Bonan2015; Bulgarelli Lukacs, Reference Bulgarelli Lukacs, Alfani and Rao2011; specifically for the Tuscan case, see Rombai et al., Reference Rombai, Guarducci and Rossi2021), following the main economic theories arriving from Northern Europe. A similar trend has also been observed in Wales (Porter, Reference Porter1977); 3) Leopoldo II also saw reclamation as a social aim to eradicate malaria and improve the living conditions of the rural classes with labour opportunities.
An important role was played by agricultural institutions, particularly the Accademia dei Georgofili, the main centre for economic debate on agriculture, which helped to promote scientific growth in the primary sector in Tuscany, partly through dialogue with other European experiences. To explore the idea of land reclamation in Tuscany in greater depth, it is important to read the writings of Pietro Ferroni, a leading figure in the Val di Chiana reclamation project in the early 19th century, on the main soil recovery systems (drying and colmata) (Archivio Accademia dei Georgofili, hereafter Archgeorg, Letture, memorie, rapporti e discussioni pubbliche, 62, 342, Memoria sulla buonificazione dei laghi e paduli, 7 agosto 1805). In Tuscany and the Val di Chiana, the preferred method was the colmata (Alexander, Reference Alexander1984), a land reclamation technique based on diverting stream water into enclosed basins, where sediments gradually accumulated and raised the ground level. Water flow was regulated through controlled drainage systems; in cases where multiple colmate were present, excess water flowed from one enclosure to the next. Once the water became clear, drainage was carried out. Although this method was time-consuming, it was relatively economical, as it did not require advanced technology.
Land reclamation in Tuscany meant reorganization of water resources also involved the construction of a network of canals and drains. The Tuscan idea of agrarian colonization consisted of the introduction of meadows and the presence of geometric fields cultivated with mixed crops that required the stable presence of peasants under the sharecropping contract. Although an illustrious figure such as Cosimo Ridolfi had experimented with the transition from sharecropping to direct management, in the end he returned to sharecropping again (Einaudi, Reference Einaudi1938), confirming how the use of the contract had economic advantages in terms of allocation of factors and distribution of revenues.
The production structure of Tuscan sharecropping (classic)Footnote 4 was centred on the fattoria model (Ciuffoletti, Reference Ciuffoletti1986; Galassi, Reference Galassi1986; Biagioli, Reference Biagioli2000; Zanibelli, Reference Zanibelli2024, Reference Zanibelli2025) with a centralized ‘hub’ that coordinated all the different production units (called poderi). These consisted of a house and land, cultivated with policoltura (polyculture or mixed crops – cereals, olive oil, and wine), which were entrusted to a sharecropper and his family. The coordination of management was entrusted to a director (fattore) (Pazzagli, Reference Pazzagli2008) who carried out management strategies to improve the company’s performance and also provided for increasing the skills of sharecroppers; this contributed to the development of early forms of rural entrepreneurship.Footnote 5
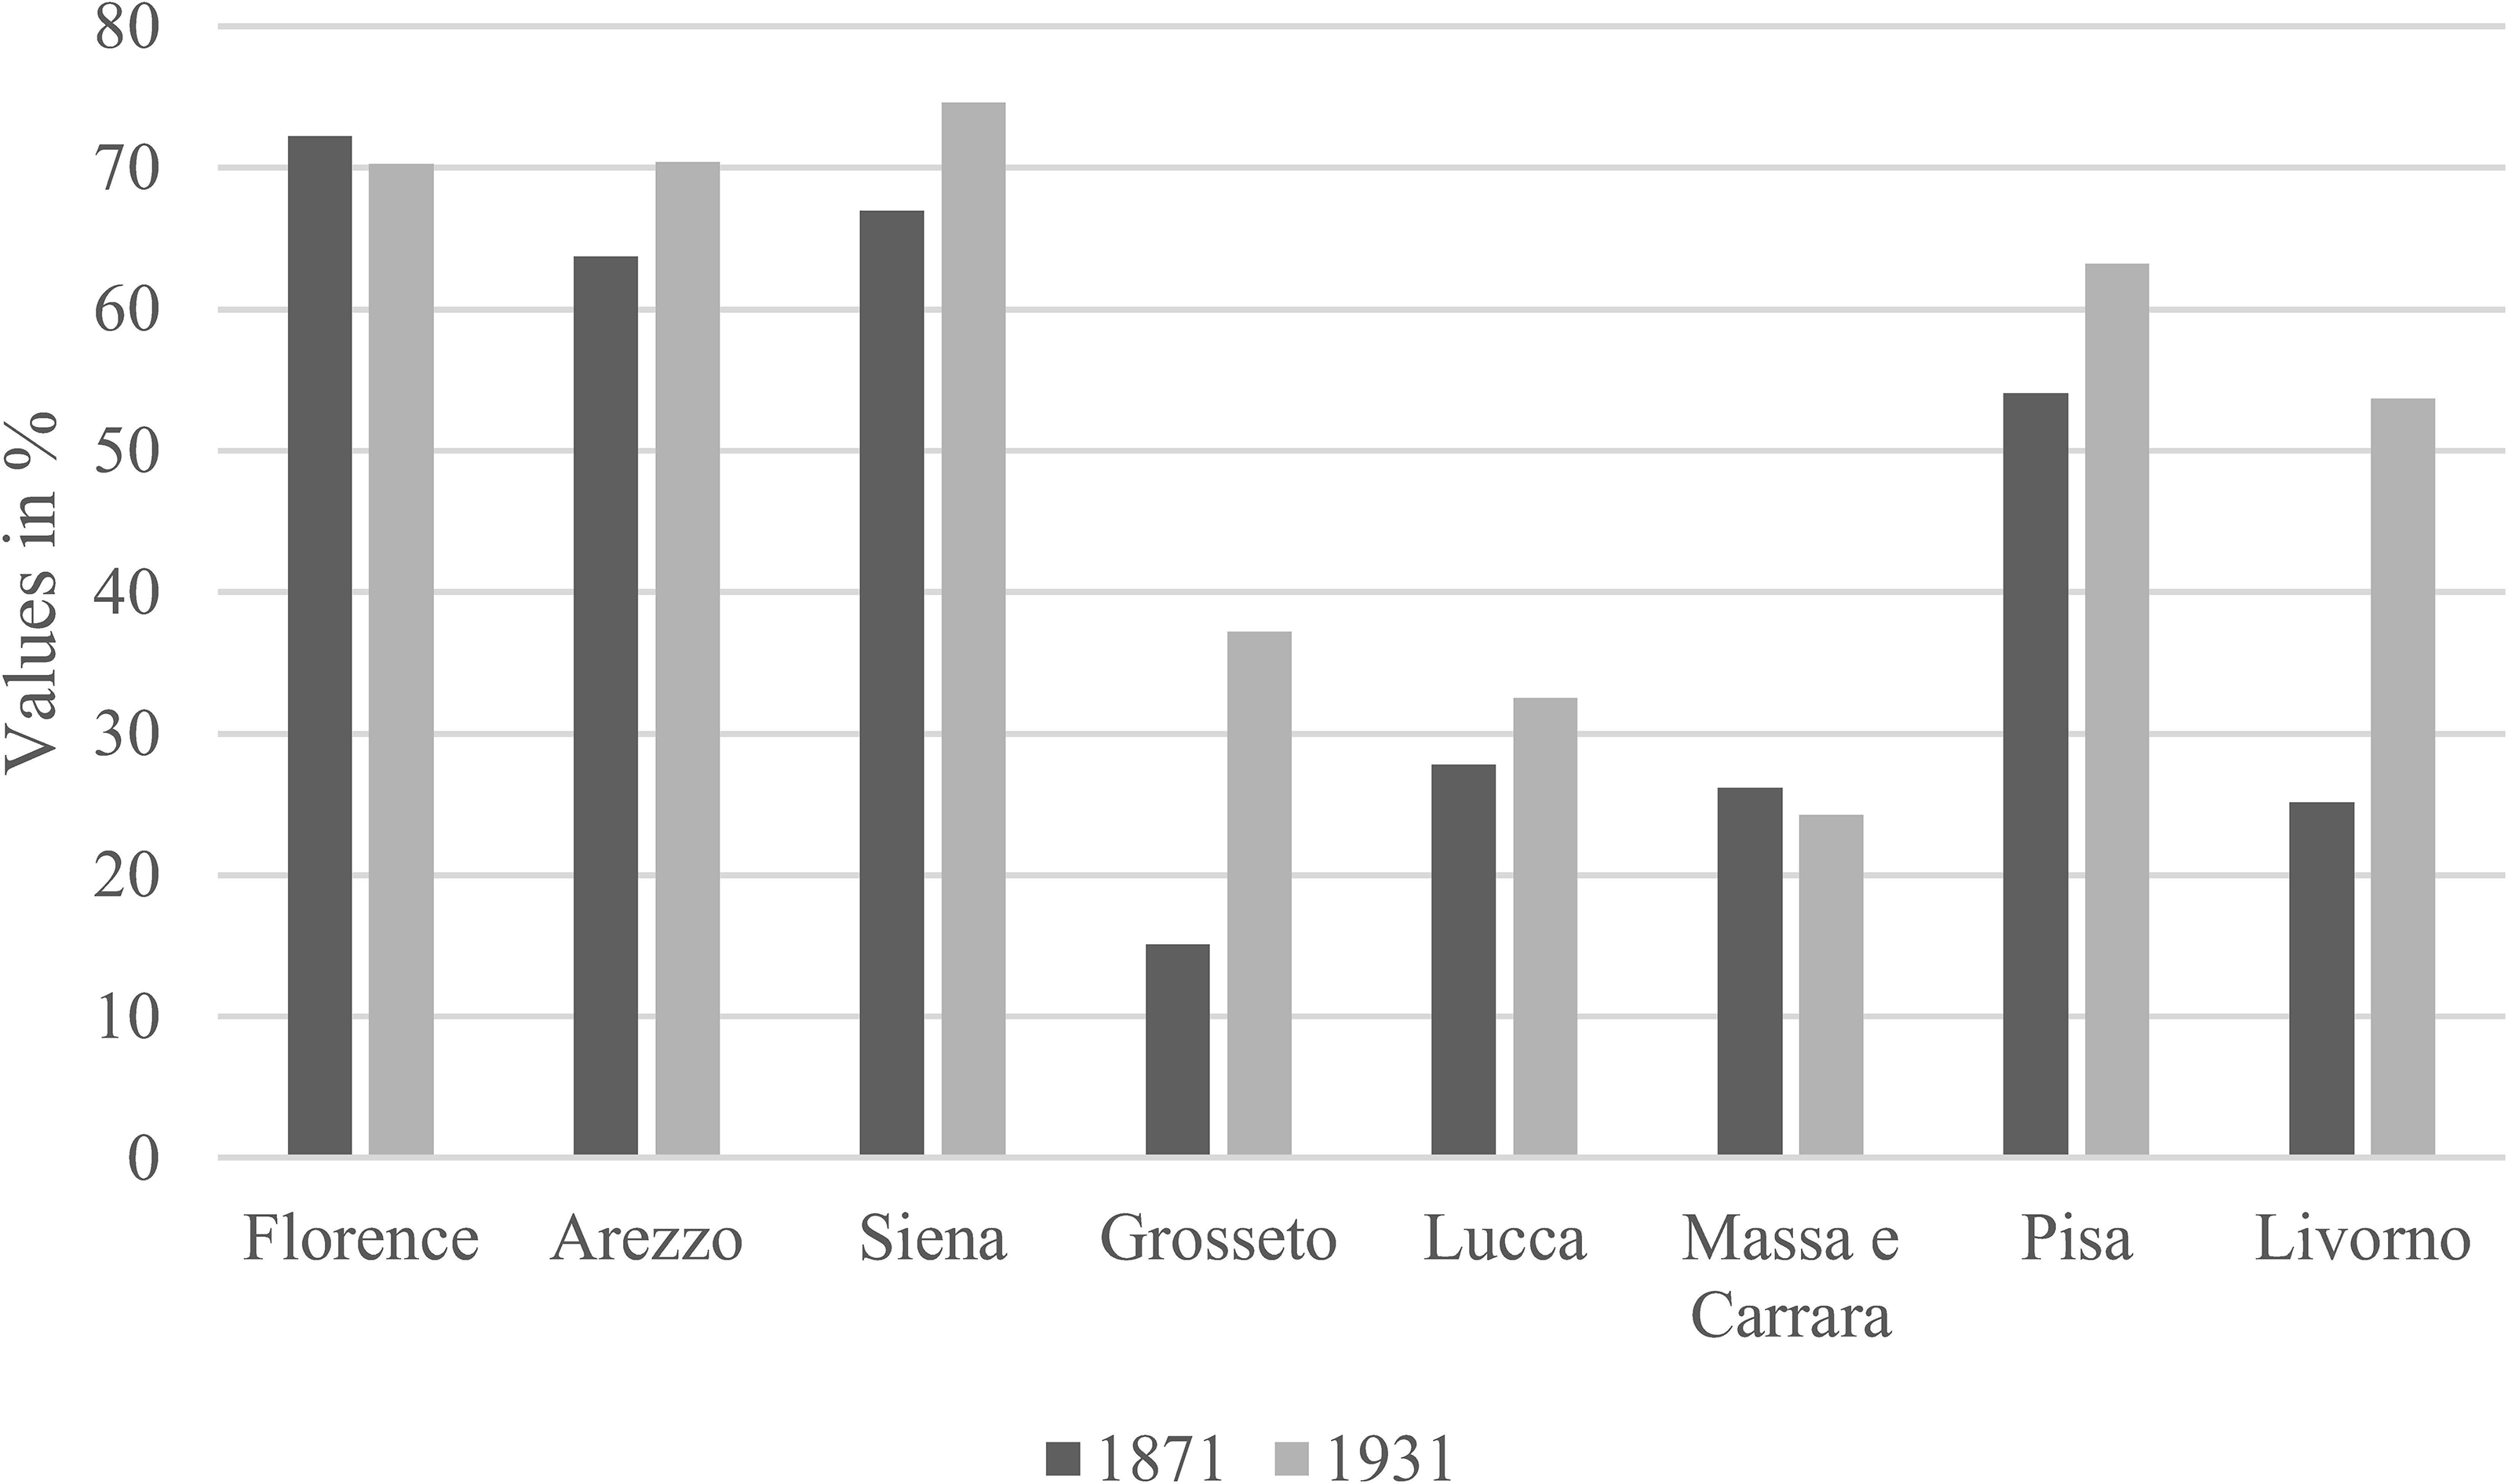
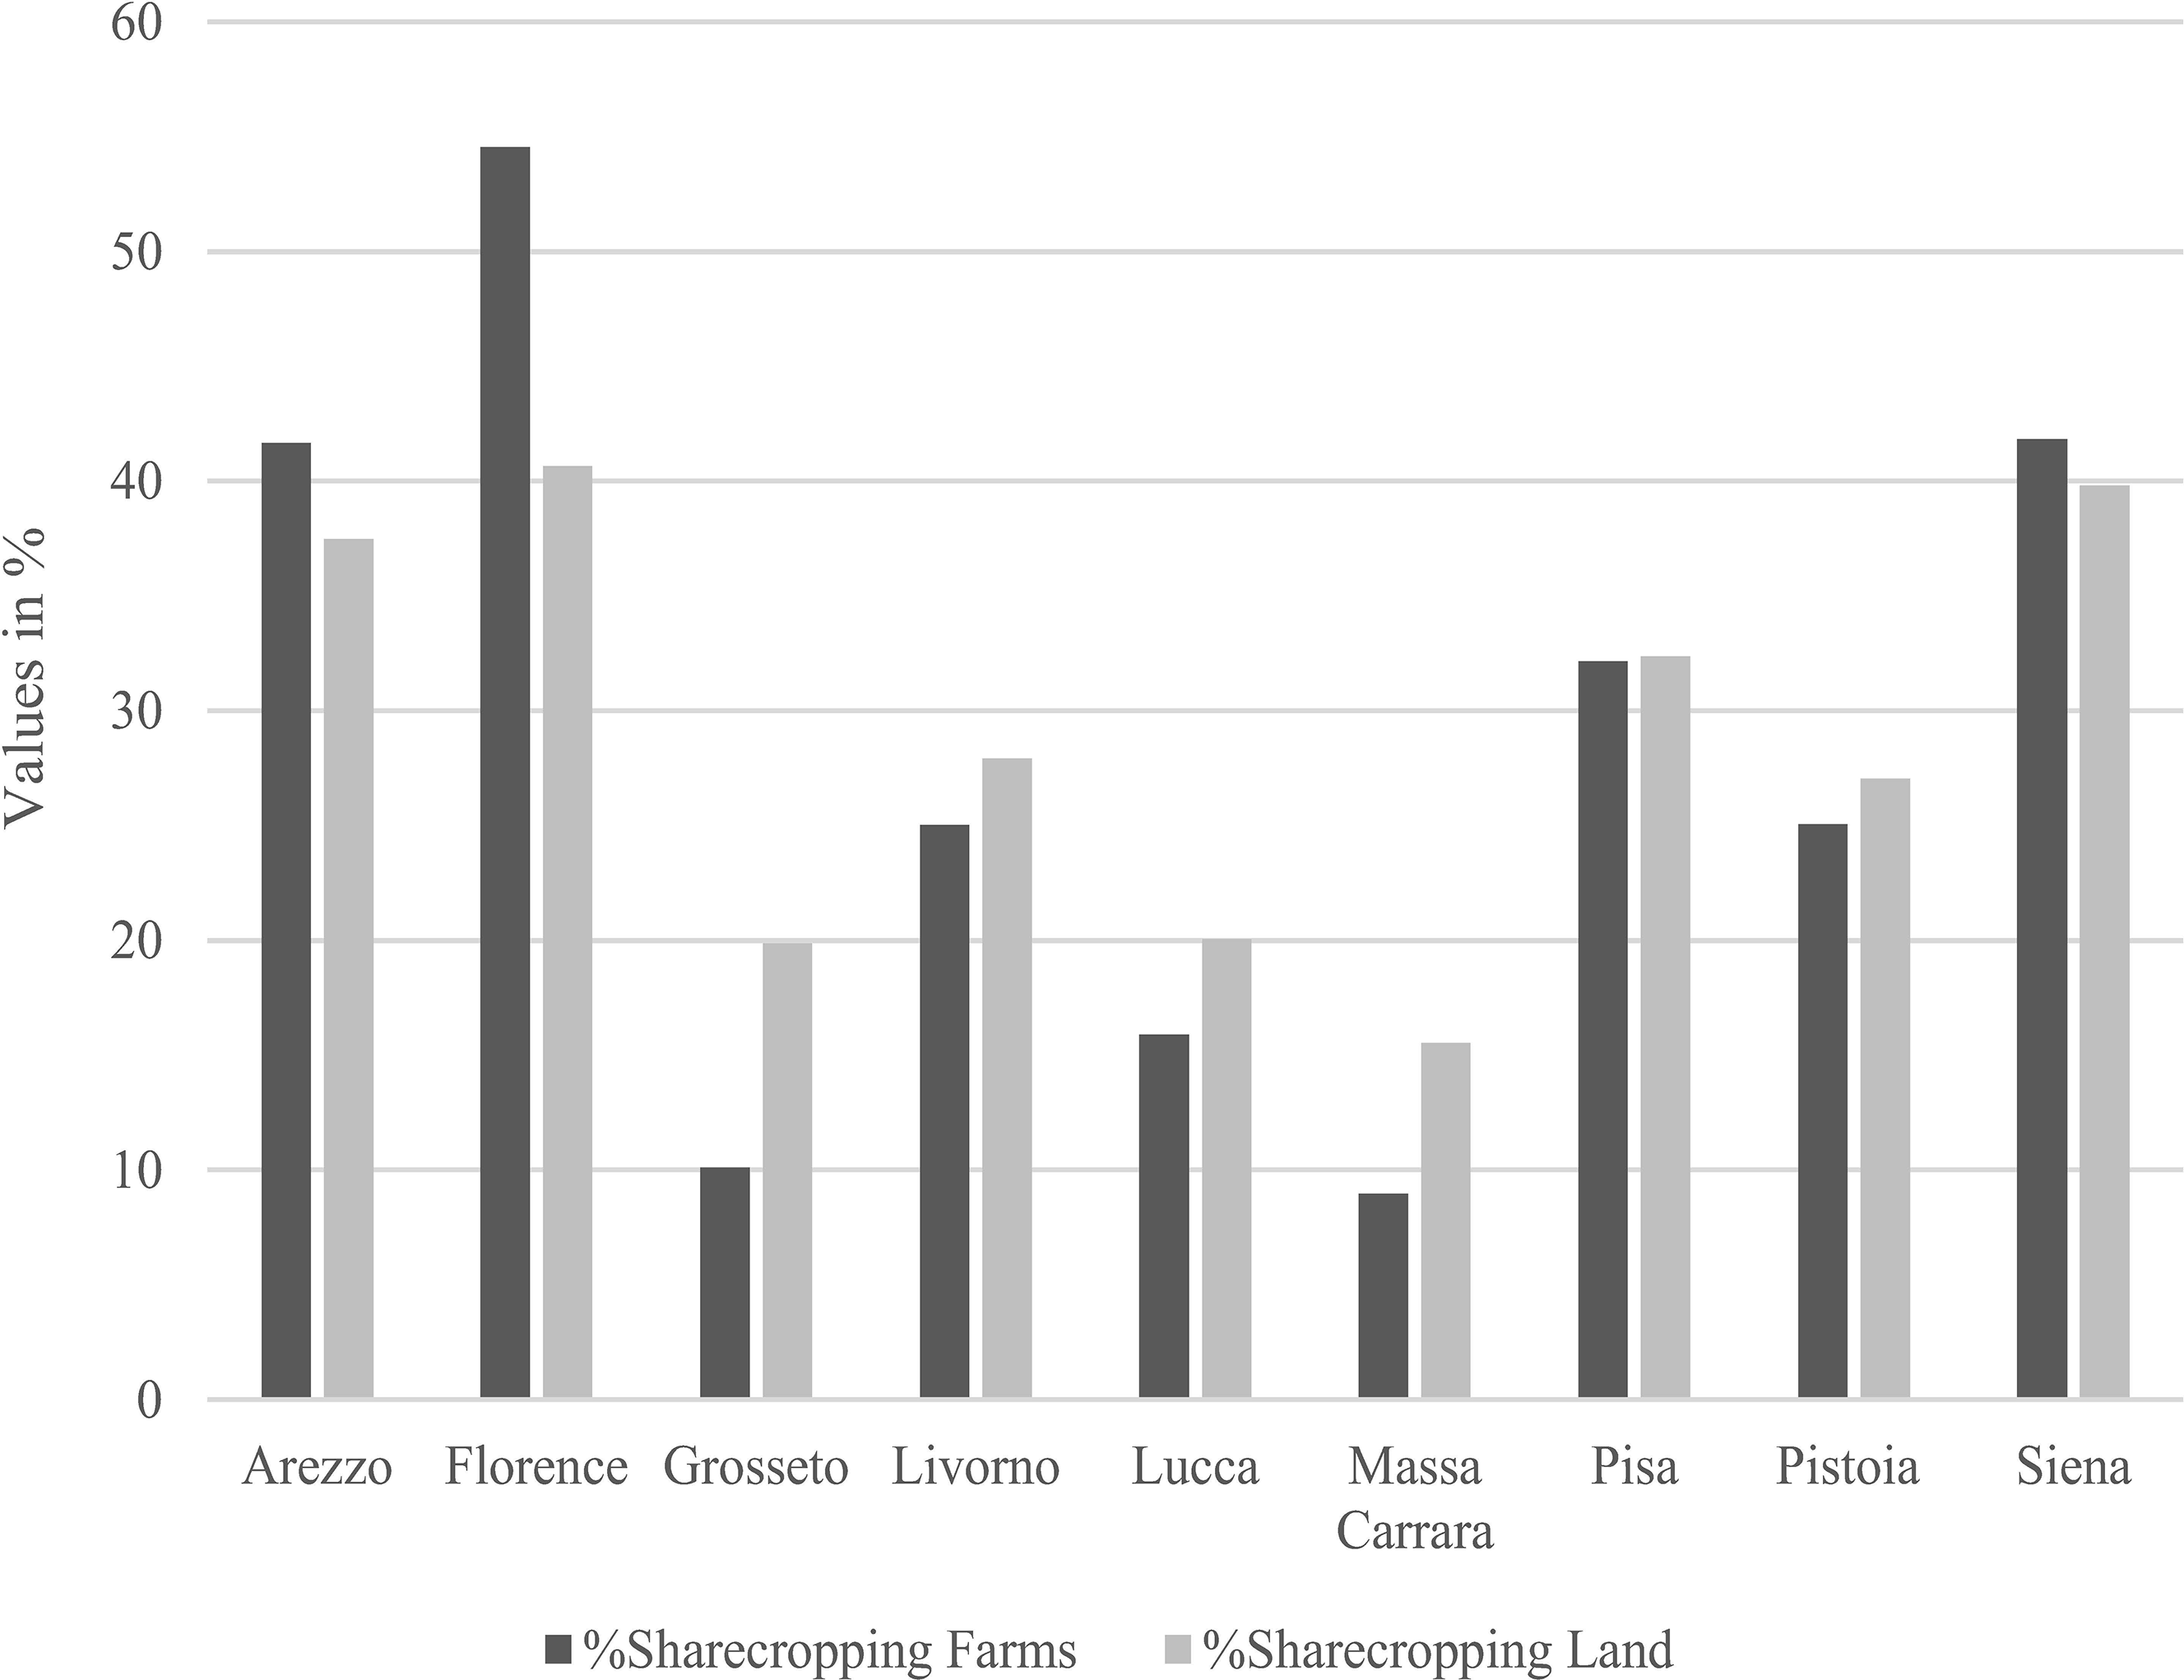
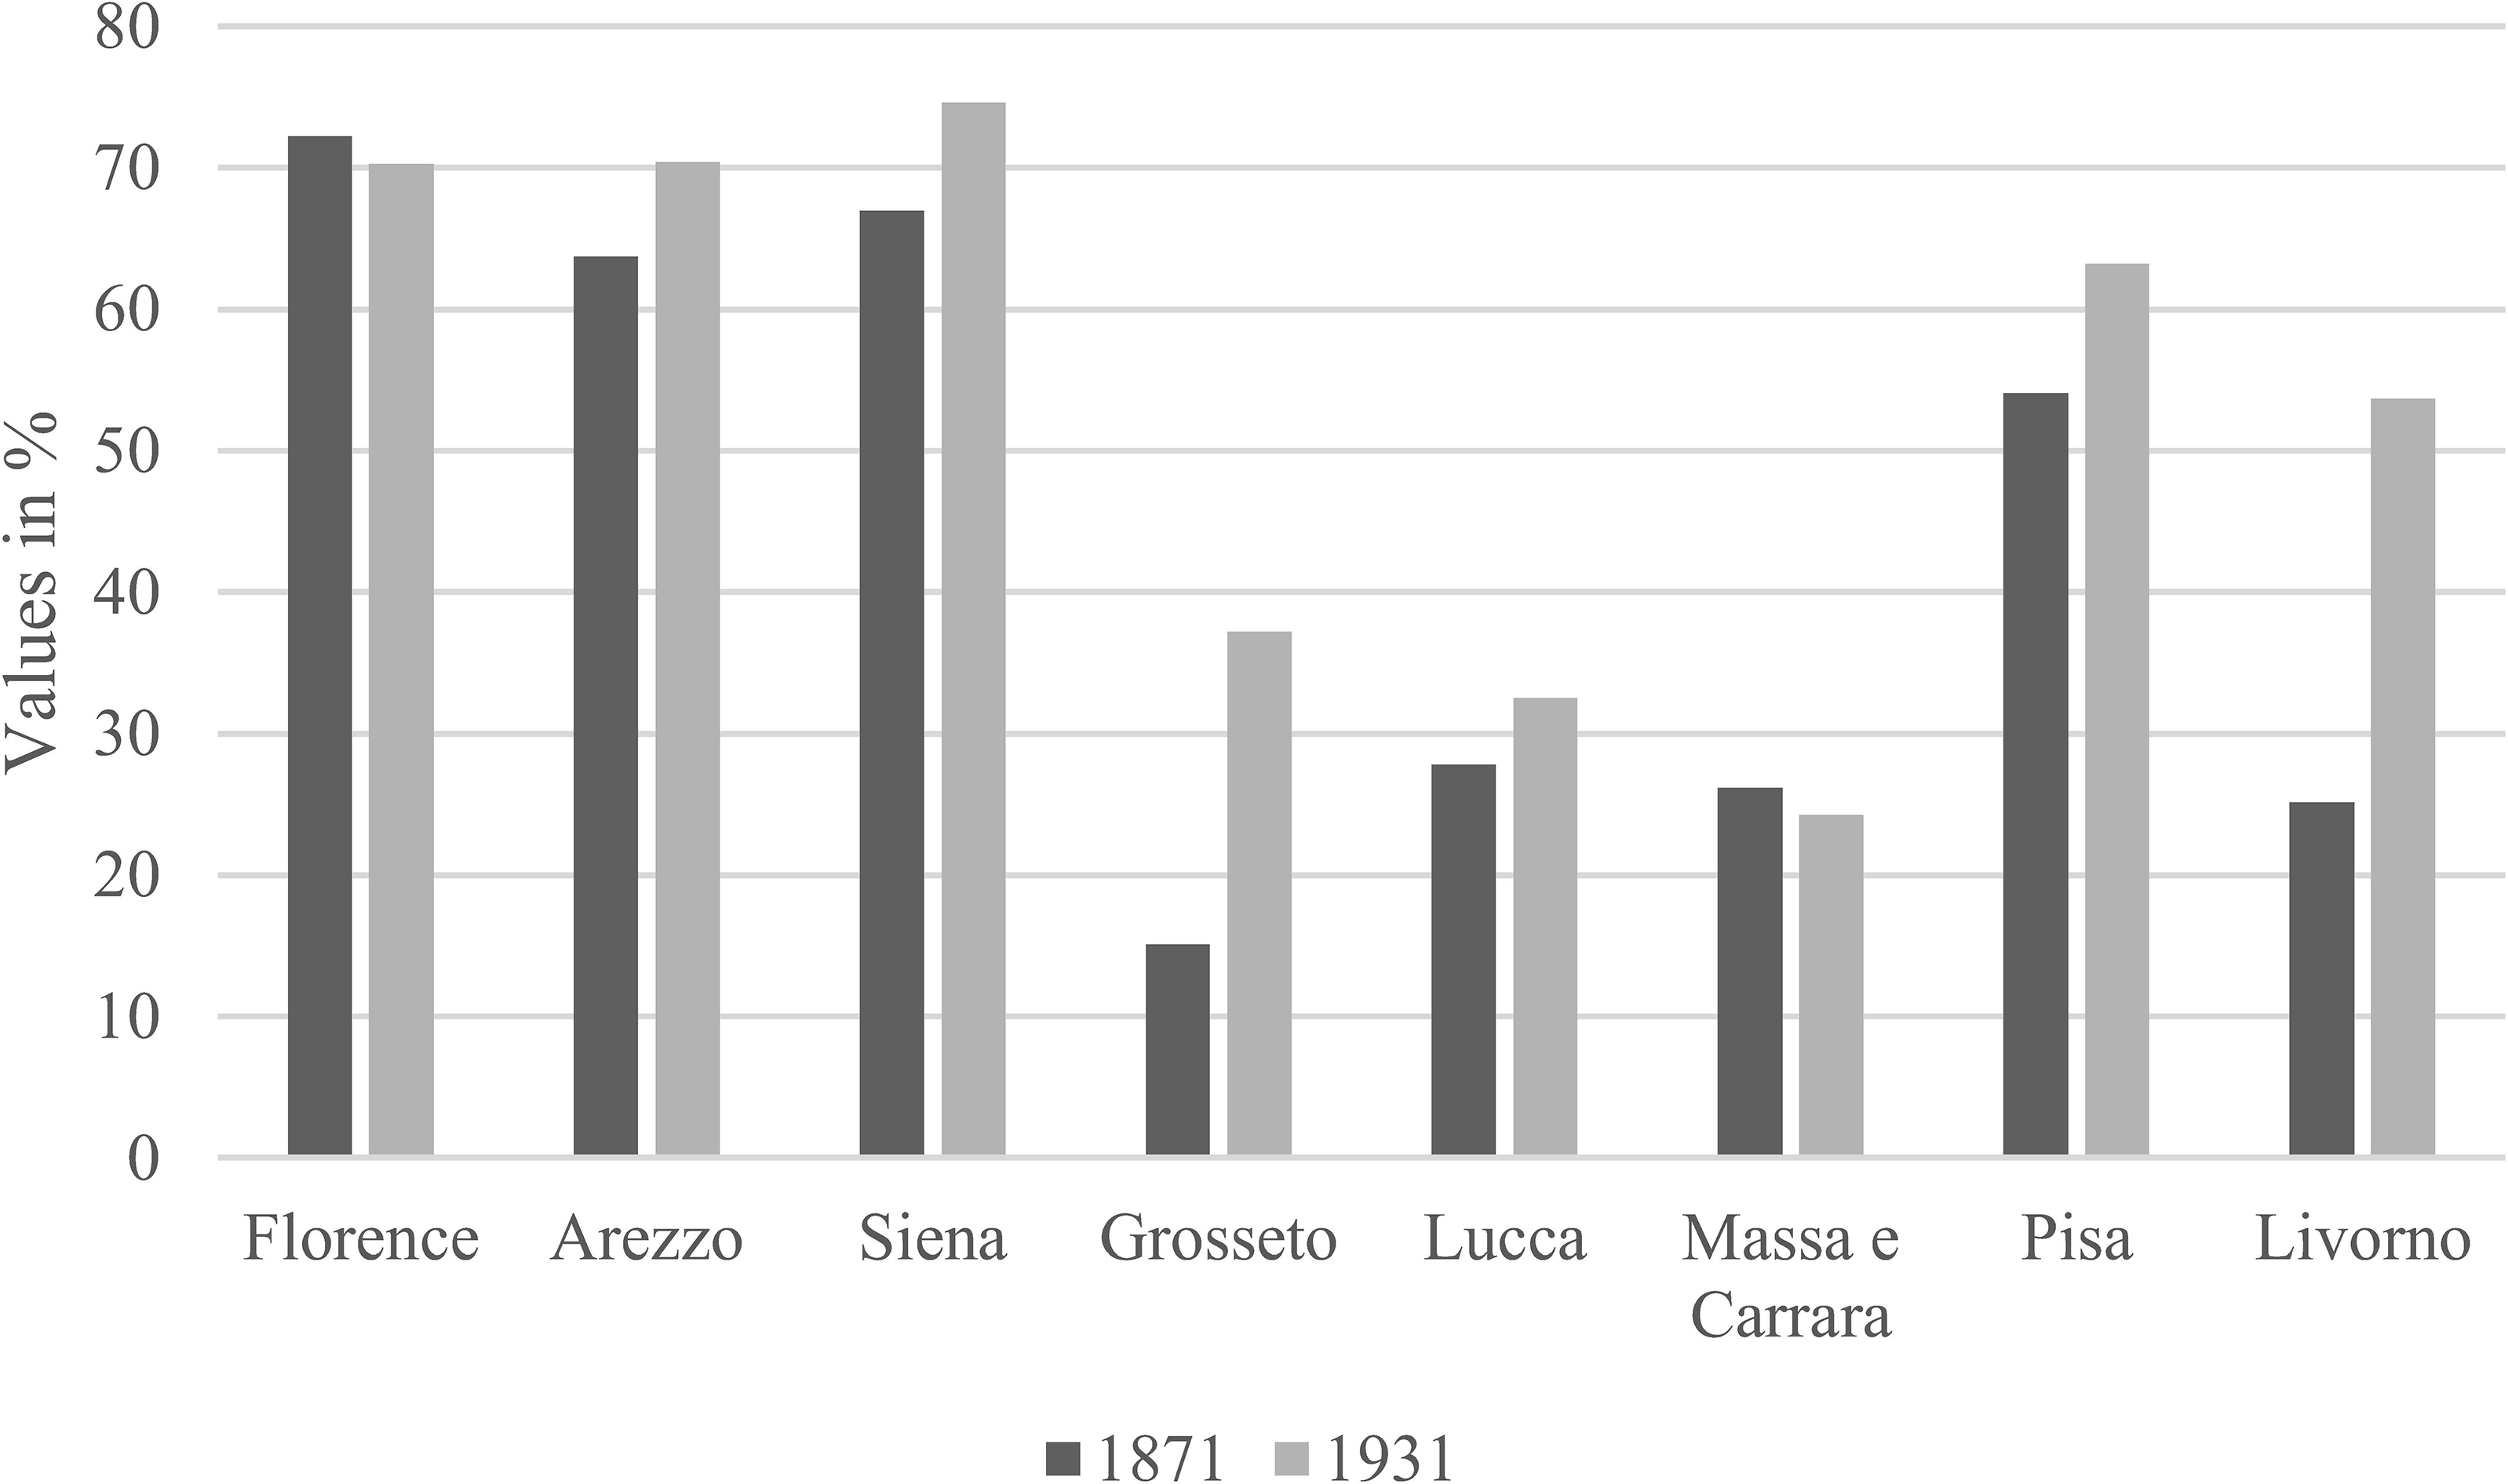
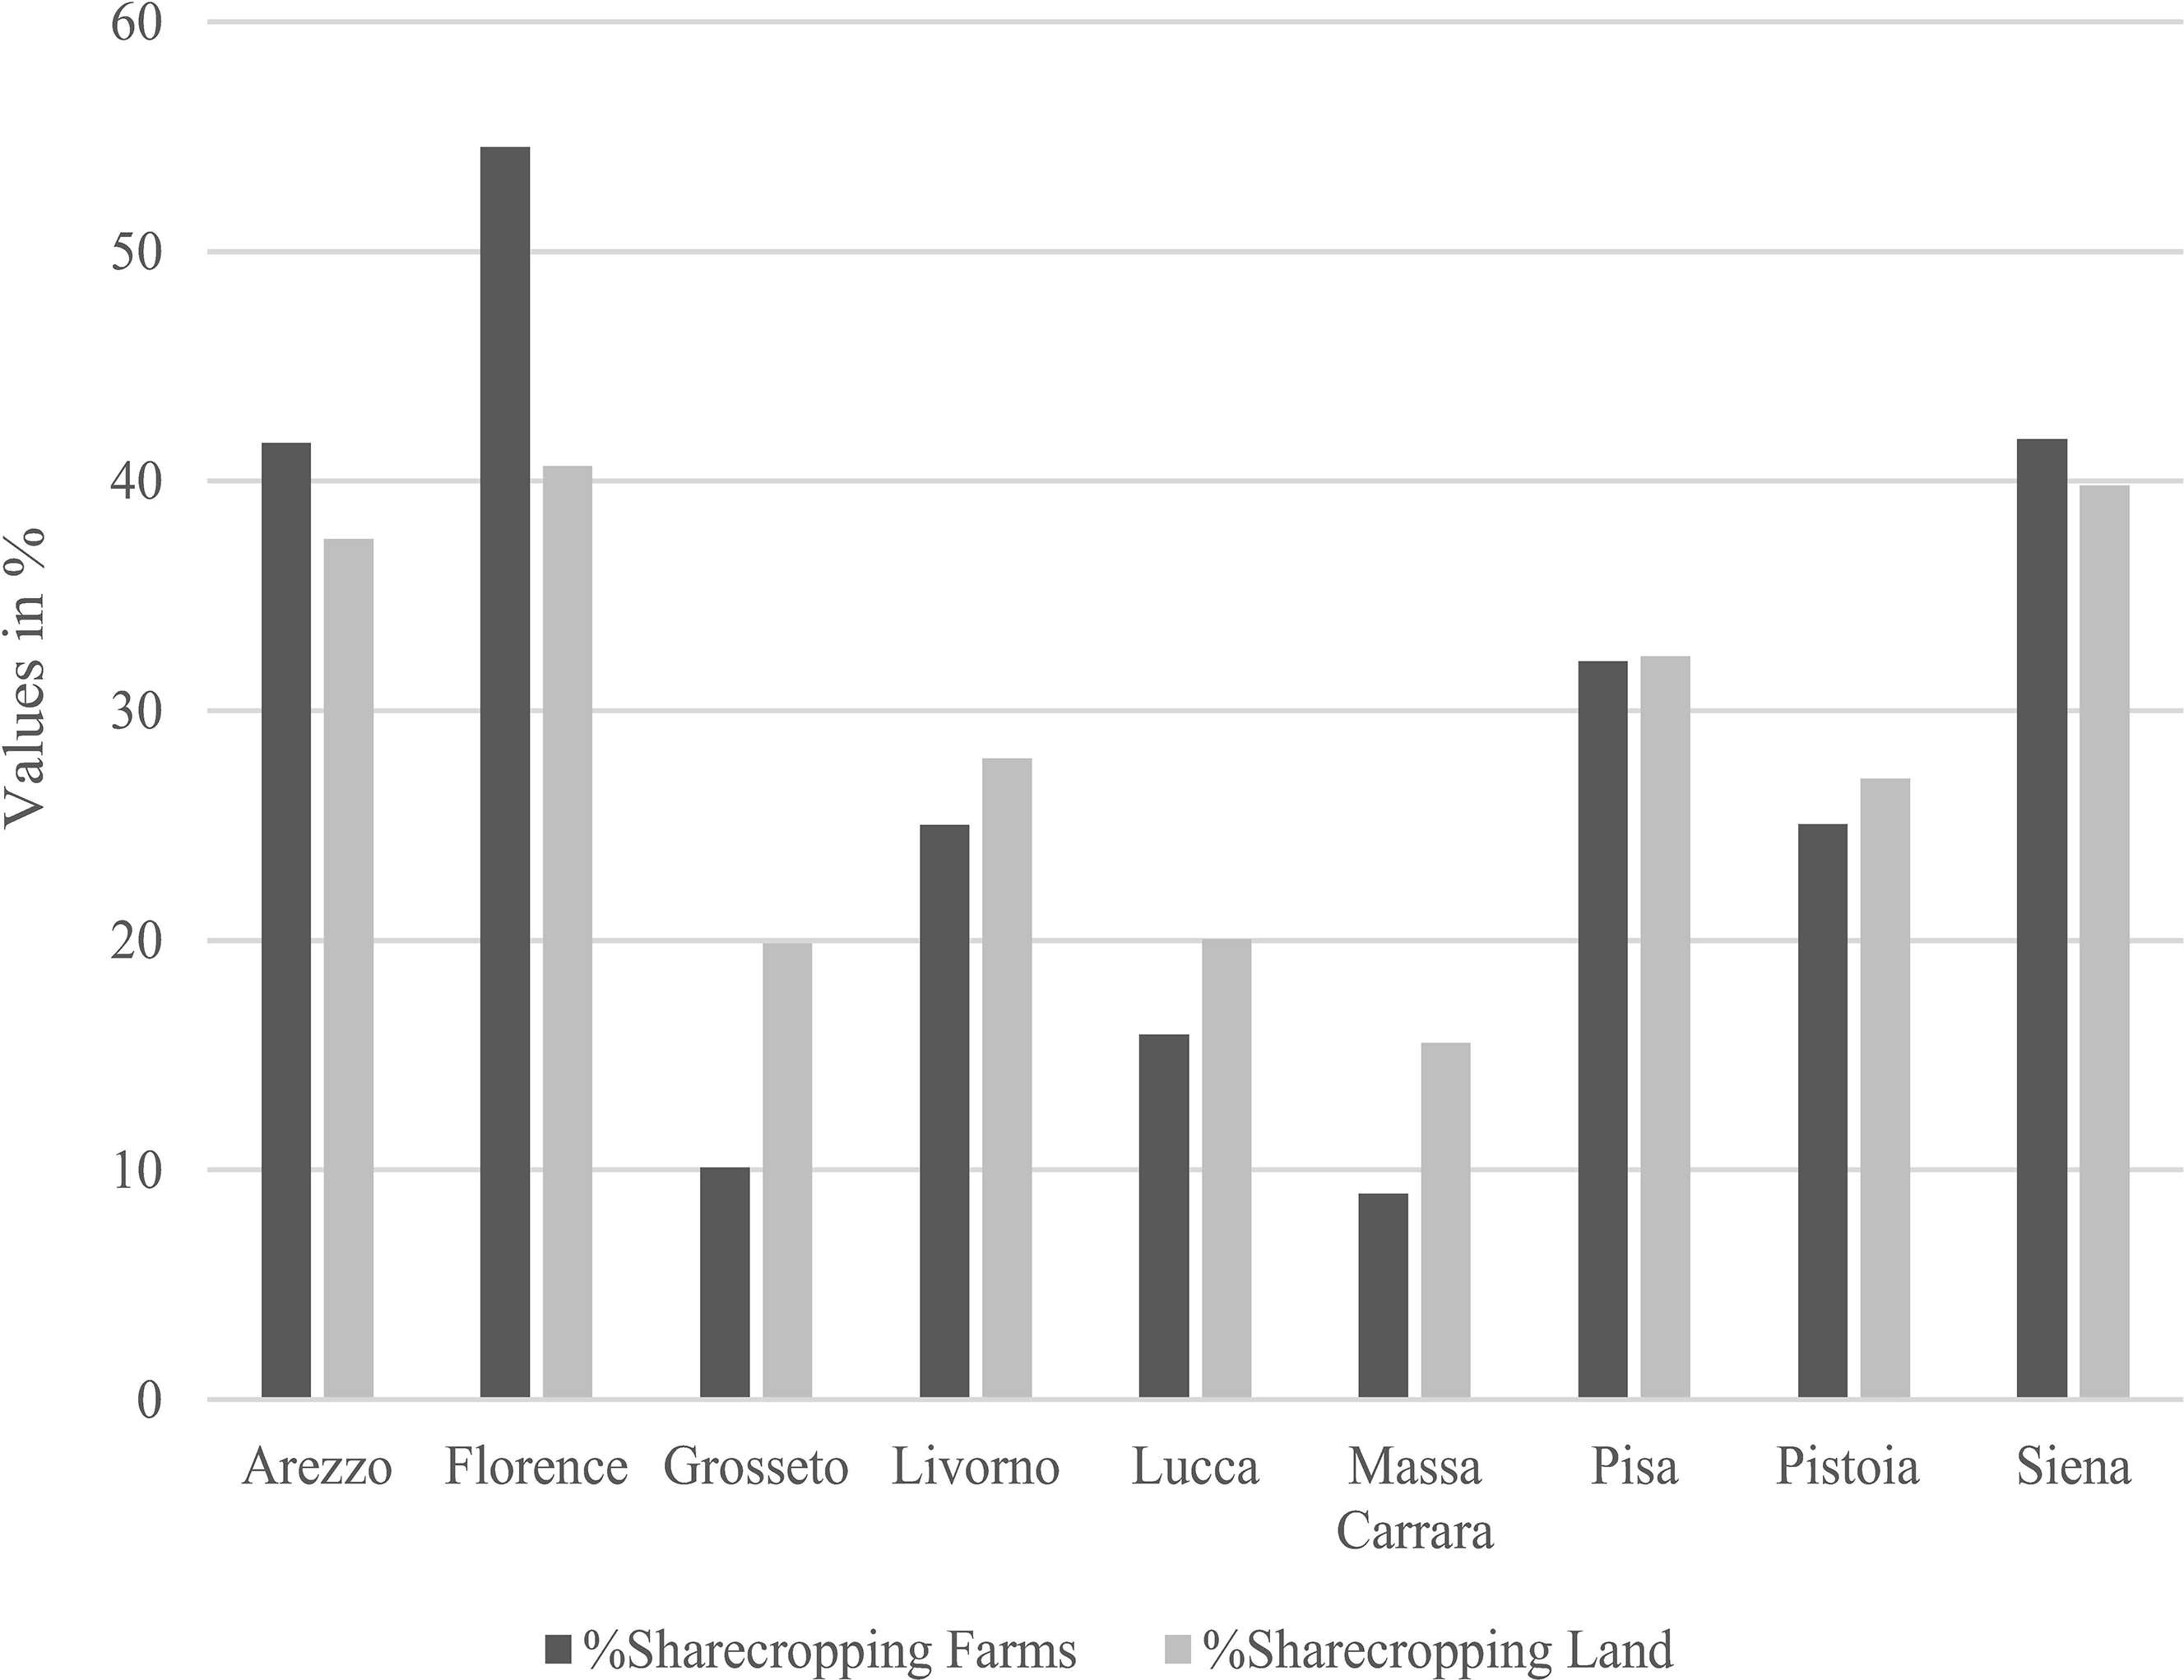
This is where sharecropping comes into play as an institution and tool for the agricultural colonization processes that this study aims to propose. This is because the mezzadria was prevalent in the regional agrarian system (in particular in the provinces of Arezzo Florence, Pisa, and Siena) between 1871–1961 (Graph 1–2).Footnote 6
Distribution of sharecroppers in Tuscany between 1871 and 1931.
Source: Own elaboration based on data from MAIC, 1876; ISTAT, provincial data of Population Census 1931.
Graph 1. Long description
The bar graph compares the distribution of sharecroppers in Tuscany between 1871 and 1931. The x-axis lists cities: Florence, Arezzo, Siena, Grosseto, Lucca, Massa e Carrara, Pisa, and Livorno. The y-axis represents values in percentage, ranging from 0 to 80. There are two sets of vertical bars for each city, one in dark gray for 1871 and one in light gray for 1931. Florence, Arezzo, and Siena show high values in both years, while Grosseto and Livorno show lower values. Pisa shows a significant increase from 1871 to 1931. All values are approximated.
Percentage of sharecropping (farms and land) in Tuscany in 1961.
Source: Own elaboration based on data from ISTAT, provincial data of Agricultural Census 1961.
Graph 2. Long description
The bar graph compares the percentage of sharecropping farms and land in various cities in Tuscany in 1961. The x-axis lists cities: Arezzo, Florence, Grosseto, Livorno, Lucca, Massa Carrara, Pisa, Pistoia, and Siena. The y-axis represents values in percentage, ranging from 0 to 60. The graph features two sets of vertical bars for each city, one for the percentage of sharecropping farms and another for the percentage of sharecropping land. The bars for sharecropping farms are dark gray, while the bars for sharecropping land are light gray. Florence shows the highest percentage of sharecropping farms, exceeding 50 percent, while Grosseto has the lowest, around 10 percent. Siena and Arezzo also show high percentages for both sharecropping farms and land. All values are approximated.
The theoretical basis for investigating the function of sharecropping is reinforced by the historical evidence that Italian colonization policies utilized this contract, at least in part, during the initial phase of the transformation process. This model was also employed in the colony of Eritrea under the strategic planning of Leopoldo Franchetti from Tuscany, as suggested by Eugenio Faina taking the case of Umbria as an example (Franchetti, Reference Franchetti1895). In Italy, sharecropping was initially seen as a means of initiating agricultural colonization processes. Examples include the Agro Romano-Pontino (Bulletino, Reference Bullettino1896b; Vaquero Piñeiro, Reference Vaquero Pineiro2024) and Eritrea, where religious institutions such as the Capuchin friars implemented it (Bulletino, Reference Bullettino1896a). Val di Chiana is different because sharecropping played a significant role in land reclamation, colonization, and development. The reclamation process appears to be of considerable interest, particularly because agrarian colonization occurred through the creation of large production centres, such as fattorie, rather than small production units. This uniqueness makes Val di Chiana an interesting case study worthy of attention.
To assess the effects of land reclamation and colonization processes on agricultural development, it is essential to measure changes in production (Novello, Reference Novello2025), the evolution of factor productivity, and broader processes of agrarian improvement (Porisini, Reference Porisini1978). Focusing on crop distribution and production, it is well established that land reorganization has contributed to increases in total productivity. While studies on the Rhine and Yangzi deltas emphasize the role of politics, technological innovation, and new crops in promoting land reclamation (Xu and Blussé, Reference Xu and Blussé2019), this article explores the role of agricultural contracts and farm structures in introducing new crops within a traditional Mediterranean production system. By structuring risk-sharing and investment horizons, sharecropping contracts act as institutional filters that shape the form of innovation, favoring incremental and system-compatible practices, such as the use of crop residues, compost, and organic fertilizers, rather than capital-intensive transformations (Begho et al., Reference Begho, Joshi, Nepal, Shrestha, Sharma and Eory2024). The role of large landholdings is particularly significant, as they can generate gains in labour productivity but, at the same time, reductions in land productivity when farm size does not expand linearly manner (Chiarella et al., Reference Chiarella, Meyfroidt, Abeygunawardane and Conforti2023). The issue of farm size has long been a subject of attention within broader analyses of agrarian reform in the Italian context (D’Aragona, Reference D’Aragona1954).
Following this perspective of investigation to examine the role of sharecropping in the colonization process, it is important to focus on productivity (as an additional element to test research hypotheses). This is the analysis carried out in this study, and its approach builds on the work of Cohen and Galassi (Reference Cohen and Galassi1990) and engages with literature traditionally linking mezzadria to low productivity and labour-intensive practices. This inefficiency was attributed to imperfect markets, lack of credit access, and the absence of specialized supervision. However, these assumptions have been widely revised in the case of Italy (Cohen and Galassi, Reference Cohen and Galassi1990; Zanibelli, Reference Zanibelli2024, Reference Zanibelli2025). Allen and Lueck (Reference Allen and Lueck1992) indicate that the division of costs can be a source of efficiency in sharecropping. This is also attributable to the Tuscan case (Zanibelli, Reference Zanibelli2024).
Furthermore, it has been demonstrated that labour productivity related to individual products showed a growth trend between the nineteenth and twentieth centuries (Galassi, Reference Galassi1996). Within this dynamic, mezzadria is believed to have improved productivity not only by increasing labour intensity but also by enhancing labour efficiency itself (Emigh, Reference Emigh1999). The productivity issue (in agriculture) has already attracted the attention of economic historians at the macro level (for an initial analysis, see: Allen, Reference Allen2000; Wrigley, Reference Wrigley1985), which is why it is particularly meaningful to examine the micro-level case through a global lens, thereby contributing new insights to the international debate.
Based on results from the scientific debate on land reclamation, sharecropping, and productivity, this contribution does not view Tuscan mezzadria as an independent cause of land reclamation and agricultural colonization processes. Rather, it is seen as an institutional complement that supports and gives coherence to these transformations. In the context of fragmented planning and organizational constraints that were difficult to manage with other forms of contracts, sharecropping provided an economic structure that stabilized settlements and coordinated production at the territorial level through fattorie, as explained and demonstrated in section four.
The Val di Chiana experiment: sharecropping, reclamation and rural transformation
The agricultural potential of Val di Chiana area, at least the Sienese part, was already recognizable, as evidenced by a grand ducal report made by Bartolomeo Gherardini during the seventeenth century (Archivio di Stato di Siena, hereafter ASSi, Manuscripts, Visita fatta nell’anno 1676 alle Città, Terre, Castella, Comuni e Comunelli dello Stato della Città di Siena dall’Ill.mo Sig.re Bartolomeo Gherardini. Specifically, the parts related to the municipalities covered by this study). This document is particularly significant because it reconstructs the production of the main crops in all the territories of the Ancient Sienese State.
The first land reclamation experiments in Val di Chiana were initiated in the 16th century by the Medici family, with operations progressing intermittently throughout the modern era. In 1645, a central area of 30 miles long and 2 miles wide was reclaimed, with the productive zone organized in parallel strips: (1) pasture; (2) natural meadow; and (3) cereals (Di Pietro, Reference Di Pietro2006). The importance of cereal cultivation in connection with meadow and fodder production has also been highlighted for Northern Europe, where land reclamation supported mixed farming systems and fodder production (Jacobsson, Reference Jacobsson2024).
In the reclaimed area around the ‘Chiana’ canal, fattorie were established that belonged to the Scrittoio delle Regie Possessioni, which, since the 17th century, were transferred to the Order of Santo Stefano (an institution founded by Cosimo I de’ Medici in the 16th century). This Order soon became one of the major landowners in Tuscany. The transfer involved only administration, not ownership, since the grand dukes were the legal controllers of the Order (Luttazzi, Reference Luttazzi and Mirri1976; Biagianti, Reference Biagianti1990).
However, it was not until the 18th and 19th centuries, with the efforts of Vittorio Fossombroni, that significant progress was made with the ‘Grande Colmata’. The continuation of Fossombroni’s research was undertaken by Alessandro Manetti in the 1830s and subsequently by Carlo Possenti.
Investments in Val di Chiana fattorie therefore attracted considerable interest from the industrial sector, demonstrating the strength of the link between industrial capital and agricultural rent. With reference to land reclamation works, it is important to note that these continued even during the post-unification period. By 1886, a total of 7,700 hectares had been reclaimed (Di Pietro, Reference Di Pietro2006).
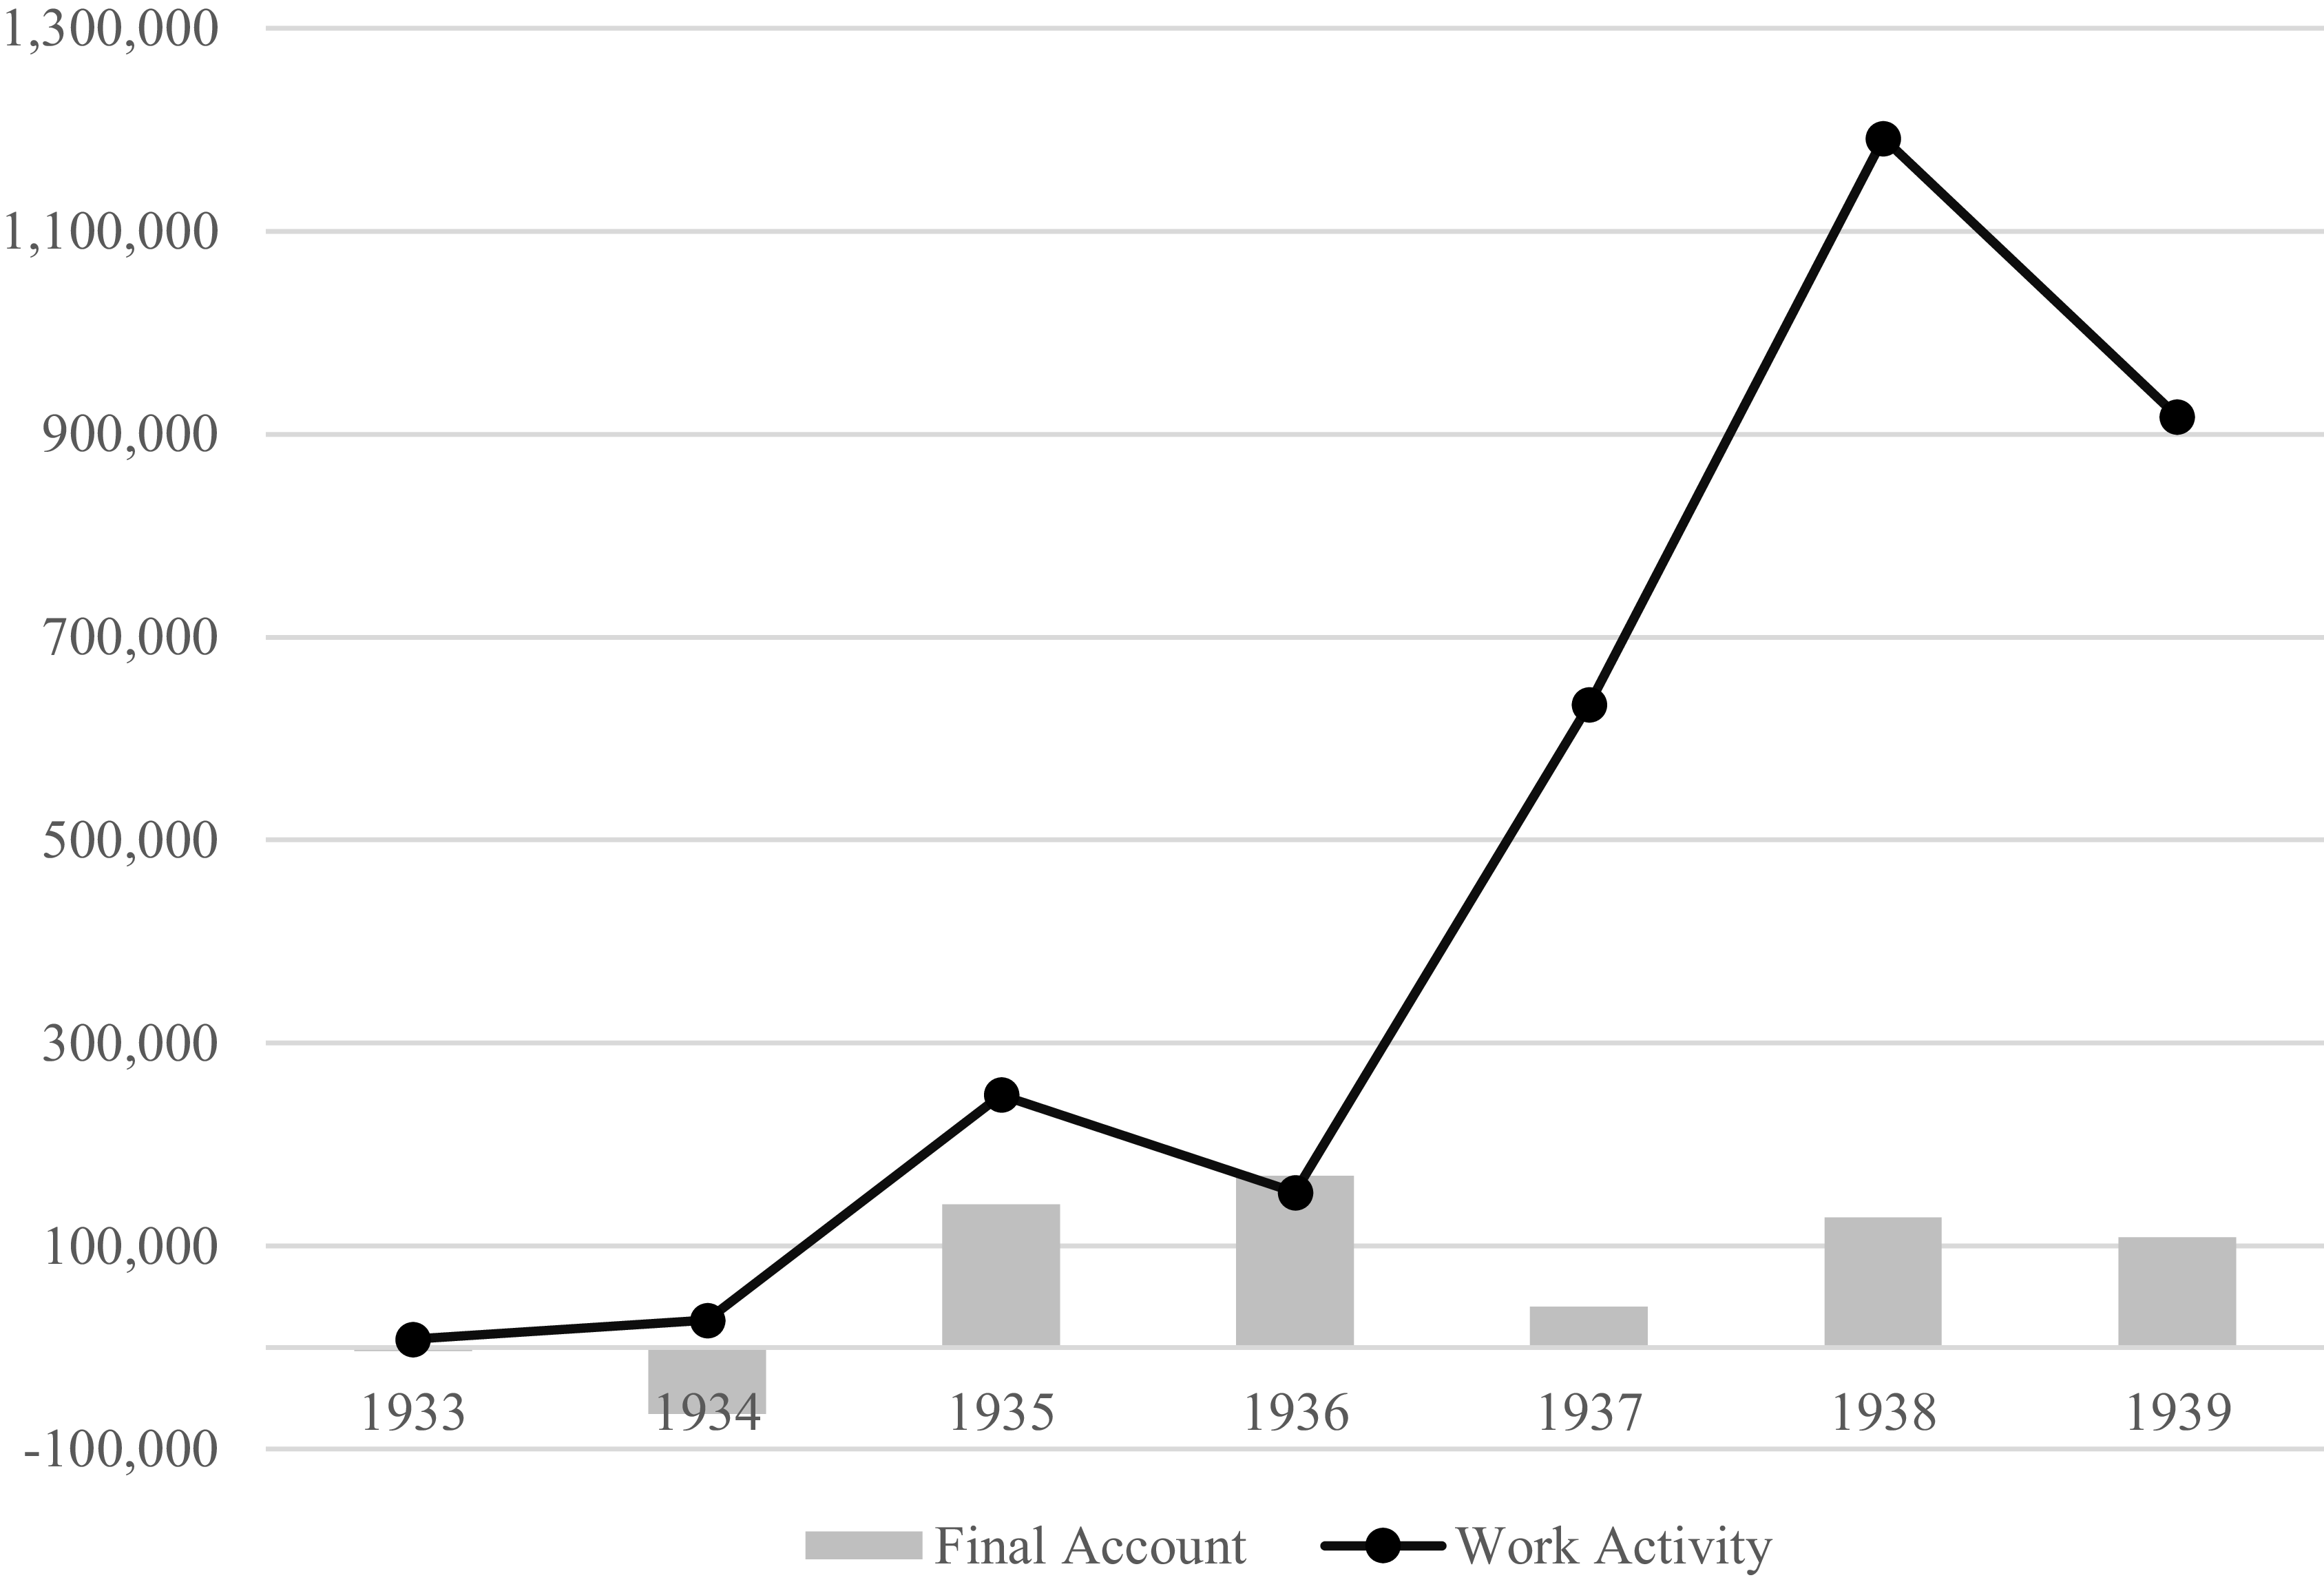
As reported by the Siena province dossier of the Catasto Agrario of 1929 (ISTAT, 1935), which includes data from the Hydraulic Reclamation Census (ISTAT, 1934c), 74% of the land to be reclaimed had been completed, and part of the infrastructure network had also been built. Moreover, in 1930 the Consortium for the Reclamation of the Roman Val di Chiana was established, and during those years, for the Chamber of Commerce of Siena, it was considered necessary to improve the territory (BCAS, various years). According to data from INEA (1939), by the late 1930s Tuscany still had 28 reclamation districts totaling 273,840 hectares, including the Tuscan Val di Chiana. In order to find further confirmation of these data (for Val di Chiana), we have observed the trend of the balance and the interventions of the commissioner’s management between 1933 and 1939 (ASSi. Gabinetto di Prefettura, 44) from which emerges the presence of interventions in the area and a substantially positive management of the Consortium (Graph 3).
Economic performance of the Val di Chiana Consortium 1933–1939.
Source: Own elaboration based on data from ASSi, Gabinetto di Prefettura, 44.
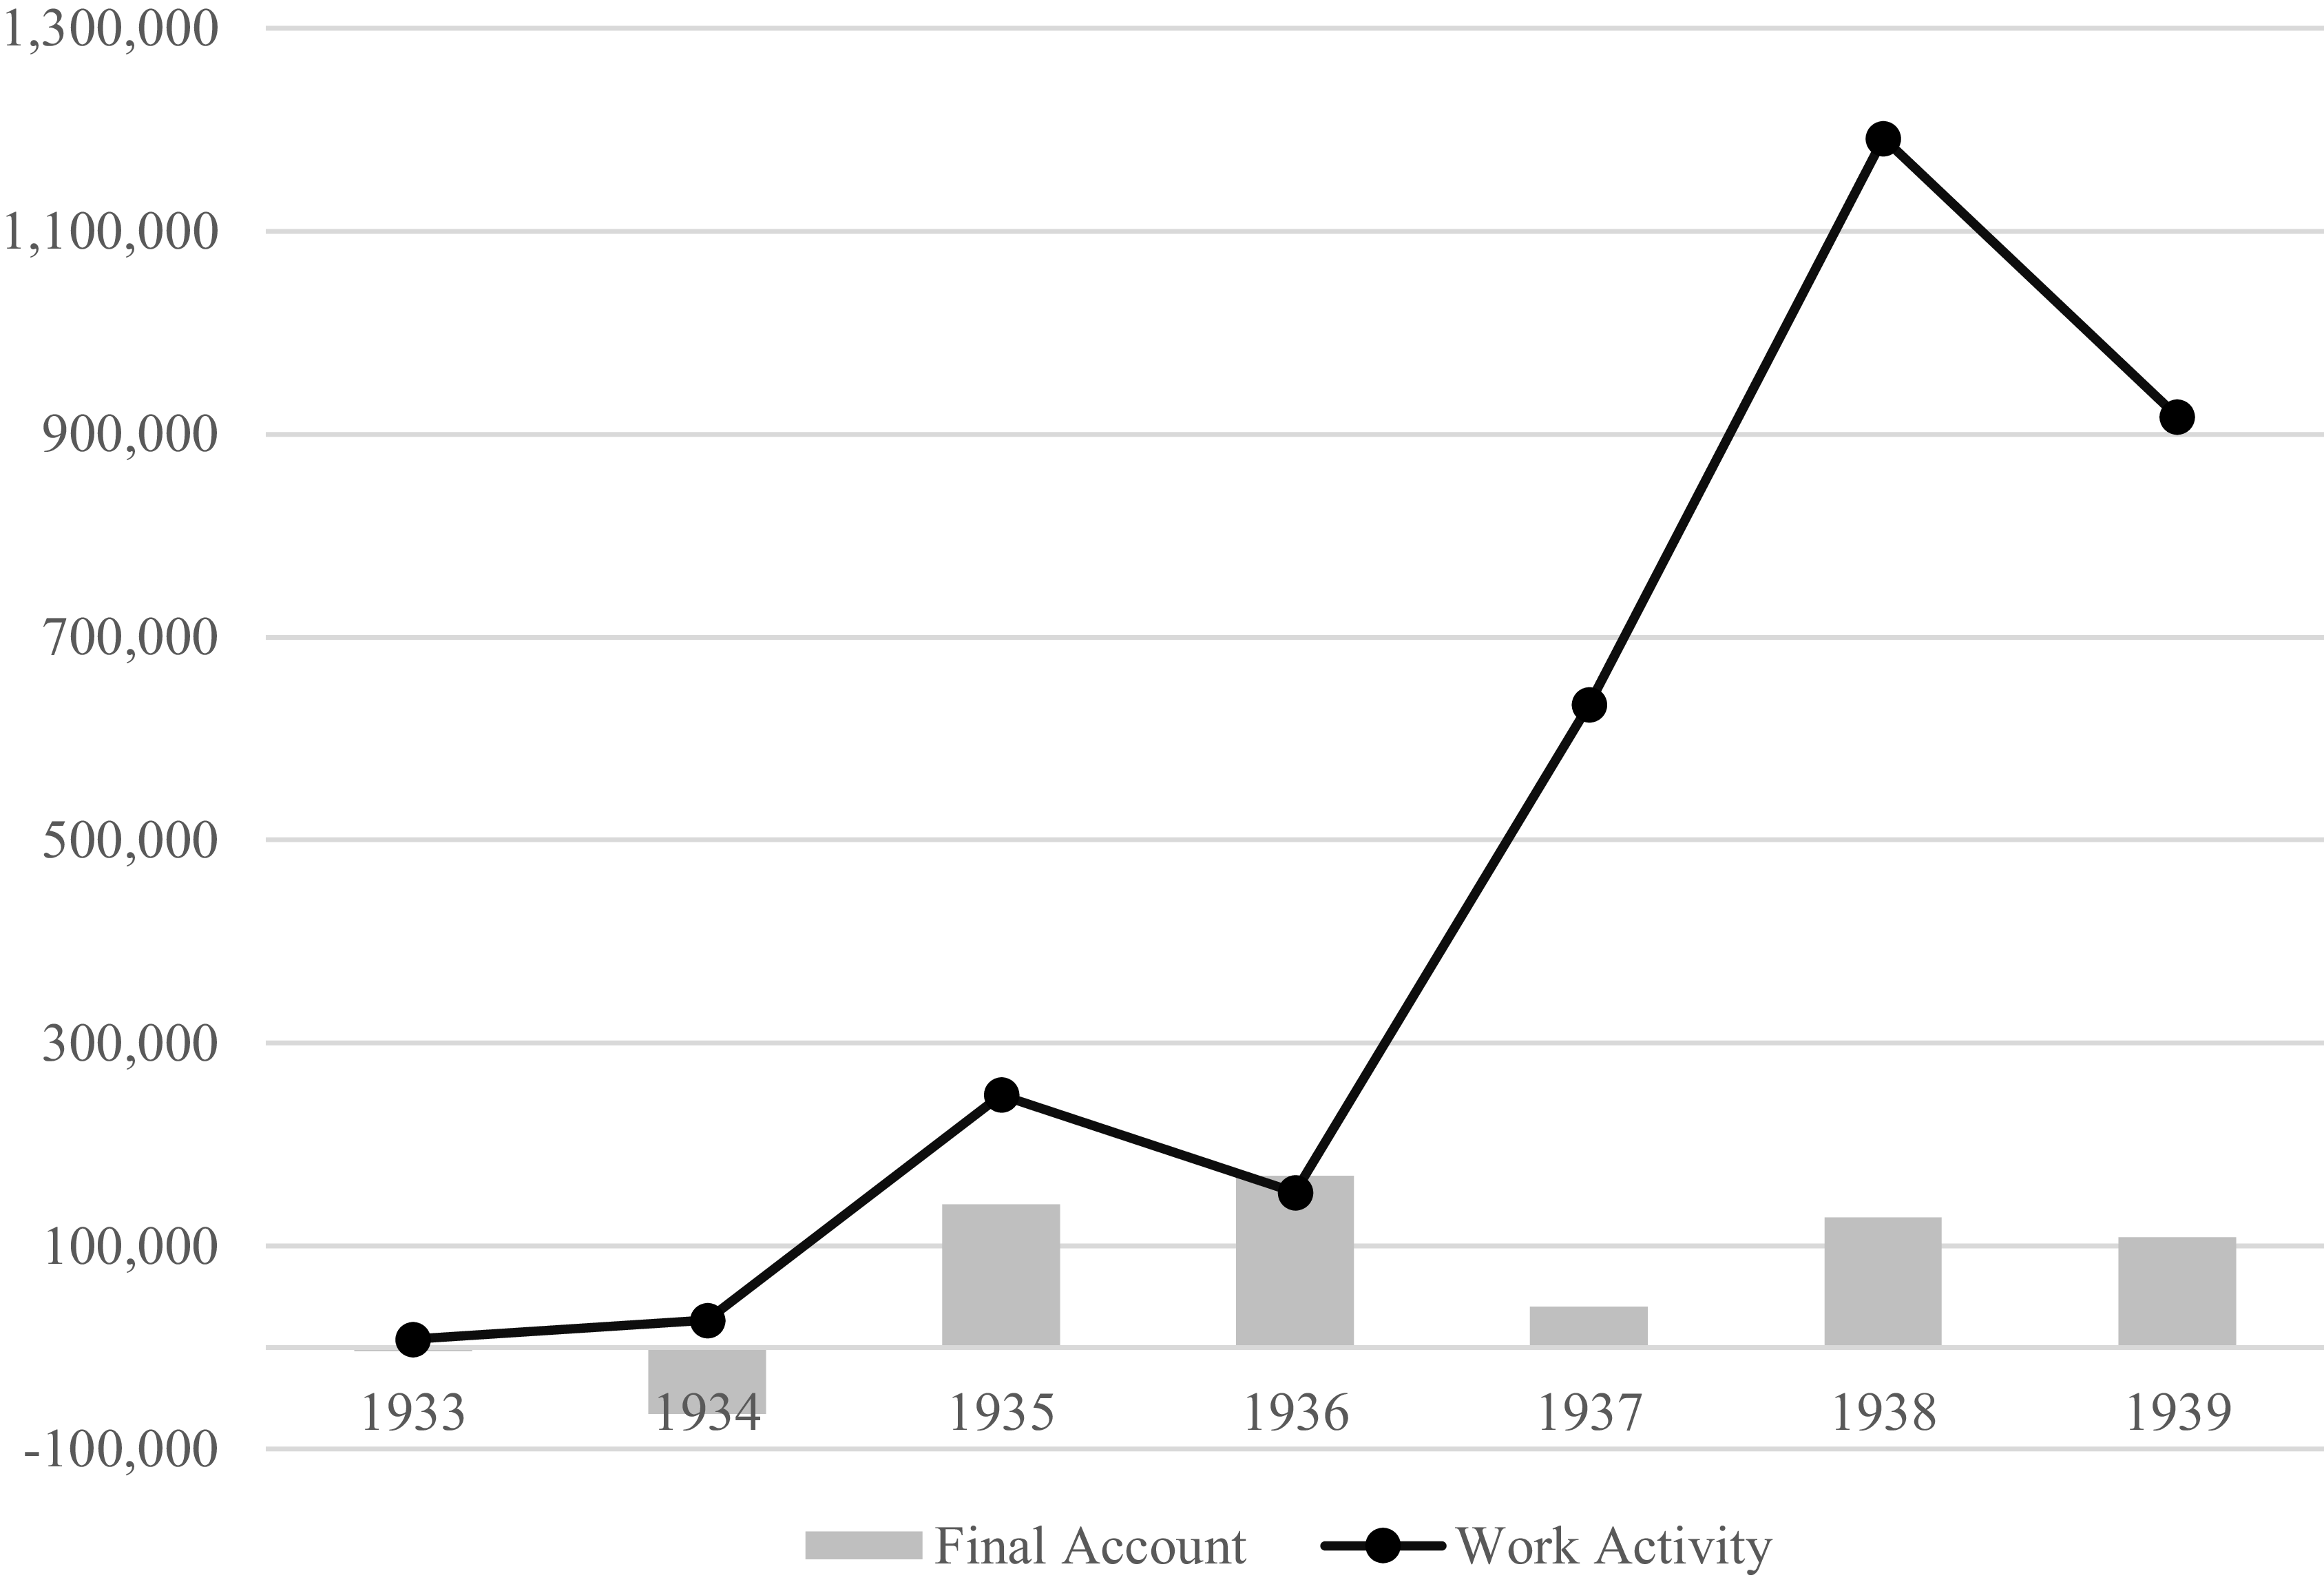
Graph 3. Long description
The bar graph compares the financial situation and operating expenses of the Val di Chiana Consortium from 1933 to 1940. The x-axis represents the years from 1933 to 1940, while the y-axis represents the financial values in thousands. The graph features vertical bars for the financial situation and a line graph for operating expenses. The financial situation bars are in grey, and the operating expenses are represented by a black line with data points. Key trends include a significant increase in operating expenses from 1936 onwards, peaking in 1938 before a slight decline in 1939 and a sharp rise again in 1940. The financial situation shows fluctuations, with notable increases in 1935, 1937, and a significant rise in 1940. All values are approximated.
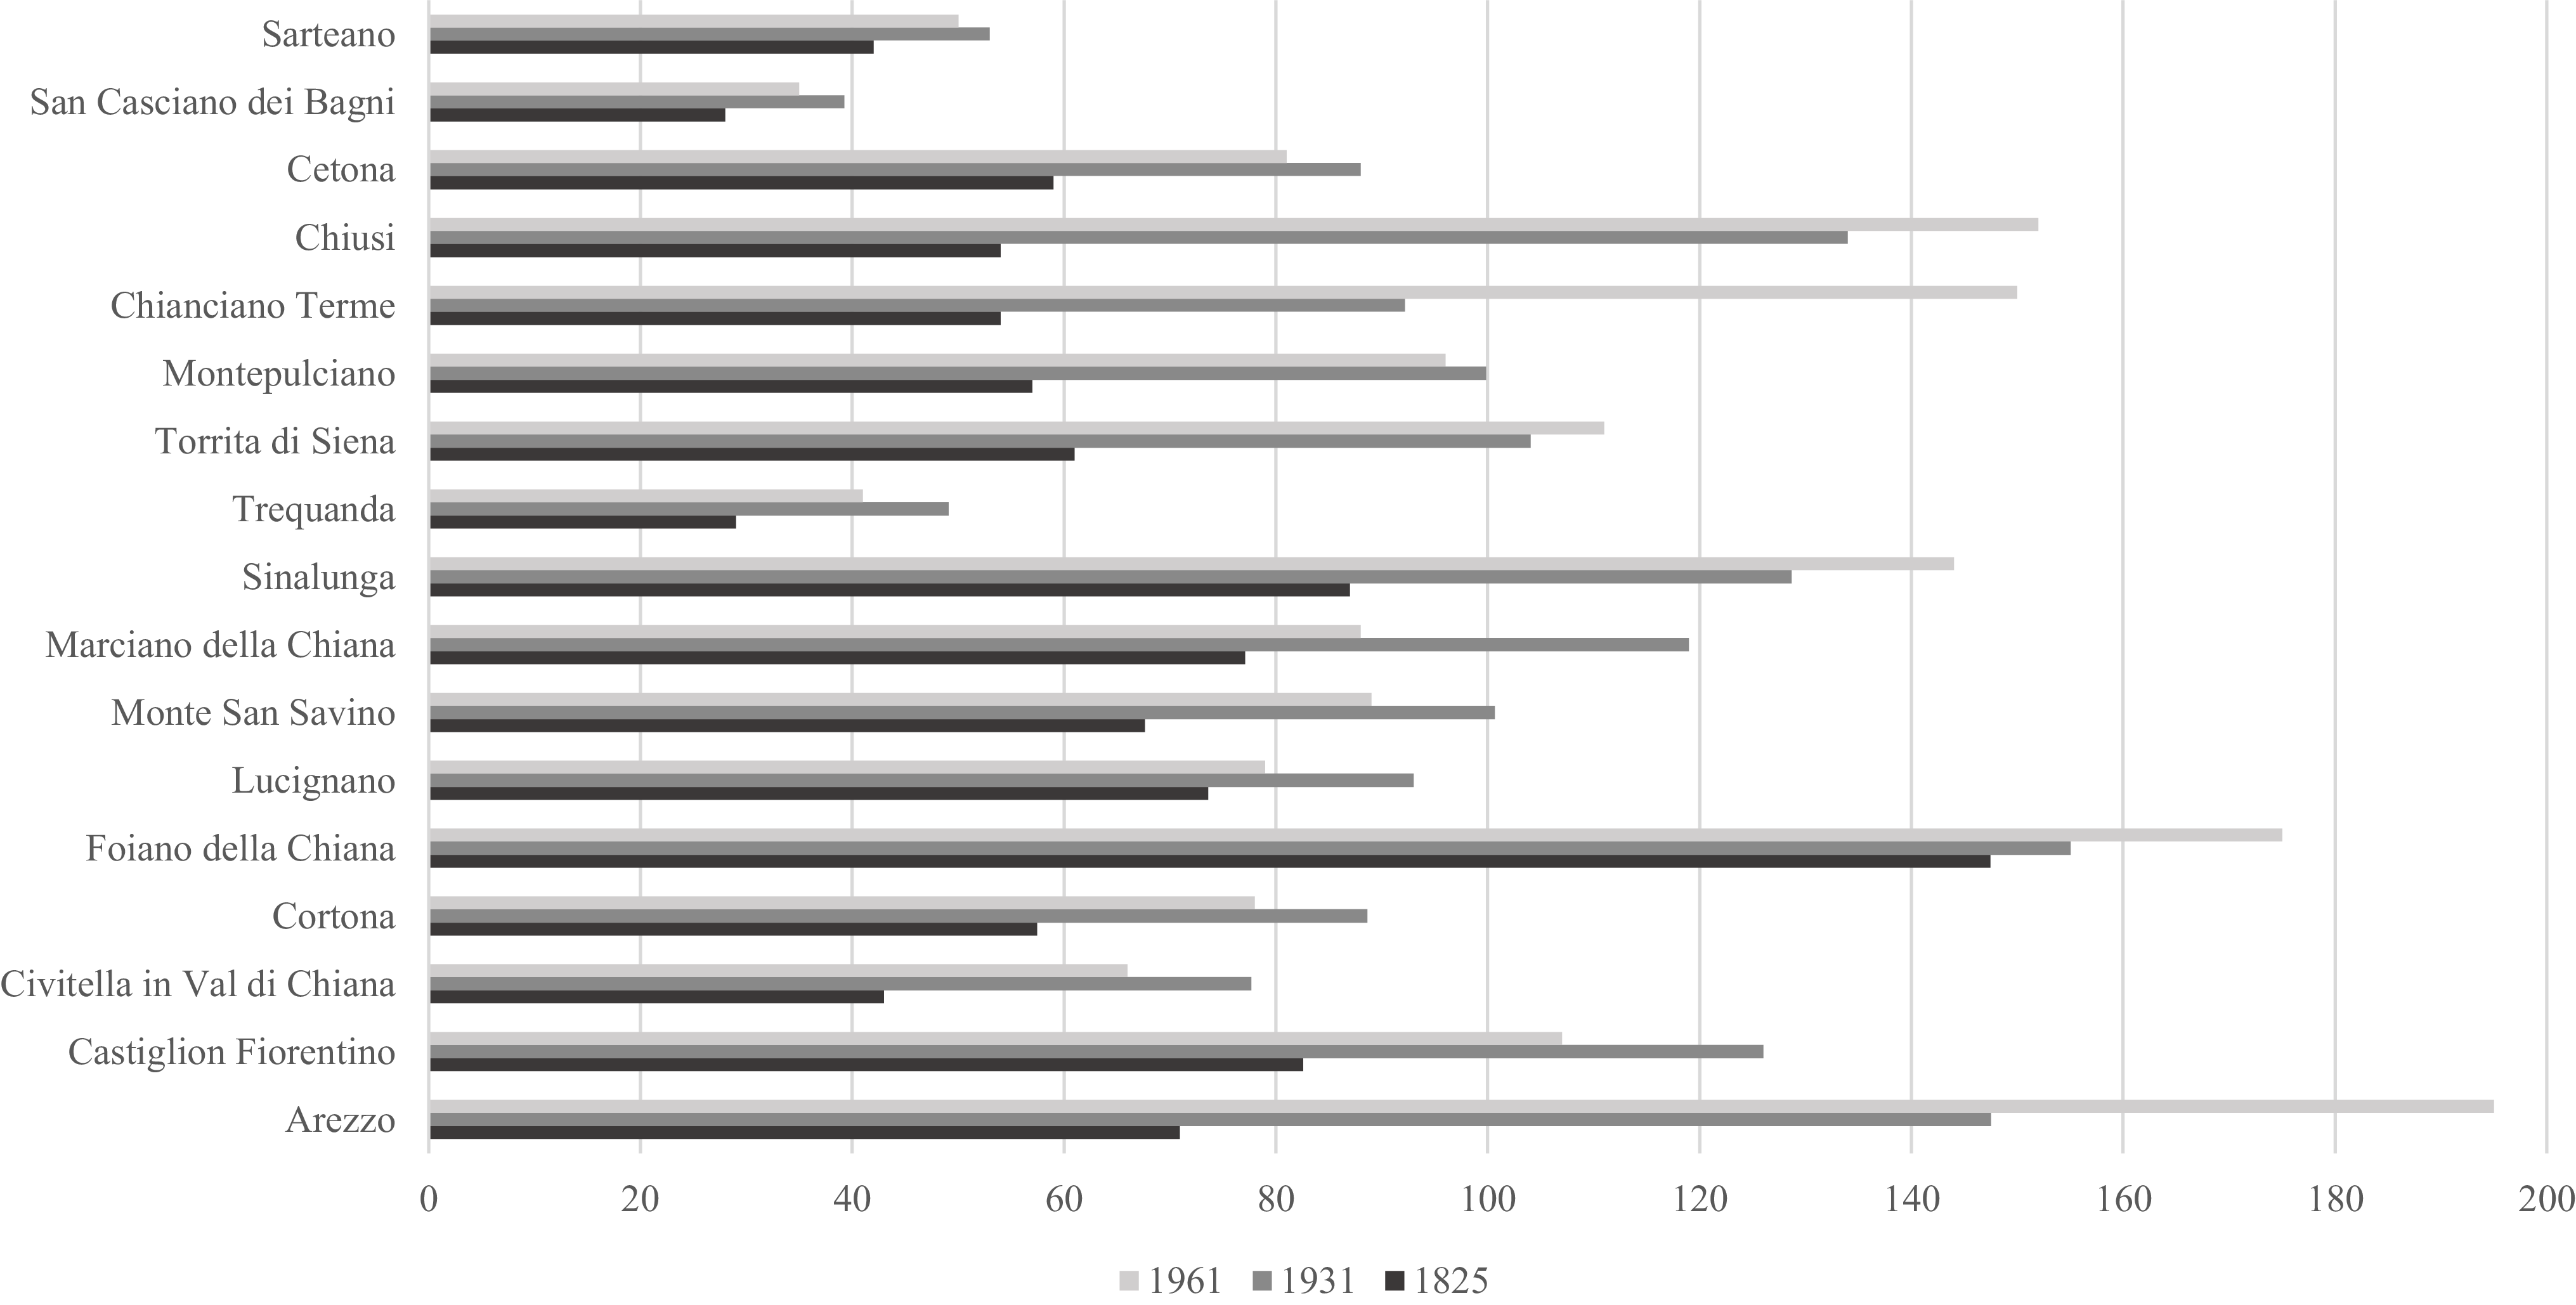
There is one aspect that deserves attention: reclamation operations did not bring substantial changes to the spatial distribution of the population and the Val di Chiana is in line with the results that have emerged from the literature, as observed by comparing population density (Graph 4) per km2 in 1825 (Biagioli, Reference Biagioli2023), 1931 (ISTAT, 1934a, 1934b) and 1961 (ISTAT, 1965, 1964). The absence of significant growth in the average values of these two indicators (1825 = 64; 1931 = 100; 1961 = 105). This finding lends further credence to the notion that sharecropping has played a pivotal role in sustaining population levels within the designated territory. By offering a new model characterized by dispersed yet interconnected production units, sharecropping provides a novel approach to agricultural development. This approach enables the assessment of the contract’s impact on the colonization processes over an extended timeframe.
Val di Chiana population density 1825–1961.
Source: Own elaboration based on data from ISTAT, 1934a, 1934b; ISTAT, 1964, 1965; Biagioli, Reference Biagioli2023.
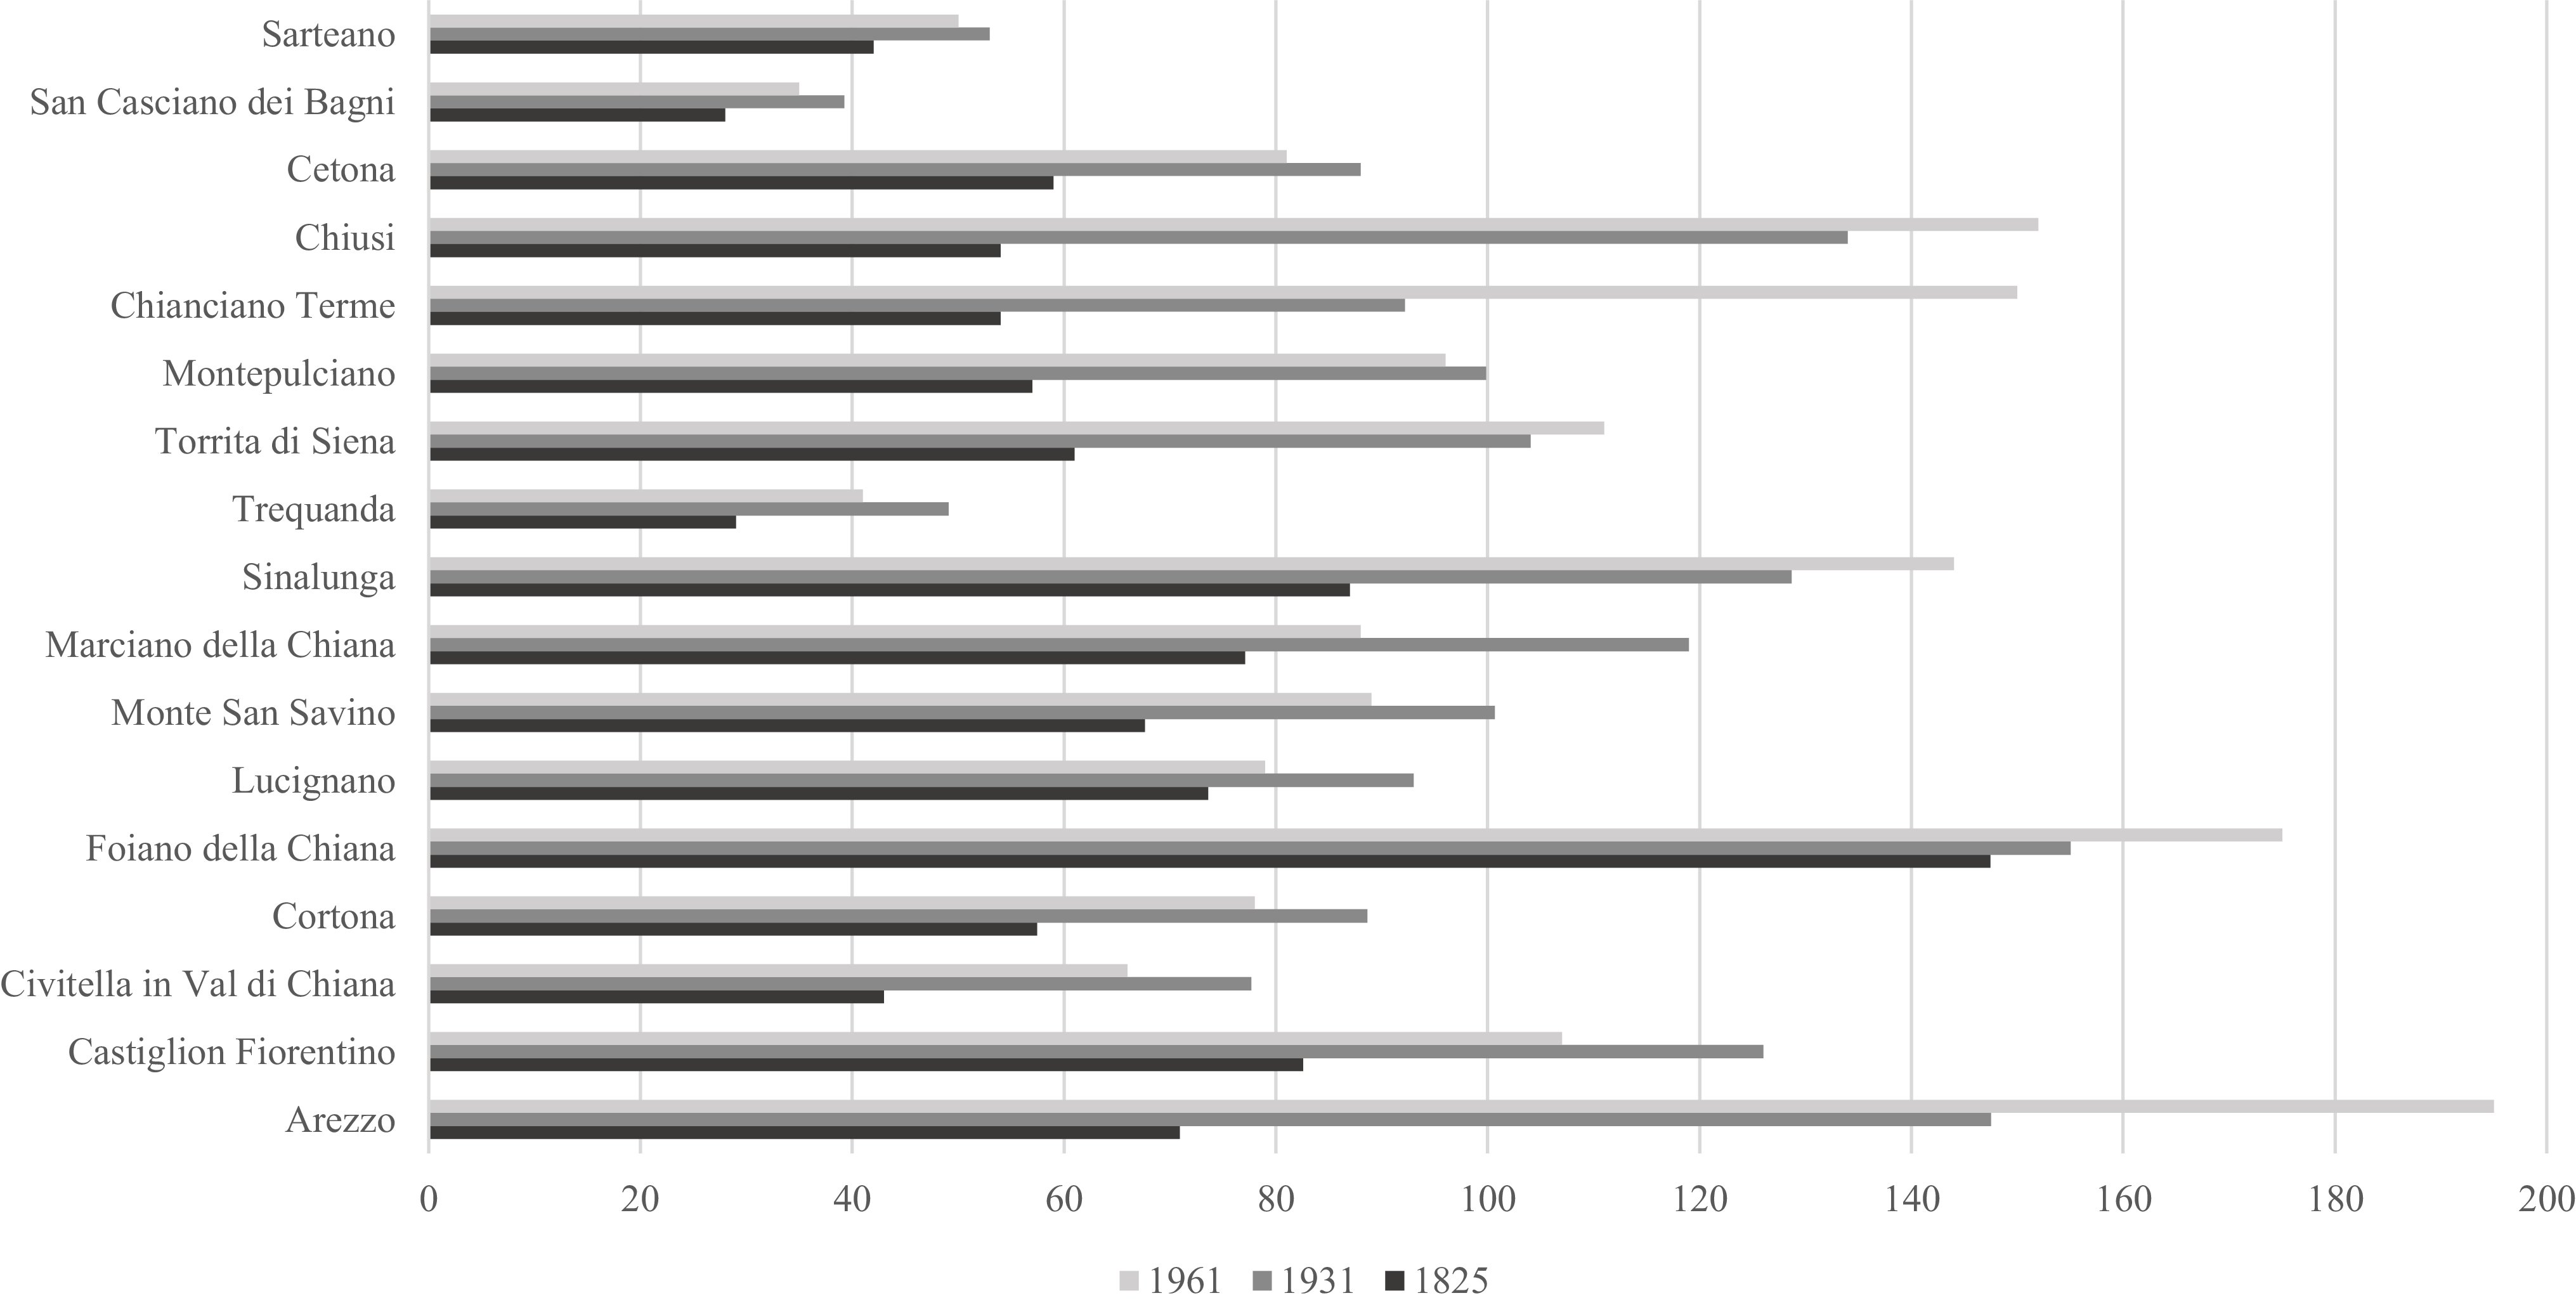
Graph 4. Long description
The bar graph compares population density in various towns of Val di Chiana over three years: 1825, 1931, and 1961. The x-axis represents the population density values, ranging from 0 to 200. The y-axis lists the towns, including San Casciano dei Bagni, Cetona, Chiusi, Chianciano Terme, Montepulciano, Torrita di Siena, Trequanda, Sinalunga, Marciano della Chiana, Monte San Savino, Lucignano, Foiano della Chiana, Cortona, Civitella in Val di Chiana, Castiglion Fiorentino, and Arezzo. Each town has three horizontal bars representing the population density for the years 1825, 1931, and 1961. The bars are color-coded: dark gray for 1825, medium gray for 1931, and light gray for 1961. Notable trends include an overall increase in population density over time for most towns, with some variations. For instance, Foiano della Chiana and Arezzo show significant increases, while other towns like San Casciano dei Bagni and Trequanda exhibit more modest changes. All values are approximated.
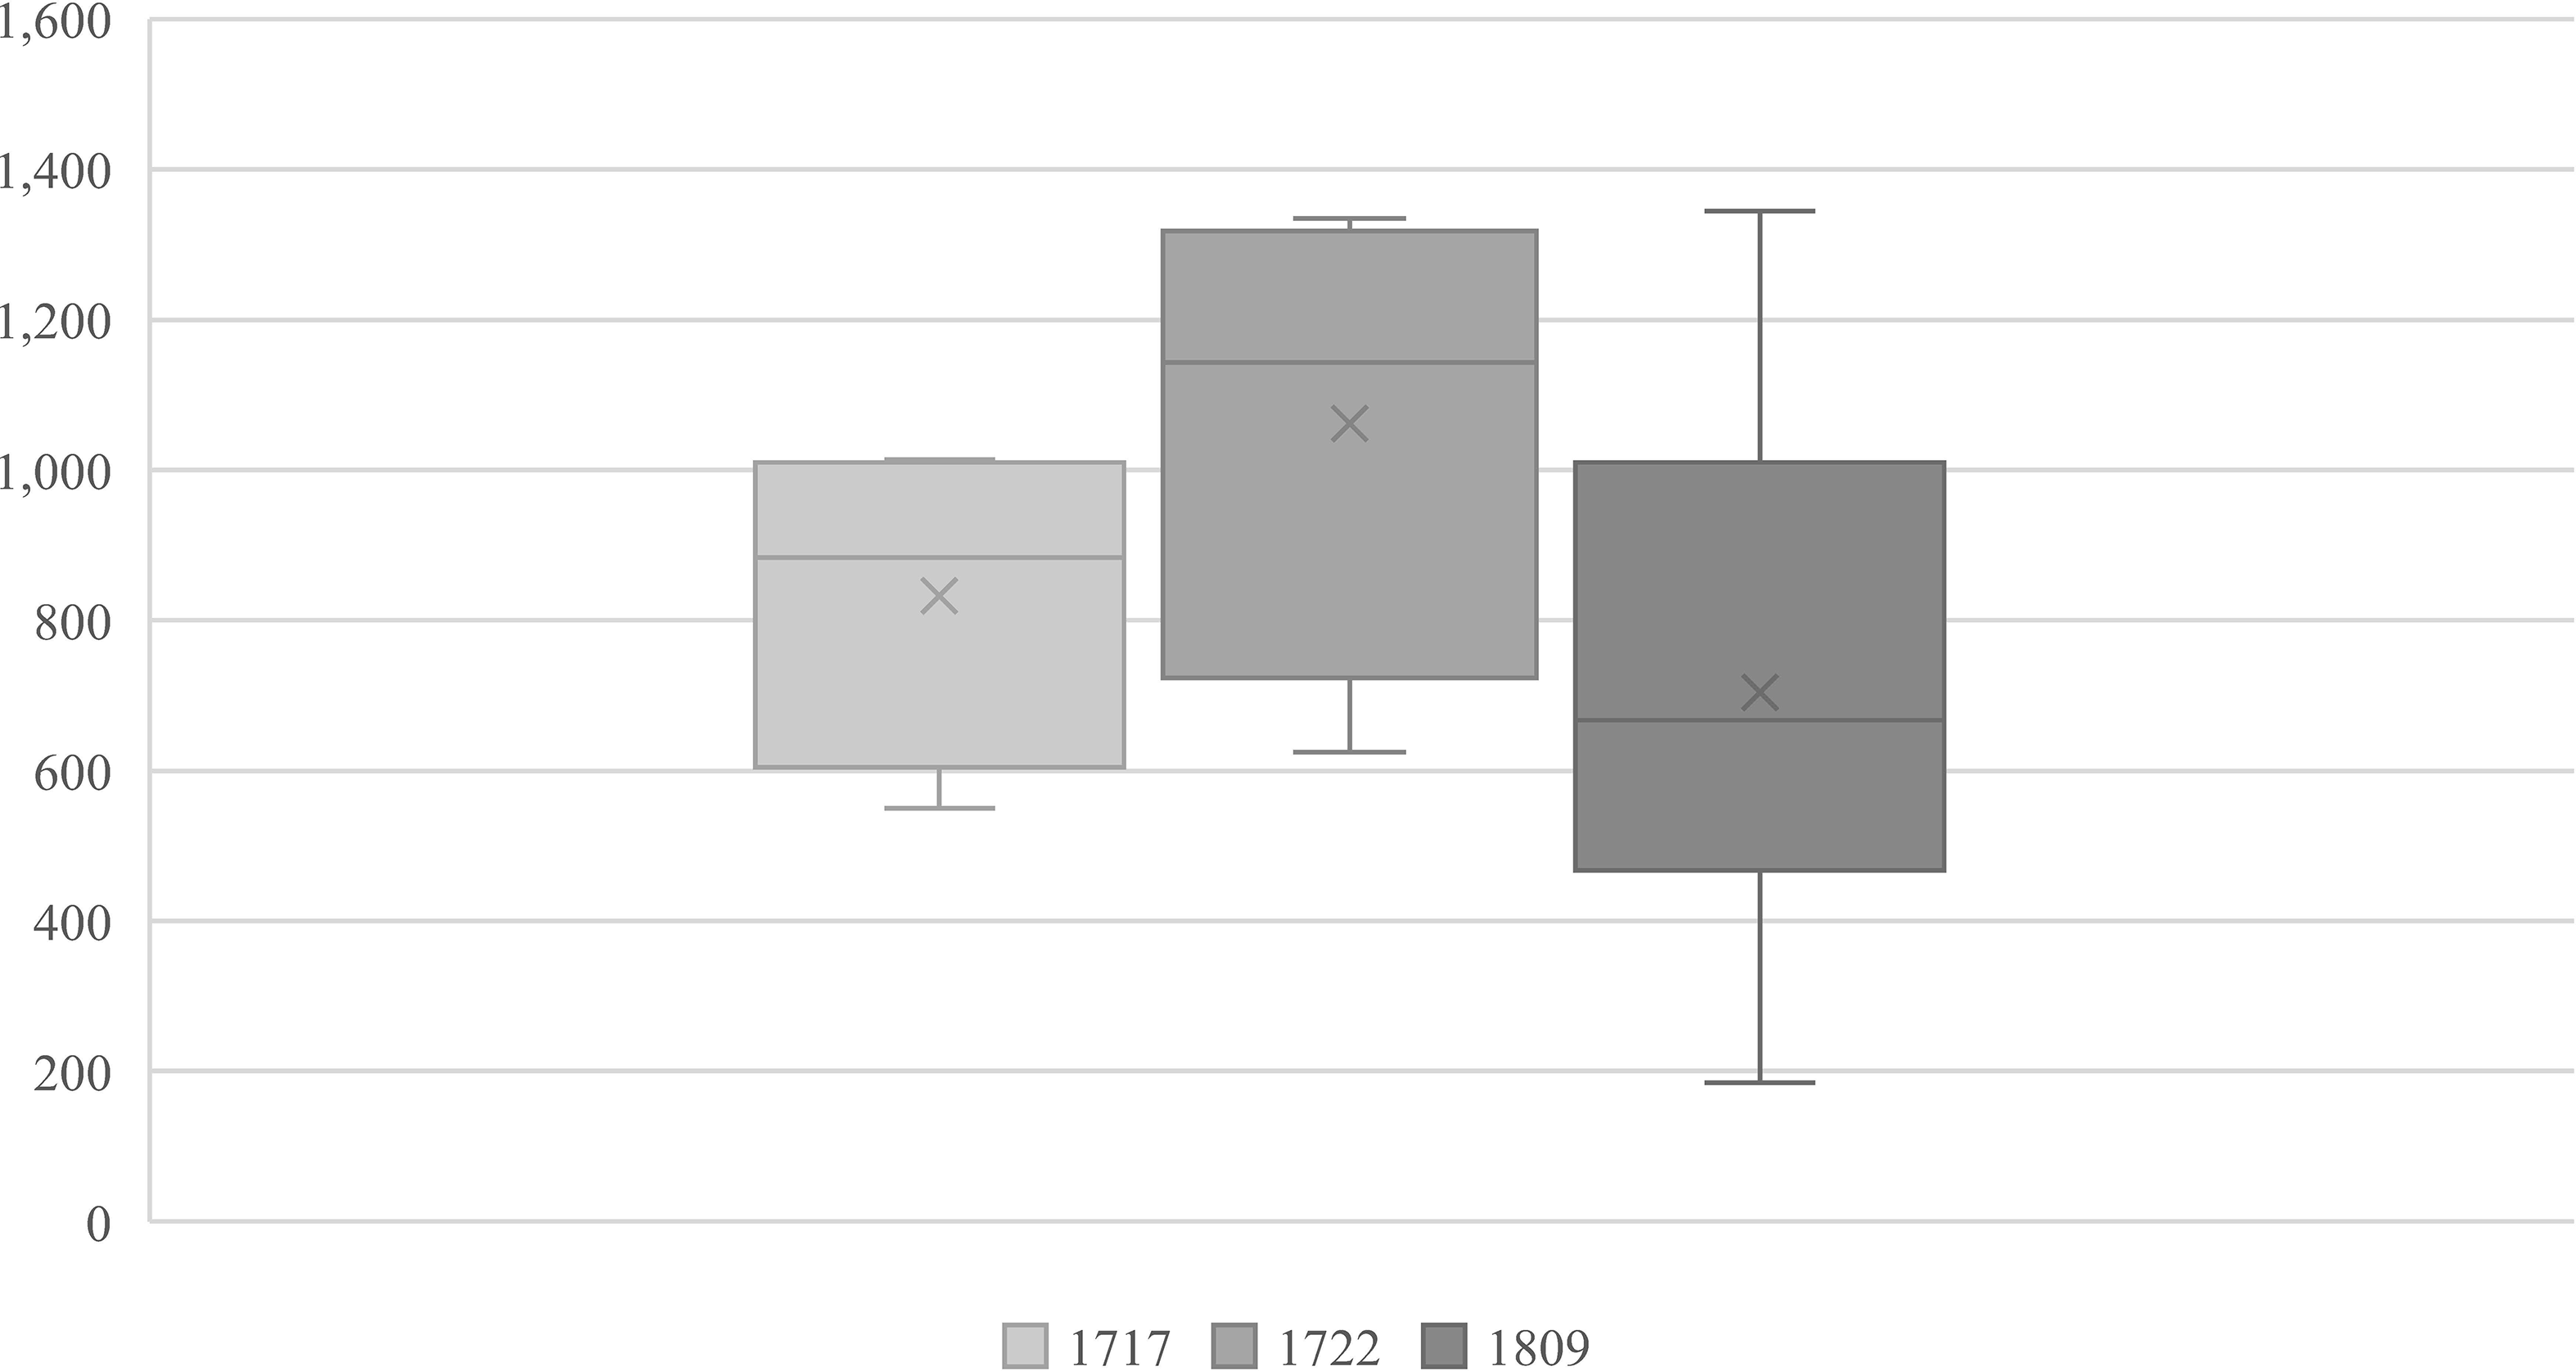
Over the course of a century, the reclamation works more than doubled the total surface area of the grand ducal fattorie, which increased from 2,485 hectares (1704) to 5,632 hectares (1809) thanks to the creation of four additional large estates (Biagianti, Reference Biagianti1990). It is worth noting that this increase occurred during Fossombroni’s period, and the surface area increased within individual farms, too, confirming a continuous process of land improvement even within already established estates. These were large production structures with an average size of over 800 hectares in 1717, over 1,000 hectares in 1722, and over 700 hectares in 1809–14 (Biagianti, Reference Biagianti1990). The decrease recorded in the last survey is due to the creation of a 184-hectare farm in 1814, a factor that introduced greater variability in the series, as confirmed by the increase in standard deviation between the three periods observed: 220 hectares (1717); 321 hectares (1722); and 370 hectares (1809–14). The data analysis revealed an increase in heterogeneity in the last period, further supported by the presence of outliers (Graph 5), a clear sign of a territory undergoing transformation.
Box plot size grand ducal fattorie Val di Chiana 1717–1809.
Source: Own elaboration based on data from Biagianti, Reference Biagianti1990.
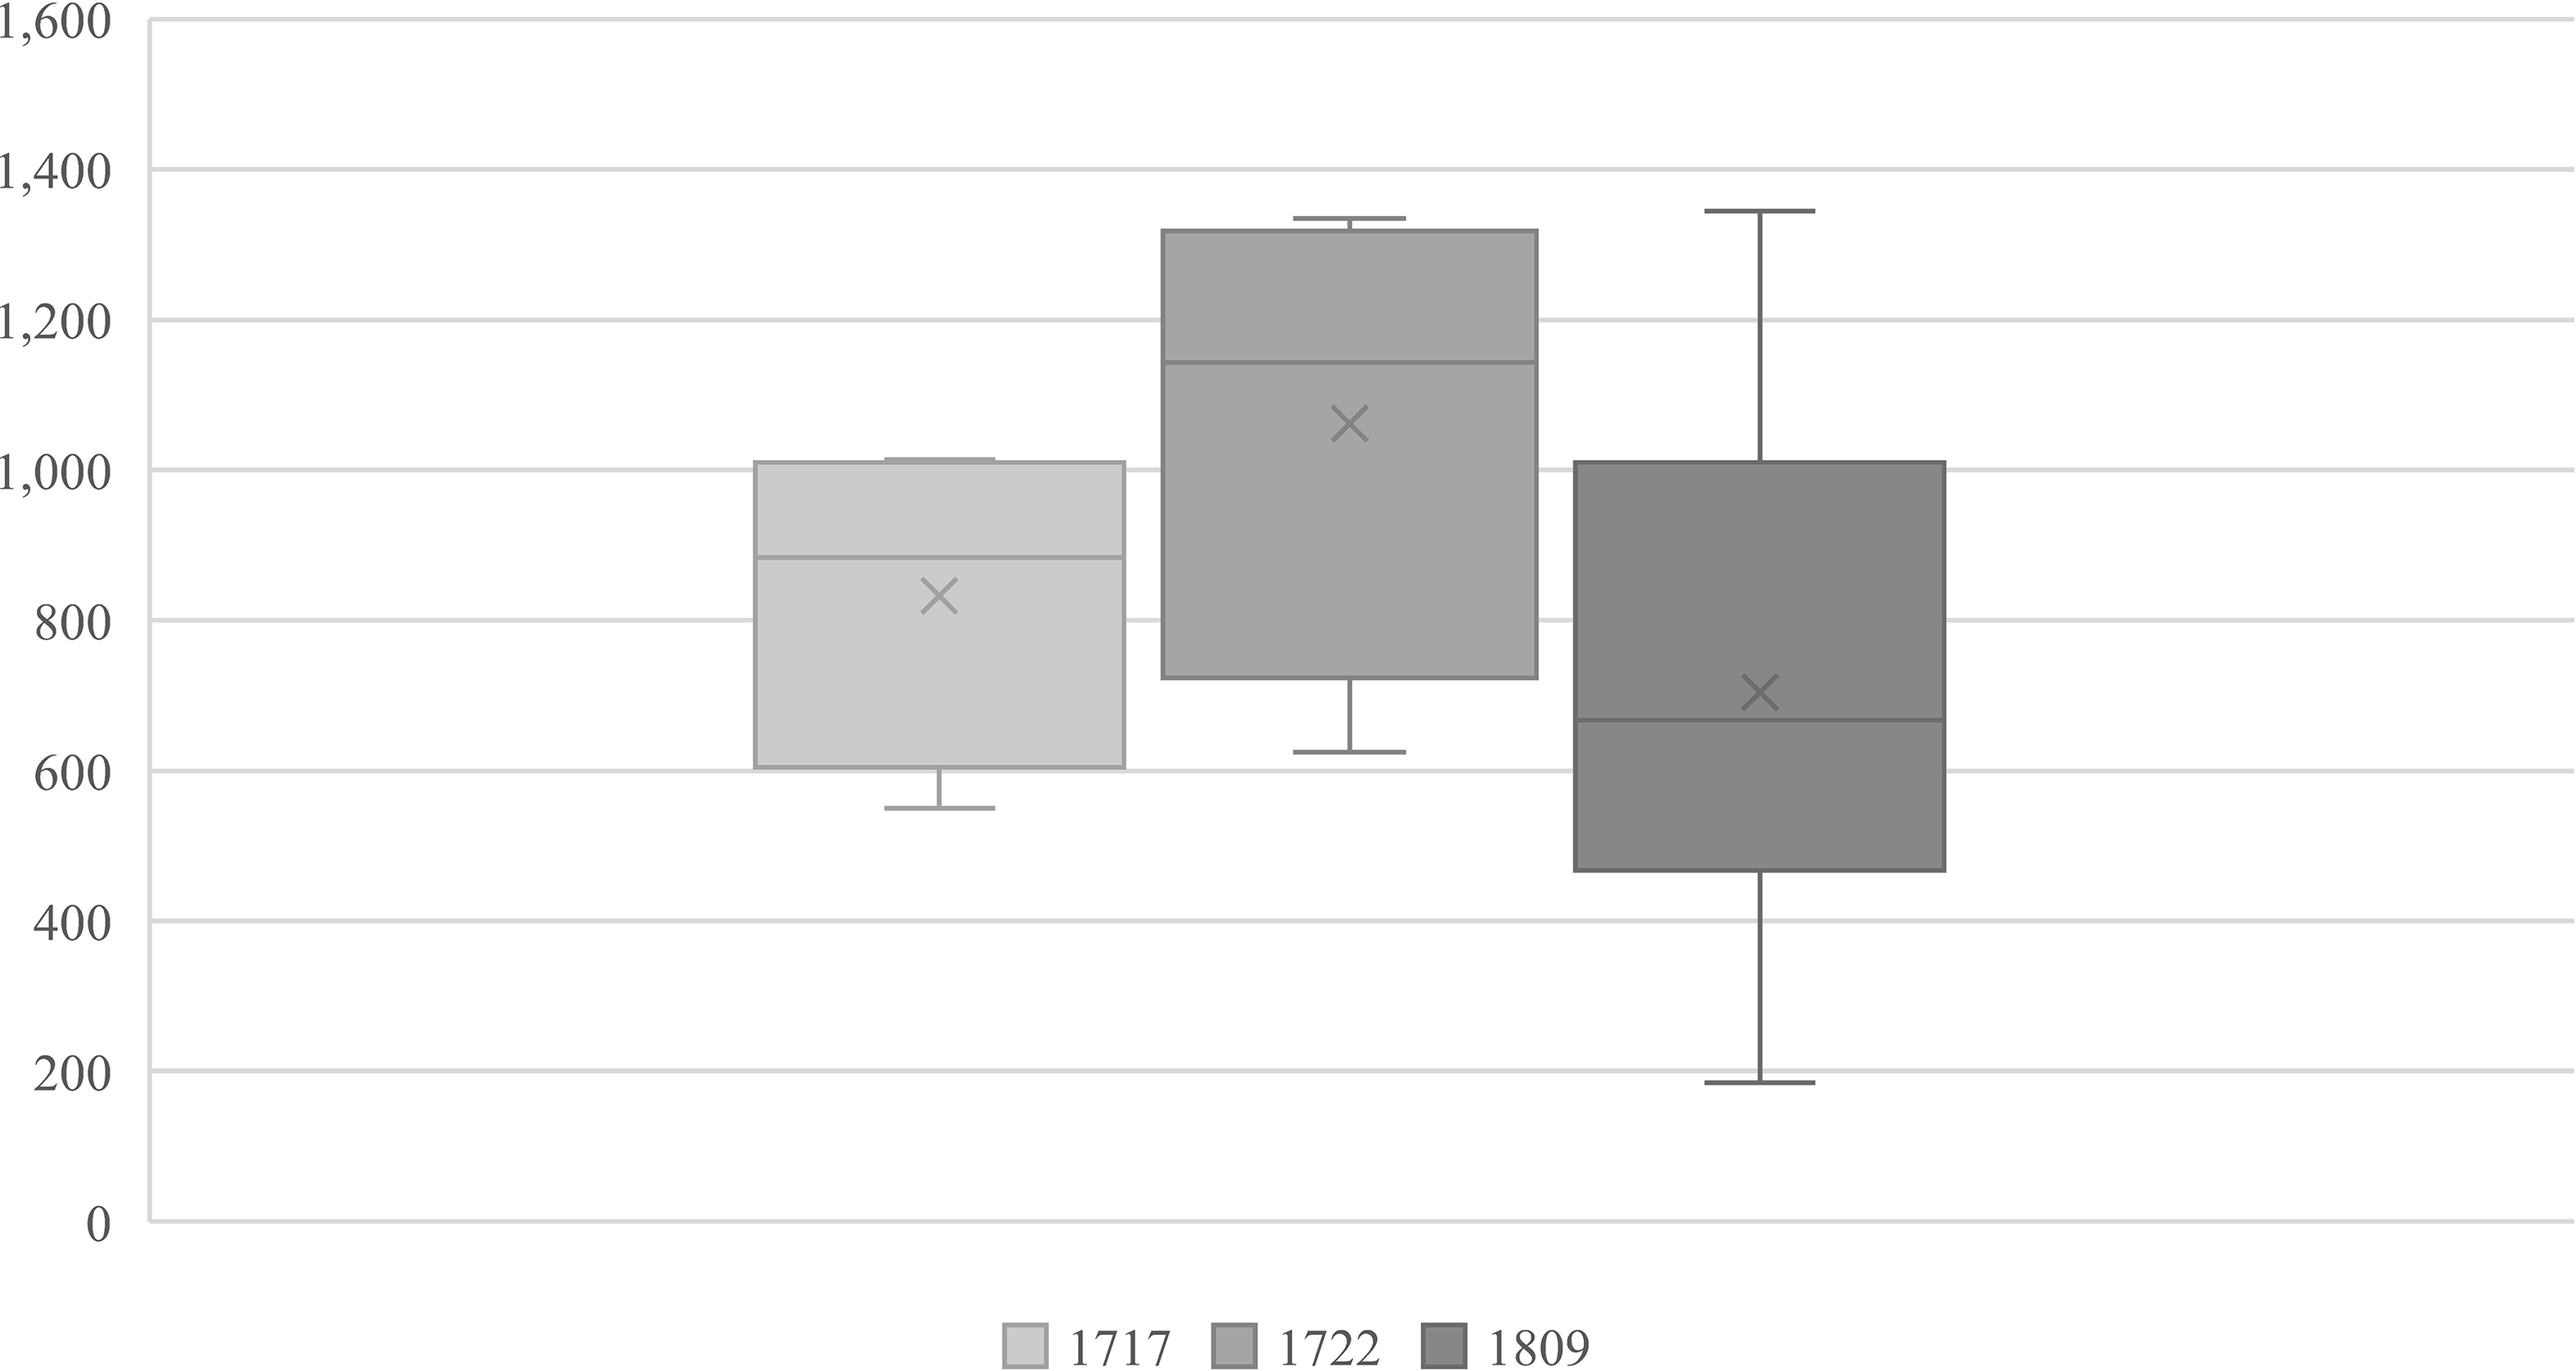
Graph 5. Long description
The box-and-whisker plot compares the size of grand ducal farms in Val di Chiana for the years 1717, 1722, and 1809. The plot features three vertical box plots, each representing a different year. The x-axis is labeled with the years 1717, 1722, and 1809, while the y-axis ranges from 0 to 1600, representing the size of the farms. Each box plot shows the distribution of farm sizes for the respective year. For 1717, the median farm size is around 800, with the lower quartile at approximately 600 and the upper quartile at around 1000. The whiskers extend from about 500 to 1100, indicating the range of farm sizes. For 1722, the median farm size is around 1000, with the lower quartile at approximately 800 and the upper quartile at around 1200. The whiskers extend from about 700 to 1300. For 1809, the median farm size is around 800, with the lower quartile at approximately 600 and the upper quartile at around 1000. The whiskers extend from about 400 to 1200. The plot indicates that farm sizes varied significantly over the years, with 1722 showing the largest median size and the widest range. All values are approximated.
The fattoria represented the organizational centre of the early reclamation works.Footnote 7 During this phase, a specific category of workers emerged: the mezzaioli, who played a significant role in land reclamation. Although they received half of the output, they were not assigned permanent podere and lacked stable reserves; for this reason, they can be interpreted as co-participants in the production process rather than standard sharecroppers. The mezzaiolo thus represented a transitional agricultural figure, whose importance gradually declined as reclamation progressed and newly reclaimed land was increasingly assigned to standard sharecroppers. Although mezzaioli reappeared in limited numbers during specific periods, particularly in the first half of the nineteenth century, they always remained a small minority.Footnote 8
From this perspective, the Val di Chiana represents an economic laboratory for testing how sharecropping (this term is comprehended in its broadest political and economic sense) played a significant role in the processes of land reclamation, in particular, considering that literature has analyzed the impact of sharecropping on investment and productivity (Deininger et al., Reference Deininger, Jin and Yadav2013).
During this period, Val di Chiana triggered a process of agrarian growth with an enhancement of cereal cultivation, and here, we grasp the importance of sharecropping as an instrument of colonization. Among these, it is important to note the introduction of maize, which started very slowly but then became established towards the end of the 18th century, at the expense of minor cereals (barley and oats); at least according to the accounting records of the Bettolle farm (Guastaldi and Mazzetti, Reference Guastaldi and Mazzetti2018). These data align with findings on the emergence of maize cultivation in Umbria (Mocarelli and Vaquero Piñeiro, Reference Mocarelli and Vaquero Piñeiro2018). One could therefore identify the water canalization works as a driving force behind the consolidation of maize cultivation within the policoltura system; a similar relationship between water regulation and the introduction of maize has also been observed in Southern Italy (Bulgarelli and Zanibelli, Reference Bulgarelli, Zanibelli, Camarero Bullón, Gómez Navarro, Fernández-Arroyo López-Manzanares and Bernabé Crespo2024). Evidence from Greece suggests that corn cultivation was often embedded in large-estate sharecropping systems, especially in lowland environments, where it complemented extensive cereal and livestock farming; however, landlords rarely invested capital, sharecropping functioned primarily as a form of rent extraction rather than coordination, and technical innovation remained limited (Petmezas, Reference Petmezas, Lains and and Pinilla2009). Mulberry trees were also introduced at that time alongside another arboreal crop, hemp, and gained particular importance because, within the farm system in the Val di Chiana, a specific production sector was dedicated to silkworm breeding. Industrial crops such as hemp, sugar beet, and tobacco were also introduced to the area.
After the Unification of Italy (1861), the fattorie owned by the Grand Duchy of Tuscany passed into the Kingdom’s state property. From here, a debate about their future developed (De Gori Pannilini, Reference De Gori Pannilini1862). By 1877, more than 12,000 hectares had been reclaimed, and the sale of 10 farms had brought 20 million lire into the Italian State’s coffers (Fichera, Reference Fichera1897). It is significant to note that this process led both to fragmentation involving local landowners and to concentration processes through the involvement of large capital, including Bettino Ricasoli, Pietro Bastogi, and Giacomo Servadio in partnership with Giuseppe Trivulzi (Casa Trivulzi e Hollander e C. of Paris) (Del Corto, Reference Del Corto1898; Di Pietro, Reference Di Pietro2009).
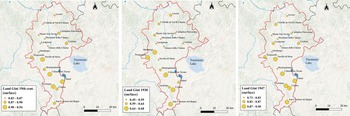
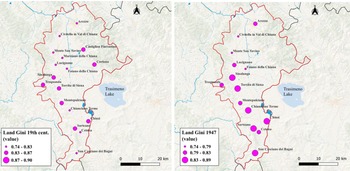
It emerged that the colonization process in Val di Chiana was generated and subsequently preserved within a large company dimension, and this is also confirmed by the measurement of land inequality between the pre-unification period and the first half of the twentieth century (Figures 2–3).Footnote 9
Land inequality (surface) in the Val di Chiana from the First Half of the Nineteenth Century to 1947.
Source: Own processing with GIS technology based on data from Index Database of Landowners; ISTAT, 1933, 1935; INEA, 1947.
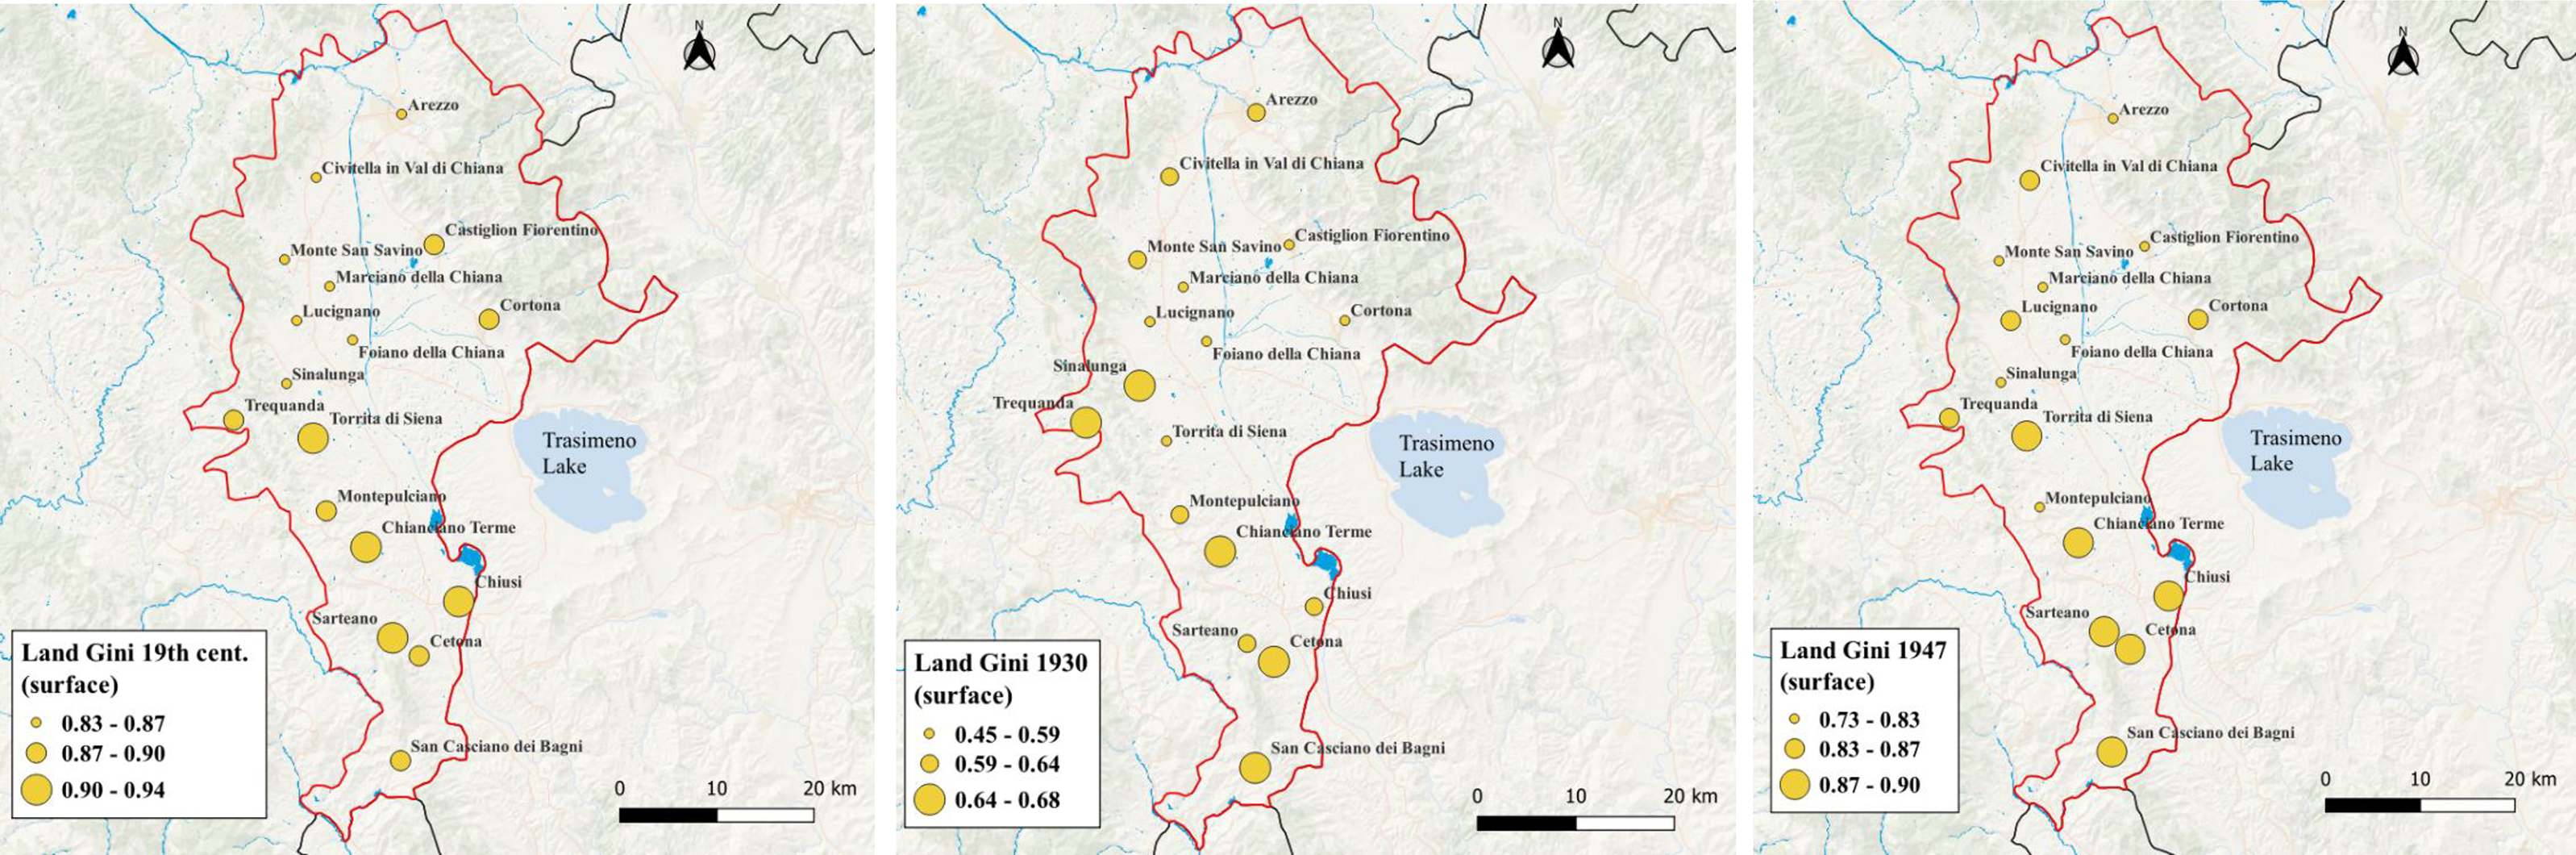
Figure 2. Long description
Three maps illustrate land inequality in the Val di Chiana region from the first half of the 19th century to 1947. Each map uses different color-coded dots to represent varying levels of land Gini coefficients. The first map, labeled ‘Land Gini 19th cent. (surface),’ shows the distribution of land inequality in the 19th century with dots ranging from yellow to dark orange. The second map, labeled ‘Land Gini 1930 (surface),’ depicts land inequality in 1930 with a similar color scheme. The third map, labeled ‘Land Gini 1947 (surface),’ represents land inequality in 1947. Each map includes several towns and cities such as Arezzo, Civitella in Val di Chiana, and Chiusi, marked with yellow dots. The maps also highlight Lake Trasimeno. The color coding indicates different levels of land inequality, with darker colors representing higher inequality. The maps provide a visual representation of how land inequality has changed over time in the Val di Chiana region.
Land inequality (value) in the Val di Chiana from the First Half of the Nineteenth Century to 1947.
Source: Own processing with GIS technology based on data from Index Database of Landowners; INEA, 1947.

Figure 3. Long description
The map displays land inequality values in the Val di Chiana region, highlighting changes from the nineteenth century to 1947. The left side of the map shows land inequality values during the nineteenth century, with different shades of pink indicating varying levels of inequality. The right side of the map shows land inequality values in 1947, similarly color-coded. Key locations such as Arezzo, Civitella in Val di Chiana, and Chiusi are marked, along with other towns and cities in the region. The map includes a legend explaining the color coding for land inequality values, ranging from 0.74 to 0.90. The Val di Chiana region is bordered by the regions of Umbria and Lazio, and the map includes the location of Lago Trasimeno.
The inequality indicator confirms that the province of Siena exhibited strong landownership concentration, even compared to the general situation across the entire Italian Peninsula (Martinelli, Reference Martinelli2016). Notably, data on land value reveal greater concentration in the central plain of the Val di Chiana. A likely explanation for this pattern lies in the fattoria system, which was still prevalent in central Italy, and particularly Tuscany, during the first half of the twentieth century (Albertario, Reference Albertario1939; Zanibelli, Reference Zanibelli2025). Thus, processes of colonization and transformation would have taken place within a significant presence of inequality.
Measuring the effects of agrarian colonization Val di Chiana: from the fattoria to the territorial dimension
This section presents the results of the analyses to test the effects of Tuscan sharecropping as an institution and tool of agrarian colonization. It is structured as follows: an initial study (using archival documents) of the company’s dimension to see if the fattoria can be considered a successful business in the agricultural transition and finally a territorial analysis (based on statistical sources) to measure the effects of colonization on production processes and crop innovation. The combined use of these two types of sources is significant because it facilitates the verification of the statistical data from the 1930s.
It has been observed that the fattoria model plays a pivotal role in the agrarian colonization process for the following reasons: (1) it encourage the sharecropping households to settle in the area, which guarantees the proper functioning of the poderi; (2) it undertakes out part of the land reclamation and redevelopment work; (3) developing a strategic business capable of adapting to macroeconomic changes and improving production and productivity.
As a preliminary analysis, has been observed the business strategy of a fattoria in the Val di Chiana located in the municipality of Torrita di Siena (ASSi, Bargagli Petrucci. Amministrazione Agricola. Torrita) and then has been measured the spillover effect of the area on an important fattoria located in a neighbouring municipality (Rapolano) in the Val di Chiana area during periods of significant exogenous shocks such as the post-unification years between the 1880s and the early 1900s. (ASSi, Tadini Buoninsegni. Amministrazione Agricola. Saldi).
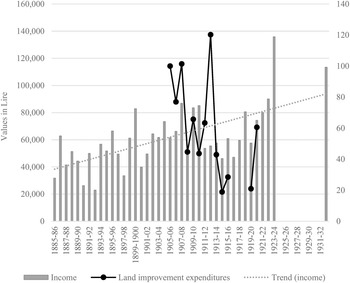
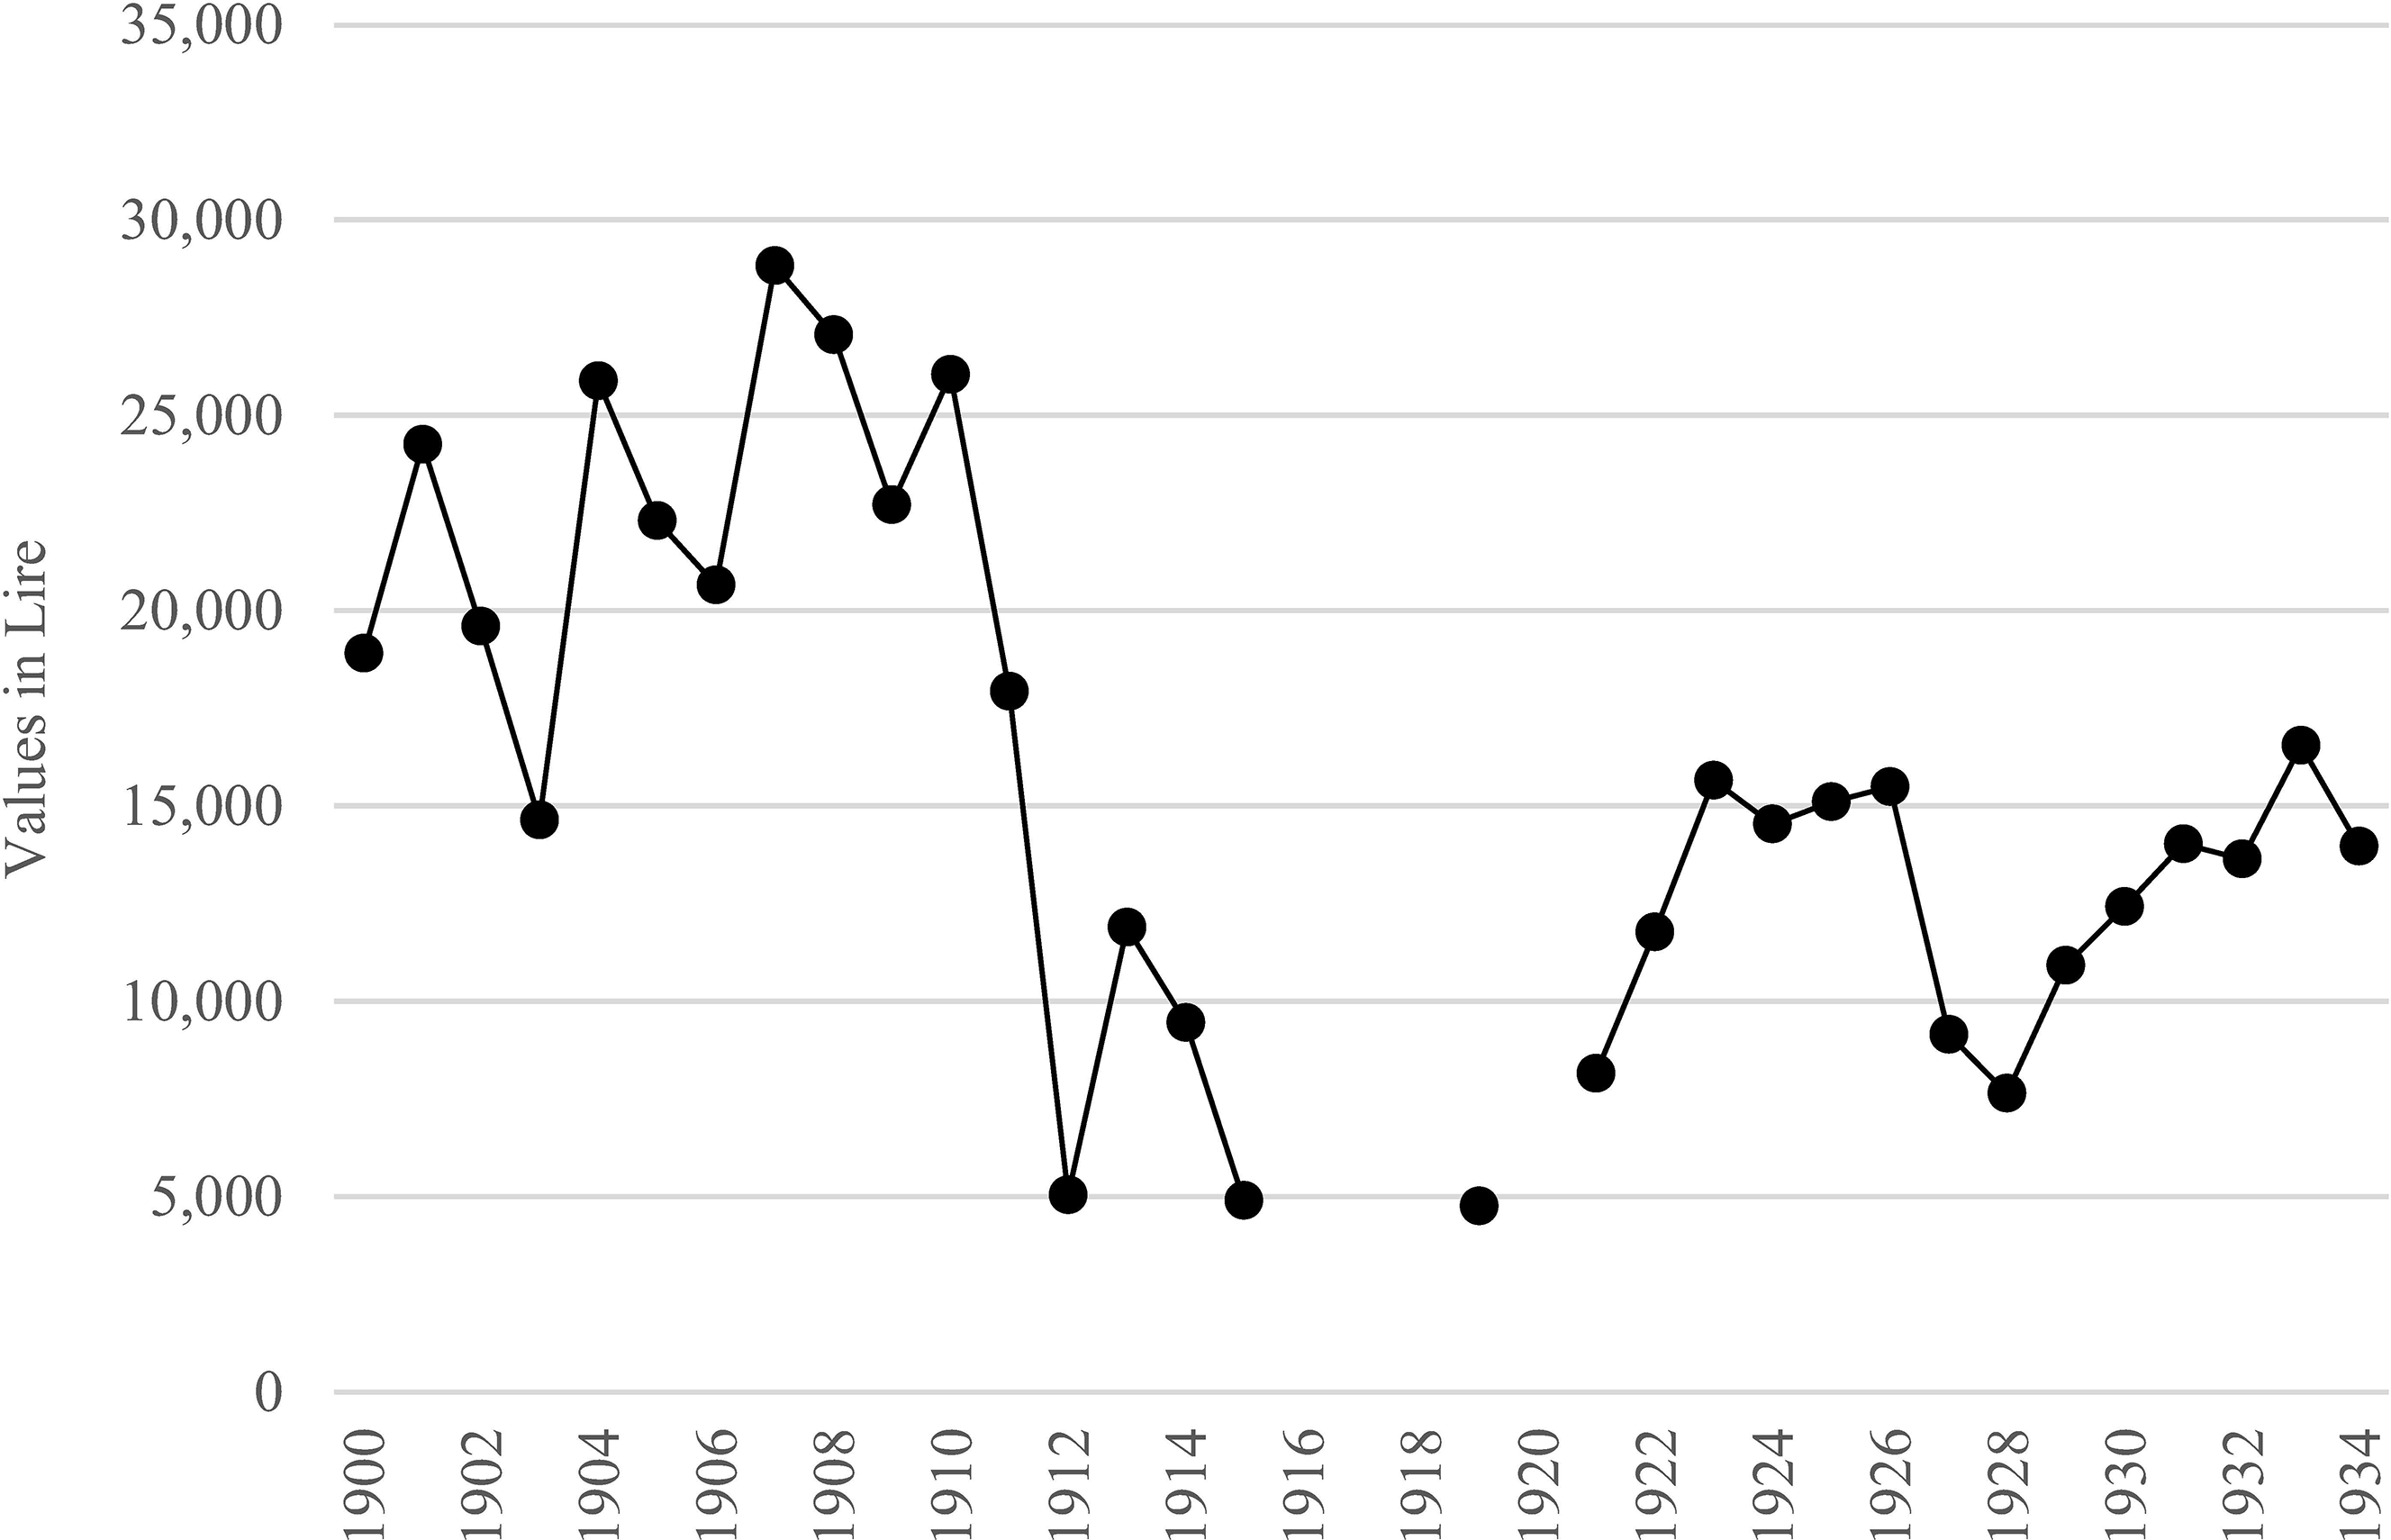
The fattoria of Torrita covered slightly more than 200 hectares and between 1885 and 1902, consisted of eleven productive units. It represents a relevant case study because it belonged to the Bargagli Petrucci family, a leading force in Sienese political life, which allows us to evaluate the extent to which ownership pays attention to the processes of agrarian transformation and to test the capacity of sharecropping to carry out agrarian change. Through administrative reports (ASSi, Bargagli Petrucci. Amministrazione Agricola. Torrita, 162), it has been possible to reconstruct the farm’s performance and land improvement expenditures during periods affected by macroeconomic changes (Graph 6) and, at the same time, to test the propensity to introduce specialized crops, such as tobacco (Graph 7). The accounting records reveal of the productive complex’s marked resilience to exogenous shocks. This is further confirmed by two valuations of the estate carried out between 1885 and 1902, which highlight the ownership’s capacity to reorganize the productive units and to strengthen tobacco cultivation. This crop declined during the years of the Great War. Those years, however, were also characterized by capital increases, a pattern consistent with previous findings concerning the ability of Sienese sharecropping to respond to the strains of the so-called ‘Fronte Interno’ (Zanibelli, Reference Zanibelli2019, Reference Zanibelli2025). A similar trend is reflected in the estate’s attention to land reclamation processes, as shown by the accounts for 1914 and 1915, when a considerable share of expenditure on cultivation was allocated to ‘colmata’ operations (ASSi, Bargagli Petrucci. Amministrazione Agricola. Torrita, 162). A similar trend emerges from the accounts of another farm in the Val di Chiana, Belsedere (municipality of Trequanda), which from 1923 to 1928 allocated a good share of its total expenditure to land improvement. (ASSi, Gori Pannilini. Elenco di consistenza. Belsedere, 12).
Performance of the Fattoria of Torrita income (1885–1932) and land improvement expenditures (1905–1921).
Source: our elaboration based on data from ASSi, Bargagli Petrucci. Amministrazione Agricola. Torrita, 162. Monetary values are real obtained through the Bank of Italy’s deflator (1938 = 1). Land improvement expenditures are an index (1905–06 = 100).
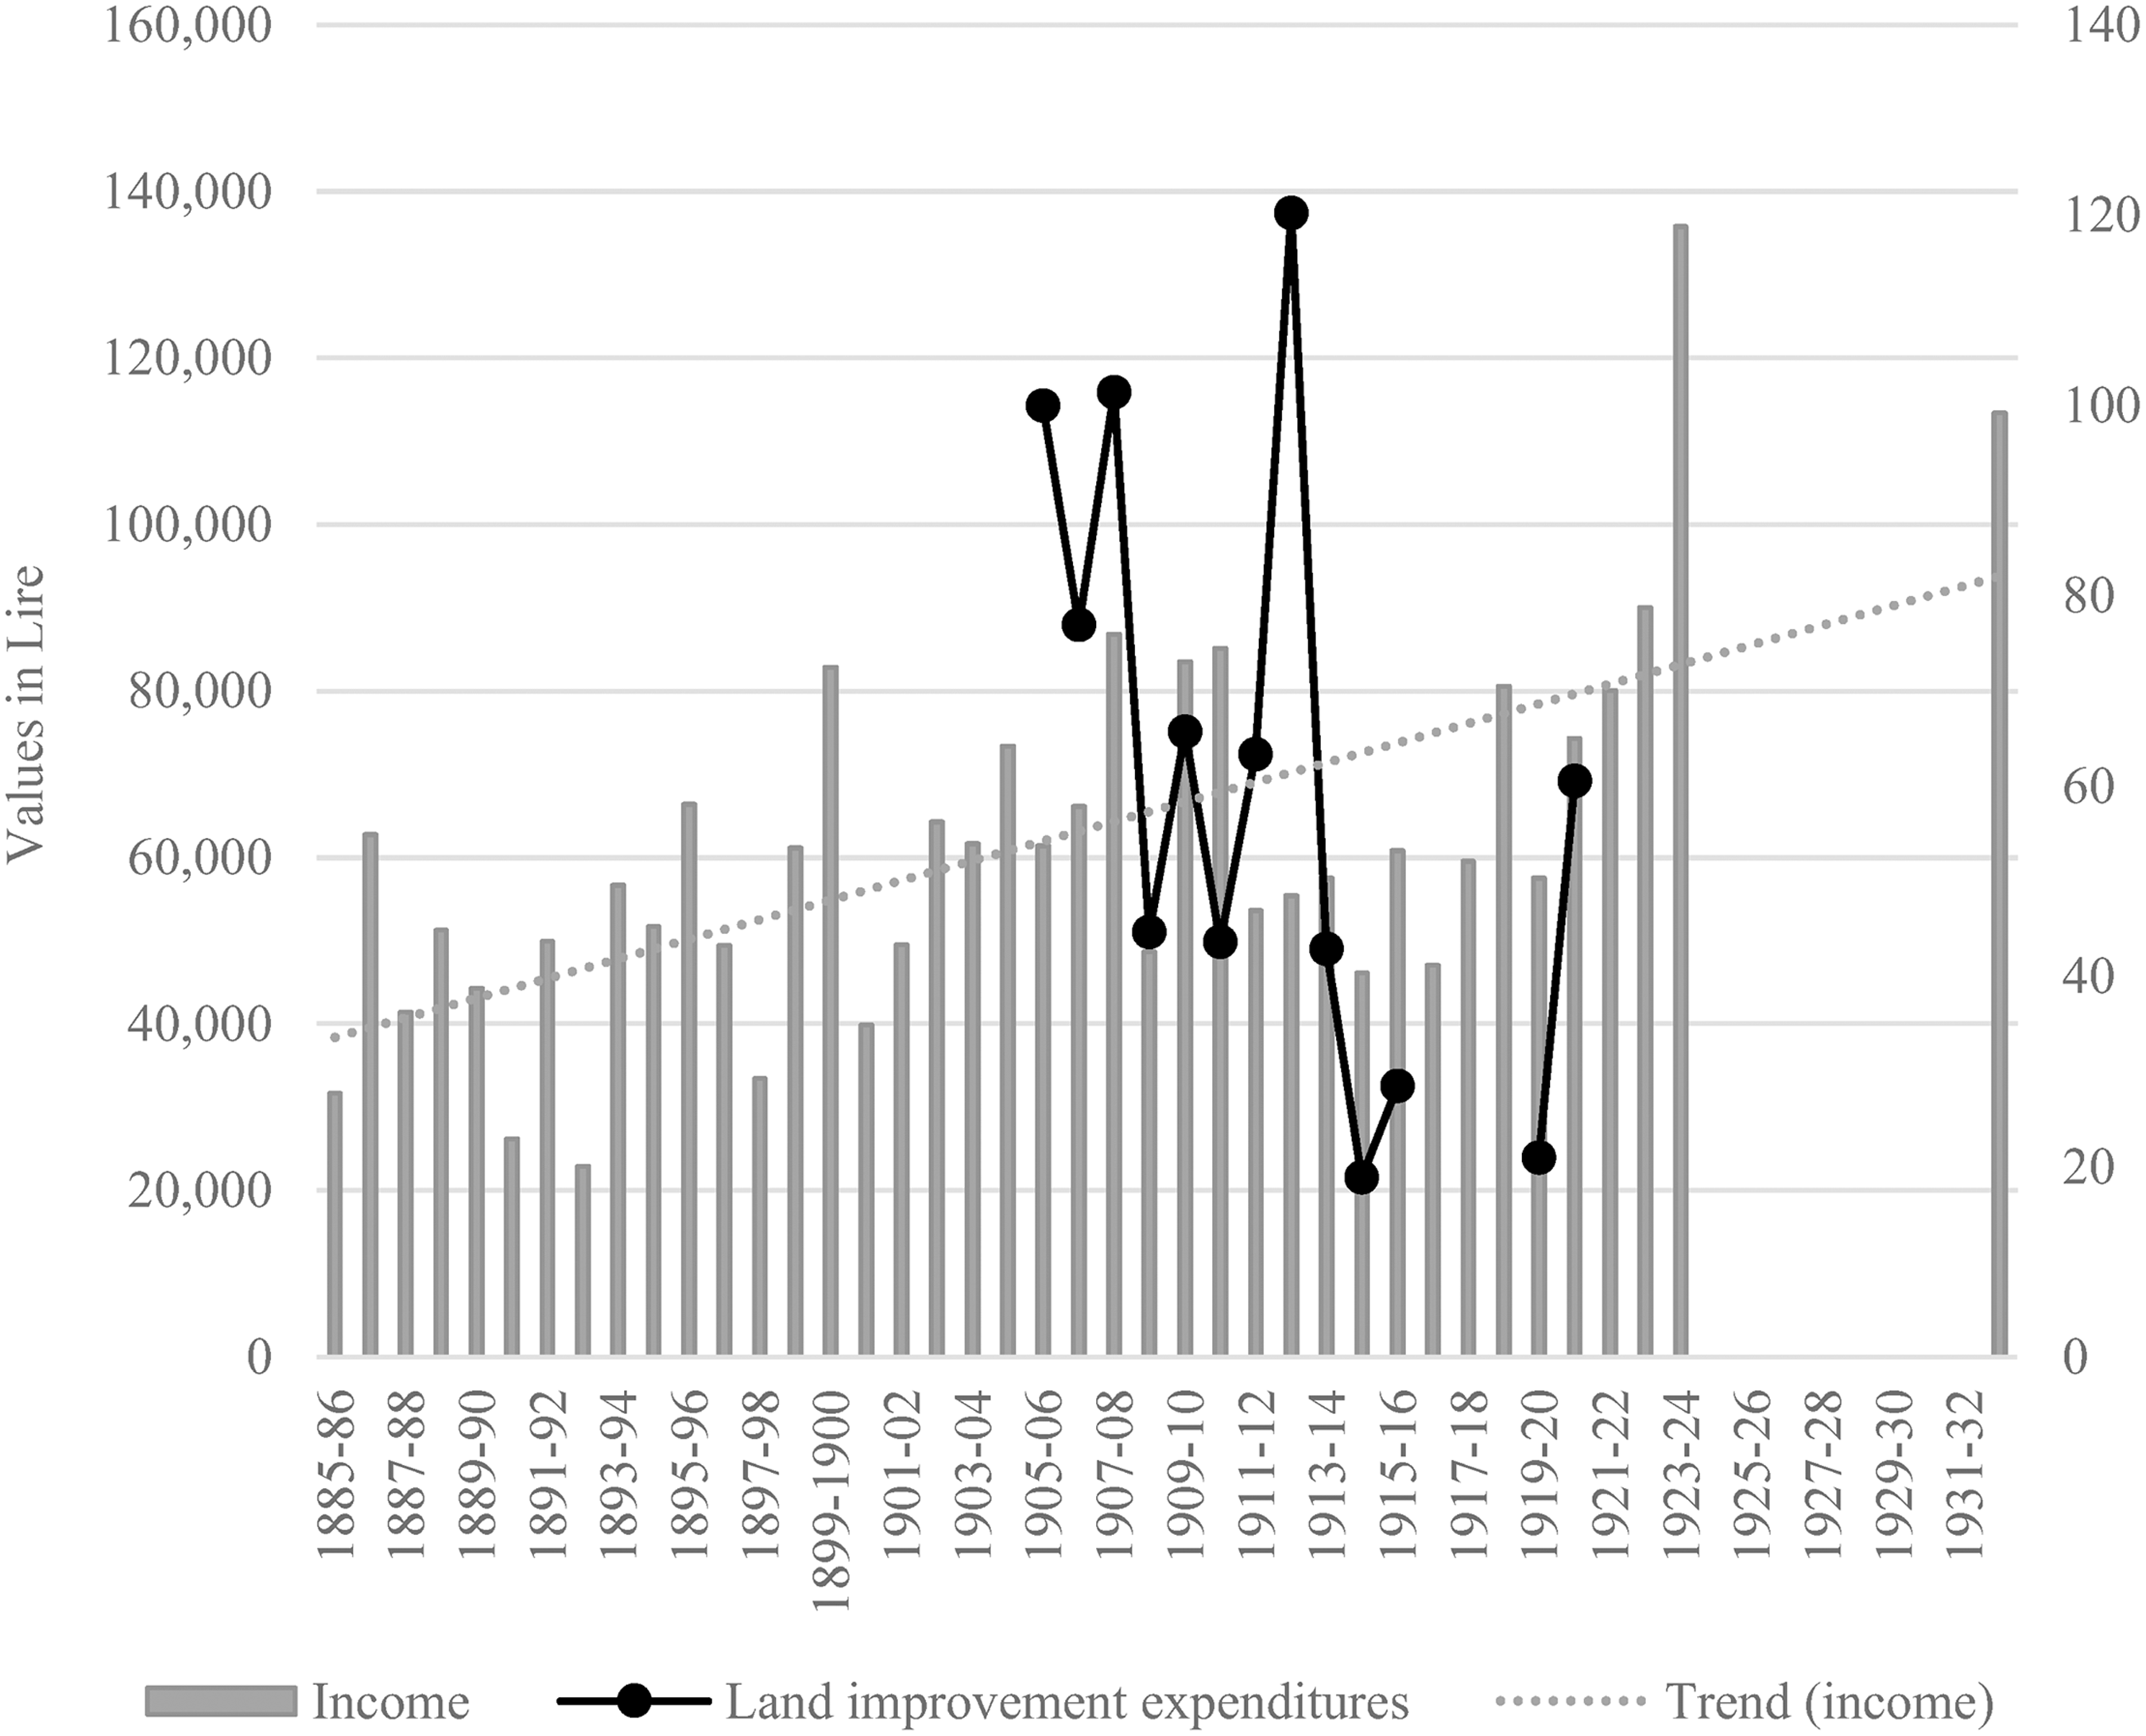
Graph 6. Long description
The bar graph compares income and land improvement expenditures over time. The x-axis represents the years from 1885 to 1932, while the y-axis on the left shows values in lire ranging from 0 to 160,000, and the y-axis on the right shows values ranging from 0 to 140. The graph features vertical bars representing income in grey and a line representing land improvement expenditures in black. A dotted line indicates the trend in income. Notable trends include fluctuations in land improvement expenditures and a general upward trend in income. The data points for land improvement expenditures show significant peaks and troughs, particularly around the years 1905 to 1921. All values are approximated.
Fattoria of Torrita: Tobacco sales (1900-1934).
Source: our elaboration from ASSi, Bargagli Petrucci. Amministrazione Agricola. Torrita, 158. Monetary values are real obtained through the Bank of Italy’s deflator (1938 = 1).

Graph 7. Long description
A line graph titled ‘Fattoria di Torrita. Production value of Tobacco (1900–1934).’ The x-axis represents the years from 1900 to 1934, and the y-axis represents the values in lire, ranging from 0 to 35,000. The graph shows fluctuations in the production value of tobacco over the years. The values start around 20,000 lire in 1900, rise and fall with notable peaks and troughs, reaching a high of approximately 30,000 lire around 1910, and then experiencing a significant drop to around 5,000 lire by 1918. After 1918, the values gradually increase again, with some fluctuations, reaching around 15,000 lire by 1934. All values are approximated.
Moreover, throughout the twentieth century landownership displayed particular interest in the Val di Chiana Reclamation Consortium, thereby confirming the interaction between sharecropping and institutions in processes of land transformation and soil conservation (ASSi, Bargagli Petrucci. Amministrazione Agricola. Torrita, 210). Archival documents show an enterprise’s intention to exploit soil protection and transformation processes as elements of agricultural development.
To test the spillover effects of sharecropping colonization policies on neighbouring territories, the trend in the value of the fattoria’s production of Poggio Santa Cecilia was reconstructed from the 1870s to the first decade of the twentieth century (Graph 8). The data highlight a strong capacity to respond to exogenous shocks (1880s) (Zanibelli, Reference Zanibelli2024) and, above all, a marked propensity for land improvement interventions, as well as for the introduction of innovations, such as the adoption of a threshing machine (ASSi, Tadini Buoninsegni. Amministrazione Agricola, Saldi).
Fattoria Poggio Santa Cecilia. Production value (1880 = 100) and percentage of land improvement expenditures (1874–1914).
Source: our elaboration based on data from ASSi, Tadini Buoninsegni. Amministrazione Agricola. Saldi, years 1874–1912. Monetary values are real obtained through the Bank of Italy’s deflator (1938 = 1).

Graph 8. Long description
The bar graph compares production value and percentage of land improvement expenditures from 1874 to 1914. The x-axis represents the years from 1874 to 1914, while the y-axis on the left represents the production value indexed to 1880 equals 100, and the y-axis on the right represents the percentage of land improvement expenditures. The graph features vertical bars indicating production value and a line graph showing the percentage of land improvement expenditures. A dotted line represents the trend in production value. Notable trends include fluctuations in production value and a general upward trend in land improvement expenditures over time. The data points show variations in both production value and expenditures, with some years experiencing significant changes. All values are approximated.
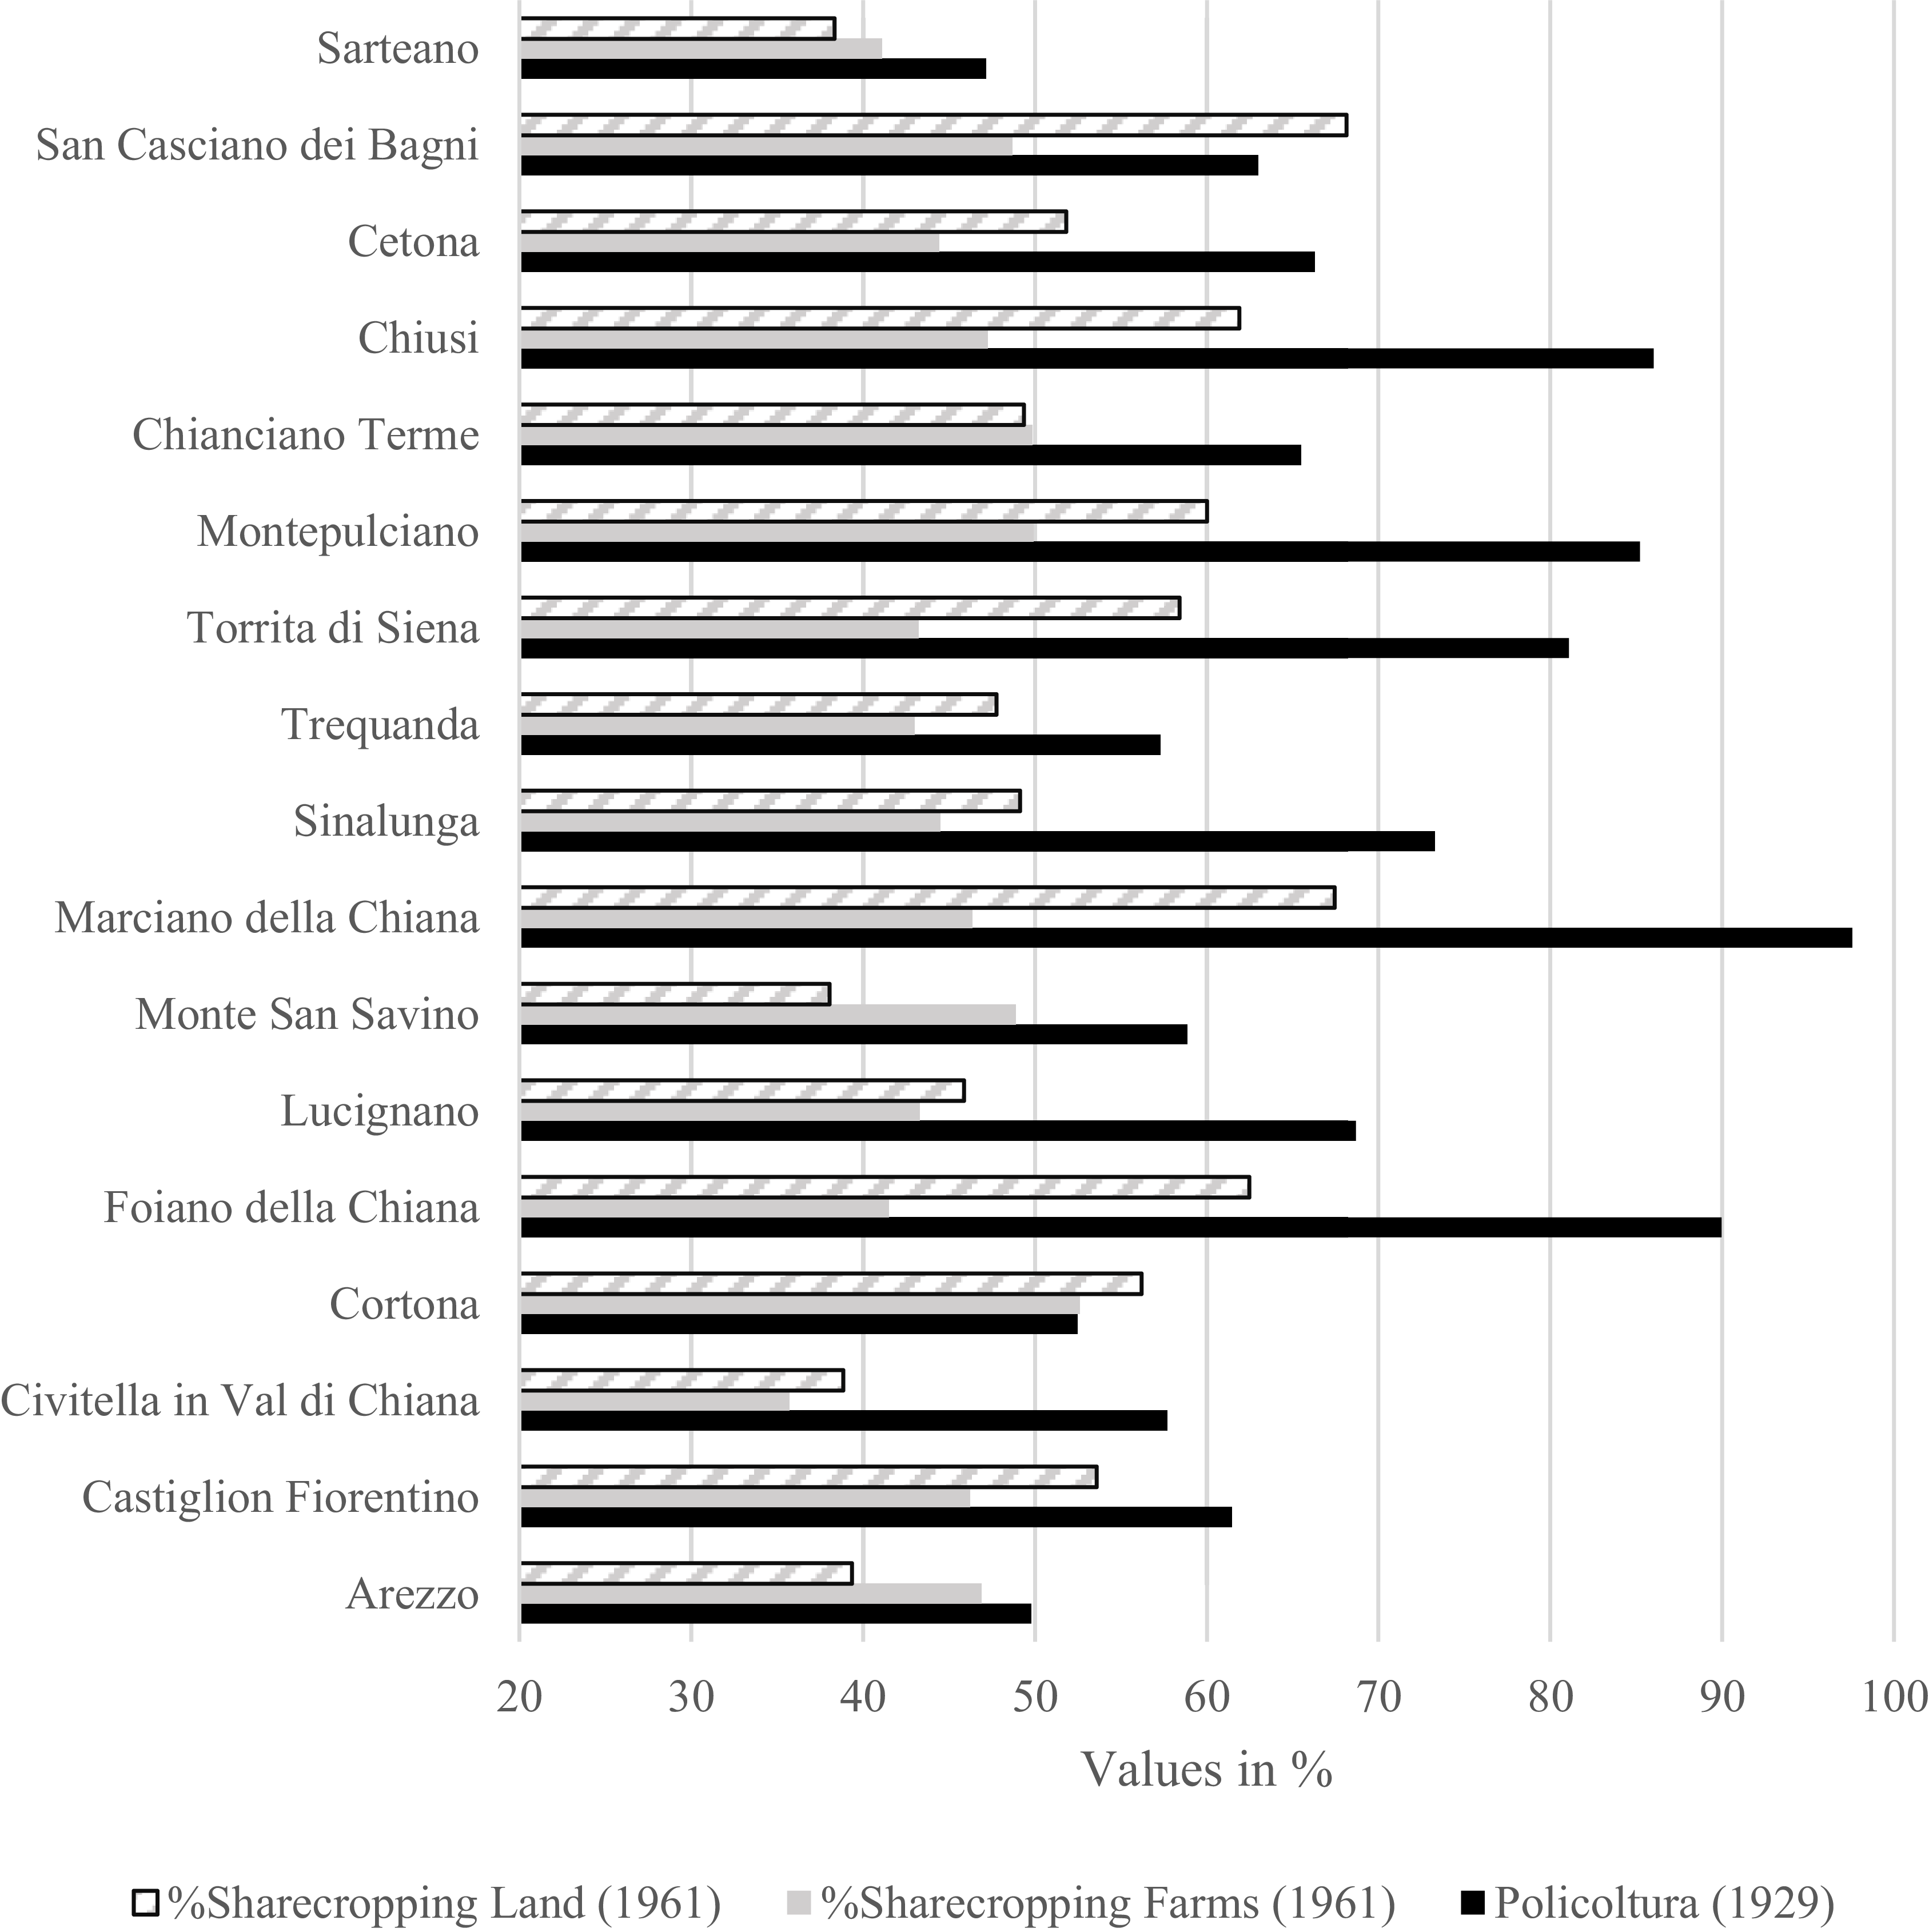
Although the fattoria analysis enabled answering research question number three (regarding the farm’s ability to carry out agricultural colonization). It is important to expand the scope of the investigation to strengthen the underlying hypothesis. Shifting the analysis to the territorial aggregate dimension (focusing on production factors), it can be observed how agricultural land (T) was organized with the simultaneous presence of cereals and plants (wine and oil). The values for the Val di Chiana, expressed as a percentage share of the total agricultural and forest area (Graph 9), show low variabilityFootnote 10 and are significantly higher (average 68%) than those of the macro-area comprising the territories of the provinces of Arezzo and Siena (50%). It clearly emerges that the highest values are distributed in the areas where land reclamation operations and the subsequent agricultural colonization through sharecropping were concentrated. This is also confirmed by the high percentage (provincial data) of land and sharecropping farms taken over in 1961 (Graph 2), the contract remained predominant for the area until the end of sharecropping.
Val di Chiana ‘Policoltura’ Area 1929 and percentage of sharecropping (farms and land) 1961.
Source: Own elaboration based on data from ISTAT, 1933, 1935, 1962a, 1962b.

Graph 9. Long description
The bar graph compares the percentage of sharecropping land, sharecropping farms, and policoltura in various locations in Val di Chiana. The graph features horizontal bars representing different locations such as San Casciano dei Bagni, Cetona, Chiusi, and others. The x-axis indicates values in percentage, ranging from 20 to 100. The y-axis lists the locations. The graph includes three data series: percentage of sharecropping land in 1961, percentage of sharecropping farms in 1961, and policoltura in 1929. Each series is represented by different colors: light gray for sharecropping land, dark gray for sharecropping farms, and black for policoltura. Notable trends include high percentages of policoltura in locations like Chiusi and Foiano della Chiana, while sharecropping land and farms show varied distributions across the locations. All values are approximated.
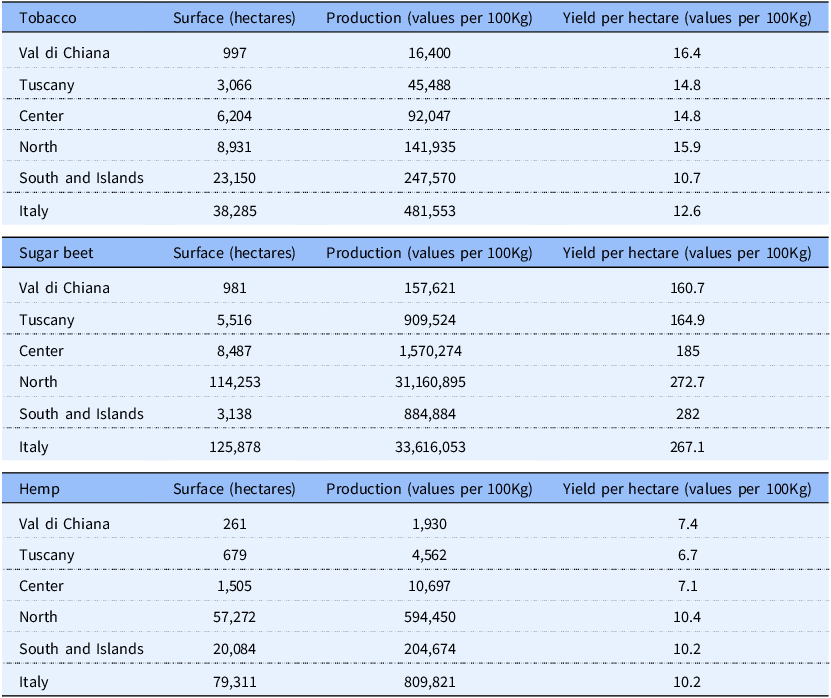
The analyses conducted showed that Val di Chiana played a national role in tobacco production (Table 1), covering 35% of the area of Tuscany and 16% of the other regions of Central Italy. Furthermore, the yield per hectare was almost equal to that of the North and significantly higher than the national average. This is an important figure that allows us to measure the capacity of sharecropping to transform the land, opening it up to other types of crops in addition to traditional ones. However, the area also showed a predisposition to other industrial crops such as hemp; sugar beet was also in line with the regional data.
Cultivated land, production, and productivity of industrial crops in Val di Chiana and in Italy 1929
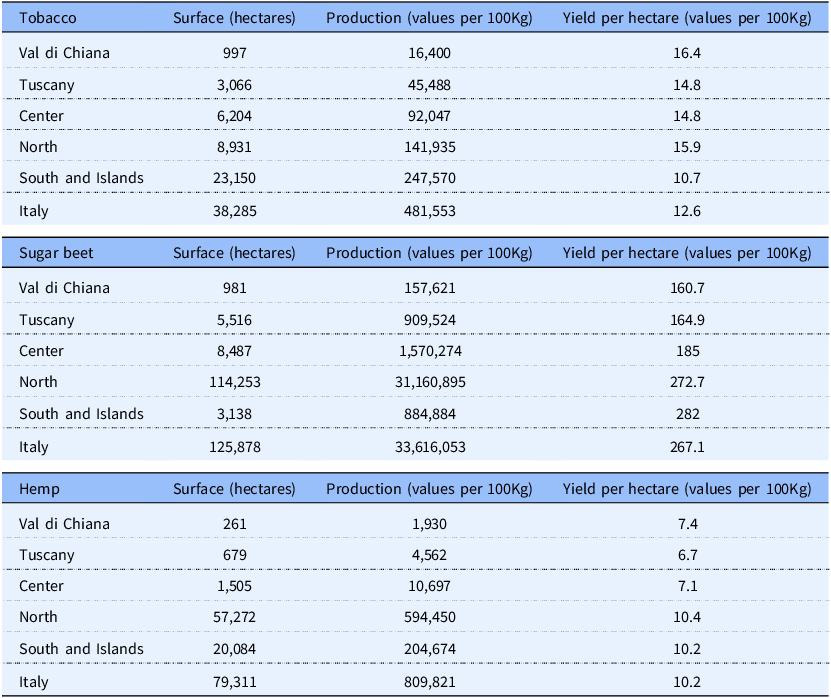
Table 1. Long description
The table presents data on the surface area, production, and yield per hectare of tobacco, sugar beet, and hemp in Val di Chiana and various regions of Italy in 1929. It includes three sections, each focusing on a different crop. For tobacco, the table shows surface area in hectares, production in values per 100 kilograms, and yield per hectare. Val di Chiana has 977 hectares with a production of 16,100 and a yield of 16.5. Tuscany has 3,066 hectares with a production of 45,488 and a yield of 14.8. The Center region has 6,204 hectares with a production of 92,047 and a yield of 14.8. The North region has 8,931 hectares with a production of 141,935 and a yield of 15.9. The South and Islands region has 23,150 hectares with a production of 247,570 and a yield of 10.7. Italy as a whole has 38,285 hectares with a production of 481,553 and a yield of 12.6. For sugar beet, Val di Chiana has 981 hectares with a production of 157,621 and a yield of 160.7. Tuscany has 5,516 hectares with a production of 879,920 and a yield of 159.5. The Center region has 8,487 hectares with a production of 1,570,274 and a yield of 185. The North region has 114,253 hectares with a production of 31,160,895 and a yield of 272.7. The South and Islands region has 3,138 hectares with a production of 884,884 and a yield of 282. Italy as a whole has 125,878 hectares with a production of 33,616,053 and a yield of 267.1. For hemp, Val di Chiana has 239 hectares with a production of 1,580 and a yield of 6.6. Tuscany has 679 hectares with a production of 4,562 and a yield of 6.7. The Center region has 1,505 hectares with a production of 10,697 and a yield of 7.1. The North region has 57,272 hectares with a production of 594,450 and a yield of 10.4. The South and Islands region has 20,084 hectares with a production of 204,674 and a yield of 10.2. Italy as a whole has 79,311 hectares with a production of 809,821 and a yield of 10.2.
Source: Own elaboration based on data from ISTAT, 1933, 1935, 1940.
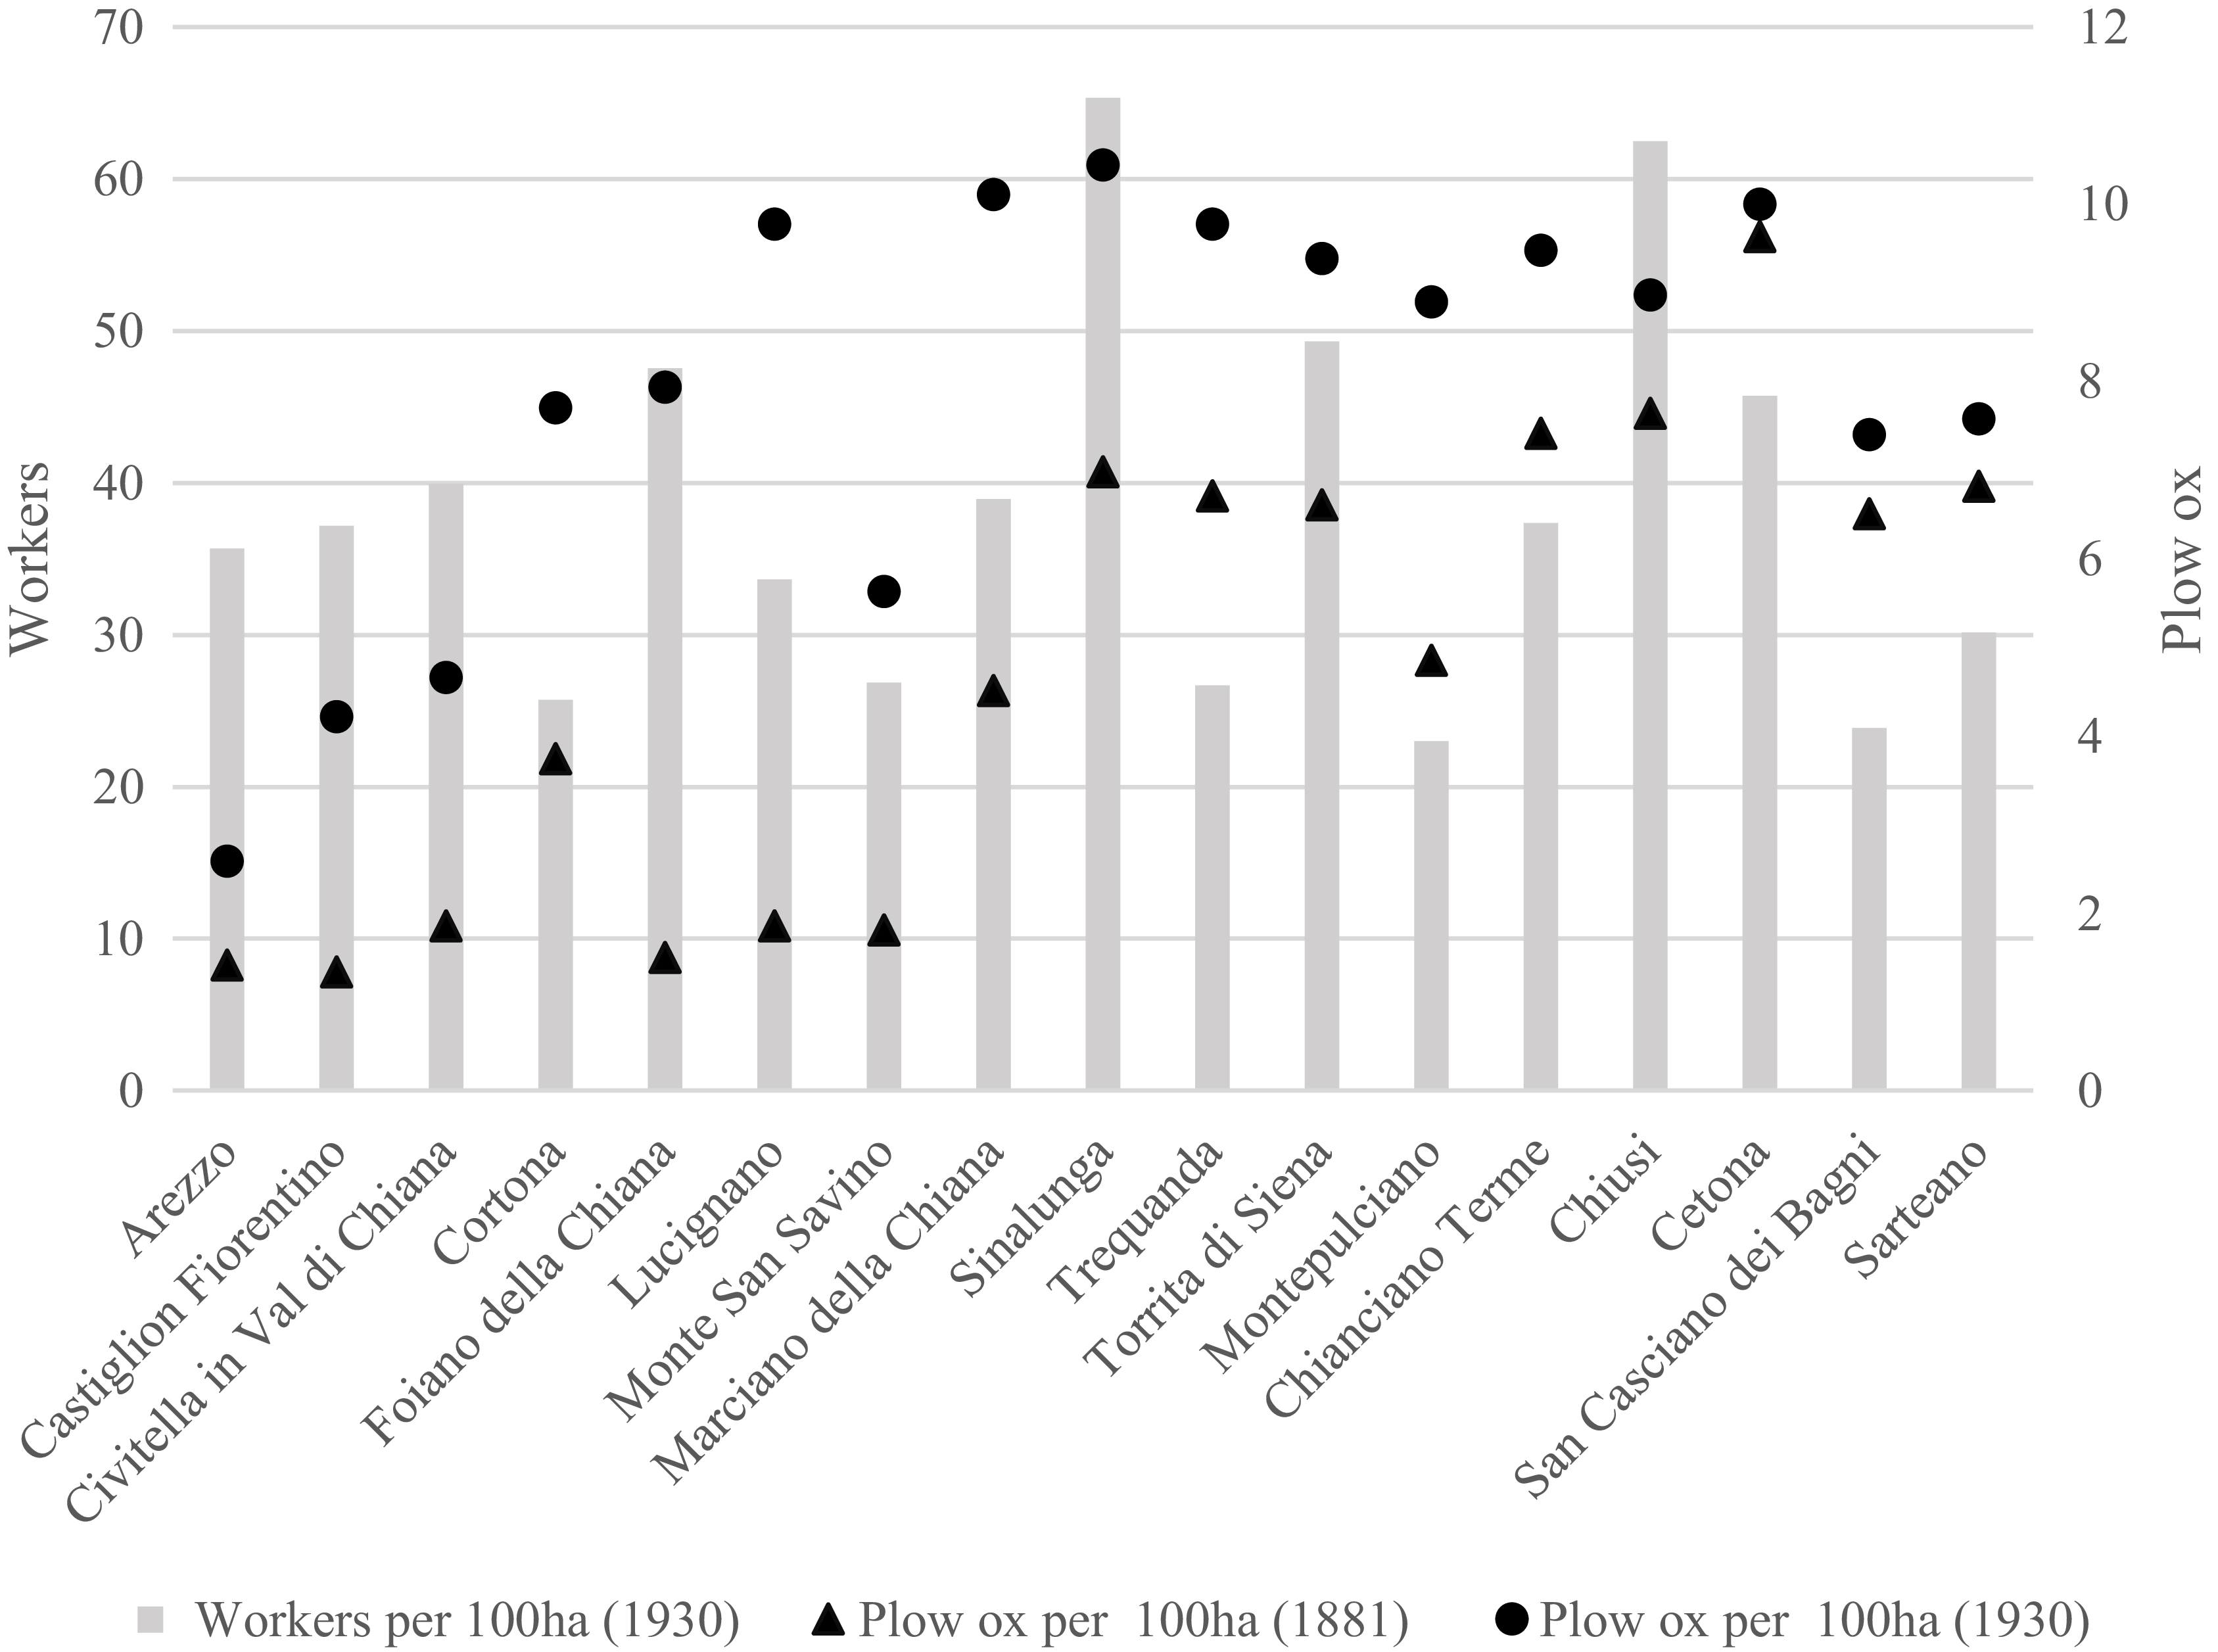
Focusing attention on labour (L), it is important to specify that the 1929 Catasto Agrario issues for the provinces of Arezzo and Siena belong to the first classification model and do not contain municipal data on the types of agricultural workers, which are only detectable in the second type (Zanibelli, Reference Zanibelli and Adorno2020).Footnote 11 Nonetheless, it is possible to identify the total number of agricultural workers, and by comparing this with the 1931 Population Census, it can be established that the majority of the area’s workers were sharecroppers. The number of workers per 100 hectares was reconstructed (Graph 10), and here too, a relatively homogeneous spatial distribution across the territory is observable (Standard Deviation 13; Coefficient of Variation 0.3), with a total value area (39) higher than that of the two provinces (28), confirming a significant presence of workers in the area. This can be attributed to the existence of large farms; the agricultural population lived in small production units (at least in the province of Siena) ranging from 10 to 25 hectares, a size which enabled efficient productive use (BCAS, various years).
Agricultural workers and oxen plowers for 100 hectares of agricultural and forestry area Val di Chiana from the second half of the nineteenth century to the thirties of the twentieth century.
Source: Own elaboration from ISTAT, 1933, 1935; MAIC, 1882, 1913.

Graph 10. Long description
The bar graph compares the number of agricultural workers and plow oxen per 100 hectares in various locations in the Val di Chiana region from the second half of the nineteenth century to the 1930s. The x-axis lists locations such as Arezzo, Castiglion Fiorentino, Civitella in Val di Chiana, Cortona, Foiano della Chiana, Lucignano, Monte San Savino, Marciano della Chiana, Sinalunga, Torrita di Siena, Montepulciano, Chianciano Terme, Chiusi, Cetona, and San Casciano dei Bagni. The y-axis on the left measures the number of workers, ranging from 0 to 70, while the y-axis on the right measures the number of plow oxen, ranging from 0 to 12. The graph includes three data series: gray bars representing workers per 100 hectares in 1931, black circles representing plow oxen per 100 hectares in 1881, and black triangles representing plow oxen per 100 hectares in 1930. Notable trends include a general decrease in the number of plow oxen from 1881 to 1930, while the number of workers varies across locations. All values are approximated.
Finally, the capital factor (C) was analysed by examining the only variable available at the municipal level from 1881 to 1961: working livestock (plough oxen); the indicator is also useful for labour factor analysis. To obtain a normalized value, the number of animals per 100 hectares was reconstructed (Graph 10). This figure is particularly significant because the area is renowned for its high-quality beef (the Chianina breed) and is therefore strongly oriented towards livestock farming, in particular in relation to land reclaimed for the creation of meadows in the big farms; the variable is also relevant for observing labour productivity. Almost 30% of the working livestock in the two provinces was found in Val di Chiana, with 8 plow oxen per 100 hectares, compared to 6 in the two provinces overall; this was also due to the presence of artificial meadows within the large farms (Luttazzi, Reference Luttazzi and Mirri1976). The distribution of the indicator shows a variability similar to that of workers.Footnote 12 This variable is important for the relationship between sharecroppers and the use of organic fertilizers (Begho et al., Reference Begho, Joshi, Nepal, Shrestha, Sharma and Eory2024). In the case of the province of Siena, there was nonetheless a good capacity to introduce this factor during the first half of the twentieth century, due to the presence of a major Agricultural Consortium aimed at promoting agricultural development (Bertini, Reference Bertini2001; Zanibelli, Reference Zanibelli2025).
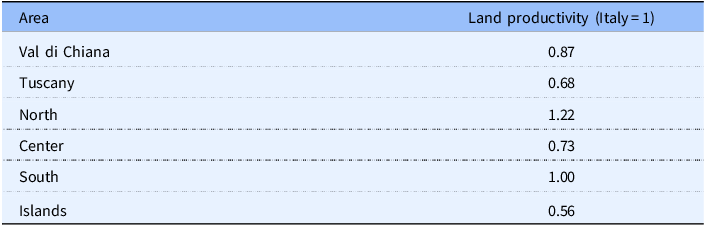
Total production was calculated by considering a wide basket of productsFootnote 13 to make a comparison of the value of land productivity (to also measure the impact of the other factors) between the Val di Chiana, Tuscany, and the large rational macro-areas, taking Italy as the basic valueFootnote 14 (Table 2). This indicator was adopted based on literature highlighting the importance of conducting broader analyses on total production (Federico, Reference Federico2009).
Land productivity. Val di Chiana, Tuscany, national macro-areas and Italy in the thirties of the twentieth century
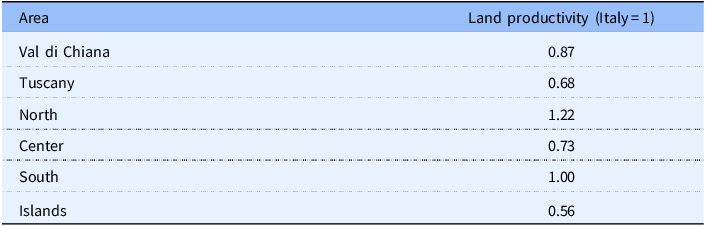
Source: Own elaboration from ISTAT, 1932, 1933, 1935, 1936.
The results (Table 2) show that Val di Chiana had particularly high levels of productivity even when compared with Tuscany and the Center, it ’s obviously not at the same level as the north of the country, the type of soil and the availability of certain factors must also be taken into account.Footnote 15 This is in line with what has been observed at the farm level and highlights the ability of Tuscan sharecropping to respond to macroeconomic changes and, at the same time, its propensity to introduce innovations in cultivation that can coexist with the polycolture system.
Analysis of the results
This section discusses the results presented in the previous parts in order to address the three research questions outlined in the introduction. These are as follows: (1) the capacity of pre-unification Tuscan institutions to promote development models consistent with the socio-economic needs of local territories; (2) the role of sharecropping, organized within the fattoria system, as an institution and as a tool of agrarian colonization; and (3) the long-term effects of this model on cropping patterns and factor productivity.
This study shows that the Val di Chiana can be identified as a case of long-term agrarian colonization capable of fostering land reclamation and spatial reorganization processes. The distinctive feature of the Tuscan case lies in the fact that this process did not take the form of small peasant landownership settlement. Instead, it developed through the large agrarian estate model, specifically the sharecropping fattoria, in this specific case, sharecropping assumed a distinctive connotation compared to other Italian experiences (Protasi and Sonnino, Reference Protasi and Sonnino2003); it was the keystone on which the land reclamation process developed. This specificity introduces new elements into the debate on land reclamation, particularly with regard to soil organization, population distribution, and labour organization, and allows the Tuscan case to be placed within a broader discussion of the capacity of sharecropping to foster agrarian transformations capable of producing long-term outcomes (Novello, Reference Novello2025).
The findings further demonstrate that pre-unification Tuscan institutions played an active and sustained role in land reclamation by promoting a coherent territorial reorganization project capable of generating profits through an interaction between tradition and innovation. The Val di Chiana operation should therefore be interpreted as an integral part of a broader process of productive development based on public–private integration, which not only reshaped the territory but also initiated a trajectory of growth in the primary sector. These trajectories can be analyzed in the context of subsequent diffused industrialization (Moroni, Reference Moroni2004). From this perspective, it is also interesting to study the evolution of industrial districts (Becattini, Reference Becattini, Pyke, Becattini and Sengenberger1991). Within this perspective, the fattoria played a key role and should also be understood as a ‘hub’ for the development of skills and techniques that, after World War II, facilitated the reallocation of former sharecroppers into the industrial sector. This interpretation is supported by the fact that the Sinalunga area is today officially classified as an industrial district of the Tuscany region.
The main and most innovative contribution of this study concerns the integrated role of sharecropping as both an institution and an instrument of agrarian colonization. It emerged that Mezzadria in the Val di Chiana functioned as an institution in which formal rules (contracts and regulated sharing arrangements) and informal ones (the transmission of knowledge and managerial strategies), concentrated within the farm, played an essential role in land reclamation and agrarian colonization.
In addition, the structure of the sharecropping contract favoured a stable presence in the territory while also ensuring a form of long-term conservation. This is clearly reflected in the rationalization of labour distribution across space: the gradual transition from mezzaiolo (primarily engaged in land reclamation work) to mezzadro (a farmer permanently rooted in the territory) reveals an advanced, stage-based planning of both spatial and work organization and a process of growth in the specialization of the labour factor, too.
An analysis of the fattoria system reveals three fundamental aspects. First, the maintenance and implementation of land reclamation works were carried out at both the institutional and the farm levels. The attention that fattorie devoted to land improvements confirms the central role of sharecropping in reclamation processes and in the preservation of hydraulic and land infrastructures. Moreover, archival sources (ASSi, Gabinetto di Prefettura, 44; ASSi, Bargagli Petrucci, Agricultural Administration, Torrita, 210; ASSi, Gori Pannilini. Elenco di consistenza. Belsedere, 12) are in line with the evidence emerging from official Fascist-era statistical sources regarding territorial interventions. Second, the fattoria system proved capable of organizing agrarian space by integrating polyculture with the introduction of new industrial crops such as tobacco, sugar beets, and hemp.
Third, there was a close integration between production and environmental management. This element is crucial in confirming the role of sharecropping as an institution of agrarian colonization. This highlights a divergence in investment propensity between Tuscan landowners and those in other context, such as Greece (Petmezas, Reference Petmezas, Lains and and Pinilla2009).
Finally, the analysis of production and rent challenges a negative and ‘feudal’ interpretation of sharecropping, showing it to be partial and overly simplistic. These results are supported by a comparison of municipal and national data, which showed good performance across the entire Val di Chiana area. The rediscovery of farm accounting (Galassi, Reference Galassi1986; Biagioli, Reference Biagioli2000; Zanibelli, Reference Zanibelli2024) is essential for measuring the performance of the fattoria system and its ability (1) to respond to macroeconomic change and (2) to sustain processes of land improvement and transformation while achieving solid economic performance. This is clearly demonstrated by the case studies of the Torrita and Poggio Santa Cecilia fattorie, which confirm earlier findings regarding the capacity of sharecropping to adapt to macroeconomic shifts and to introduce forms of sectoral strengthening within the farm. When the analysis is extended to land productivity, the results are consistent with critical revisions (Galassi, Reference Galassi1986; Cohen and Galassi, Reference Cohen and Galassi1990; Emigh, Reference Emigh1999; Zanibelli, Reference Zanibelli2024, Reference Zanibelli2025) of traditional critiques of sharecropping (Sereni, Reference Sereni1947; Marshall, Reference Marshall1920; Pazzagli, Reference Pazzagli1973; Giorgetti, Reference Giorgetti1974). However, a difference emerged compared to the findings of Cohen and Galassi (Reference Cohen and Galassi1990). Nevertheless, this reinforces the importance of their final questions. A high productivity index per hectare supports the thesis that Tuscan sharecropping was an institution and instrument of colonization that improved the primary sector.
Conclusions
This article has examined the role of sharecropping as an institution and as a tool of agrarian colonization, focusing on the Val di Chiana area through a diachronic research perspective. The findings, based on the integrated use of archival documents and statistical sources, reveal a strong synergy between institutions and private actors in initiatives aimed at redefining productive space. From this perspective, the Val di Chiana ‘laboratory’ brings to light an enduring territorial planning strategy that aligns with global processes of agrarian transformation. The combined use of sources has made it possible to reconstruct a model of agrarian spatial reorganization, identify farm-level strategies aimed at improving production, trace the introduction of new crops, and assess the capacity to respond to exogenous shocks even under conditions of concentrated landownership.
This study is positioned within the broader historiographical debate on internal colonization, which is understood as a process of agrarian transformation in marginal or unhealthy areas (Protasi and Sonnino, Reference Protasi and Sonnino2003; Jacobsson, Reference Jacobsson2024; Novello, Reference Novello2025). The findings reveal that the Tuscan case offers a substantial contribution to the European debate to agrarian transformation. Indeed, sharecropping, understood in its broader sense as an institution rather than merely a contractual arrangement, proved capable of promoting, planning, and developing processes of land improvement through specific farm-level dynamics and strategies.
These findings offer new insights into the historiographical debate on sharecropping. The prevailing interpretive tradition, initiated by Alfred Marshall (Reference Marshall1920) and further elaborated in the context of Italian historiography (Sereni, Reference Sereni1947; Pazzagli, Reference Pazzagli1973; Giorgetti, Reference Giorgetti1974), has historically characterized sharecropping as a feudal relic, hindering agricultural modernization. This perspective has obscured the capacity of sharecropping to adapt to broader macro-level changes and to catalyse processes of economic transformation. However, more recent scholarship, while revising earlier critiques of inefficiency (Cohen and Galassi, Reference Cohen and Galassi1990), has predominantly analysed sharecropping in contractual terms and in relation to farm-level efficiency (Galassi, Reference Galassi1986; Biagioli, Reference Biagioli2000; Zanibelli, Reference Zanibelli2024).
The case of the Val di Chiana has contributed to broadening this analytical perspective by integrating farm-level evidence with a territorial approach (Zanibelli, Reference Zanibelli2025). This approach enables the conceptualization of sharecropping as a territorial institution, endowed with its own economic, political, social, and customary characteristics. This methodological approach demonstrates that sharecropping did not act as an obstacle on agrarian transformation; rather, it constituted the very mechanism through which such processes unfolded, giving rise to a distinct model of agrarian colonization. The experience of the Val di Chiana demonstrates that sharecropping supported development trajectories that were alternative to those based on small peasant ownership or other forms of colonization. In this context, the estate (fattoria) played a key role in territorial governance. Consequently, mezzadria emerges as an institutional model. This phenomenon contributed to the emergence of a social and economic structure capable of articulating its own response to the macroeconomic changes that took place between the nineteenth and twentieth centuries, including the emergence of industrial districts. From this perspective, this research opens new lines of investigation, including comparative and aggregated studies across different areas of the Italian Peninsula or Europe, on the role of agrarian contracts in land reclamation initiatives and in the transformation of the primary sector between the early modern and contemporary periods.


 Open access

