





1. Introduction
Turbulent, inertial particle-laden flows are ubiquitous in natural and engineering environments (Balmforth & Provenzale Reference Balmforth and Provenzale2001). Aerosols in clouds (Shaw Reference Shaw2003), particle-driven gravity currents (Necker et al. Reference Necker, Härtel, Kleiser and Meiburg2005), sediments in oceans or rivers (Hargrave Reference Hargrave1985), sand storms in the atmosphere (Voilland Reference Voilland2018) as well as fluidisation of pipe or open-channel flows in industrial processes (Lashgari et al. Reference Lashgari, Picano, Breugem and Brandt2014) are just a few examples among many. Owing to the high practical interest, investigation of these problems has increased in the last decade, especially thanks to the massive improvements achieved in terms of measurement and simulation performance. There are many aspects that make this topic an extraordinary challenge: the different properties of both particles and the carrier fluid, the multi-way coupling between continuous and dispersed phases, and the relevant difference in spatial and time scales (Toschi & Bodenschatz Reference Toschi and Bodenschatz2009; Brandt & Coletti Reference Brandt and Coletti2022). The interaction between the two phases can affect the flow both at large and small scales depending on factors such as particle shape, size and volume/mass fraction. Depending on their relative size to the viscous scale, heavy particles can attenuate or enhance turbulence (Yu et al. Reference Yu, Xia, Guo and Lin2021), in contrast to small, settling particles which always lead to turbulence damping (Zhao, Andersson & Gillissen Reference Zhao, Andersson and Gillissen2010). Moreover, particles of greater mass density than the surrounding fluid can detach from the flow, leading to preferential sampling, small-scale fractal clustering and significant relative velocities (Bec, Gustavsson & Mehlig Reference Bec, Gustavsson and Mehlig2024).
In recent years, studies have predominantly focused on particles with vanishing inertia (behaving as passive tracers) or highly symmetric shapes such as spheres or ellipsoids (Shaw Reference Shaw2003; Voilland Reference Voilland2018; Sozza et al. Reference Sozza, Cencini, Musacchio and Boffetta2022). However, investigations into anisotropic particles have gained traction only recently. Elastic fibres, for instance, induce similar turbulence damping as spheres but can also modify the energy scale-by-scale distribution (Dotto & Marchioli Reference Dotto and Marchioli2019; Di Giusto & Marchioli Reference Di Giusto and Marchioli2022; Olivieri, Cannon & Rosti Reference Olivieri, Cannon and Rosti2022). Inertial rods also possess the potential to influence turbulence-regeneration mechanisms, with rigid, inertia-less fibres generating additional stresses that dampen counter-rotating vortices in the wall region, leading to drag reduction. Inertial fibres may preferentially segregate into low-speed streaks, thereby delaying fluid flow (Voth & Soldati Reference Voth and Soldati2017).
Despite the abundance of literature in this field, most studies have focused on isotropic or highly symmetric particle shapes (Brandt & Coletti Reference Brandt and Coletti2022), overlooking a significant portion of the parameter space concerning strongly asymmetric large particles in turbulence (Voth & Soldati Reference Voth and Soldati2017). The present paper is a first attempt aimed at filling this gap. Among several possibilities, we have considered chiral particles which are distinct from their mirror image (Roos & Roos Reference Roos and Roos2015). We have chosen chiral particles because they break spatial reflection symmetry and couple translational and rotational degrees of freedom. A particle forced to translate in a fluid will also rotate and vice versa; this feature is also present in nature and can be appreciated by watching the falling of maple seeds. Indeed, there are multiple examples of chiral objects in nature and technology. Most of flagella of bacteria and micro-organisms are chiral, but also propellers and impellers in mixers and industrial plants. Chan et al. (Reference Chan, Wu, Qiao, Fong, Yang, Han and Zhang2024) provides evidence that in nature there are more chiral objects than non-chiral ones. We wish to point out however that our study is not focused on applications but rather on the effect of chiral objects on homogenous isotropic turbulence.
Questions we ask are as follows. How do chiral particles behave in a turbulent flow? Are they able to modify some features of turbulence? What is the influence of parameters like solid-to-fluid density ratio, turbulence strength and solid phase volume fraction?
The paper is organised as follows. In § 2, we outline the numerical model and the set-up of the simulations. The findings are discussed in § 3, and the complex interplay between particle and flow dynamics is illustrated by taking into account the effect of multiple parameters separately. Closing remarks and an outlook are given in § 4. The paper is completed with additional material in Appendices A–C.
2. Problem and methods
2.1. Set-up
We consider a three-periodic cubic domain filled with a Newtonian fluid of density  $\rho _f$ laden by $N_p$ identical chiral particles of density $\rho _p$. Each particle is made of three perpendicular cylinders, arranged as in figure 1(a), with the ends rounded by spherical caps. Let $V_p$ be the volume of the particle and $D_{eq}$ the diameter of the equivalent sphere (volume wise) which is assumed as unit length throughout the paper. The particle can be then enclosed in a cubic bounding box of edges $\ell _x=\ell _y=\ell _z=1.5 D_{eq}$ while the diameter of the cylindrical legs is $d \simeq 0.42 D_{eq}$. The particle is convex, as its centroid falls outside its volume, with coordinates $G=(0.75,0.42,1.08)$ in $D_{eq}$ units measured from the origin $O$. The asymmetric shape implies principal axes not aligned with any particle legs yielding for their unit vectors $\hat {\boldsymbol {x}}_p=(-0.774,0.447,0.447)$, $\hat {\boldsymbol {y}}_p=(0.000,-0.707,0.707)$ and $\hat {\boldsymbol {z}}_p=(-0.633,-0.548,-0.548)$, and for the principal moments of inertia $I_{xp}=0.076$, $I_{yp}=0.226$ and $I_{zp}=0.248$ in $\rho _p D_{eq}^5$ units. It is worthwhile pointing out that the present particles are equivalent to a sphere of diameter $D_{eq}$ only volume wise; in fact, the wetted surface of the former is approximately $50\,\%$ bigger than the equivalent sphere while the encumbrance of the bounding box is ${\approx }3.4$ times that of a cube enclosing the sphere. These differences are relevant for the particle/particle and particle/fluid interaction as will be discussed in § 3.
(a) Representation of a chiral particle with global (red), body centroid (black) and principal inertia (green) reference frames. The green bullet (G) outside the particle is its centre of mass. (b) Perspective view of the system with randomly distributed particles in homogeneous isotropic turbulence for  $Re_\lambda =75$, volume fraction $\phi =1\,\%$ and density ratio $\rho _p/\rho _f=2$. Colours of the background are non-dimensional vorticity magnitude contours ranging from $0$ (blue) to $20$ (yellow).
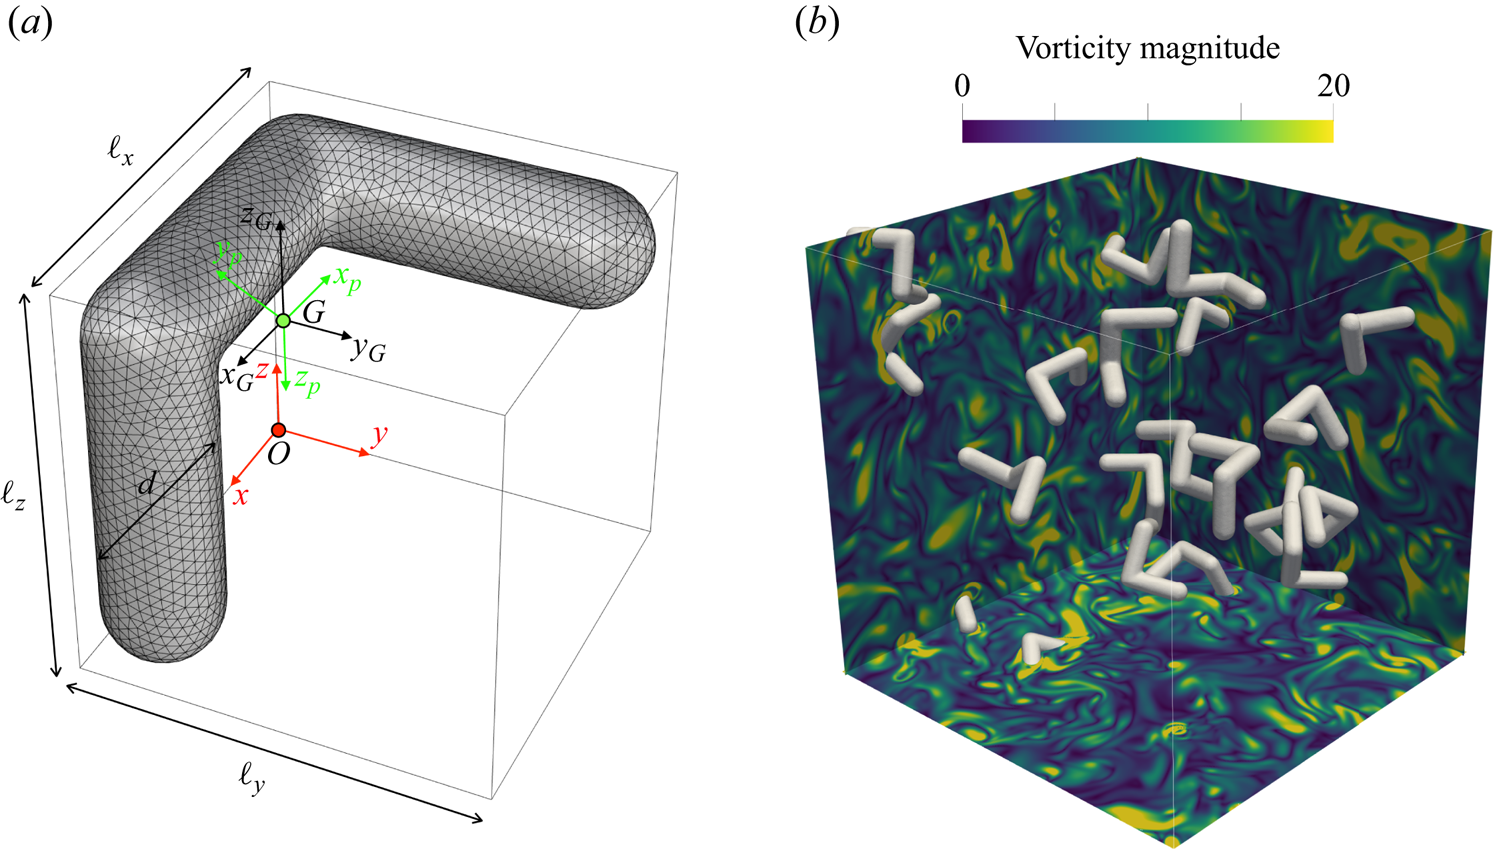
The flow domain is cubic with edges of length  $L_x=L_y=L_z=10 D_{eq}$ in each direction and a constant gravitational acceleration $\boldsymbol {g}$ anti-parallel to the $z$ direction. Particles are initially distributed randomly, both in position and orientation, within the computational domain, the only constraint being that they cannot intersect spatially: a schematic of the system is shown in figure 1(b).
After an initial transient, the system attains a statistical steady state over which data are collected for the analysis; depending on the problem parameters, statistic convergence is achieved for different time windows. We define the large-eddy-turnover time  $T_e=u_{rms}^2/\varepsilon$ with the velocity fluctuations $u_{rms}$ and the kinetic energy dissipation rate $\varepsilon$ of the turbulent flow, and the ‘observation time’ $T_o$ the integration time window (in $D_{eq}/U$ units, $U$ being the flow velocity scale): simulations of homogeneous isotropic turbulence (HIT) without particles have been run for $33 \leq T_o/T_e \leq 10^3$, while for the simulations with a single particle, we had $510 \leq T_o/T_e \leq 860$. Finally, the cases with $N_p=20$ particles have been integrated for $75 \leq T_o/T_e \leq 840$. For each simulation, the duration of the integration has been decided by monitoring the quantities of interest and verifying that their values did not change appreciably during the final part of the simulation.
Before concluding this section, we wish to point out that in some studies dealing with settling particles in turbulence (see for example Chouippe & Uhlmann Reference Chouippe and Uhlmann2015), an elongated domain in the direction of gravity has been employed to avoid possible correlation effects produced by the preferential velocity direction. In this study, we have preliminarily verified that, at least for the flow quantities considered in the present analysis, the differences in the results obtained in a cubic and in an elongated domain are negligible; selected results from these tests are given in Appendix C.
2.2. Carrier phase
The governing relations for the fluid phase are the incompressible Navier–Stokes equations and the continuity equation which, in non-dimensional form, read
 \begin{equation} \frac{\partial\boldsymbol{u}}{\partial t} + (\boldsymbol{u}\boldsymbol{\cdot}\boldsymbol{\nabla}) \boldsymbol{u} ={-}\boldsymbol{\nabla} p +\frac{1}{Re}\nabla^2 \boldsymbol{u} + \mathbf{f},\quad \boldsymbol{\nabla} \boldsymbol{\cdot} \boldsymbol{u} = 0.\end{equation}
Here,  $\boldsymbol {u}$ and $p$ are fluid velocity vector and kinematic pressure, respectively, while $Re=D_{eq}U/\nu$ is the Reynolds number based on the length $D_{eq}$ and the flow velocity $U$ scales. The last term in the first of (2.1a,b) is a vector containing two volume forces $\mathbf{f}=\boldsymbol{f}_{T}+\boldsymbol{f}_{P}$: $\boldsymbol{f}_{T}$ sustains the HIT flow while $\boldsymbol{f}_{P}$ is the immersed boundary method (IBM) forcing which accounts for the presence of solid particles and allows for the two-way coupling between solid and fluid phases.
We numerically solve the governing equations (2.1a,b) with our in-house advanced finite-difference code (‘AFiD’), which is extensively described and validated in van der Poel et al. (Reference van der Poel, Ostilla-Mónico, Donners and Verzicco2015) and Spandan et al. (Reference Spandan, Putt, Ostilla-Mónico and Lee2020). The main features are: spatial derivatives are approximated by conservative, second-order accurate finite-differences discretised on a staggered mesh which is uniform and homogeneous ( $\Delta x = \Delta y = \Delta z=\varDelta$). A combination of Crank–Nicolson and low-storage third-order Runge–Kutta schemes is used to integrate the viscous terms implicitly and all other terms explicitly. Finally, pressure and momentum are strongly coupled through a fractional-step method as described by Rai & Moin (Reference Rai and Moin1991) and Verzicco & Orlandi (Reference Verzicco and Orlandi1996).
2.3. Homogeneous isotropic turbulence forcing method
The HIT forcing  $\,\boldsymbol{f}_{T}$ is prescribed, similarly to Chouippe & Uhlmann (Reference Chouippe and Uhlmann2015), adopting the method introduced by Eswaran & Pope (Reference Eswaran and Pope1988). It allows to attain a statistically stationary velocity field by forcing large scale (small wavenumber) components. This is achieved through a random Uhlenbeck–Ornstein process via a vector $\boldsymbol{\hat {b}}(\boldsymbol{k},t)$ whose components are prescribed in time according to
 \begin{equation} \hat{b}_i(\boldsymbol{k},t+\Delta t)=\hat{b}_i(\boldsymbol{k},t) \left( 1-\frac{\Delta t}{T_L}\right)+e_i(\boldsymbol{k},t) \left( 2\sigma^2 \frac{\Delta t}{T_L}\right)^{{1}/{2}},\quad i=1,2,3. \end{equation}
Here,  $\boldsymbol{k}=(l,m,n)$ is the wavenumber vector, $\Delta t$ the numerical integration time step and $e_i(\boldsymbol{k},t)$ a complex random number drawn from a standardised Gaussian distribution, and $T_L$ and $\sigma ^2$ are time scale and variance of the random process.
The forcing term  $\boldsymbol{\hat {f}}_{T}(\boldsymbol{k},t)$, in Fourier space, is non-zero only in the band $|\boldsymbol{k}| \leq k_f=2.3$ and the final forcing is obtained by an orthogonal projection of $\boldsymbol{\hat {b}}(\boldsymbol{k},t)$:
 \begin{equation} \boldsymbol{\hat{f}}_{T}(\boldsymbol{k},t)=\boldsymbol{\hat{b}}(\boldsymbol{k},t)-\boldsymbol{k}(\boldsymbol{k}\boldsymbol{\cdot} \boldsymbol{\hat{b}}(\boldsymbol{k},t+\Delta t))/(\boldsymbol{k}\boldsymbol{\cdot}\boldsymbol{k}), \end{equation}
which is needed to ensure the divergence-free condition. More details about the HIT forcing can be found from Eswaran & Pope (Reference Eswaran and Pope1988) and Chouippe & Uhlmann (Reference Chouippe and Uhlmann2015).
Note that (2.3) defines the forcing in Fourier space while (2.1a,b) are solved in the physical space. Therefore, the former expression must be transformed into values to be prescribed at the Eulerian grid points. To determine the field in physical space  $\boldsymbol{f}_{T}(\boldsymbol{x},t)$, we compute the Fourier coefficients from (2.3), with $\boldsymbol{\hat {f}}_{lmn}(t)=\boldsymbol{\hat {f}}(l,m,n,t)$, from which the value at the discrete position $\boldsymbol{x}_{i,j,k}=(i\varDelta,j\varDelta,k\varDelta )$ is obtained by
 \begin{equation} \boldsymbol{f}_{T}(\boldsymbol{x}_{ijk},t)=\sum_{l={-}N_f}^{N_f} \sum_{m={-}N_f}^{N_f} \sum_{n={-}N_f}^{N_f} \boldsymbol{\hat{f}}_{lmn}(t) \exp(\j \boldsymbol{k}\boldsymbol{\cdot}\boldsymbol{x}_{i,j,k})\quad \forall\ i,j,k, \end{equation}
where  $N^3_f=27$ is the number of forced wavenumbers and $\j$ the imaginary unit.
The HIT forcing and additional simulation parameters are reported in table 1 where it is also shown that the spatial resolution is always smaller than the Kolmogorov scale.
Run parameters of the single-phase simulations:  $\lambda =(15\nu u^2_{rms}/\varepsilon )^{1/2}$ is the Taylor microscale while $Re_\lambda$ is the corresponding Reynolds number, $\eta =(\nu ^3/\varepsilon )^{1/4}$ the Kolmogorov length scale, $N=N_x=N_y=N_z$ is the number of gridpoints of the Eulerian mesh in each direction, $K$ is the kinetic energy, and $T_L$ and $\sigma$ are the input parameters for the HIT forcing.

A validation of the flow solver is provided by computing the one-dimensional longitudinal energy spectrum  $E_{11}(k_1)$ and the isotropy parameter:
 \begin{equation} I(k_1)=\frac{E_{11}(k_1)-k_1\partial E_{11}(k_1)/\partial k_1}{2E_{22}(k_1)} \end{equation}
for a case at  $Re_\lambda \approx 140$, the latter being the Reynolds number based on the Taylor microscale $\lambda =(15\nu u^2_{rms})^{1/2}$ and on the root-mean-squared (r.m.s.) value of the velocity fluctuations $u_{rms}$.
The comparison with the data by Jiménez et al. (Reference Jiménez, Wray, Saffman and Rogallo1993) and Chouippe & Uhlmann (Reference Chouippe and Uhlmann2015) is given in figure 2, showing a very good agreement for both quantities.
Single-phase HIT at  $Re_\lambda =140$: (a) isotropy parameter $I$, as defined in (2.5), compared with Chouippe & Uhlmann (Reference Chouippe and Uhlmann2015). (b) One-dimensional energy spectrum, compared with Jiménez et al. (Reference Jiménez, Wray, Saffman and Rogallo1993).
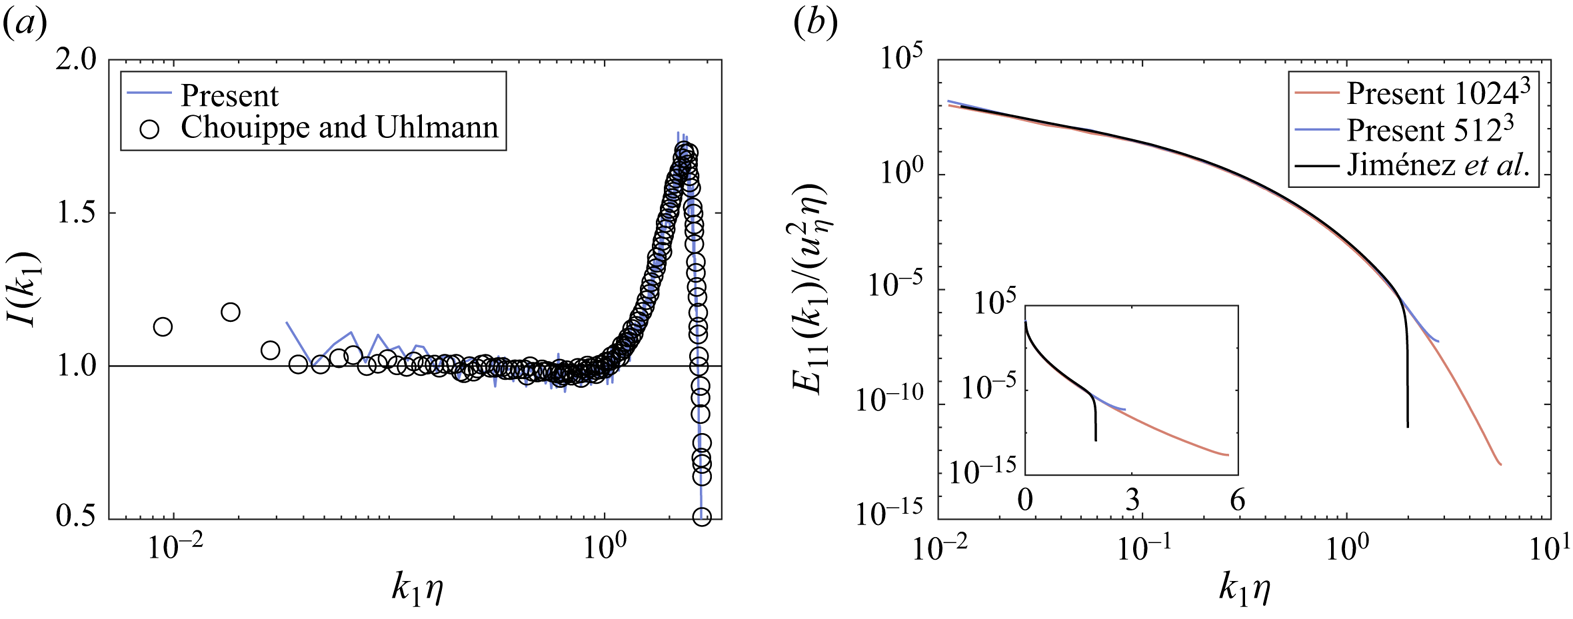
As an aside, we note that results obtained with a resolution  $512^3$ ( $\eta /\varDelta =0.92$) and $1024^3$ ( $\eta /\varDelta =1.83$) perfectly agree and, in both cases, the viscous range shows an exponential decay, evidenced by the linear slope when plotted in semi-log axes (Jiménez et al. Reference Jiménez, Wray, Saffman and Rogallo1993). The reason for the sharp decay of the benchmark data in the viscous range is that they had been obtained using the spectral code developed by Rogallo (Reference Rogallo1981), which is very strict on isotropy. In fact, to approximate the flow as isotropically as possible, it applies every time step a mask in $k$-space, such that the energy outside the sphere $|k\eta |=2$ is set to zero (J. Jiménez, Personal Communication).
2.4. Immersed boundary method
As mentioned above, the term  $\mathbf{f}$ on the right-hand side of the first equation (2.1a,b) contains also the IBM part $\boldsymbol{f}_{P}$ which allows for two-way coupling between particles and fluid. Here we have employed the method proposed by de Tullio & Pascazio (Reference de Tullio and Pascazio2016) in combination with the regularised Dirac delta function of Roma, Peskin & Berger (Reference Roma, Peskin and Berger1999). The surface of each solid object is discretised by $N_l$ equilateral triangular elements (see figure 1a) and Lagrangian markers are placed at their centroids. The IBM forcing term is computed on these Lagrangian markers, to satisfy velocity boundary conditions, and then transferred back to the Eulerian mesh to impose the effect of the solid phase on the flow. To avoid unforced Eulerian nodes, which would result in surface ‘holes’, the size of triangle edges must not exceed $0.7\varDelta$ (de Tullio & Pascazio Reference de Tullio and Pascazio2016), thus implying that, for increasing $Re_\lambda$, not only the Eulerian mesh but also the Lagrangian triangulation must be refined to maintain the correct phase coupling. Accordingly, the values of $N_l$ were $4912$, $10048$ or $21262$, depending on the flow resolution.
It is worth mentioning that  $N_p$ particles settling under their own weight impose on the fluid a force constantly aligned with gravity which, in a tri-periodic domain, would produce a continuous vertical acceleration of the flow and this would prevent the attainment of a statistical steady state. Following Chouippe & Uhlmann (Reference Chouippe and Uhlmann2015), this is avoided by subtracting, at every time step, the mean of the IBM terms applied by the particles on the flow, thus imposing a force with zero average in all directions: this implies that the net momentum of the system must be on average zero. Thus, the downward motion of the falling particles is compensated by an upward motion of the fluid such as to give zero net vertical momentum (this is the analogue of the time-dependent pressure gradient in turbulent channel flows used to ensure a constant flow rate in time, Kim, Moin & Moser Reference Kim, Moin and Moser1987). An analogous observation applies to angular momentum since free-falling chiral particles rotate in a preferred direction and this would generate a net circulation. In a tri-periodic cube, however, the Kelvin–Stokes theorem imposes zero circulation in all directions. Therefore, the angular velocity of particles is compensated by fluid vorticity in the opposite direction so as to maintain the circulation zero at every instant.
These observations must be kept in mind when analysing the results since while the resulting system can be efficiently simulated within homogeneous and isotropic conditions, an analogous laboratory experiment might not be immediately possible to set up.
2.5. Particles
The dynamics of the dispersed solid phase is obtained by solving, for each particle, the six degrees of freedom of the Newton–Euler equations:
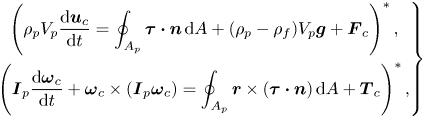 \begin{equation} \left.\begin{gathered} \left(\rho_p V_p\frac{{\rm d}\boldsymbol{u}_c}{{\rm d} t}=\oint_{A_p} \boldsymbol{\tau}\boldsymbol{\cdot}\boldsymbol{n}\,{\rm d} A+(\rho_p-\rho_f)V_p \boldsymbol{g}+\boldsymbol{F}_c \right)^*,\\ \left(\boldsymbol{I}_p\frac{{\rm d}\boldsymbol{\omega}_c}{{\rm d} t}+\boldsymbol{\omega}_c\times (\boldsymbol{I}_p\boldsymbol{\omega}_c)=\oint_{A_p} \boldsymbol{r}\times(\boldsymbol{\tau}\boldsymbol{\cdot}\boldsymbol{n})\,{\rm d} A+\boldsymbol{T}_c\right)^*, \end{gathered}\right\} \end{equation}
where the notation  $({\cdot })^*$ implies a content in dimensional units. Here, $A_p$ is the particle wet surface, $\boldsymbol{\tau }=-p\boldsymbol{I}+\mu _f(\boldsymbol {\nabla }\boldsymbol{u}+\boldsymbol {\nabla }\boldsymbol{u}^\textrm {T})$ the Cauchy stress tensor for a Newtonian fluid with $\boldsymbol{I}$ the unit tensor, $\boldsymbol{n}$ is the outward normal of the particle surface and $\boldsymbol{I}_p$ the inertial tensor of the particle which, in the principal inertial reference frame (figure 1a), has only the diagonal components. Additionally, $\boldsymbol{F}_c$ and $\boldsymbol{T}_c$ represent respectively force and torque acting on the particle as result of collisions/physical contact with other particles.
Following Breugem (Reference Breugem2012) and relying on Newton's third law of motion, we replace the integral terms on the right-hand side of (2.6a,b) with the volume forcing of the fluid phase, obtaining in non-dimensional form:
 \begin{equation} \left.\begin{gathered} \frac{{\rm d}\boldsymbol{u}_c}{{\rm d} t} \approx \frac{\rho_f}{\rho_p}\frac{6}{\rm \pi} \left(-\sum_{i=1}^{N_l} \boldsymbol{f}_i\Delta V_i +\frac{{\rm d}}{{\rm d} t} \int_{V_p}\boldsymbol{u}\,{\rm d} V\right) -\frac{\hat{\boldsymbol{k}}}{Fr} +\frac{\rho_f}{\rho_p}\frac{6}{\rm \pi}\boldsymbol{F}_c, \\ \boldsymbol{I}_p\frac{{\rm d}\boldsymbol{\omega}_c}{{\rm d} t}+\boldsymbol{\omega}_c\times(\boldsymbol{I}_p\boldsymbol{\omega}_c)\approx \frac{\rho_f}{\rho_p}\frac{6}{\rm \pi}\left(- \sum_{i=1}^{N_l} \boldsymbol{r}_i^n\times \boldsymbol{f}_i\Delta V_i +\frac{{\rm d}}{{\rm d} t}\int_{V_p}\boldsymbol{r}\times \boldsymbol{u}\,{\rm d} V\right)+ \frac{\rho_f}{\rho_p}\frac{6}{\rm \pi}\boldsymbol{T}_c, \end{gathered}\right\} \end{equation}
in which  $\hat {\boldsymbol {k}}$ is the vertical unit vector and
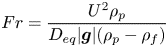 \begin{equation} Fr= \frac{U^2\rho_p}{ D_{eq} |\boldsymbol{g}|(\rho_p-\rho_f)} \end{equation}
the Froude number. In the above expression, we note that surfaces are triangulated and each triangle is tagged by a Lagrangian marker at its centroid; thus, the index  $i$ indicates the Lagrangian point over the surface and $\Delta V_i$ is the volume of the Eulerian cell intersected.
It is important to note that (2.7) clearly shows the particle dynamics depend on two non-dimensional parameters, namely  $\rho _p/\rho _f$ and $Fr$, which in principle could be varied independently. Distinguishing between $\rho _p/\rho _f$ and $Fr$, however, might look pleonastic since, in standard laboratory experiments within the same gravity field, $\rho _p/\rho _f$ and $Fr$ are not independent and (2.7) would in fact depend only on a single parameter. Accordingly, for the vast majority of our simulations, we have fixed the magnitude of gravity ( $|\boldsymbol{g}|=2$) and varied only $\rho _p/\rho _f$ as an independent parameter. This value of $|\boldsymbol{g}|$ was initially selected since, for $\rho _p/\rho _f=2$, it yielded $Fr=1$.
However, centrifuge set-ups (Jiang et al. Reference Jiang, Zu, Wang, Huisman and Sun2020) or microgravity environments (Futterer et al. Reference Futterer, Krebs, Plesa, Zaussinger, Hollerbach, Breuer and Egbers2013) could allow the independent variation of  $\boldsymbol{g}$, thus making relevant studying the separate effect of $Fr$ and $\rho _p/\rho _f$. In a few simulations, either of individual particles or of particle crowds, $\rho _p/\rho _f$ and $Fr$ have been varied independently, and a negligible effect of the former parameter compared with the latter has been observed; Appendix A reports some cases to confirm that indeed the results, for a fixed Froude number, hardly depend on density ratio variations.
The above model has been validated by considering a free-falling sphere in an initially quiescent viscous fluid. With a density ratio  $\rho _p/\rho _f=2$ ( $Fr=1$) and a fluid viscosity such to yield $Re \approx 1$ in the stationary state, the Stokes solution is expected to apply and this has been used for comparison. Domains up to $15\times 15\times 15$ in $D_{eq}$ units with a resolution of $288^3$ nodes have been employed and the results are given in figure 3(a) for the vertical velocity $V$ and the drag force $F_D$; the agreement between the present data and the analytical Stokes solution for analogous quantities looks excellent, once the stationary state is attained. Similar calculations for the torque always yielded values within the round-off error as expected from the symmetry of the system geometry.
Representative quantities for the Stokes dynamics of (a) a free-falling sphere and (b) chiral particles in a stagnant fluid. (a) Vertical velocity (red) and drag force (blue) are compared with the reference Stokes values (black). (b) Angular velocities in the body reference frame (green axes in figure 1) for a left-handed (blue) and right-handed (red) chiral particles. Note that here, since the external turbulence forcing is absent, the velocity scale  $U$ is undefined; all results are therefore scaled using $U_g=(|\rho _p/\rho _f-1||\boldsymbol{g}|D_{eq})^{1/2}$.

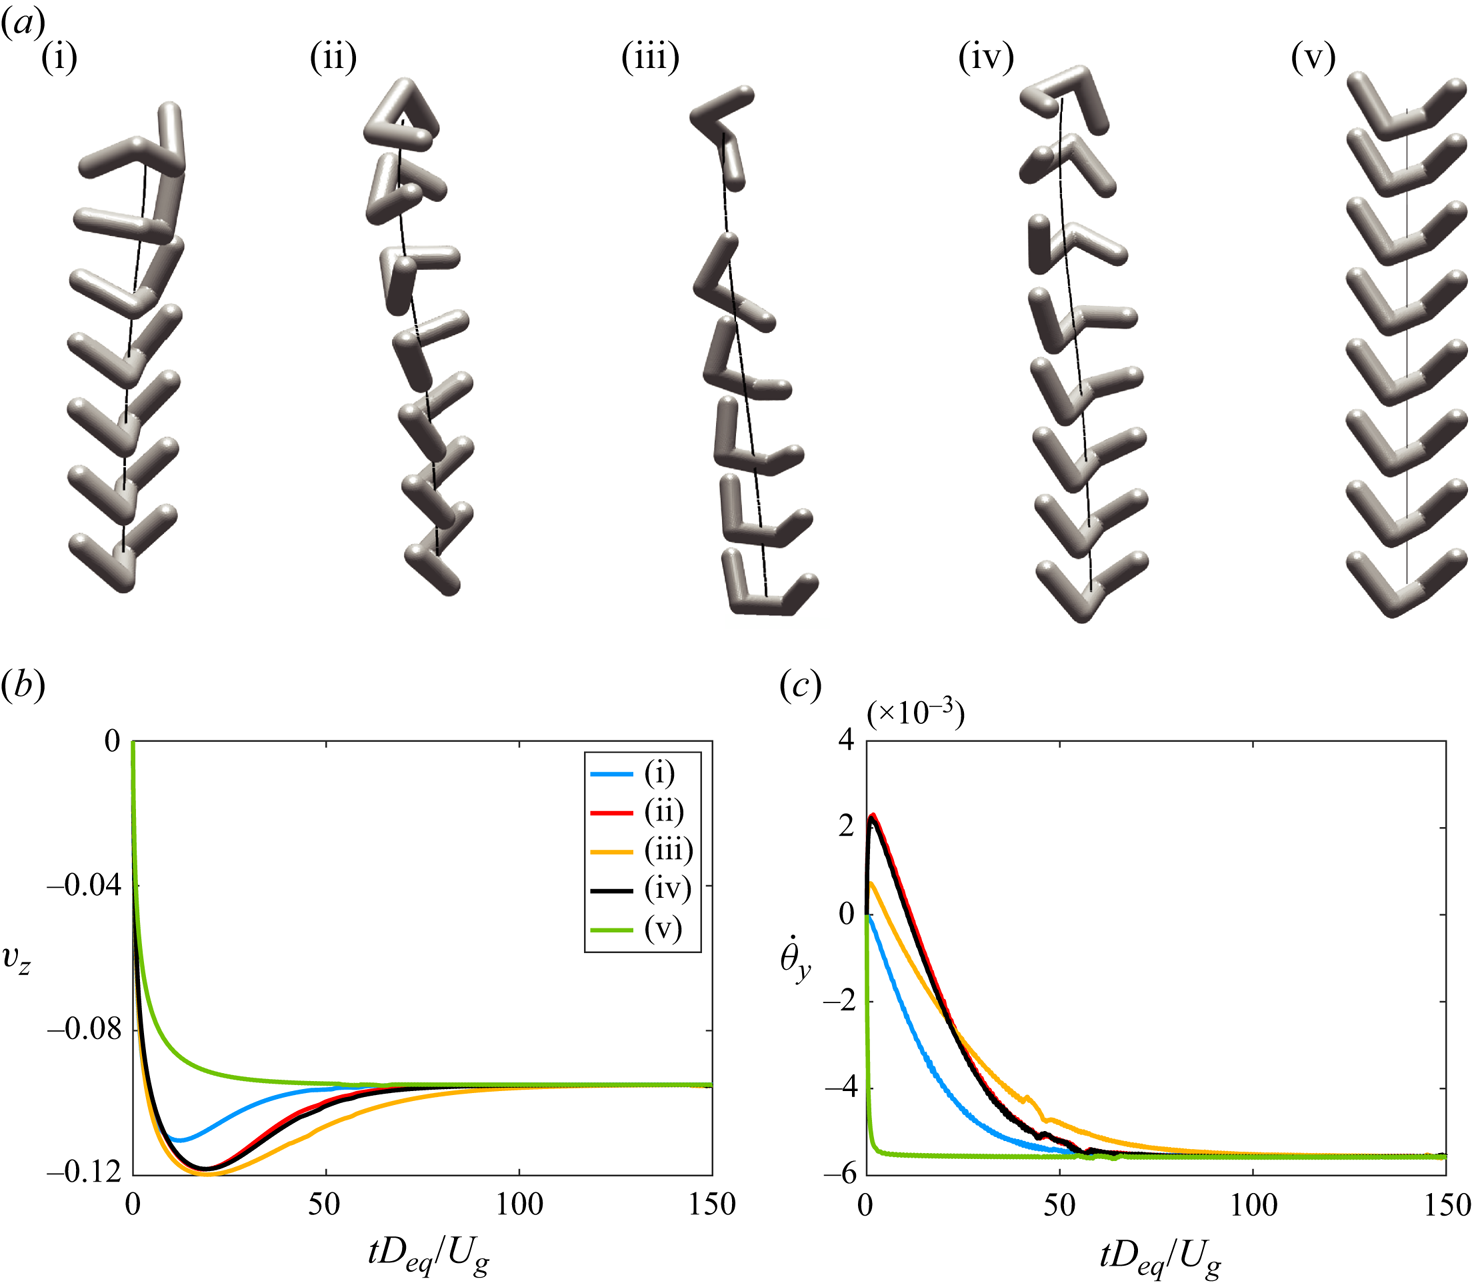
Unfortunately, exact results in the low- $Re$ regime, as in figure 3(a), are not available for chiral particles. Therefore, we could only run consistency checks, showing opposite steady rotation for left- and right-handed particles. More in detail, starting from any initial orientation, a free-falling particle undergoes transient dynamics during which rotations occur about all three axes until the mass centroid attains the lowest possible position. Once this stable attitude is gained, only a constant rotation about the $y_p$ (free-falling) axis remains which has opposite sign for different chirality of the particle (figure 3b). Additional simulations have revealed that the long-term dynamics is independent of the initial orientation which, instead, affects only the duration of the transient dynamics (figure 4); this has important consequences on the particle interaction with turbulence, which will be discussed in § 3. To further test this important finding, more simulations have been performed with decreased fluid viscosity so as to obtain a particle Reynolds number up to $Re_p = 260$. In another series of tests, the particle-to-fluid density ratio has been increased up to $\rho _p/\rho _f=10$ obtaining a particle Reynolds number up to $Re_p = 555$. For all cases, even if within strongly unsteady fluctuations, similar dynamics as that described above has been observed thus confirming that the features are robust and mostly related to the specific particle geometry.
Initial transient dynamics of a chiral particle falling in a stagnant fluid, for different initial orientations, at  $Re_p\approx 10$. The snapshots are taken at time lugs of $\Delta tD_{eq}/U_g=10$. For the results of panels (b,c), the same scaling velocity as in figure 3 has been used.
An important aspect of the present problem is the evaluation of particle/particle collisions. In fact, we will see that, even if the volume fraction of the solid phase never exceeds  $\phi =2\,\%$, the complex shape of particles involves collisions with multiple contacts and even entanglement. Therefore, the correct interaction dynamics is relevant for the statistics of the whole system. Given the complex particle shape, determining interactions is not trivial as two bodies can have their centroids farther than $D_{eq}$ even if there is contact (figure 5a) or vice versa (figure 5b).
Possible configurations for close particles; the volume wise equivalent spheres are represented by transparent solids: (a) particles with a contact point but with non-intersecting spheres; (b) particles not in contact with intersecting spheres. The white segments in panel (a) are the axes of the particles legs used to compute proximity and contact.

In fact, the collision model consists of two main ingredients: the proximity detection and the contact loads computation. Concerning the former, each particle position and orientation is hard-coded through the coordinates of its nodal points  $P$,
$P$,  $Q$,
$Q$,  $R$ and $S$ (figure 5a), the diameter $d$ of each leg (figure 1a), and the radius $d/2$ of each distal spherical cap. For any couple among the $N_p$ particles, the centroids distance is computed and for those whose value is compatible with a contact, the minimum distance among the segments $h$ is evaluated. Knowing the particle shape, it is easy to compute the thickness of the fluid gap between the two surfaces $d_c$ and, if it is smaller than two Eulerian grid cells, the contact loads are computed. The reason for using $d_c\leq 2\varDelta$ as the threshold value is that, in IBM methods, the flow at the first external point is not obtained from the Navier–Stokes equations but from a model which enforces the boundary conditions; if the gap between two immersed boundaries is thinner than $2\varDelta$, only a single Eulerian point is available to satisfy two boundary conditions which is not a well-posed problem. Following Breugem (Reference Breugem2012), the short-range repulsive force, which the $j$th particle exerts on the $i$th, is prescribed according to $\boldsymbol{F}_{c,ij}=-\alpha _c[(|\boldsymbol{d}_{ij}|-d_c)/d_c]^2\boldsymbol{d}_{ij}/|\boldsymbol{d}_{ij}|$ with $\boldsymbol{d}_{ij}$ the oriented minimum surface distance during the collision. Here, $\alpha _c=10^{-4}$ as in Breugem (Reference Breugem2012) and $\boldsymbol{F}_{c,ji}=-\boldsymbol{F}_{c,ij}$ as prescribed by Newton's third law of motion. Finally, the contact force produces also a contact moment which is immediately computed from $\boldsymbol{T}_{c,ij}= \boldsymbol{r}_c \times \boldsymbol{F}_{c,ij}$, with $\boldsymbol{r}_c$ being the vector connecting the particle centroid with the contact point (figure 5a).
We refer to Assen et al. (Reference Assen, Ng, Will, Stevens, Lohse and Verzicco2022) for additional details and a thorough validation of the collision model.
3. Results
3.1. Turbulence intensity effect
To understand how chiral bodies interact with the surrounding flow, we preliminarily consider the case of a single particle (volume fraction  $\phi =0.05\,\%$) in a turbulent environment of increasing intensity. We begin with a particle at $\rho _p/\rho _f=2$ ( $Fr=1$) in weak turbulence, as for the case Re15 of table 1. Figure 6 shows also in this case a net rotation about the $y_p$ body axis sustained by the vertical falling through the coupling of rotational and translational degrees of freedom.


Here, the dynamics does not differ much from that of figure 3(b), except for the unsteadiness whose origin is twofold: particle settling velocity and interaction with turbulence. In fact,  $|\boldsymbol{u}_c|$ is proportional to $U_g=(|\rho _p/\rho _f-1||\boldsymbol{g}|D_{eq})^{1/2}$, in turn setting the particle Reynolds number $Re_p=U_g D_{eq}/\nu$ and, for high enough values, this yields an unsteady falling even in a quiescent fluid (for the present flow parameters, it results in $Re_p \approx 140$). The interaction with turbulence, however, introduces further unsteadiness as the particle dynamics is coupled with velocity fluctuations whose strength is quantified by $Re_\lambda$. In this case, it results in $Re_\lambda \approx 14.7$ with a velocity ratio $u_{rms}/ |v_z| \approx 0.08$, suggesting that turbulence acts only as a perturbation on the particle dynamics ( $v_z = \boldsymbol{u}_c \boldsymbol {\cdot } \hat {\boldsymbol {k}}$ is the falling particle velocity).
It is interesting to note that for the parameters of case Re15, single-phase turbulence yielded  $Re_\lambda \approx 13$, while the introduction of a particle raises the value by more than $10\,\%$; this is due to the constant energy injection caused by the particle free-fall (at the expense of its potential energy) which adds to the external forcing and increases the turbulence strength. Though the increase is small, the phenomenon underlines the two-way interaction between fluid and solid phases whose dynamics is strongly connected.
As  $Re_\lambda$ increases, the energy introduced by the particle becomes less relevant to turbulence while the stronger velocity fluctuations alter the solid body dynamics. In fact, for the parameters of case Re80, the effective $Re_\lambda$ and $u_{rms}$ are indistinguishable from the single-phase values while particle mean vertical and angular velocities become negligible when compared with their fluctuations.
The results are summarised in figure 7, which shows the mean vertical and angular velocities, both normalised by their standard deviations. It is worth pointing out that the ratio  $v_z/\sigma _{v_z}$ of figure 7(a) decreases with $Re_\lambda$, both because the standard deviation $\sigma _{v_z}$ increases and because $|v_z|$ itself decreases. However, figure 7(b) shows that $|\dot \theta _y|$ remains approximately constant within this range of $Re_\lambda$ although $\sigma _{\dot \theta _y}$ increases and therefore their ratio decreases.
Single chiral particle with  $\rho _p/\rho _f=2$ ( $Fr=1$) in a turbulent flow for different turbulence strengths (see table 1). (a) Time evolution of the centre of mass vertical falling velocity. (b) Time evolution of the angular velocity about the $y_p$ particle body axis (green axes in figure 1).

An important effect of particle chirality is its mean angular velocity which, on account of the zero total circulation imposed by the domain boundary conditions, induces an opposite mean vorticity in the flow field. This is indeed observed from the probability density functions of the vertical fluid vorticity component (figure 8a) which are biased towards negative values and become more symmetric as  $Re_\lambda$ increases and particle rotation becomes less relevant.
Single chiral particle with  $\rho _p/\rho _f=2$ ( $Fr=1$) in a turbulent flow at different $Re_\lambda$. (a) Probability density function of the fluid vertical vorticity component. A preferred vertical vorticity, due to the immersed chiral particles, is only obtained for weak turbulence. (b) Ratio of turbulent fluctuation intensity and mean vertical particle velocity as a function of the effective flow $Re_\lambda$.
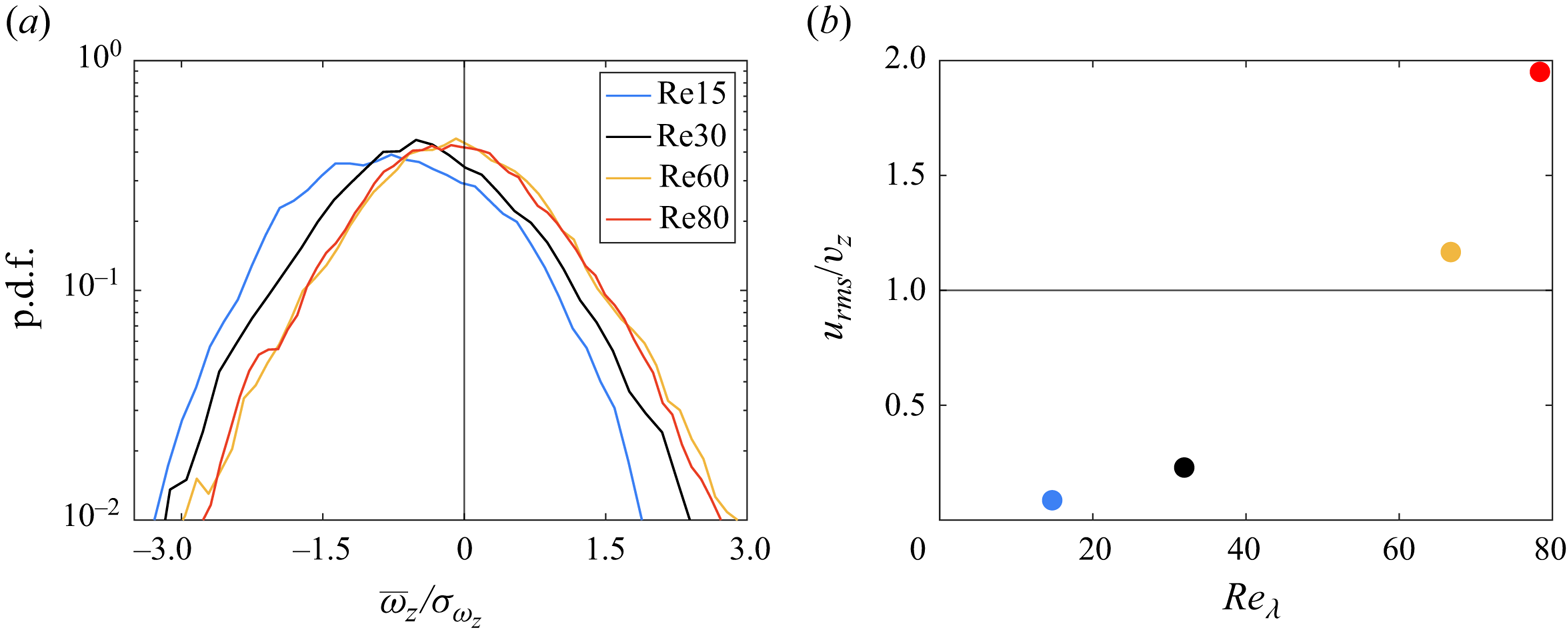
These results are consistent with those of figure 7 suggesting that as turbulence strengthens, the particle tends to be passively advected by turbulent fluctuations rather than altering turbulence itself through its helical free-fall.
A partial confirmation of this conjecture comes from figure 8(b), which reports the ratio between  $u_{rms}$ and $|v_z|$: when this ratio is small, particle dynamics dominates over turbulence which, therefore, is affected by particle chirality. In contrast, large $Re_\lambda$ values result in $u_{rms}/|v_z| > 1$ and turbulent fluctuations dominate over particle forcing, yielding more isotropic dynamics.
3.2. Density ratio effect
Given the role played by the relative magnitude of turbulence fluctuations ( $u_{rms}$) and the particle falling velocity $|v_z| \sim (|\rho _p/\rho _f-1||\boldsymbol{g}|D_{eq})^{1/2}$, it should be clear that the system is sensitive not only to the strength of turbulence forcing but also to the density ratio $\rho _p/\rho _f$ (or $Fr$). In fact, the immediate consequence of increasing $\rho _p/\rho _f$ is to enhance the falling velocity and therefore the mean angular velocity. However, translation and rotation in a chiral particle are not rigidly coupled (as a nut and bolt assembly), as both depend on hydrodynamic loads. Therefore, they vary by different amounts. Moreover, the potential energy transfer of the falling particle grows with $\rho _p/\rho _f$, thus further increasing the turbulence level which reacts back on the particle dynamics. Finally, $\rho _p/\rho _f$ changes particle inertia to translation and rotation, in turn altering the trajectory sensitivity to turbulent fluctuations.
Examples of particle dynamics are given in figure 9 where results at  $\rho _p/\rho _f$ from $2$ to $10$ ( $Fr \in [1,5/9]$) are compared for a turbulent forcing as the Re15 case of table 1: since for these flows, the interplay between mean values and standard deviations is more complex, we complement figure 9 with table 2 where additional data are provided. A clear trend can be observed for the mean vales of $v_z$ and $\dot \theta _y$ which both increase in magnitude with the ratio $\rho _p/\rho _f$. Also, the effect of energy transfer, from particle to turbulence, is clearly evidenced from the growth of $Re_\lambda$ and $u_{rms}$. A similar monotonic increase is found for the mean vertical component of the fluid vorticity which is a direct consequence of the chirality-induced angular velocity of the particle.
Single chiral particle with  $\rho _p/\rho _f$ from $2$ to $10$ ( $Fr$ from $1$ to $5/9$) in a turbulent flow with the forcing of the Re15 case of table 1: (a) time evolution of the centre of mass velocity components; (b) time evolution of angular velocity components expressed in the particle body frame. In the inset, the same curves are plotted with a running average of $20D_{eq}/U$ time units to evidence their mean values.

Flow parameters of single chiral particle simulations with variable  $\rho _p/\rho _f$ and turbulent forcing as the case Re15 of table 1.
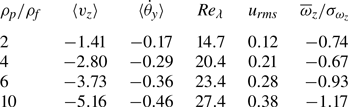
A closer look at the data, however, reveals that the fivefold increase of  $\rho _p/\rho _f$ produces growths of $v_z$ of ${\approx }3.6$ and $\dot \theta _y$ of ${\approx }2.7$, thus confirming the loose coupling of particle rotation and translation. Concerning the effect on turbulence, $\overline{\omega }_z/\sigma _{\omega _z}$ grows by ${\approx }1.6$. This is confirmed by the histograms of figure 10(a) which drift in the direction of negative vorticity consistently with the monotonic increase of $\dot \theta _y$. However, figure 10(b) shows how, despite the growth of $Re_\lambda$, the ratio $u_{rms}/ |v_z|$ decreases with $\rho _p/\rho _f$, consistently with the observation that particles of larger density are less sensitive to turbulent fluctuations and their chirality makes them behave as impellers which impart rotation to the surrounding fluid.
Single chiral particle with  $\rho _p/\rho _f$ from $2$ to $10$ ( $Fr$ from $1$ to $5/9$) in a turbulent flow with the forcing of the Re15 case of table 1: (a) probability density function of the fluid vertical vorticity component; (b) ratio of turbulent fluctuation intensity and mean vertical particle velocity as function of $\rho _p/\rho _f$.

We have repeated the same simulations as before, increasing the turbulence forcing as for the case Re30 of table 1. For the sake of conciseness, we report only the results of figure 11, which shows an effect of stronger turbulence only on the vorticity histograms of the lighter particles. Accordingly, the ratio  $u_{rms}/ v_z$ shows a substantial increase for $\rho _p/\rho _f=2$ and $4$ (
$4$ ( $Fr=1$ and $2/3$) while it is essentially unchanged for the higher density ratios.
Single chiral particle with  $\rho _p/\rho _f$ from $2$ to $10$ ( $Fr$ from $1$ to $5/9$) in a turbulent flow with the forcing of the Re30 case of table 1: (a) probability density function of the fluid vertical vorticity component; (b) ratio of turbulent fluctuation intensity and mean vertical particle velocity as a function of $\rho _p/\rho _f$. Note the very different vertical scale in figures 11(b) and 10(b).

The picture emerging from the simulations with a single chiral particle is that its fall injects additional energy in the fluid whose turbulence is altered; in turn, particle falling and rotational velocities are affected by the strength of velocity fluctuations. Therefore, the system dynamics emerges out of the balance of a complex two-way coupling between solid and fluid phases. Nevertheless, a clear trend is observed such that stronger velocity fluctuations reduce the effects of the particle and its chirality on turbulence, while higher particle/fluid density ratios increase them.
3.3. Volume fraction effect
In real systems, such as helically swimming active matter (Liebchen & Levis Reference Liebchen and Levis2022) or plants aiming at maximising seeds transport and dispersal (Mazzolai et al. Reference Mazzolai, Mariani, Ronzan, Cecchini, Fiorello, Cikalleshi and Margheri2021), multiple chiral particles interact simultaneously among them and react back on the surrounding fluid. Accordingly, we have investigated how the system dynamics changes when several particles are placed in a turbulent environment and what is the effect of their volume fraction  $\phi$.
The immediate effect of increasing the number of particles is to enhance the forcing on the turbulence, owing to growing energy injection in the fluid phase. However, the presence of multiple particles increases also energy dissipation, by friction with solid surfaces and the small scale of their wakes. Therefore, turbulence can be strengthened or suppressed, depending on which of the two mechanisms prevails.
Furthermore, the presence of obstacles in the bulk flow reduces the size attainable by the largest flow scales resulting in further modifications of the energy spectrum. Finally, the collision among complex shape particles favours prolonged interactions rather than impulsive rebounds, as in the case of spheres or other compact objects, and this changes the solid body dynamics and the interaction with the flow.
Table 3 reports some representative data for flows with a turbulent forcing as in the case Re30 of table 1 and an increasing number of particles with  $\rho _p/\rho _f=2$ ( $Fr=1$). It is indeed confirmed that a larger number of particles evolving within the same domain enhances velocity fluctuations, consistently with the augmented energy injection; however, viscous dissipation also increases and this happens at a faster rate than the increase of $u_{rms}$. The dependence of $\varepsilon$ on $\phi$ is displayed in figure 12(a), which shows a linear behaviour which matches the findings of Fornari et al. (Reference Fornari, Zade, Brandt and Picano2019) for finite-size spheres in turbulence. The different growths of $\varepsilon$ and $u_{rms}$ with $\phi$ result in a decreasing $Re_\lambda$ indicating that, for this set-up, more particles weaken turbulence by transferring more energy to small scales. This mechanism is quantitatively confirmed by the spectra of figure 12(b), which shows an increased energy content at the smallest scales and a reduced content at larger scales, which is similar to what was observed by Gao, Li & Wang (Reference Gao, Li and Wang2013) in HIT flows with spheres of diameter $\approx \lambda$. The spectra of figure 12(b) also show that, for given $\phi$, the present chiral particles are much more effective than spheres in modifying turbulence. This might be due to the angular momentum of the dispersed phase which in turn induces a net rotation of the fluid turbulence. Indeed, Biferale, Musacchio & Toschi (Reference Biferale, Musacchio and Toschi2013) have already shown that, in HIT, altering the nonlinear terms so as to have a sign-definite helicity content heavily affects the energy cascade and turbulence spectra.
Flow parameters for multiple particle simulations with variable volume fraction  $\phi$, $\rho _p/\rho _f=2$ ( $Fr=1$) and turbulent forcing as the case Re30 of table 1. Here, $\langle \, \rangle$ indicates an average over the particles.

Multiple chiral particles with  $\phi$ from $0.05\,\%$ to $2\,\%$ in a turbulent flow with the forcing the Re30 case of table 1 and $\rho _p/\rho _f=2$: (a) kinetic energy dissipation rate as function of the volume fraction $\phi$; (b) comparison of one-dimensional energy spectra for single-phase, one chiral particle, $20$ chiral particles and $20$ spheres.

A further consideration about the spectra of figure 12(b) is that, at first sight, it seems possible to collapse the spectra for spheres and chiral particles by a simple rescaling although several direct tests have shown that this is not the case. In fact, we would like to stress that chiral particles and spheres are equivalent only volume wise, while the wetted surface of the former is bigger by  $50\,\%$ and the front area by $25\,\%$. This implies that features like energy dissipation by friction and the surrounding fluid dragged during the motion cannot be accounted for by a single scaling factor.
An additional reason for the marked difference between spheres and chiral particles could be the collision dynamics, which is illustrated in figure 13. A set of  $N_p$ particles yields $N_p(N_p-1)/2$ distinct couples, if pairs $\#i$– $\#j$ and $\#j$– $\#i$ are equivalent. Whenever particles $\#i$ and $\#j$ are close enough to activate the collision model, we assemble a four-digit integer $\#ij$ from the particles identification number, and record the time of interaction. Figure 13 shows, in a representative time window, the interactions for $N_p=20$ spheres and chiral particles with the same volume fraction $\phi =1\,\%$ for two flows with different turbulent forcing and density ratios $\rho _p/\rho _f$. It is evident that spheres tend to have short duration impulsive rebounds, while chiral particles, with their complex shape, favour entanglement which entail multiple contacts over several time units. Analysis of the flow fields has evidenced an energy dissipation enhancement caused by particle collision which is consistent with the energy spectra of figure 12(b).
Collision events versus time for  $N_p=20$ particles ( $\phi =1\,\%$) in a turbulent flow: (a) forcing as the Re30 case of table 1 and $\rho _p/\rho _f=2$; (b) forcing as the Re60 case of table 1 and $\rho _p/\rho _f=7$; the four-digit number on the $y$-axis identifies the two interacting particles: for example, $\#i,j=0412$ indicates that particles $\#i=4$ and $\#j=12$ have collided. Red bullets for spherical particles, blue open circles for chiral particles.
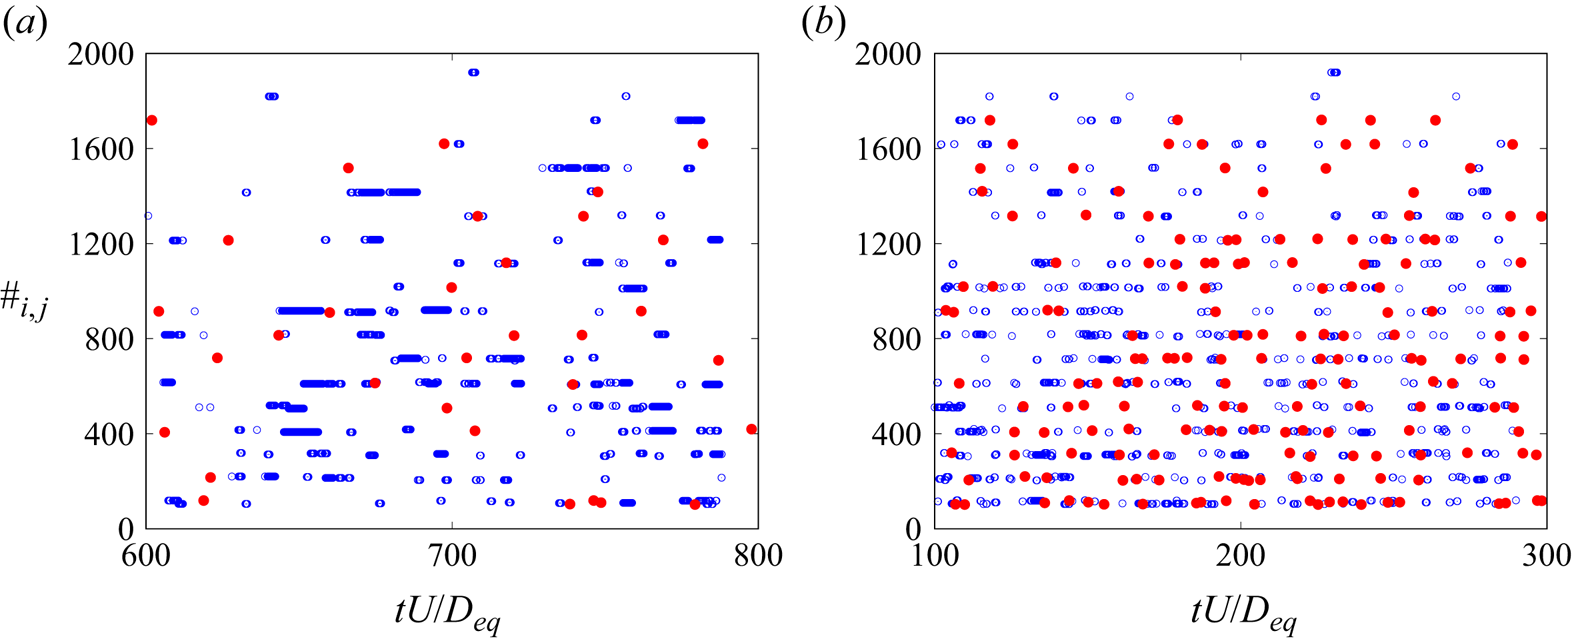
Clearly, frequency and duration of the collisions depend strongly on turbulence strength and particle density (figure 13). The comprehension of their statistics deserves a dedicated study which will be presented in a forthcoming paper.
Concerning the particle angular velocity, table 3 shows that it is essentially constant with  $\phi$, while the amplitude of the mean fluid vorticity increases (figure 14a); this can be explained by considering that $\langle \dot \theta _y \rangle$ is the mean angular velocity of each particle. When their number increases, the fluid must rotate faster to compensate for the total angular momentum which yields a global zero circulation.
Multiple chiral particles with  $\phi$ from $0.05\,\%$ to $2\,\%$ in a turbulent flow with the forcing of the Re30 case of table 1 and $\rho _p/\rho _f=2$: (a) probability density function of the fluid vertical vorticity component; (b) ratio of turbulent fluctuation intensity and mean vertical particle velocity as a function of the volume fraction $\phi$.

The values of  $\langle v_z\rangle$ slightly decrease with $\phi$. This result agrees with the findings of Fornari, Picano & Brandt (Reference Fornari, Picano and Brandt2016) for spheres at similar volume fractions. The ratio $u_{rms}/\langle |v_z|\rangle$ is however well below unity for all volume fractions (figure 14b) and the vorticity histograms of figure 14(a) behave consistently, showing always asymmetric vorticity distributions.
After having investigated the effects of the single governing parameters separately, we can now vary them simultaneously and verify whether the system behaves according to the gained understanding. The picture emerging from the previous simulations is that particles fall because of gravity and increase turbulent fluctuations, by agitating the surrounding fluid at the expense of their potential energy. At the same time, also turbulent energy dissipation is enhanced. Thus, the overall turbulence strength ( $Re_\lambda$) results from the balance of these two competing effects. However, particles settling velocity decreases as the turbulence strengthens, thus giving two-way coupled dynamics. The chiral shape of the present particles couples rotational and translational degrees of freedom which entails a net angular momentum of the solid phase and, correspondingly, a mean vorticity of the fluid turbulence. Finally, increasing the volume fractions $\phi$ of the chiral particles enhances the previous effects but introduces also a complex collision dynamics which further complicates the interactions.
On account of the above arguments, the relative strength of particle forcing and turbulence intensity can be quantified by the ratio  $u_{rms}/\langle |v_z|\rangle$, while the chirality-induced flow rotation through the mean vorticity is normalised by its standard deviation $\langle \omega _z\rangle /\sigma _{\omega _z}$. Several simulation campaigns for different values of $Re_\lambda$ and $\rho _p/\rho _f$ have been performed. The results shown in figure 15 confirm that indeed the behaviour is well described by these quantities for a wide range of governing parameters. Some additional ad hoc cases have been run using different values of $\boldsymbol{g}$ to vary independently $Fr$ and $\rho _p/\rho _f$: these data are also reported in figure 15. They collapse with the rest of the simulations in which only $Fr$ has been varied as the main parameter.
Mean flow vorticity normalised by its standard deviation versus ratio of turbulent velocity fluctuations with mean settling particle velocity in (a) linear and (b) logarithmic scale. The black solid line is the curve  $0.45 (u_{rms}/v_z)^{-1}$ which best fits all the simulations.

It is important to note that most of the flows of figure 15 have been computed with  $N_p=20$ particles ( $\phi =1\,\%$) although we have verified that the same plot for all cases obtained using $N_p=1$ ( $\phi =0.05\,\%$) behaves similarly even if data collapse onto a different curve. However, table 3 and the related discussion have evidenced that $\phi$ affects the flow features in several ways and parametrising its mechanisms is not trivial. However, we can attempt to estimate the effect of $\phi$ from table 3, which has been obtained for a single value of $Re_\lambda$ and $Fr$, and verify whether the same correction works for all other flows. More in detail, from table 3, the quantities $u_{rms}/\langle |v_z|\rangle$ and $\langle \omega _z\rangle /\sigma _{\omega _z}$ at $N_p=1$ and $N_p=20$ have been employed to compute their ratios to be used as correction coefficients for all cases with $N_p=1$ computed for different values of $Re_\lambda$ and $Fr$. Indeed, the open symbols in figure 15 confirm that the behaviour is the same and all data now collapse on the same curve.
A final comment is concerning the huge error bar of the rightmost points in figure 15(a): in this case, the strength of turbulence (produced by the forcing  $\boldsymbol{f}_{T}$ alone) is such as to make negligible the effect of the particle on the flow whose dynamics tends to that of a passive tracer. Accordingly, the settling velocity and the induced flow rotation should vanish while turbulent fluctuations strengthen. We have found that achieving statistical convergence for these cases requires very long simulation times (see also the large variations of the ratio $T_o/T_e$ reported in § 2.1) and for $u_{rms}/\langle |v_z|\rangle > 2.5$, obtaining convergence becomes unpractical. We have however verified that, regardless of turbulence intensity, simulations with $\rho _p/\rho _f=1$ always yield $\langle |v_z|\rangle \rightarrow 0$ and $\langle \omega _z\rangle \rightarrow 0$, thus confirming that the data of figure 15 approach the correct limit.
4. Conclusions and outlook
Using direct numerical simulations of homogeneous isotropic turbulence with finite–size, heavy chiral particles, we have investigated the dynamics of the system under the influence of the main governing parameters which are: turbulence strength, solid-to-fluid density ratio (or Froude number) and volume fraction of the solid phase.
A particle, falling under the effect of an external gravity field, converts its potential energy into a kinetic counterpart which is transferred to the fluid through viscous and pressure forces. On the one hand, this mechanism enhances the intensity of velocity fluctuations but, on the other hand, it also increases the energy dissipation through viscous friction and the generation of small scales in the wake. Depending on the specific flow parameters, the former or the latter mechanisms can prevail, thus boosting or suppressing turbulence intensity, respectively.
Turbulence of increasing strength, in turn, affects particle dynamics by reducing its mean falling velocity and decreasing the relevance of the additional energy input with respect to that introduced by the HIT forcing alone.
Particle chirality, by coupling translational and rotational degrees of freedom, produces a mean flow vorticity which is evidenced through its probability density function with a non-zero peak position.
Our results suggest that the ratio of turbulent velocity fluctuations to the mean particle settling velocity  $u_{rms}/v_z$ can be used to characterise the intensity of the chirality induced mean rotation of the flow which decreases as the previous ratio increases: the implication of this finding is that particle chirality does not matter much in large-scale features of strong turbulence.
The influence of the particle volume fraction  $\phi$ is more complex than the other parameters since, in addition to the above-mentioned mechanisms, there are the interactions among particles and their collisions. The latter have shown to be characterised by long entanglement times in contrast to spheres which instead rebound impulsively. These differences are evident also from the turbulent energy spectra which, for a given volume fraction ( $\phi =1\,\%$), show a more pronounced energy reduction caused by chiral particles than by spheres. Despite the more complex dynamics, the quantity $u_{rms}/v_z$ describes correctly the induced flow rotation as confirmed by figure 15.
This paper is only a first attempt to investigate the interaction of relatively complex shaped chiral particles with homogeneous isotropic turbulence and many things could be done to extend the study in different ways: more detailed flow statistics should be computed to understand how turbulence is modified not only with respect to rotation. Although the work done by the falling particles may be negligible for altering the energetics of larger scales in the flow, it could be significant at smaller scales. At these scales where the energy injection due to the particles is significant, the particle chirality might also matter. An extreme case confirming this observation is that for  $50\,\%$ mixtures of left- and right-handed particles, flow vorticity does not change although the small-scale features of turbulence is altered.
Heavier and lighter spheres in HIT (such as droplets in gases and droplets in liquids, respectively), owing to centrifugal effects, are known to collect in different flow regions. Thus, chiral particles lighter than the surrounding fluid might behave differently from the present ones. In this paper, we have verified that left- and right-handed particles behave identically except for the sign of the induced flow rotation. A  $50\,\%$ mixture of left- and right-handed particles is expected to produce zero net rotation of the flow although it is likely to alter other turbulence properties very differently from a set of spheres with the same $\phi$. Finally, the statistics of particle collisions has shown to strongly depend on the various flow parameters (figure 13). A deeper understanding of their features would be very useful to characterise the dynamics of real suspensions.
All these points are currently under investigation or will be dealt with in the near future. They will be the subject of forthcoming papers.
Acknowledgements
We wish to thank Mr Xander M. de Wit and Professor F. Toschi for many fruitful clarifying discussions about the dynamics of chiral bodies and their interaction with turbulence. R.V. acknowledges the grant 2022AJT27Y from the Italian Ministry of the University.
Funding
This research has received funding from the Dutch Research Council under the project ‘Shaping turbulence with smart particles’ (file number OCENW.GROOT.2019.03). We acknowledge the access to several computational resources, all of which were used for this work: European High Performance Computing Joint Undertaking for awarding us access to Discoverer under the project EHPC-REG-2022R03-208 and the national e-infrastructure of SURFsara, a subsidiary of SURF cooperation.
Declaration of interests
The authors report no conflict of interest.
Data availability statement
The data that support the findings of this study are available upon reasonable request.
Appendix A. Density ratio independence if  $Fr=1$

In this appendix, we provide evidence of the reduced sensitivity of (2.7) to density ratio compared with the Froude number. Figure 16 reports some cases run for  $2 \leq \rho _p/\rho _f \leq 20$ and $Fr=1$, showing only limited differences. Indeed, some effects are evident for the settling velocity, especially for the lowest density ratio. These however have to be compared with the results of figure 9 where a smaller variation of $Fr$ produces much larger effects.
Single chiral particle falling in a stagnant fluid at  $Re_p\approx 100$ for different $\rho _p/\rho _f$ and fixed $Fr=1$. (a) Time evolution of the centre of mass vertical velocity component. (b) Time evolution of angular velocity $y$-component expressed in the particle body frame (green axes in figure 1).

As an aside, we note that if  $U_g=\sqrt {D(\rho _f/\rho _p-1)|\boldsymbol{g}|}$ is used as scaling velocity for all equations (rather than the flow velocity $U$), the Froude number turns out to be always $Fr=1$ and the resulting system shows only limited sensitivity to the density ratio $\rho _p/\rho _f$.
Appendix B. Kinetic energy balance
As a further consistency check of the numerics, we consider the energy budget obtained from (2.1a,b) after a scalar product with  $\boldsymbol {u}$ and integrating over the entire domain $\varOmega$. We obtain, for the kinetic energy $E_k=\boldsymbol {u}\boldsymbol {\cdot }\boldsymbol {u}/2$, the following relation:
 \begin{equation} \frac{{\rm d}}{{\rm d} t}\langle E_k\rangle_{\varOmega}={-}\varepsilon_\varOmega + \varPi_{T}+\varPi_{P} \end{equation}
with the dissipation rate
 \begin{equation} \varepsilon_\varOmega=\frac{1}{Re} \left\langle \left|\frac{\partial \boldsymbol{u}}{\partial \boldsymbol{x}}\right|^2 \right\rangle_\varOmega, \end{equation}
the work done by the turbulence forcing  $\varPi _{T}$,
 \begin{equation} \varPi_{T}=\langle \boldsymbol{u}\boldsymbol{\cdot} \boldsymbol{f}_{T}\rangle_{\varOmega}, \end{equation}
and the fluid–particle coupling term  $\varPi _{P}$,
 \begin{equation} \varPi_{P}=\langle \boldsymbol{u}\boldsymbol{\cdot} \boldsymbol{f}_{P}\rangle_{\varOmega}. \end{equation}
Figure 17 shows the time evolution of the left- and right-hand side of (B1), confirming the balance.


Appendix C. Computational domain size in gravity direction
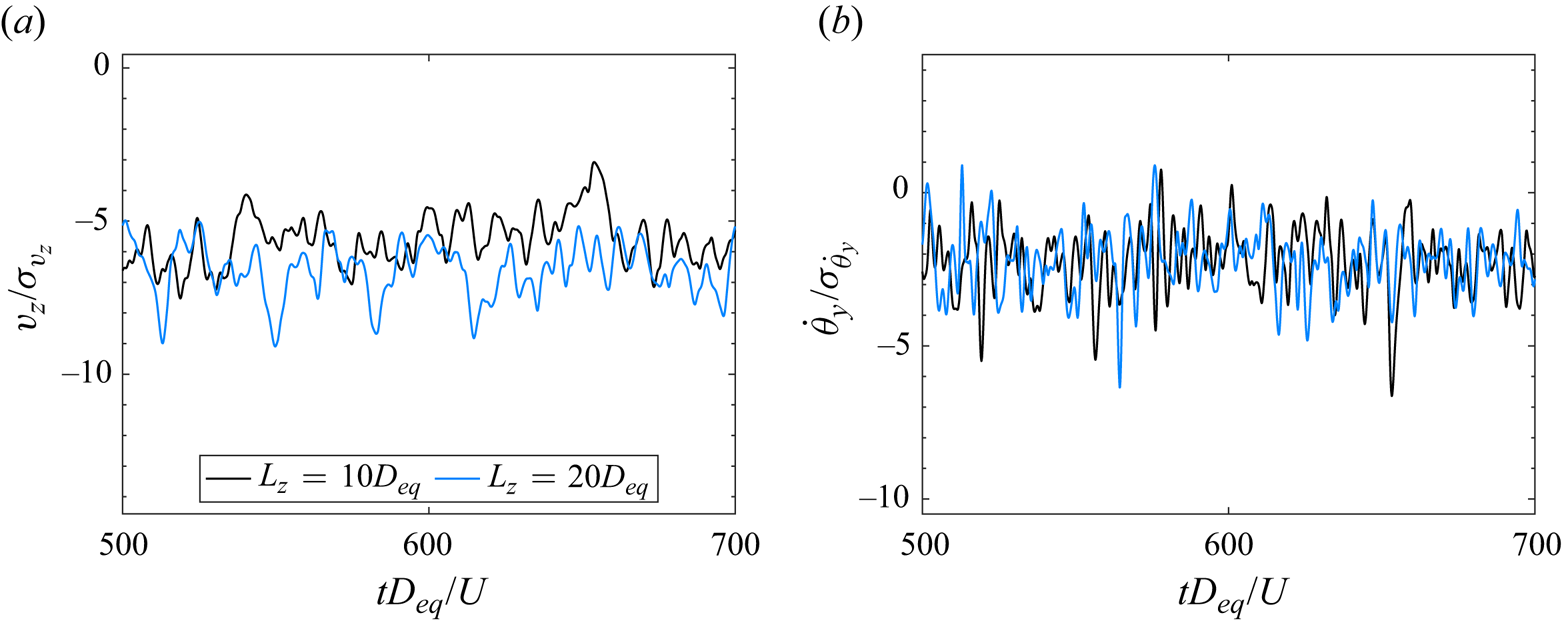
Here we provide the results of additional simulations run in a computational domain whose size has been doubled in the gravity direction ( $L_z=20D_{eq}$). These tests were run to ascertain a possible influence of the vertical domain size on account of particles settling velocity. Figure 18 shows the time evolution settling and angular velocity for a single particle at $\rho _p/\rho _f=2$ in a turbulent flow with the forcing as the case Re30 of table 1: their mean values are $v_z/\sigma _{v_z} = -6.7 \pm 1.0$, $-2.3 \pm 0.3$ for $L_z=20D_{eq}$ and $v_z/\sigma _{v_z} = -5.8 \pm 1.1$, $-2.1 \pm 0.3$ for $L_z=10D_{eq}$, thus confirming that the cubic domain is indeed adequate for our analyses.
Single chiral particle of  $\rho _p/\rho _f=2$ in a turbulent flow with the forcing of the Re30 case of table 1: (a) time evolution of the centre of mass vertical velocity component; (b) time evolution of angular velocity $y$-component expressed in the particle body frame (green axes in figure 1).
In figure 19, we report the results of a similar test performed for a crowd of particles at  $\rho _p/\rho _f=2$ in a turbulent flow with the forcing as the case Re30 of table 1 and $\phi =1\,\%$ ( $N_p=40$); once again the results show very good agreement with the analogous ones obtained in a cubic computational domain.
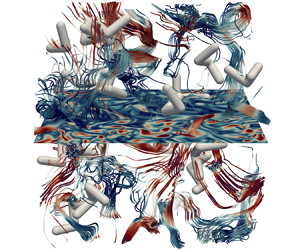
Crowd of chiral particles of  $\rho _p/\rho _f=2$ in a turbulent flow with the forcing of the Re30 case of table 1: (a) time evolution of the centre of mass vertical velocity component; (b) time evolution of angular velocity $y$-component expressed in the particle body frame (green lines in figure 1); (c) probability density function of the fluid vertical vorticity component; (d) streamlines of the non-dimensional velocity field coloured according to the vertical component ranging from $-0.3$ (blue) to $0.3$ (yellow).


 Open access

