


Non-technical Summary
The Paleocene–Eocene thermal maximum (PETM; 56 million years ago) was a major, sudden warming event caused by the release of a gigantic amount of carbon into the atmosphere and ocean. Earlier studies have shown that plants and animals changed greatly during this time, especially through major shifts in where they lived. We wanted to know whether pollination biology might also have changed during the PETM, so we looked at fossils from the Bighorn Basin, Wyoming, USA, which has a good fossil record for this time. We used three lines of evidence: (1) fossil pollen found in clumps, (2) the pollination mode of living plants related to the fossils, and (3) the total variety of pollen shape and form. All three lines are consistent with animal pollination becoming more common during the PETM, while wind pollination decreased. The decline in wind pollination reflects a loss of wind-pollinated plants in the Bighorn Basin. The increase in animal-pollinated plants reflects the dispersal to the Bighorn Basin of plants from warmer climates. These changes in the plants of the Bighorn Basin have been shown in earlier studies to be related to the climate during the PETM being hotter and seasonally drier than previously or afterward. We conclude that pollinating animals likely moved north during the PETM, along with the plants they pollinated. Changes in the types of flowers and their season of flowering may have affected the types and timing of food available for animal pollinators.
Introduction
The Paleocene–Eocene thermal maximum, or PETM, was a period of elevated global temperature, ocean acidification, and biotic turnover during the initial 150–200 kyr of the Eocene (Kennett and Stott Reference Kennett and Stott1991; Zachos et al. Reference Zachos, Lohmann, Walker and Wise1993, Reference Zachos, Wara, Bohaty, Delaney, Petrizzo, Brill and Balower2003; Gutjahr et al. Reference Gutjahr, Ridgwell, Sexton, Anagnostou, Pearson, Palike and Norris2017). The PETM was caused by the rapid release of thousands of petagrams of isotopically light carbon, which generated a negative carbon isotope excursion (CIE) of ~4–5‰ as well as ~5°C of global warming (Zachos et al. Reference Zachos, Pagani, Sloan, Thomas and Billups2001; Tierney et al. Reference Tierney, Zhu, Li, Ridgwell, Hakim, Poulsen, Whiteford, Rae and Kump2022). The CIE follows a characteristic pattern in both marine and terrestrial records, with an onset corresponding to increasing temperature and atmospheric carbon (Röhl et al. Reference Röhl, Westerhold, Bralower and Zachos2007; McInerney and Wing Reference McInerney and Wing2011; Baczynski et al. Reference Baczynski, McInerney, Wing, Kraus, Bloch, Boyer, Secord, Morse and Fricke2013) in a period of <10 kyr (Bowen et al. Reference Bowen, Maibauer, Kraus, Röhl, Westerhold, Steimke, Gingerich, Wing and Clyde2015). The CIE onset was followed by an ~100 kyr-long period of relatively stable carbon isotope composition known as the CIE body, and a shorter interval of 40–80 kyr during which atmospheric carbon isotope values decreased and returned to background levels, known as the CIE recovery (Bowen et al. Reference Bowen, Bralower, Delaney, Dickens, Kelly, Koch and Kump2006; McInerney and Wing Reference McInerney and Wing2011). Carbon release during the PETM caused global change not only in temperature (Dunkley Jones et al. Reference Dunkley Jones, Ridgwell, Lunt, Maslin, Schmidt and Valdes2010; Tierney et al. Reference Tierney, Zhu, Li, Ridgwell, Hakim, Poulsen, Whiteford, Rae and Kump2022), but also in the distribution of precipitation (Carmichael et al. Reference Carmichael, Inglis, Badger, Naafs, Behrooz, Remmelzwaal and Monteiro2017, Reference Carmichael, Pancost and Lunt2018), terrestrial biomes (Korasidis et al. Reference Korasidis, Wing, Shields and Kiehl2022b), and mammalian body size (Gingerich Reference Gingerich2003, Reference Gingerich2006; Secord et al. Reference Secord, Bloch, Chester, Boyer, Wood, Wing, Kraus, McInerney and Krigbaum2012).
The most studied continental record of the PETM is preserved in the Fort Union and Willwood Formations (Fm) of the Bighorn Basin (BHB), northwestern Wyoming, USA (e.g., Koch et al. Reference Koch, Zachos and Gingerich1992; Clyde and Gingerich Reference Clyde and Gingerich1998; Fricke et al. Reference Fricke, Clyde, O’Neil and Gingerich1998; Gingerich Reference Gingerich2003; Magioncalda et al. Reference Magioncalda, Dupuis, Smith, Steurbaut and Gingerich2004; Wing et al. Reference Wing, Harrington, Smith, Bloch, Boyer and Freeman2005, Reference Wing, Bloch, Bowen, Boyer, Chester, Diefendorf, Harrington, Kraus, Secord, McInerney, Crouch, Strong and Hollis2009; Kraus and Riggins Reference Kraus and Riggins2007; Smith et al. Reference Smith, Wing and Freeman2007; Secord et al. Reference Secord, Gingerich, Lohmann and MacLeod2010, Reference Secord, Bloch, Chester, Boyer, Wood, Wing, Kraus, McInerney and Krigbaum2012; Baczynski et al. Reference Baczynski, McInerney, Wing, Kraus, Bloch, Boyer, Secord, Morse and Fricke2013, Reference Baczynski, McInerney, Wing, Kraus, Bloch and Secord2017, Reference Baczynski, McInerney, Freeman and Wing2019; Kraus et al. Reference Kraus, McInerney, Wing, Secord, Baczynski and Bloch2013). Prior paleobotanical research on the PETM floras in the BHB showed major and rapid change in floral community composition across the hyperthermal (Wing et al. Reference Wing, Harrington, Smith, Bloch, Boyer and Freeman2005, Reference Wing, Bloch, Bowen, Boyer, Chester, Diefendorf, Harrington, Kraus, Secord, McInerney, Crouch, Strong and Hollis2009; Wing and Currano Reference Wing and Currano2013). Megafossil assemblages from the CIE body are dominated by Fabaceae, Arecaceae, and Hernandiaceae, taxa whose living members are important in tropical and subtropical areas, while assemblages from the late Paleocene and post-PETM early Eocene are dominated by Platanaceae, Hamamelidaceae, Betulaceae, Cercidiphyllaceae, Cupressaceae, and other groups with many living members in temperate regions (Wing Reference Wing1998; Wing et al. Reference Wing, Harrington, Smith, Bloch, Boyer and Freeman2005, Reference Wing, Bloch, Bowen, Boyer, Chester, Diefendorf, Harrington, Kraus, Secord, McInerney, Crouch, Strong and Hollis2009; Wing and Currano Reference Wing and Currano2013). Megafossils of long-ranging Paleocene–Eocene taxa belonging to these temperate-climate groups are notably absent from the CIE body. Palynofloral assemblages from early in the CIE body are dominated by palms (Areceaeae) and ferns, indicating frequent disturbance, then later by dry tropical linages (Korasidis and Wing Reference Korasidis and Wing2023). Most tropical palynomorphs (e.g., bombacoid Malvaceae) are restricted to the CIE body, and many temperate palynomorphs have gaps in their temporal ranges during the CIE (Korasidis and Wing Reference Korasidis and Wing2023; Korasidis et al. Reference Korasidis, Wing, Harrington, Demchuk, Gravendyck, Jardine and Willard2023), paralleling the stratigraphic pattern seen in the megafloral record. Despite taxonomic turnover in the flora and changes in plant–animal interactions inferred from damage marks on fossil leaves (Currano et al. Reference Currano, Wilf, Wing, Labandeira, Lovelock and Royer2008, Reference Currano, Laker, Flynn, Fogt, Stradtman and Wing2016), effects on pollination ecology have not been studied. Here, we examine whether the major change in floristics is accompanied by a change in the pollination mode of the flora.
Methods
Geological Setting
The Paleocene Fort Union and Paleocene–Eocene Willwood Formations are well exposed throughout the NW-SE–oriented BHB in northwestern Wyoming (Fig. 1). In most regions of the basin, the PETM has been identified as a 15- to 45-m-thick sequence of fluvial rocks and paleosols at or near the formational contact (Koch et al. Reference Koch, Zachos and Gingerich1992; Bowen et al. Reference Bowen, Koch, Gingerich, Norris, Bains and Corfield2001; Rose et al. Reference Rose2012; Baczynski et al. Reference Baczynski, McInerney, Wing, Kraus, Bloch, Boyer, Secord, Morse and Fricke2013; van der Meulen et al. Reference van der Meulen, Gingerich, Lourens, Meijer, van Broekhuizen, van Ginneken and Abels2020). The presence of the CIE has been demonstrated in a variety of independent proxies, including pedogenic CaCO3 nodules, total organic carbon (TOC), leaf waxes (n-alkanes), and mammalian tooth enamel (Koch et al. Reference Koch, Zachos and Gingerich1992; Bowen et al. Reference Bowen, Koch, Gingerich, Norris, Bains and Corfield2001; Magioncalda et al. Reference Magioncalda, Dupuis, Smith, Steurbaut and Gingerich2004; Wing et al. Reference Wing, Harrington, Smith, Bloch, Boyer and Freeman2005; Smith et al. Reference Smith, Wing and Freeman2007; Rose et al. Reference Rose2012; Secord et al. Reference Secord, Bloch, Chester, Boyer, Wood, Wing, Kraus, McInerney and Krigbaum2012; Baczynski et al. Reference Baczynski, McInerney, Wing, Kraus, Bloch, Boyer, Secord, Morse and Fricke2013; Clyde et al. Reference Clyde, Gingerich, Wing, Rohl, Westerhold, Bowen and Johnson2013; Foreman Reference Foreman2014; van der Meulen et al. Reference van der Meulen, Gingerich, Lourens, Meijer, van Broekhuizen, van Ginneken and Abels2020). These proxies have been used to identify the three CIE phases (onset, body, and recovery) in multiple BHB stratigraphic sections. To date, no palynofloras have been recovered from the CIE onset, so this study focuses on those from the CIE body (Korasidis et al. Reference Korasidis, Wing, Harrington, Demchuk, Gravendyck, Jardine and Willard2023). In this study, we assign samples to one of three time intervals: pre-CIE (late Paleocene), CIE body, and post-CIE (early Eocene). We include samples from the CIE recovery phase with those from the post-CIE early Eocene, because the CIE recovery is not stratigraphically well-delimited in all BHB sections (Secord et al. Reference Secord, Bloch, Chester, Boyer, Wood, Wing, Kraus, McInerney and Krigbaum2012; Baczynski et al. Reference Baczynski, McInerney, Wing, Kraus, Bloch, Boyer, Secord, Morse and Fricke2013).
Map of field area in the Bighorn Basin, Wyoming, USA. Circles designate locations of palynological samples in this study. Symbol colors indicate age of the samples relative to the carbon isotope excursion (CIE) (see key). Black lines indicate lines of composite sections of Korasidis and Wing (Reference Korasidis and Wing2023). Base map from Love and Christiansen (Reference Love and Christiansen1985). Fort Union Fm outcrop is brown, Willwood Fm is tan, Quaternary alluvium yellow, and green shades toward basin margins are various Cretaceous formations.

The samples for this study were collected from PETM exposures in three parts of the BHB that are correlated lithostratigraphically through bed tracing extensive, laterally continuous bedding horizons and local measurement of stratigraphic sections (Korasidis and Wing Reference Korasidis and Wing2023; Supplementary Table S1). The samples were collected from five types of fluvial subenvironments characterized by grain size, primary bedding, cross-sectional geometry, and proximity to paleochannels (Wing Reference Wing1984; Farley Reference Farley1989; Davies-Vollum and Wing Reference Davies-Vollum and Wing1998; Davies-Vollum Reference Davies-Vollum and Gingerich2001; Harrington Reference Harrington2001; Korasidis et al. Reference Korasidis, Wing, Nelson and Baczynski2022a; Table 1). In all five subenvironments, palynofloras were preserved via rapid burial by one or more sedimentation events.
Summary of depositional environments in the Bighorn Basin that yielded palynofloras for the pre-CIE (carbon isotope excursion), CIE body, and post-CIE. Modified from Korasidis et al. (Reference Korasidis, Wing, Nelson and Baczynski2022a)

Palynology
Palynofloras were recovered from 38 samples using palynological processing methods described by Korasidis et al. (Reference Korasidis, Wing, Harrington, Demchuk, Gravendyck, Jardine and Willard2023). Specimens were observed at 400× and 1000× magnification in transmitted light with a Nikon Eclipse 80i microscope and through a 100× Plan Fluor objective (numerical aperture of 1.3) using differential interference contrast where appropriate. Extended depth-of-field micrographs were created using Photoshop. Scanning electron microscopy was completed using an FEI Apreo FESEM with EDAX Octane EDS, at 3 kV and 0.2 nA at the National Museum of Natural History (NMNH), Smithsonian Institution. Individual grains were judged autochthonous using the criteria described by Korasidis et al. (Reference Korasidis, Wing, Nelson and Baczynski2022a). For each of the 60 autochthonous pollen taxa, one of us (V.A.K.) measured the maximum diameter of five specimens with an ocular micrometer (for four taxa, fewer than five specimens were available; see Supplementary Table S2). We did not use previously published information on the size ranges of these taxa because different preparation techniques and mounting media are known to influence pollen grain size (Mäkelä Reference Mäkelä1996; Riding Reference Riding2021). Details on the stratigraphic distribution of each measured taxon are provided in Supplementary Table S7.
Following the approach of Mander (Reference Mander2016) and Mander et al. (Reference Mander, Parins‐Fukuchi, Dick, Punyasena and Jaramillo2021), we scored each pollen taxon for six morphological characters, each with a different number of discrete, unordered character states: aperture type (60 character states), exine stratification type (4 states), shape (10 states), dispersal unit (6 states), primary surface ornamentation (22 states), and secondary surface ornamentation (23 states) (for terminology, see Punt et al. Reference Punt, Hoen, Blackmore, Nilsson and Le Thomas2007). Scoring of the character states for pollen taxa in this study was based on their original descriptions in the literature (see Supplementary Table S3). The morphological distances between pairs of taxa were quantified using the Hamming distance, which assigns a 0 if two taxa have the same state for a character and a 1 if they have different states. The sum of the number of differences is divided by the total number of characters (Hamming Reference Hamming1950), which in this dataset is six. The Hamming distances were calculated using a function written in the open-source R statistical computing environment (see Supplementary Material).
All residues and slides are housed in the Department of Paleobiology at the NMNH (Supplementary Table S1). For each pollen sample, we also measured grain size and weight percent TOC using methods previously reported by Korasidis et al. (Reference Korasidis, Wing, Nelson and Baczynski2022a). All statistical tests were performed in R (R Core Team 2024).
Inferring Pollination Mode from Fossil Evidence
Pollination modes are commonly inferred from pollination syndromes—sets of morphological traits that correlate with pollination mode—for fossil and modern plants, particularly when no (or few) pollinator observations exist in the fossil record (e.g., Ramírez et al. Reference Ramírez, Gravendeel, Singer, Marshall and Pierce2007) or in respective modern plant groups (Dellinger Reference Dellinger2020). Despite strong debate about the reliability of pollination syndromes to infer pollination modes (Waser et al. Reference Waser, Chittka, Price, Williams and Ollerton1996; Smith et al. Reference Smith, Ané and Baum2008; Ollerton et al. Reference Ollerton, Alarcón, Waser, Price, Watts, Cranmer, Hingston, Peter and Rotenberry2009), several studies have verified this approach (Rosas-Guerrero et al. Reference Rosas‐Guerrero, Aguilar, Martén‐Rodríguez, Ashworth, Lopezaraiza‐Mikel, Bastida and Quesada2014 and references therein). In the fossil record, pollination syndromes have traditionally been inferred using other proxies, because the modern traits used to characterize pollination syndrome, (e.g., floral color, scent, and morphology; Fenster et al. Reference Fenster, Armbruster, Wilson, Dudash and Thomson2004), are rarely preserved. In this study, we consider pollen size distribution, pollen morphology and exine modifications, and pollen clump prevalence in sediments as proxies for pollination syndromes. We also consider the pollination mode of nearest living relatives (NLRs) of fossil pollen taxa and the available animal pollinators in Paleocene–Eocene North America. Concordance among these lines of evidence may indicate changes in pollination ecology across the Paleocene/Eocene boundary, even though pollination cannot be directly observed.
Fossil pollen clumps, also known as pollen aggregates or pollen clusters (Farley Reference Farley1990; Grímsson et al. Reference Grímsson, Zetter, Grimm, Pedersen, Pedersen and Denk2015; Hofmann et al. Reference Hofmann, Egger and King2015; Hofmann and Gregor Reference Hofmann and Gregor2018; Korasidis et al. Reference Korasidis, Wallace, Tosolini and Hill2020; Wagstaff et al. Reference Wagstaff, Gallagher, Hall, Korasidis, Rich, Seegets-Villiers and Vickers-Rich2020), form when individual grains stick together because pollen filaments tangle, viscous substances (e.g., pollenkitt) are deposited by the anther tapetum, or groups of pollen grains possess common walls at the time of anther dehiscence (Pacini and Franchi Reference Pacini, Franchi, Clement, Pacini and Audran1999). Pollen clumping is rare in wind-pollinated plants, because the clumps have higher settling rates than individual grains, reducing the potential dispersal distance of the pollen (Niklas and Buchmann Reference Niklas and Buchmann1988). Pollenkitt adhesiveness results not only in clumping of grains but also in pollen retention in the anther, enhanced adhesion to pollinators, and/or the transport of multiple pollen grains to the stigma. All these characteristics are advantageous for animal-pollinated plants (Faegri and van der Pijl Reference Faegri and van der Pijl1966), although pollen clumps are also occasionally observed in wind-pollinated species (De Benedetti et al. Reference De Benedetti, Zamaloa and Gandolfo2023). If taphonomic/depositional factors are similar between fossil pollen samples, a greater abundance of pollen clumps in one should indicate a higher proportion of animal pollination, although it should be noted that fossil pollen clumps have also been interpreted to indicate autochthonous deposition with minimal transport (Andersen Reference Andersen1974).
The size of pollen grains also varies between pollination modes. In general, wind-pollinated (i.e., abiotic, anemophilous) species produce pollen of a moderate size, with proposed sizes ranging between 15–35 μm (Traverse Reference Traverse2007), 20–30 μm (Faegri and van der Pijl Reference Faegri and van der Pijl1966), and 20–40 μm (Whitehead Reference Whitehead1969). In contrast, animal-pollinated species (i.e., biotic, insect, mammal, entomophilous, zoophilous) produce pollen with large size variability, including proposed ranges of 5–200 μm (Wodehouse Reference Wodehouse1935), 10–300 μm (Faegri and van der Pijl Reference Faegri and van der Pijl1966), and <10 μm and > 40 μm (Traverse Reference Traverse2007).
The NLR approach involves inferring the pollination mode of fossil plants based on their present-day living relatives. Similar to the approach of phylogenetic bracketing (Witmer Reference Witmer and Thomason1995), it assumes phylogenetic conservatism, or a lack of evolution in pollen mode over time within a group. The unchanged morphology of the reproductive features of plants, including their pollen, for tens of millions of years (Conran et al. Reference Conran, Lee, Lee, Bannister and Kaulfuss2014; Grímsson et al. Reference Grímsson, Grimm and Zetter2017) supports this premise.
Numerous studies have also suggested that modifications to pollen exines may relate to the pollination mode of the taxa. Ornate or strongly sculptured pollen exines generally characterize animal-pollinated species, whereas those with smooth surfaces are commonly associated with wind pollination (Whitehead Reference Whitehead1969; Chaloner Reference Chaloner, Ferguson and Muller1976; Faegri and van der Pijl Reference Faegri and van der Pijl1979). More recently, Mander et al. (Reference Mander, Parins‐Fukuchi, Dick, Punyasena and Jaramillo2021) demonstrated that pollen grains of biotically pollinated plants are significantly more morphologically diverse than those of abiotically pollinated plants, even though they found no specific pollen morphological traits that reliably distinguished animal from abiotically pollinated plants.
Results
Pollen Concentration
The pollen concentration of individual samples varies from 2618 to 1,481,208 grains per cubic centimeter (Supplementary Table S4). A Kruskal-Wallis test revealed a significant difference in the pollen concentration of samples from the three time intervals (p = 0.033). Samples from the CIE body have lower median pollen concentrations than do those of the pre-CIE and post-CIE, although the values overlap. Pollen concentration is predicted by neither the TOC of the sample (R 2 = 0.0131) nor the silt:clay ratio (R 2 = 0.0026).
Effect of Depositional Environment
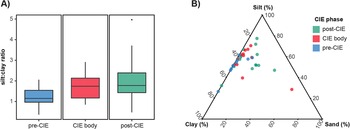
The relationship between grain size and time period is plotted in Figure 2. We recognize no relationship between the time intervals and the silt:clay ratio or between the time intervals and the percent clay, percent silt, and percent sand. A Kruskal-Wallis test of the silt:clay ratio did not show significant heterogeneity among the time periods (p = 0.055).
Relationship between grain size and carbon isotope excursion (CIE) phase for palynoflora-bearing samples. A, Silt:clay ratio vs. CIE phase; B, grain-size ternary diagram. Several samples from the CIE body overlap with those of the pre- and post-CIE. Plots use data presented herein and in Korasidis et al. (Reference Korasidis, Wing, Nelson and Baczynski2022a), with colors indicating sample age relative to the CIE (see key).

Pollen Clumps
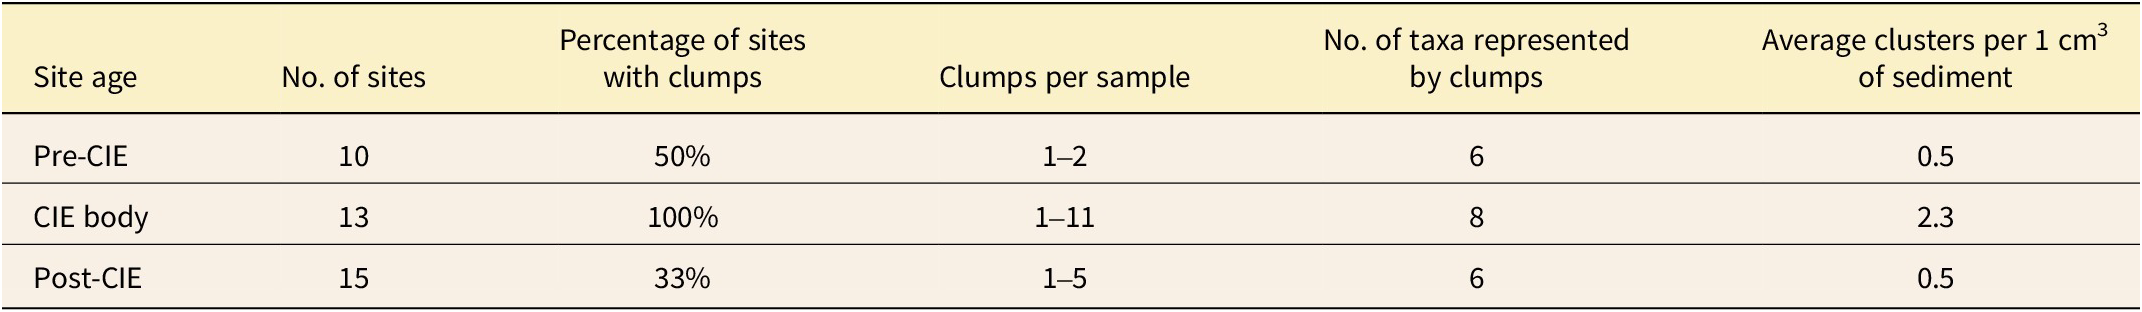
All pollen clumps are monospecific and consist of variable numbers of mature grains (see Figure 3). Notably, they are not preserved within pollen sacs, the theca wall, or microsporangial tissue. The concentration of pollen clumps increases during the CIE body (Table 2) based on data generated during standard counts (Supplementary Table S4). Analyzing the data with Fisher’s exact test yields a significant (p = 0.001) result. Pollen clump frequency and diversity also increase during the CIE body (Table 2). There is a negligible relationship between the concentration of pollen clusters and TOC (R 2 = <0.1), the silt:clay ratio (R 2 = 0.0285), or the total pollen concentration (R 2 = 0.0031).
Clumps of pollen recovered from the Bighorn Basin, Wyoming, USA. Scale bars, 10 μm. England Finder References (EFR) are given for specimens photographed in transmitted light. CIE, carbon isotope excursion. A, Aesculiidites circumstriatus, site SLW0606 (CIE body), slide 2, V35/0. B, Aesculiidites circumstriatus, site SLW0606 (CIE body), slide A. C, Aesculiidites circumstriatus, site SLW0606 (CIE body), slide A. D, Arecipites tenuiexinous, site SLW0606 (CIE body), slide 3, S23/3. E, Arecipites tenuiexinous, site PS0504 (CIE body), slide A. F, Rousea linguiflumena, site SLW0601 (CIE body), slide A.

Comparison of clump frequency, counts, and diversity in the Bighorn Basin for the pre-CIE (carbon isotope excursion), CIE body, and post-CIE in all depositional environments

Pollen Size Distribution
The median size of pollen grains, determined from species’ medians (Supplementary Table S2), increases from ~29.52 μm pre-CIE to ~30.49 μm during the CIE body, then returns to ~29.33 μm post-CIE (Fig. 4). The Kruskal-Wallis test on species’ medians (Supplementary Table S2) did not suggest significant differences in pollen size among the three time intervals (p = 0.920). The spread of the middle 50% of values (i.e., the interquartile distribution) is also largest for the CIE body, followed by the post- and pre-CIE (Table 2). Analyzing the median pollen size data (Table 2), assimilated into a contingency table (Supplementary Table S8), with Fisher’s exact test yields a nonsignificant (p = 0.440) result.
Box-and-whisker plots of pollen grain size in the pre-CIE (carbon isotope excursion), CIE body, and post-CIE. The median pollen size, represented by the thick line, increases slightly during the CIE body. The pre-CIE contains 4 gymnosperm and 33 angiosperm taxa; the CIE body, 3 gymnosperm and 27 angiosperm taxa; and the post-CIE 3 gymnosperm and 39 angiosperm taxa (Supplementary Table S7). B, estimated size range of biotically pollinated species (Traverse Reference Traverse2007); W, approximate size range of wind-pollinated species (20–40 μm; Whitehead Reference Whitehead1969).

Angiosperm Pollen Disparity
The pairwise morphological disparity of angiosperm pollen taxa increased during the CIE body compared with the pre- and post-CIE time intervals, as measured by Hamming distances (Fig. 5). A Kruskal-Wallis test shows that the distribution of Hamming distances are not the same among the three time periods (p = 0.0000004). Dunn’s tests show that the distribution of Hamming distances is significantly different between the pre-CIE and CIE body (p = 0.0000004), between the pre-CIE and post-CIE (p = 0.00035), and between the CIE body and post-CIE (p = 0.0182). The higher morphological disparity during the PETM is caused by the appearance of 10 angiosperm taxa restricted to the CIE body that have unusual character states such as pantoporate apertures, and foveolate and microfoveolate surface ornamentation.
Pairwise dissimilarity of angiosperm pollen taxa for each time interval quantified by Hamming distances. The bars indicate the proportion of all pairwise Hamming distances for the indicated time interval. There was a significant increase in the pairwise dissimilarity of angiosperm pollen taxa during the carbon isotope excursion (CIE) (p < 0.001; Kruskal-Wallis test). The pre-CIE flora has 33 taxa (528 Hamming distances); the CIE body 27 (351); and the post-CIE 39 (741). Note that for this dataset, Hamming distances can only have seven discrete values.

Nearest Living Relatives
Taxa with known living relatives (Supplementary Table S5) were assigned a pollination ecology based on the pollination strategies employed by their present-day living relatives (Supplementary Table S6). The term “mixed” (i.e., ambophilous) is used to describe species that employ both wind- and animal-pollination strategies. Most NLRs of the pre-CIE flora are wind pollinated, followed by mixed and biotic pollination strategies (Fig. 6). This pattern is inverted during the CIE—the NLRs of most taxa found in the CIE body are biotically pollinated, with fewer living relatives having mixed or wind pollination. The NLRs of the post-CIE Eocene floras are once again mostly wind pollinated, with a smaller proportion of related living taxa having mixed or biotic pollination. Analyzing the NLR pollination mode occurrence data (Supplementary Table S7) with Fisher’s exact test yields a significant (p = 0.008) result, indicating a relationship exists between time intervals and the pollination modes of NLRs.
Comparison of pollination strategy employed by nearest living relatives (NLRs) of all gymnosperm and angiosperm species recovered in the Bighorn Basin. N = 37 (pre-CIE), 30 (CIE body), and 42 (post-CIE), with N representing the number of NLRs in each time interval. Palynofloral presence–absence data, generated by Korasidis and Wing (Reference Korasidis and Wing2023), facilitated the calculation of the percentages of palynotaxon NLRs for each time interval (Supplementary Table S7).

Discussion
Palynosedimentation
Fossil spores and pollen (collectively sporomorphs) can travel in air or water from a few meters to several hundreds of kilometers from their source plant before they are deposited (Muller Reference Muller1959; Cross et al. Reference Cross, Thompson and Zaitzeff1966; Faegri and Iversen Reference Faegri and Iversen1975; Mandrioli et al. Reference Mandrioli, Negrini, Cesari and Morgan1984). Despite the many factors that can influence the extent to which individual sporomorphs can be transported in water, including their saturation potential or lack thereof (i.e., the buoyancy of bisaccates; Traverse Reference Traverse2007), their size (i.e., smaller grains have a greater transport potential; Muller Reference Muller1959), or their specific gravities (i.e., the propensity to sink if the grain is more dense; Holmes Reference Holmes and Traverse1994), most sporomorph types are rapidly transported in water bodies. In fluvial settings, many sporomorphs may be deposited as they are trapped by the descending sediment or by disruption in turbulent eddies, which involves trapping pollen between sand grains (Holmes Reference Holmes and Traverse1994).
Understanding the input sources of sporomorphs into abandoned channels, the depositional environment largely responsible for preserving CIE body palynofloras (Korasidis and Wing Reference Korasidis and Wing2023), is critical. Considering previous work on pollen transport (i.e., Tauber Reference Tauber1967; Jacobson and Bradshaw Reference Jacobson and Bradshaw1981; Prentice Reference Prentice1985), we propose that the pollen assemblages in this study arrived at abandoned channel depositional sites in four ways: (1) falling off plants immediately surrounding the depositional site (parautochthonous), (2) in water brought into intermittently used channels during periods of high flow (allochthonous waterborne), (3) by direct deposition onto the water surface as isolated grains from “regional” airfall (allochthonous wind-borne), and (4) in sediment derived from eroded floodplains (reworked grains) (Fig. 7).
Summary of possible sporomorph input sources. The four main sources include: (1) hyperlocal (parautochthonous) vegetation, (2) the active channel overflow, (3) regional airfall and/or waterborne in the active channel, and (4) reworked taxa from floodplain. Artwork by Theodora Korasidis.

Pollen from overhanging plants dropped vertically onto the water surface (Faegri and Iversen Reference Faegri and Iversen1975; Jacobson and Bradshaw Reference Jacobson and Bradshaw1981) represents a hyperlocal source (Fig. 7-1). The pollen sourced in this manner can fall, including as part of a raindrop, while entrapped in anthers, microsporangia, or in large clusters (Jackson Reference Jackson and Traverse1994). Most of the pollen originates from local plants growing within a few meters of the depositional setting (Faegri and Iversen Reference Faegri and Iversen1975). For small depositional settings (i.e., abandoned channels or small lakes), hyperlocal pollen tends to dominate the input regardless of whether the source plant produces small or large amounts of well- or poorly dispersed pollen (Holmes Reference Holmes and Traverse1994).
Another source of pollen is that derived via overflow of the active channel (Fig. 7-2). This pollen is generally sourced from trees growing within the watershed and from ground cover plants, which largely deposit pollen within 25 m of the source plant (Jackson Reference Jackson and Traverse1994). Another important source of pollen in the active channel is pollen derived from surface runoff. This includes pollen deposited on leaves, stems, and the ground around the source plant (Holmes Reference Holmes and Traverse1994).
Pollen from a larger region can be lofted from the canopy by turbulent wind currents before being transported to the water surface in raindrops (McDonald Reference McDonald1962; Tauber Reference Tauber1967; Fig. 7-3). Likewise, pollen carried in the active fluvial channel can derive from trees growing in distant regions (i.e., tens of kilometers away) and provides a more regional source of pollen (Jackson Reference Jackson and Traverse1994).
Pollen in the active fluvial channel can also be derived from the erosion of older floodplain sediments that preserve pollen (Fig. 7-4). Erosion of pollen-rich floodplain sediment can also remobilize stratigraphically older pollen, resulting in reworked pollen that often bears physical signs of damage or partial destruction that occurs during the process of reworking (Muir Reference Muir1967; Korasidis et al. Reference Korasidis, Wing, Nelson and Baczynski2022a).
Judging from the high dominance of a few taxa in most of the BHB samples, they are probably dominated by local, parautochthonous vegetation (Korasidis and Wing Reference Korasidis and Wing2023). This interpretation is supported by the preservation in the same sediments of macroscopic plant remains such as leaves that are too fragile to undergo long-distance transport (Ferguson Reference Ferguson1985; Wing et al. Reference Wing, Harrington, Smith, Bloch, Boyer and Freeman2005; Wing and Currano Reference Wing and Currano2013). This local source includes pollen clumps, which have limited dispersal distances due to their high settling rates and fragile nature (Niklas and Buchmann Reference Niklas and Buchmann1988). These pollen clumps likely entered the depositional environment either as dispersed pollen shed from open anthers directly onto the surface of abandoned channel ponds or as mature grains in fragments of unopened anthers (De Benedetti et al. Reference De Benedetti, Zamaloa and Gandolfo2023). There is no evidence that the pollen clumps in this study result from insect activity, as no clumps contain more than one pollen type, and there are no signs of packaging or damage from insect chewing and digestion (Hu et al. Reference Hu, Dilcher, Jarzen and Taylor2008). The presence of some plant groups in the palynoflora that are rare or unknown from the leaf flora (e.g., bombacoids, ferns; Korasidis and Wing Reference Korasidis and Wing2023) suggests that the palynofloral assemblages also include rare floral elements derived from more distant plants, arriving via water and/or airfall (Fig. 7).
Sedimentologic and Taphonomic Considerations
Before discussing the implications of our results for pollination strategy we consider the possibility that changes in pollen clump concentration might be caused by changes in the depositional environment. If the concentration of pollen clumps reflects sedimentary or preservational processes, we should expect pollen clump concentration to covary with sedimentary attributes. Instead, we find the opposite. Pollen clump concentration bears no relationship to the grain size of sample sediment, to TOC, or even to the total pollen concentration, attributes that themselves do not vary significantly among the time bins. This does not favor hypotheses that invoke changes in the depositional or preservational environment to explain the increase in clump concentration during the CIE body. Notably, all pollen samples from the CIE body are drawn from mudstones deposited in abandoned or active channels, whereas pre- and post-CIE samples include mudstones deposited in fluvial backswamps as well as abandoned channels. The absence of fluvial backswamps during the CIE body has been attributed to more pervasive pedogenic oxidation on BHB floodplains (Kraus and Riggins Reference Kraus and Riggins2007; Kraus et al. Reference Kraus, McInerney, Wing, Secord, Baczynski and Bloch2013). The absence of floodplain swamp deposits during the CIE body makes it less likely that palynomorphs could have been stored and concentrated in wet floodplain soils from which they could have later been eroded and redeposited in abandoned channels (Fig. 7-4). A decrease in organic-rich floodplain sediment during the CIE body might have reduced the amount of pollen available to rework into abandoned channel plugs, but it does not provide a mechanism for increasing the concentration per gram of sediment of pollen clumps, which is what we observe. We find no reason to attribute the increased concentration of pollen clumps during the CIE body to sedimentological or taphonomic processes.
Pollination Strategies across the PETM
The increase in pollen clump concentration during the CIE body, the greater morphological disparity of angiosperm pollen types, and the increased proportion of CIE body taxa that have animal-pollinated NLRs, are all consistent with a transient increase during the CIE in the proportion of plants that were animal pollinated. This community-level change in pollination ecology did not result from evolution within lineages but from the dramatic change in floral composition associated with the PETM as reflected not only in palynofloral composition but also leaf fossils (Wing et al. Reference Wing, Harrington, Smith, Bloch, Boyer and Freeman2005, Reference Wing, Bloch, Bowen, Boyer, Chester, Diefendorf, Harrington, Kraus, Secord, McInerney, Crouch, Strong and Hollis2009; Wing and Currano Reference Wing and Currano2013; Korasidis and Wing Reference Korasidis and Wing2023; Korasidis et al. Reference Korasidis, Wing, Harrington, Demchuk, Gravendyck, Jardine and Willard2023).
It has been proposed that dense, evergreen tropical forest canopies do not favor wind pollination because of reduced wind velocity (Whitehead Reference Whitehead1969), but there is also a high frequency of animal pollination in dry tropical forests with more open canopies (Daubenmire Reference Daubenmire1972; Bawa et al. Reference Bawa, Bullock, Perry, Coville and Grayum1985; Ritchie Reference Ritchie1995; Ollerton et al. Reference Ollerton, Johnson, Hingston, Waser and Ollerton2006, Reference Ollerton, Winfree and Tarrant2011). The evergreen, closed-canopy wet temperate forests of the Southern Hemisphere (i.e., Tasmania or lowland New Zealand) are predominantly wind pollinated in spite of their year-round dense canopies (Regal Reference Regal1982). The prevalence of wind pollination in high latitudes could also be a historical artifact of biogeographic chance, with tree lineages adapted to the cold, seasonal climates of the Northern Hemisphere happening to be wind pollinated (Daubenmire Reference Daubenmire1972). In agreement, a more recent study found no evidence that ecological conditions in temperate regions favored the evolution of wind pollination (Friedman and Barrett Reference Friedman and Barrett2008). As such, the positive correlation between latitude and biotic pollination in the present day does not necessarily indicate it is advantageous to be animal pollinated in warm climates. Similarly, the apparent increase in biotic pollination during the PETM in the BHB may be a side effect of the immigration of animal-pollinated lineages into the region rather than an indication that biotic pollination was favored in and of itself by the warmer climate.
Candidates for PETM pollination
Candidates for biotic pollination during the CIE body include insects and vertebrates. While there is copious evidence for terrestrial vertebrates in North America across the PETM (e.g., Gingerich Reference Gingerich2003, Reference Gingerich2006; Gingerich and Smith Reference Gingerich and Smith2006; Yans et al. Reference Yans, Strait, Smith, Dupuis, Steurbaut and Gingerich2006; Beard and Dawson Reference Beard and Dawson2009; Smith Reference Smith2009; Rose et al. Reference Rose2012; Secord et al. Reference Secord, Bloch, Chester, Boyer, Wood, Wing, Kraus, McInerney and Krigbaum2012; Bourque et al. Reference Bourque, Hutchison, Holroyd and Bloch2015), terrestrial insect fossils are poorly known.
Early Eocene insect faunas have, however, been recovered in amber deposits from North America, Asia, and Europe. This includes the Hat Creek amber deposit, British Colombia, Canada (Archibald and Makarkin Reference Archibald and Makarkin2004), the Fushun amber of Liaoning, China (Engel and Xie Reference Engel and Xie2024), and the Oise amber of France, of which the last notably preserves more than 300 arthropod species and includes at least 17 orders (Brasero et al. Reference Brasero, Nel and Michez2009). Likewise, the late early Eocene Green River Formation of the United States preserves hundreds of species of fossil insects, including members of the order Coleoptera, Diptera, and Hymenoptera (Spaspjevic et al. 2018). Although a direct record of insect pollinators across the PETM is absent, the major orders of modern pollinating insects were all diverse at the time.
Changes in the insect community during the PETM in the BHB have been inferred indirectly from damage on fossil leaves (Currano et al. Reference Currano, Laker, Flynn, Fogt, Stradtman and Wing2016) and burrow trace fossils (Smith et al. Reference Smith, Hasiotis, Kraus and Woody2009). Rates of herbivory on PETM leaves suggest a significant increase in insect abundance and diversity in the BHB during the PETM (Currano et al. Reference Currano, Wilf, Wing, Labandeira, Lovelock and Royer2008, Reference Currano, Laker, Flynn, Fogt, Stradtman and Wing2016). Given that many insects that are herbivorous in larval life stages are pollinators as adults (Jacobsen and Raguso Reference Jacobsen and Raguso2018), it is quite plausible there were increases in pollinator as well as herbivore abundance and diversity during the PETM in the BHB. If the larval stages of insect pollinators left distinctive damage types on PETM leaves in the BHB, we would predict that similar damage types would be found on late Paleocene fossil leaves from the Gulf Coastal Plain or southern Rocky Mountain regions. This would be consistent with co-dispersal of plants and insects northward within North America during the PETM. Different damage types on PETM leaves from the BHB and late Paleocene leaves from southern North America would suggest different range changes in plants and herbivorous insects and the possibility that host–pollinator interactions were also altered by the PETM.
In modern arid settings or during the low rainfall season of the dry tropics, settings similar to those inferred for the BHB during the PETM, animals not only facilitate pollination, but also fruit dispersal. Fruits can provide a critical source of moisture for animals, including pollinators, that do not estivate or emigrate (Janzen Reference Janzen1967; Regal Reference Regal1982). Although a variety of angiosperms are vertebrate pollinated (Aslan et al. Reference Aslan, Zavaleta, Tershy and Croll2013), seed dispersal by vertebrates has been argued to play a vital role in angiosperm evolution and diversification (Tiffney Reference Tiffney1984, Reference Tiffney2004; Wing and Tiffney Reference Wing and Tiffney1987; Eriksson Reference Eriksson2016). The angiosperm radiation from the mid- to Late Cretaceous corresponded with a shift in herbivory among multituberculates and diversification among therian mammals that favored small-bodied insectivores (Grossnickle and Polly Reference Grossnickle and Polly2013). During the Paleocene and early Eocene, rodents, stem primates (“plesiadapiforms” or “pan-primates”; Chester and Sargis Reference Chester, Sargis, de Queiroz, Cantino and Gauthier2020), and crown primates may have played an important role as seed dispersers through long-term diffuse coevolutionary interactions with angiosperms (Rasmussen Reference Rasmussen1990; Sussman Reference Sussman1991; Bloch and Boyer Reference Bloch and Boyer2002; Bloch et al. Reference Bloch, Silcox, Boyer and Sargis2007; Sussman et al. Reference Sussman, Rasmussen and Raven2013; Eriksson Reference Eriksson2016; Wilson Mantilla et al. Reference Wilson Mantilla, Chester, Clemens, Moore, Sprain, Hovatter, Mitchell, Mans, Mundil and Renne2021; Génin et al. Reference Génin, Mazza, Pellen, Rabineau, Aslanian and Masters2022). While bats and birds are not known to have played central roles as angiosperm pollinators before the early Eocene, primates and marsupials are very likely to have assisted in direct pollination of early angiosperms during their time of increasing and peak diversity (Sussman and Raven Reference Sussman and Raven1978; Génin et al. Reference Génin, Mazza, Pellen, Rabineau, Aslanian and Masters2022).
One of the greatest impacts to terrestrial vertebrates in the PETM record of the BHB was the significant increase in mammalian diversity over the preceding late Paleocene, which was maintained into the early Eocene after the CIE recovery (Rose Reference Rose1981; Gingerich Reference Gingerich1989; Heinrich et al. Reference Heinrich, Strait and Houde2008; Rose et al. Reference Rose2012). This increased diversity included a variety of new mammalian lineages, including many of small body size, such as eulipotyphlans (Smith et al. Reference Smith, Bloch, Strait and Gingerich2002; Vitek et al. Reference Vitek, Morse, Boyer, Strait and Bloch2021), marsupials (Rose et al. Reference Rose2012), stem primates (Strait Reference Strait2001; Rose et al. Reference Rose2012), and crown primates (Gingerich Reference Gingerich1993; Smith et al. Reference Smith, Rose and Gingerich2006; Morse et al. Reference Morse, Chester, Boyer, Smith, Smith, Gigase and Bloch2019). Small-bodied, arboreal mammals are most relevant given the role modern arboreal mammals play in both pollination and seed dispersal. Although screenwash sampling for small PETM mammals has occurred at a variety of localities spanning the CIE in the BHB (e.g., Morse et al. Reference Morse, Chester, Boyer, Smith, Smith, Gigase and Bloch2019; Vitek et al. Reference Vitek, Morse, Boyer, Strait and Bloch2021), full faunal assemblages from sites that produce micromammals have been published for only a few localities that occur low in the CIE (Strait Reference Strait2001; Gingerich and Smith Reference Gingerich and Smith2006; Rose et al. Reference Rose2012). One of these, the Castle Gardens locality (UCMP locality 99019; Strait Reference Strait2001; Yans et al. Reference Yans, Strait, Smith, Dupuis, Steurbaut and Gingerich2006), has produced hundreds of small mammal specimens and is dominated by the multituberculate Ectypodus tardus; several species of eulipotyphlan insectivores, including Macrocranion junnei; and uintasoricine stem primates classified in the genus Niptomomys. These few taxa together comprise more than one-third of all specimens recovered from Castle Gardens (Fet and Strait Reference Fet and Strait2006). While highly productive, this locality occurs below the stratigraphic level marking the earliest appearance of crown primates in North America (Morse et al. Reference Morse, Chester, Boyer, Smith, Smith, Gigase and Bloch2019). The Amy’s Hill locality (WW-74; Rose et al. Reference Rose2012) occurs higher in the CIE body and includes crown primates. Of the >100 small mammal specimens described from this site, more than half are either primates (stem or crown) or insectivorous eulipotyphlans, with small, likely insectivorous marsupials comprising an additional 13% of this fauna.
The multituberculates, marsupials, eulipotyphlans, and primates that dominate small mammal PETM faunas from the BHB are members of the very mammal groups that have been argued to coevolve with angiosperms, either playing a direct role in their pollination and dispersal, or preying on their insect pollinators. Conspicuously, stem and crown primates (Szalay Reference Szalay1976; Covert Reference Covert1988; Gebo Reference Gebo1988; Gebo et al. Reference Gebo, Dagosto and Rose1991, Reference Gebo, Smith and Dagosto2012, Reference Gebo, Smith, Dagosto and Smith2015; Bloch and Boyer Reference Bloch, Boyer, Ravosa and Dagosto2007; Bloch et al. Reference Bloch, Silcox, Boyer and Sargis2007; Kirk et al. Reference Kirk, Lemelin, Hamrick, Boyer and Bloch2008; Rose et al. Reference Rose, Chester, Dunn, Boyer and Bloch2011), nyctitheriid eulipotyphlans (Hooker Reference Hooker2014; Manz and Bloch Reference Manz and Bloch2015; Manz et al. Reference Manz, Chester, Bloch, Silcox and Sargis2015), and marsupials (Kurz Reference Kurz2005; Rose Reference Rose2012) all have postcranial morphology consistent with habitually occupying an arboreal substrate. Considered with the increased rate and diversity of insect damage during the CIE body in the PETM (Currano et al. Reference Currano, Wilf, Wing, Labandeira, Lovelock and Royer2008, Reference Currano, Laker, Flynn, Fogt, Stradtman and Wing2016), these observations are consistent with diverse animal herbivores, pollinators, and dispersers playing an important role in PETM terrestrial ecosystems. Many of the small mammals in this group were endemic to North America, yet others such as the abundant insectivore Macrocranion junnei and the earliest crown primate Teilhardina brandti were likely immigrants from Eurasia via high-latitude land bridges (Smith et al. Reference Smith, Bloch, Strait and Gingerich2002, Reference Smith, Rose and Gingerich2006; Morse et al. Reference Morse, Chester, Boyer, Smith, Smith, Gigase and Bloch2019).
Mechanisms for Shifting Pollination during the PETM
The rapid increase in water stress (Kraus and Riggins Reference Kraus and Riggins2007; Kraus et al. Reference Kraus, McInerney, Wing, Secord, Baczynski and Bloch2013; Woody et al. Reference Woody, Smith, Kraus and Hasiotis2014; Baczynski et al. Reference Baczynski, McInerney, Wing, Kraus, Morse, Bloch, Chung and Freeman2016) and temperature (Fricke et al. Reference Fricke, Clyde, O’Neil and Gingerich1998; Secord et al. Reference Secord, Gingerich, Lohmann and MacLeod2010; Snell et al. Reference Snell, Thrasher, Eiler, Koch, Sloan and Tabor2013) during the CIE body forced basin-wide extirpation of select plants and permitted immigration of more thermophilic and drought-tolerant lineages from other regions into the BHB (Wing et al. Reference Wing, Harrington, Smith, Bloch, Boyer and Freeman2005; Wing and Currano Reference Wing and Currano2013; Korasidis and Wing Reference Korasidis and Wing2023). Given that pollination strategy is maintained when plants change their geographic range (Devoto et al. Reference Devoto, Zimmermann and Medan2007; Hegland et al. Reference Hegland, Nielsen, Lázaro, Bjerknes and Totland2009), it is feasible that pollinators may have tracked range shifts in their host plants, explaining the transient increase in biotic pollination during the CIE body. One potential source of these biotic pollinators is the Gulf Coastal Plain, as has been inferred as the source for the palynoflora (Korasidis et al. Reference Korasidis, Wing, Harrington, Demchuk, Gravendyck, Jardine and Willard2023) and macroflora (Wing and Currano Reference Wing and Currano2013). The increase in floodplain wetness post-CIE, supported by the formation of purplish rather than red paleosols, loss of pedogenic CaCO3 nodules in the SE BHB, and increase in organic-rich sediments (Kraus and Riggins Reference Kraus and Riggins2007; Wing et al. Reference Wing, Bloch, Bowen, Boyer, Chester, Diefendorf, Harrington, Kraus, Secord, McInerney, Crouch, Strong and Hollis2009; Adams et al. Reference Adams, Kraus and Wing2011; Baczynski et al. Reference Baczynski, McInerney, Wing, Kraus, Bloch, Boyer, Secord, Morse and Fricke2013; Kraus et al. Reference Kraus, McInerney, Wing, Secord, Baczynski and Bloch2013; van der Meulen et al. Reference van der Meulen, Gingerich, Lourens, Meijer, van Broekhuizen, van Ginneken and Abels2020), not only facilitated the return of many mesic plant types but the subsequent decline of palynotaxa with relatives living in tropical or dry tropical climates (Korasidis and Wing Reference Korasidis and Wing2023), and presumably their associated pollinators. A rapid change in floristic composition driven by climate change may therefore explain the change in pollination mode from wind to biotic and back to wind across the PETM.
We do not know how geographically widespread the increase in animal pollination was during the PETM. Given that the change appears to be driven by the temporary extirpation of wind-pollinated taxa and temporary appearances of animal-pollinated taxa, rather than within-lineage evolution, changes in animal pollination during the PETM in other regions would likely depend on the magnitude and type of floral turnover. We see the increase in animal pollination as a side effect of climate-driven floral change. In regions with little or no extirpation during the CIE (e.g., the Hanna Basin; Deschesne et al. Reference Dechesne, Currano, Dunn, Higgins, Hartman, Chamberlain and Holm-Denoma2020), decreases in wind-pollinated palynomorphs might be smaller; however, the appearance of tropical palynotaxa similar to those observed in the BHB may produce a detectable increase in the relative abundance of biotically pollinated NLRs.
Conclusions
-
1. Most pollen grains in these BHB samples, especially the clumps, are derived from hyperlocal sources, with only minor components sourced from the broader regional flora.
-
2. Taphonomic or depositional explanations for the increase in pollen clumps during the CIE body are not supported by our observations; there is no correlation between pollen clump frequency and depositional environment, clastic grain size, pollen concentration, or weight percent total organic composition.
-
3. In the absence of evidence for taphonomic explanations for points 1 and 2, it is likely there was an increase in biotic pollination during the CIE body, which would account for the increase in pollen clump concentration, the greater dispersion of pollen morphology, and the higher proportion of fossil taxa with animal-pollinated NLRs.
-
4. Pollen clump prevalence and the pollination mode of NLRs represent underused sources of data for inferring pollination mode in the fossil record, but the former should be combined with careful analysis of depositional environments to ensure that clump prevalence is not controlled primarily by taphonomic factors.
Acknowledgments
Funding for this research was provided through a University of Melbourne Elizabeth and Vernon Puzey Fellowship Award to V.A.K. S.L.W.’s fieldwork was supported by the Roland W. Brown fund of the Department of Paleobiology and by the MacMillan Fund of the NMNH.
Competing Interests
The authors declare no conflicts of interest.
Data Availability Statement
Supplementary Tables 1–8 and R code for Hamming distances are available on Dryad at https://doi.org/10.5061/dryad.k0p2ngfkb.


 Open access