


Introduction
Goosegrass [Eleusine indica (L.) Gaertn.] is a pantropical grass in the Poaceae family that can grow as an annual or short-lived perennial. It can produce more than 40,000 seeds per plant and has been reported to be a significant weed in more than 46 crops across more than 60 countries (Holm et al. Reference Holm, Plucknett, Pancho and Herberger1977; Jalaludin et al. Reference Jalaludin, Ngim, Bakar and Zazali2010; Xiao-yan et al. Reference Xiao-yan, Han-wen, Wei-li, Ya-jie and Yan2015). In Florida, E. indica is a problematic weed in many major horticultural crops, including strawberry [Fragaria × ananassa (Weston) Duchesne ex Rozier (pro sp.) [chiloenis × virginiana]] (Boyd and Reuss Reference Boyd and Reuss2022), bell pepper (Capsicum annuum L.), tomato (Solanum lycopersicum L.), and cucurbit (Cucurbitaceae) production.
Strawberries in Florida were harvested across 10,600 ha, with an estimated value of more than US$511 million in 2022 (USDA-NASS 2023). They are grown primarily in central Florida using an annual plasticulture production system. Polyethylene plastic mulch provides excellent grass and broadleaf weed control, except where the plastic is punctured to form the transplant hole (Adcock et al. Reference Adcock, Foshee III, Wehtje and Gilliam2008). Eleusine indica plants in plasticulture strawberry typically germinate in the transplant holes 3 to 5 wk after transplanting (Gilreath and Santos Reference Gilreath and Santos2005). In a survey conducted between 2019 and 2020, E. indica was found in 83% of Florida fields (Boyd and Reuss Reference Boyd and Reuss2022). Growers typically utilize integrated weed management programs that include plastic mulch, fumigation, hand weeding, preemergence herbicides in the row middles and/or under the plastic mulch, and postemergence herbicides such as clethodim or sethoxydim. The high frequency and density of E. indica observed throughout the strawberry industry suggests that the current integrated approach is not achieving the desired level of control. This may be partially attributed to the infrequent use of preemergence herbicides by growers in Florida (Boyd and Reuss Reference Boyd and Reuss2022) as well as E. indica resistance to paraquat (Buker et al. Reference Buker, Steed and Stall2002; McElroy et al. Reference McElroy, Harris, Price, Harkess and Li2021), which is commonly used for crop termination. Given the widespread occurrence of E. indica, there is a need to understand its impact on berry yield.
There is little research reporting the interspecific effects of weed competition on strawberry in plasticulture production systems. Buzanini and Boyd (Reference Buzanini and Boyd2024) report the negative interference of Carolina geranium (Geranium carolinianum L.) on strawberry yield, with strawberry reductions of 209 to 351 kg ha−1 when one G. carolinianum is present per square meter. Pritts and Kelly (Reference Pritts and Kelly2001) reported that newly planted strawberries were most susceptible to weed and cover crop competition during the first 2 mo after planting within a matted row culture, as both stolon formation and yield were impacted. After 1 and 2 mo of weed competition, yield was reduced by 20% and 65%, respectively, an indicator of the negative competition effects in strawberry plants.
The objective of this study was to determine the effect of varying densities of E. indica on strawberry growth and yield throughout the growing season.
Materials and Methods
Two field research seasons were conducted at the Gulf Coast Research and Education Center (27.76°N, 82.22°W) in Balm, FL, USA (Season 1: August 2022 to March 2023; Season 2: August 2023 to March 2024) to evaluate the effects of E. indica competition on strawberry growth and yield. The soil type in both trials was classified as a Myakka fine sand (sandy, siliceous hyperthermic Oxyaquic Alorthod) with a pH of 6.5 and 0.7% organic matter.
Raised beds were formed using standard bed-pressing equipment (Kennco, Ruskin, FL, USA) on 1.2-m centers. The beds were 30.5-cm high and 68-cm wide. After the beds were formed, they were fumigated with 336 kg ha−1 1,3-dichloropropene + chloropicrin (Telone C-35, Dow AgroSciences, Indianapolis, IN, USA). A single drip tape (2.22-cm diameter and 0.254-mm thick) with emitters every 30 cm and a flow rate of 0.95 L min−1 was installed 2.5 cm below the bed-top soil surface. Raised beds were covered with impermeable film (TIF, Berry Plastics, Evansville, IN, USA).
The experimental design was a randomized complete block with four replications repeated over two seasons. Each plot was 7.62 m of a single raised bed with a 3.8-m buffer between plots. Treatments were E. indica density and consisted of 0, 0.4, 0.8, 1.9, 2.7, and 3.8 plants m−2 (Figure 1). Two rows of strawberry transplants (‘Brilliance’) were transplanted per bed, with 38-cm spacing between plants and 30-cm spacing between rows. Each plot consisted of 20 strawberry plants that were transplanted on October 11, 2022, and October 10, 2023. Two weeks after strawberries were transplanted, the E. indica seedlings, which each had four fully developed leaves, were transplanted into the crop transplant holes at the specified densities. The E. indica seedlings were grown in a greenhouse for 2 wk after strawberry transplanting, in 128 cell trays. The E. indica seeds were collected in the previous season and kept refrigerated until being planted. Strawberry transplant holes were a slit approximately 8-cm long and 1-cm wide. Eleusine indica transplant timing was based on the typical emergence timing of E. indica seedlings observed in strawberry crops in Florida. Crop management followed standard commercial practices in the region, including overhead sprinkler irrigation after planting for plant acclimatization. During both seasons, fertilizer was applied through drip irrigation (fertigation) at a rate of 1.12 kg N ha−1d−1, with no preplant N used. Fertigation occurred for 1 h twice per day.
Eleusine indica planting configuration in the field trials. The red dots represent strawberry plants with E. indica in the same transplant hole, and the green dots represent strawberry plants with no E. indica. From left to right, the densities would be 0, 0.4, 0.8, 1.9, 2.7, and 3.8 E. indica plants m−2.

Throughout the experimental period, average, minimum, and maximum air temperatures, were similar for both seasons (Table 1). However, the total precipitation in Season 2 was 256 mm versus only 134 mm in Season 1.
Monthly weather data obtained from the weather station located at the Gulf Coast Research and Education Center in Wimauma, FL, USA, from 2022 to 2024. a

a The weather station is part of the Florida Automated Weather Network.
Data collection included E. indica shoot height, total seeds per plant, shoot biomass, strawberry yield, and strawberry shoot biomass. The height of each E. indica plant in each plot was measured from the soil to the top of the last fully developed leaf. In Season 1, E. indica height was measured on November 9 and 22 and December 6 and 20, 2022. For Season 2, heights were measured every 14 d after the transplant day from November 7, 2023, to December 21, 2023. Eleusine indica biomass and seed counts were collected at seed maturity on January 5, 2023, in Season 1, and March 3, 2024, in Season 2. We cannot determine with certainty why the E. indica reached maturity and began to senesce much earlier in Season 1, but it is believed this might be related to several low-temperature events that occurred that season (Table 1). Eleusine indica biomass, number of inflorescences per plant, and number of seeds per plant were collected from two randomly selected plants in each plot. The number of E. indica seeds produced per plant was estimated by counting the number of seedheads per plant, then randomly selecting three seedheads from each plant and counting the seeds from each seedhead. For the biomass, the plants were removed from the soil and the roots were cut. The shoot biomass of E. indica plants was dried in an oven at 60 C for 15 d in Season 1 and 10 d in Season 2 and then weighed.
Marketable strawberries (single fruit weight ≥10 g) were harvested once per week from December 8, 2022, to January 5, 2023, and twice a week from December 7, 2023, to February 29, 2024, for Seasons 1 and 2 respectively. Strawberry fruits were harvested from the beginning of the harvest period until E. indica senescence. The short harvest period in Season 1 reflects the early E. indica senescence, which occurred 56 d earlier in Season 1 than in Season 2. Strawberry shoot biomass was collected from one plant with an E. indica plant in the same hole and one adjacent to it but without a E. indica plant. The plants were collected on January 5, 2023, and March 4, 2024, kept in a dry chamber at 60 C, and weighed 7 d after the collection.
Statistical Analysis
Eleusine indica biomass and strawberry biomass were subjected to ANOVA with PROC MIXED in SAS (v. 9.4, SAS Institute, Cary, NC, USA). The data were subjected to one-way ANOVA; density was considered a fixed factor, while block was considered a random factor. The two iterations of the experiment were analyzed separately, as data collection occurred on different dates. Constant variance and normality were examined. For the E. indica height, because the data were collected on multiple dates, the data were subjected to repeated-measures analyses with the PROC MIXED model. The evaluation dates were considered to be the time factor. Treatment means were separated using Tukey’s multiple comparisons at P ≤ 0.05. Sigma Plot (v. 14.5, Systat Software, San Jose, CA, USA) was used for linear regression analyses:
 $$f = {y^0} + a^{*}x$$
where x is the explanatory variable (density), f is the dependent variable, a is the slope of the line, and y 0 is the intercept (the value of y when x = 0), Sigma Plot (v. 14.5, Systat Software, San Jose, CA, USA) was used to examine the linear relationship between E. indica density and E. indica seed production and strawberry yield. Within this model x is the E. indica density.
Results and Discussion
Eleusine indica
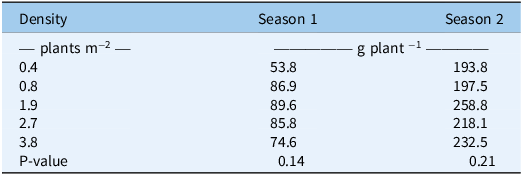
Eleusine indica density had no significant effect on E. indica height (P = 0.30 and 0.061 for Seasons 1 and 2, respectively) and this effect did not vary with time (P = 0.053 and 0.098 for Seasons 1 and 2, respectively). However, E. indica height increased over time during both seasons, with plants reaching a height exceeding 20 cm at 14 d after transplant (DATr) and 40 cm at 21 DATr (Table 2). In both seasons, we observed that E. indica plants were taller than the strawberry canopy by early December. Eleusine indica aboveground dry biomass ranged from 54 to 90 g plant−1 in Season 1 and from 194 to 260 g plant−1 in Season 2 (Figure 2). Biomass differences between seasons can be attributed to early-season senescence in Season 1 (Figure 3). Eleusine indica density did not affect E. indica biomass, which may indicate a lack of intraspecific competition at the E. indica densities evaluated.
Eleusine indica height at various days after E. indica transplant (DATr) at Wimauma, FL, USA, in Season 1 (2022–2023) and Season 2 (2023–2024). a

a Means within a column followed by the same letter are not significantly different according to Tukey’s test (P ≤ 0.05).
b The value refers to the factor time, from the repeated-measures analyses.
Effect of Eleusine indica density on E. indica shoot biomass at Wimauma, FL, USA, in Season 1 (2022–2023) and Season 2 (2023–2024).
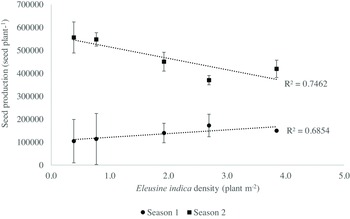
The linear regression between Eleusine indica seed production and density in a strawberry field in Wimauma, FL, USA, during Season 1 (2022–2023) and Season 2 (2023–2024). Error bars represent the standard errors of the mean.

Eleusine indica plants the first week of January in Seasons 1 (left) and 2 (right), illustrating the early senescence in Season 1.

Eleusine indica seed production varied between seasons, with 136,145 seeds plant−1 in Season 1 and 468,866 seeds plant−1 in Season 2. The number of inflorescences and seeds per inflorescence also differed between seasons. The average number of inflorescences per plant was 57 in Season 1 and 709 in Season 2. Seed production per inflorescence ranged from 1,912 to 2,379 in Season 1, whereas it ranged from 683 to 740 seeds per inflorescence in Season 2. Eleusine indica seed production was linearly related to weed density in both seasons (Table 4). For each increase in E. indica plants per square meter, seed production increased by 16,534 seeds in Season 1 (Figure 4). Conversely, in Season 2, for each increase in E. indica plants per square meter, seed production per plant was reduced by 50,679 seeds. These results suggest that there was less intraspecific competition in Season 1, which can probably be attributed to the early senescence. In Season 2, however, although E. indica biomass was unaffected by density, seed production decreased as plant density increased, which indicates some level of intraspecific competition occurred between E. indica individuals. Regardless, our results clearly demonstrate that across a range of densities, E. indica plants in commercial strawberry fields produce significant seed numbers and should be controlled before seed set.
Regression results of the relationship between Eleusine indica density and seed production at Wimauma, FL, USA, in Season 1 (2022–2023) and Season 2 (2023–2024).
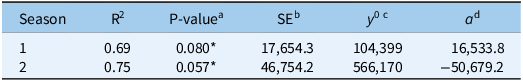
a Asterisks indicate the significance levels of the linear regression equations: *P < 0.1.
b This is the standard error of the model.
c y 0 = the intercept (the value of y when x = 0) in the linear regression equation.
d a = the slope of the line in the linear regression equation.
The linear regression between Eleusine indica density and total strawberry yield harvested from December to January in Season 1 (2022–2023) and December to February in Season 2 (2023–2024). Each point is the mean of four replicates for each year. Error bars represent the standard errors of the mean.

Strawberry
Total strawberry yield had an inverse linear relationship with E. indica density, with yield reductions ranging from 10% to 39% in Season 1 and 6% to 51% in Season 2 (Table 5; Figure 4). In Season 1, the harvest was stopped in early January at E. indica senescence, whereas in Season 2, strawberries were harvested until the end of February; the differences in total yield between seasons are largely due to differences in the harvest period. In a similar study within the same production system using the same weed densities reported in the present paper, Buzanini and Boyd (Reference Buzanini and Boyd2024) reported that G. carolinianum reduced strawberry yield by 2% to 40%. These results indicate that E. indica has a greater effect on berry yield than G. carolinianum.
Regression results of the relationship between Eleusine indica density and strawberry yield at Wimauma, FL, USA, in Season 1 (2022–2023) and Season 2 (2023–2024).

a Asterisks indicate the significance levels of the linear regression equation: *P ≤ 0.05; ** P ≤ 0.1.
b y 0 = the intercept (the value of y when x = 0) in the linear regression equation.
c a = the slope of the line in the linear regression equation.
In Season 2, the negative effects of E. indica density on berry yield increased from December to February with slopes of 54, 401, and 1,901 for December, January, and February, respectively (Table 5; Figure 5). Not surprisingly, this indicates that the effects of competition increased with competition duration, but even early-season competition (December) lowers berry yields and coincides with the time when growers typically obtain premium pricing.
The linear regression between strawberry yield and Eleusine indica density on monthly yield in Season 2 (2023–2024). Each point is the mean of four replicates. Error bars represent the standard errors of the mean.

Strawberry shoot biomass of plants with E. indica in the same transplant hole was unaffected by E. indica density compared with the nontreated control (Table 6). However, the biomass of strawberry shoots without E. indica in the same planting hole was affected by E. indica density. It is difficult to explain this difference, but we suspect that the growth habit of E. indica results in increased shading of neighboring strawberry plants versus the plants in the same transplant hole. At 2 weeds m−2, strawberry shoot biomass was reduced by 63% and 69% for Seasons 1 and 2, respectively. Early-stage shading can potentially reduce the strawberry plant’s vegetative growth (leaf number, leaf area, and leaf fresh and dry weight) and yield (Ferree and Stang Reference Ferree and Stang1988; Fletcher et al. Reference Fletcher, Sutherland, Ames and Battery2002). Choi (Reference Choi2021) reported that yield of noncommercial fruit from strawberry plants decreased by 70% as the light intensity decreased from no shading to 7 h of shading. Conversely, Demirsoy et al. (Reference Demirsoy, Demirsoy, Uzun and Öztürk2007) reported that 50% shading did not affect strawberry crown and leaf number. Additionally, Buzanini and Boyd (Reference Buzanini and Boyd2024) found no relationship between strawberry shoot biomass and G. carolinianum density within the same production system as this report. However, G. carolinianum grows more slowly and overtops the strawberry canopy later than E. indica, which may explain the difference.
Effects of Eleusine indica density on strawberry shoot biomass of shoots with E. indica in the same transplant hole and shoots from neighboring transplant holes with no E. indica plant collected at Wimauma, FL, USA, in Season 1 (2022–2023) and Season 2 (2023–2024). a

a Means within a column followed by the same letter are not significantly different according to Tukey’s test (P ≤ 0.05).
b One randomly selected tagged strawberry plant per plot with an E. indica plant growing.
c A single strawberry plant adjacent to the tagged strawberry plant with no E. indica growing in the same transplant hole.
We conclude that E. indica can negatively affect strawberry yield with a reduction of 316 to 2,356 kg strawberries ha−1 with each unit increase in E. indica density per square meter. Adequate control of E. indica is crucial to prevent yield losses. Future studies are needed to determine the mechanism of competition between strawberry and E. indica, and to determine the optimal time to remove the plants to minimize competitive interactions.
Acknowledgments
We acknowledge the technical assistance of Mike Sweat, Emily Witt, Cecilia Lopez, and the farm crew at the Gulf Coast Research and Education Center for assistance with crop management.
Competing interests
No competing interests have been declared.


 Open access