

Obesity is a growing health problem in both developed and developing countries( 1 ). Obesity increases the risk of numerous metabolic complications such as type 2 diabetes, dyslipidaemia, non-alcoholic fatty liver disease (NAFLD) and cancer( Reference Wang, Thornton and Russell 2 ). BMI, a simple index of weight according to height, is commonly used to diagnose obesity in adults. Generally, people living in Western countries are considered obese when their BMI is 30 kg/m2 or higher( Reference Wang, Thornton and Russell 2 ). Some Asian countries use a lower BMI threshold for obesity (≥25 kg/m2) because Asians are generally less obese but have higher body fat and insulin resistance than other ethnic groups with similar BMI( Reference Jung and Choi 3 , Reference Finucane, Stevens and Cowan 4 ). A WHO expert consultation also suggested that Asian populations have different associations between BMI, percentage of body fat and health risks than European populations, and they identified intermediate public-health action points (BMI values of 23·0, 27·5, 32·5 and 37·5 kg/m2) along the continuum of BMI and proposed methods by which countries could make decisions about the definitions of increased risk for their population( 5 ). Optimal BMI cut-off values for identifying metabolic risk are still controversial( Reference Misra, Chowbey and Makkar 6 ). Therefore, further studies are needed to determine appropriate BMI cut-off values for Asians and to identify and prevent the development of obesity-related disorders.
Peripheral blood mononuclear cells (PBMC) can be easily obtained from blood samples. PBMC are mainly composed of lymphocytes and monocytes, cells that play key roles in the immune system. Bories et al.( Reference Bories, Caiazzo and Derudas 7 ) reported that the expression of alternative macrophage differentiation markers with anti-inflammatory properties was decreased in PBMC from obese subjects compared with those from lean subjects, suggesting that PBMC in obesity are programmed and directly contribute to obesity-related inflammation. In addition, gene expression profiles of PBMC reflect lipid metabolism in obesity-associated organs such as the adipose tissue and the liver( Reference Konieczna, Sánchez and van Schothorst 8 ). Therefore, numerous studies have attempted to identify transcriptional biomarkers in PBMC that may distinguish a disease state from a healthy state and predict pharmacodynamic effects( Reference Takamura, Honda and Sakai 9 , Reference Burczynski and Dorner 10 ).
This study aimed to establish metabolic and molecular differences among normal weight (BMI, 18·5–23 kg/m2), mildly obese (BMI, 25–27·5 kg/m2) and moderately obese (BMI, 27·5–30 kg/m2) Korean adult men. We investigated the levels of lipids, apo and adipocytokines and markers of insulin resistance, oxidative stress and liver damage in plasma or erythrocytes. We also analysed gene expression profiles of PBMC using microarray analysis to understand molecular mechanisms underlying the development of obesity and its associated metabolic abnormalities.
Methods
Subjects
Volunteers aged 20–59 years were recruited from Daegu and its suburbs in the Republic of Korea. After an initial screening, thirty-seven men were included in the study. Of these, twenty-six were obese subjects having a BMI of 25–30 kg/m2 and a normal medical history. Obesity was defined as a BMI of ≥25 kg/m2 on the basis of the Asia-Pacific criteria set by the WHO( Reference Finucane, Stevens and Cowan 4 ). Obese subjects were subdivided into two groups according to their BMI: mildly obese subjects (Obese A group, BMI from ≥25 to <27·5 kg/m2; n 14)( 1 ) and moderately obese subjects (Obese B group, BMI from ≥27·5 to <30 kg/m2; n 12)( Reference Wang, Thornton and Russell 2 ). A control group included eleven healthy age-matched subjects (BMI from ≥18·5 to <23 kg/m2). Exclusion criteria included a history of cancer or cardiac, renal, hepatic or infectious disease; current treatment with insulin; current use of drugs for controlling blood glucose, blood lipids, body weight or high blood pressure; a history of gastrointestinal surgery; and consumption of functional foods or medications that may affect the results of this study. The study was performed in accordance with the Declaration of Helsinki, and all the subjects provided their written informed consent before participating. The study was approved by the Kyungpook National University’s Human Research Committee (no. 2012-2), and all the experiments were performed in compliance with the relevant laws and institutional guidelines. The clinical trial registration number is ISRCTN16654407 (doi: 10.1186/ISRCTN16654407).
Analyses of plasma biomarkers and blood pressure
Blood samples were collected from the subjects after 12 h of fasting. Blood samples were collected in heparin-coated tubes and centrifuged at 1000 g and 4°C for 15 min to determine plasma levels of lipids, apo, glucose, insulin, C-peptide, glucagon, adipocytokines and aminotransferases. Levels of TAG, total cholesterol, HDL-cholesterol and glucose were determined using kits obtained from Asan Pharmaceutical Co., and levels of free fatty acids and phospholipids were determined using kits obtained from Wako Chemicals. LDL-cholesterol level was calculated using the Friedewald formula: total cholesterol−HDL-cholesterol−(TAG/5). The HDL-cholesterol:total cholesterol ratio (HTR) was calculated as (HDL-cholesterol/total cholesterol)×100. The atherogenic index (AI) was calculated as (total cholesterol−HDL-cholesterol)/HDL-cholesterol. Levels of apoA1 and apoB were measured using enzymatic kits (AlerChek Inc.). Plasma levels of adipocytokines, insulin, C-peptide and glucagon were determined using a multiplex detection kit (Bio-Rad) and were analysed using the Luminex 200 LabMAP system (Luminex). Homoeostasis model assessment for insulin resistance (HOMA-IR) was calculated as (fasting glucose (mmol/l)×fasting insulin (µU/ml))/22·51. Plasma levels of aspartate aminotransferase (AST) and alanine transaminase (ALT) were determined using enzymatic kits (Asan Pharmaceutical Co.). Blood pressure was measured using an automatic blood pressure monitor (Omron).
Analyses of the activities of antioxidant enzymes
Activities of antioxidant enzymes were analysed as described previously( Reference Park, Choi and Jung 11 ). Activities of superoxide dismutase (SOD), catalase (CAT) and glutathione peroxidase (GPX) in erythrocytes were determined as follows: heparin-treated fasting blood samples were centrifuged at 1000 g and 4°C for 15 min, and the plasma and buffy coat were discarded. The separated erythrocytes were washed three times with 0·9 % NaCl solution. The washed cells were lysed in an equal volume of distilled water and were mixed thoroughly. Hb concentration was estimated by analysing an aliquot of this haemolysate with a commercial assay kit (Asan Pharmaceutical Co.). The haemolysate was then diluted appropriately by adding distilled water to estimate the activities of CAT and GPX. Hb was removed by precipitation by adding 0·4 ml of an ethanol–chloroform (3:5, v/v) mixture to a 1-ml aliquot of the haemolysate cooled in ice. This mixture was stirred continuously for 15 min and diluted by adding 0·2 ml distilled water. After centrifuging for 10 min at 1600 g and 4°C, a pale yellow supernatant was separated from the protein precipitate and used to assay SOD activity.
SOD activity was spectrophotometrically measured by inhibiting pyrogallol autoxidation at 420 nm for 10 min; one unit of enzyme activity was determined as the amount of enzyme that inhibited the oxidation of pyrogallol by 50 %. CAT activity was measured spectrophotometrically by monitoring the disappearance of hydrogen peroxide at 240 nm for 5 min. GPX activity was determined spectrophotometrically by adding 100 µl of the diluted haemolysate to 2·8 ml of the reaction mixture containing 2·525 ml of 0·1 m-Tris-HCl (pH 7·2) buffer, 75 μl of 30 mm-glutathione, 100 μl of 6 mm-NADPH and 100 μl of glutathione reductase (0·24 units) and by incubating at 25°C for 5 min. The reaction was initiated by adding 100 μl of 30 mm-hydrogen peroxide, and the absorbance was measured at 340 nm for 5 min. Plasma paraoxonase activity was expressed as micromoles of p-nitrophenol produced per minute per millilitre of plasma.
Analysis of hydrogen peroxide and lipid peroxidation
The level of hydrogen peroxide in erythrocytes was analysed as previously described( Reference Park, Choi and Jung 11 ). The ferrous oxidation-xylenol orange reagent was prepared by mixing 100 μm-xylenol orange, 250 μm-ammonium ferrous sulphate, 100 mm-sorbitol and 25 mm-H2SO4. Next, 50 µl of the test sample was added to 950 μl of the ferrous oxidation-xylenol orange reagent, vortexed and incubated at room temperature for at least 30 min to complete colour development. Absorbance was measured at 560 nm and compared with a linear standard having a concentration in the range of 0–5 μm. The level of thiobarbituric acid-reactive substance (TBARS), a marker of lipid peroxidation, was measured spectrophotometrically by using previously published methods( Reference Park, Choi and Jung 11 ).
Isolation of peripheral blood mononuclear cells and extraction of RNA
PBMC were isolated from heparin-treated blood samples by density-gradient sedimentation with Ficoll–Paque reagent (GE Healthcare) and used for total RNA extraction. Total RNA was extracted using TRIzol reagent (Invitrogen) according to the manufacturer’s instructions. The purity and integrity of the isolated RNA were evaluated using Agilent 2100 Bioanalyzer (Agilent Technologies).
Microarray analysis and real-time RT-PCR
For microarray analysis, we randomly selected eighteen subjects (four normal-weight subjects, seven mildly obese subjects and seven moderately obese subjects). Total RNA isolated from these subjects was amplified and purified using the Illumina TotalPrep RNA Amplification Kit (Ambion) to obtain biotinylated complementary RNA (cRNA). Next, 750 ng of biotinylated cRNA per sample was hybridised to Illumina HumanHT-12 v4 Expression BeadChips at 58°C for 16–18 h. Array signals were detected using Amersham Cy3–streptavidin (GE Healthcare). BeadChips were scanned using the Illumina BeadArray Reader, and raw data were extracted using Illumina BeadStudio software. Probe signal intensities were quantile normalised and log transformed. Limma was used to determine genes that were significantly differentially expressed based on a false-discovery rate<5 %, a P value <0·05 and fold change >1·3. Kyoto Encyclopedia of Genes and Genomes (KEGG) pathways (www.genome.jp/kegg) were considered for analysing gene functions. These microarray data were deposited in the Gene Expression Omnibus database (accession no. GSE69039).
To validate microarray data, six genes (MMP9, IL-8, IL-1β, IL-6, TNF-α and HNRNPL) were analysed independently by performing real-time RT-PCR with the same RNA samples as those hybridised with BeadChips. In all, 1 μg of total RNA was reverse transcribed using the QuantiTect® Reverse Transcription Kit (QIAGEN), and mRNA expression was quantified by performing real-time RT-PCR with the SYBR Green PCR Kit (QIAGEN) and the CFX96™ Real-Time PCR Detection System (Bio-Rad). Cycle thresholds (C
T
) were determined on the basis of the SYBR Green emission intensity during the exponential phase. The C
T
data were normalised using GAPDH, and relative gene expression was calculated using the $2^{{{\minus}\Delta \Delta C_{T} }} $
method.
$2^{{{\minus}\Delta \Delta C_{T} }} $
method.
Statistical analysis
All data are presented as mean values and standard deviations. Significant differences among the groups were determined using one-way ANOVA with SPSS (version 11.0; SPSS Inc.). Duncan’s multiple range test was performed when differences among the groups were significant at P<0·05. Correlations between clinical parameters and the level of selected gene expression were assessed by Pearson’s correlation test.
Results
General characteristics and plasma glucose-related markers of normal weight, mildly obese and moderately obese subjects
The general characteristics and plasma glucose-related markers are shown in Table 1. No significant differences were observed among the three groups with respect to age, systolic blood pressure, diastolic blood pressure, plasma glucose level and insulin:glucagon ratio. However, plasma insulin and glucagon levels tended to be higher in the Obese A group (BMI from ≥25 to <27·5 kg/m2) than in normal weight subjects (BMI from ≥18·5 to <23 kg/m2), and their plasma levels were significantly higher in the Obese B group (BMI from ≥27·5 to <30 kg/m2) than in normal weight subjects. Moreover, the HOMA-IR of the Obese B group was significantly higher than that of normal weight subjects. The HOMA-IR of the Obese A group was intermediate between that of the normal weight and Obese B groups.
General characteristics and plasma glucose-related markers of obese and normal weight subjects (Mean values and standard deviations)
Normal, normal weight subjects; Obese A, mildly obese subjects; Obese B, moderately obese subjects; HOMA-IR, homoeostasis model assessment for insulin resistance.
a,b,c Mean values with unlike superscript letters were significantly different (P<0·05) (one-way ANOVA).
Plasma lipid and apo levels
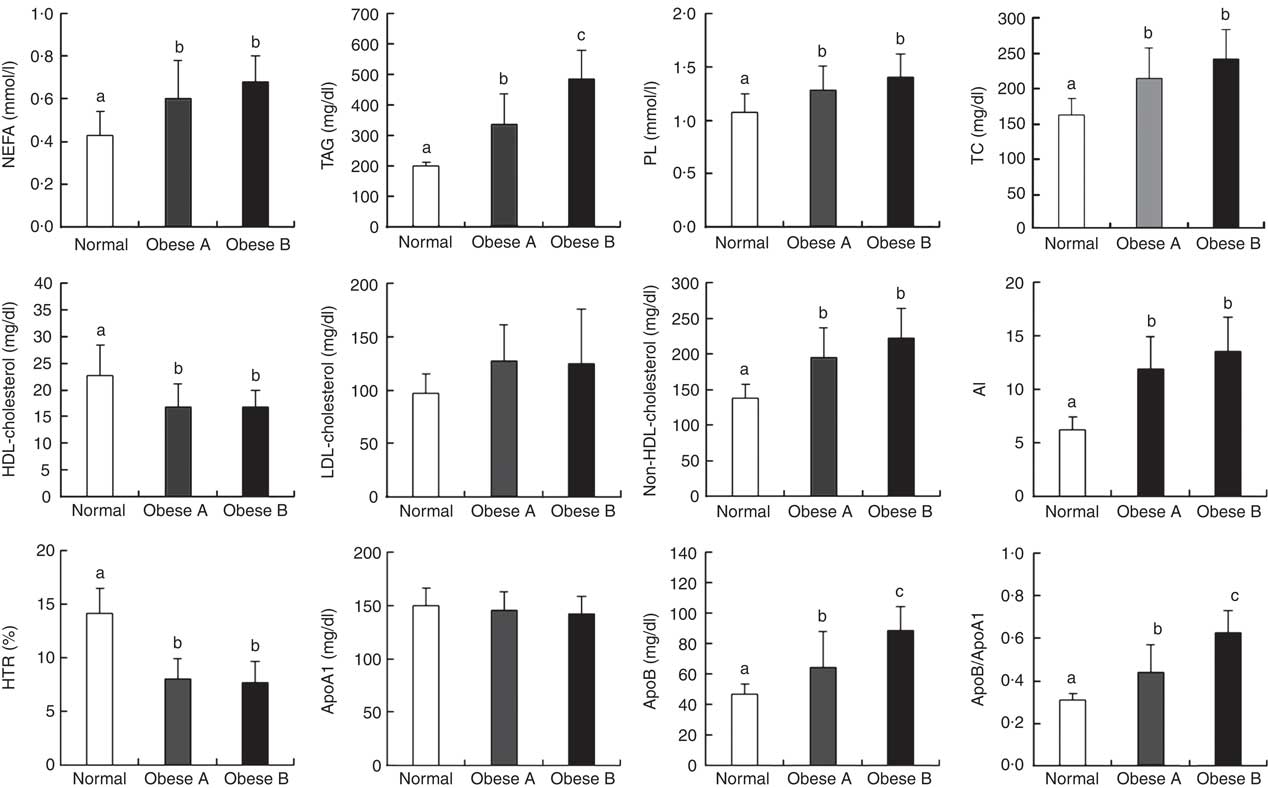
Differences in plasma levels of lipids and apo are shown in Fig. 1. Plasma levels of free fatty acids, TAG, phospholipids, total cholesterol, non-HDL-cholesterol, apoB, apoB/apoA1 and AI were significantly higher in both Obese A and Obese B groups compared with the normal weight group. In particular, plasma levels of TAG, apoB and apoB/apoA1 in the Obese B group were significantly higher compared with the Obese A group. In contrast, levels of HDL-cholesterol and HTR were significantly lower in both obese groups than in the normal weight group. However, no significant differences were observed among the three groups with respect to plasma levels of LDL-cholesterol and apoA1.
Plasma levels of lipids and apo in obese and normal weight subjects. Subjects were categorised as normal weight (Normal), mildly obese (Obese A) and moderately obese (Obese B). Values are means and standard deviations represented by vertical bars. a,b,c Mean values with unlike letters were significantly different (P<0·05) (one-way ANOVA). AI, atherogenic index; HTR, HDL-cholesterol:total cholesterol ratio; PL, phospholipid; TC, total cholesterol.
Plasma levels of adipocytokines
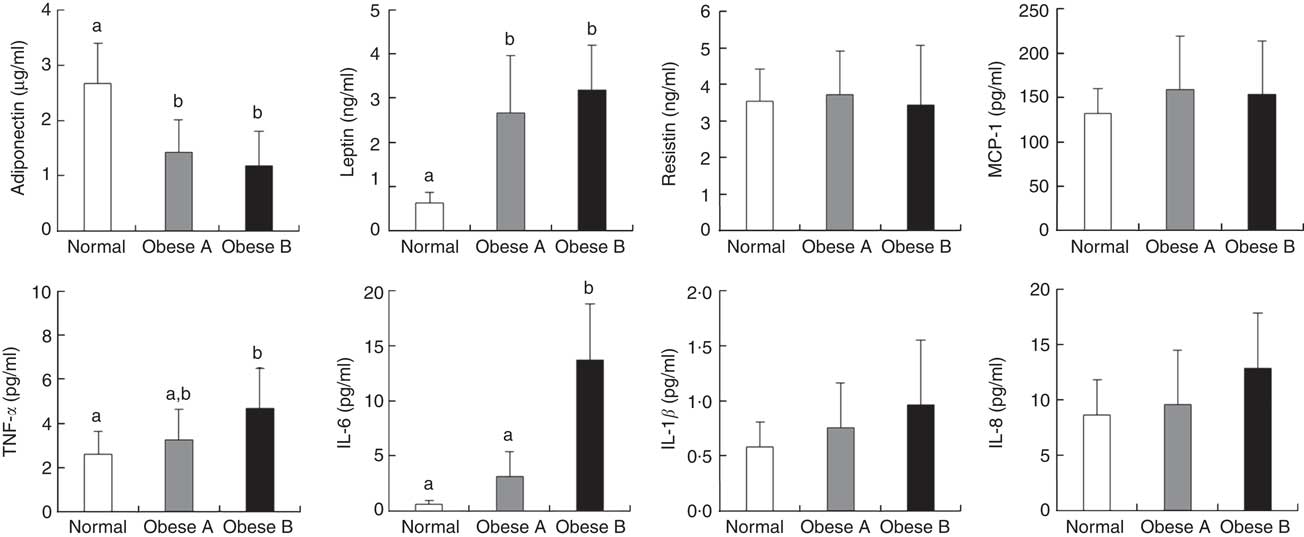
Plasma levels of adipocytokines are shown in Fig. 2. Plasma levels of adiponectin in Obese A and Obese B groups were significantly lower compared with normal weight subjects. However, plasma levels of leptin in Obese A and Obese B groups were markedly higher than those in normal subjects. Moreover, the Obese B group showed significantly higher plasma levels of TNF-α and IL-6 than normal weight subjects; however, this was not observed in the Obese A group. Plasma levels of TNF-α and IL-6 in the Obese A group were approximately 5·29- and 1·25-fold higher, respectively, compared with normal weight subjects; however, the differences between Obese A and normal weight groups were not statistically significant. Plasma levels of resistin, monocyte chemoattractant protein-1, IL-1β and IL-8 were not significantly different among the three groups.
Plasma levels of adipocytokines in obese and normal weight subjects. Subjects were categorised as normal weight (Normal), mildly obese (Obese A) and moderately obese (Obese B). Values are means and standard deviations represented by vertical bars. a,b Mean values with unlike letters were significantly different (P<0·05) (one-way ANOVA). MCP-1, monocyte chemoattractant protein-1.
Activities of antioxidant enzymes and aminotransferases and levels of hydrogen peroxide and lipid peroxidation in plasma or erythrocytes
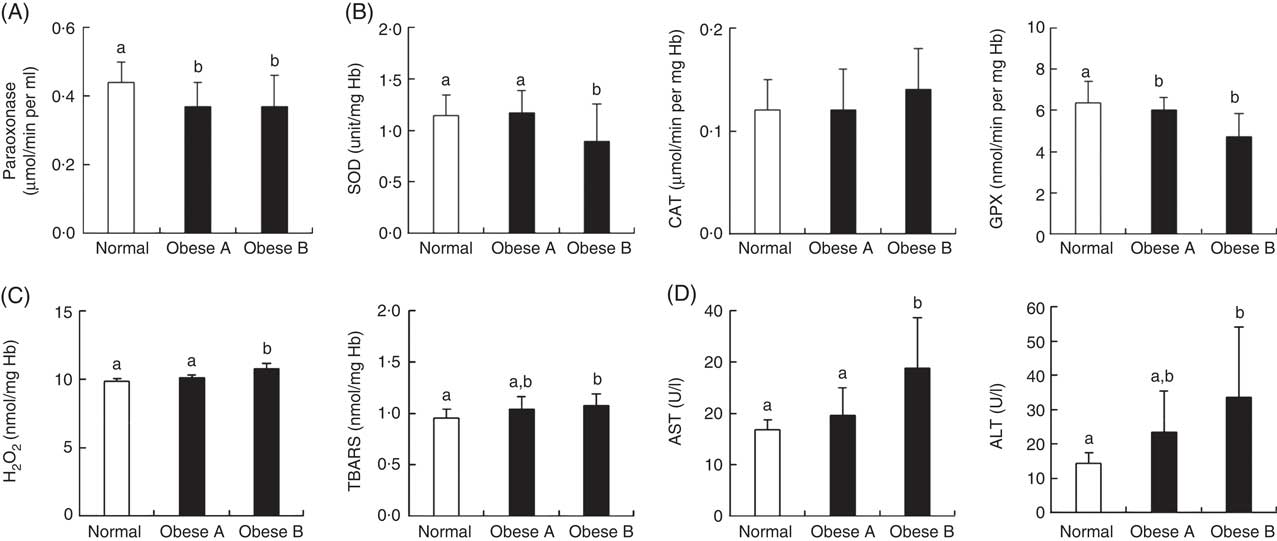
Similar to the plasma levels of HDL-cholesterol, the activity of plasma paraoxonase, a lipophilic antioxidant component of HDL-cholesterol, was significantly lower in Obese A and Obese B groups than in the normal weight group (Fig. 3(A)). Levels of oxidative stress indicators and activities of antioxidant enzymes in erythrocytes were not significantly different between Obese A and normal weight groups (Fig. 3(B) and (C)). However, the Obese B group showed markedly lower SOD and GPX activity and higher hydrogen peroxide and TBARS levels in erythrocytes compared with the normal weight group. However, erythrocyte CAT activity was not significantly different between the three groups. Parameters of liver function, such as plasma levels of AST and ALT, were also significantly higher in the Obese B group than in the normal weight group; however, these levels were not higher in the Obese A group (Fig. 3(D)).
Activities of antioxidant enzymes and levels of oxidative stress and liver function markers in plasma and/or erythrocytes of obese and normal weight subjects. Subjects were categorised as normal weight (Normal), mildly obese (Obese A) and moderately obese (Obese B). (A) Activities of antioxidant enzymes in plasma, (B) activities of antioxidant enzymes in erythrocytes, (C) levels of oxidative stress markers in erythrocytes and (D) activities of aminotransferases in plasma. Values are means and standard deviations represented by vertical bars. a,b Mean values with unlike letters were significantly different (P<0·05) (one-way ANOVA). ALT, alanine transaminase; AST, aspartate aminotransferase; CAT, catalase; GPX, glutathione peroxidase; SOD, superoxide dismutase; TBARS, thiobarbituric acid-reactive substances.
Determination of gene expression profiles of peripheral blood mononuclear cells by microarray analysis
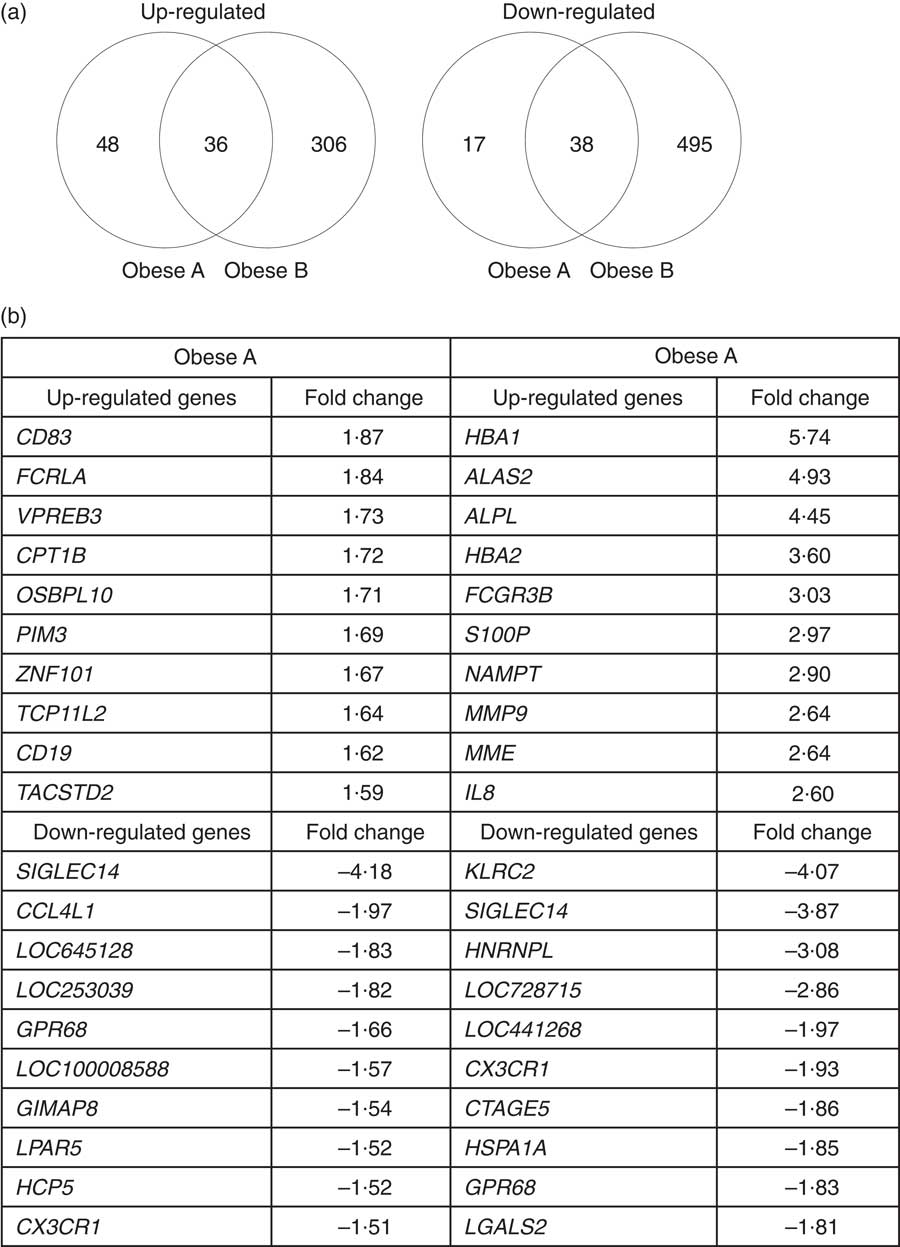
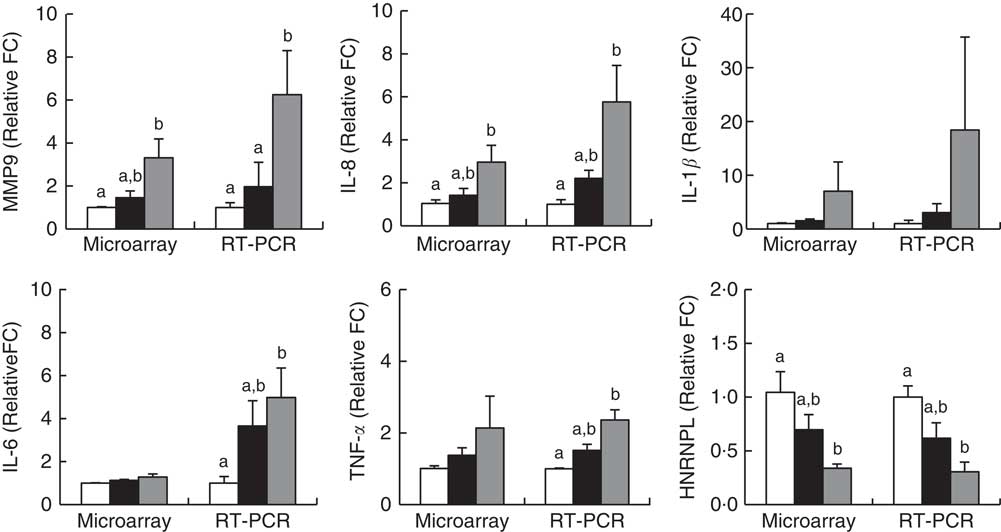
Microarray analysis identified genes that were differentially expressed in Obese A and Obese B groups compared with those in normal weight subjects. In all, eighty-four and 342 genes were up-regulated and fifty-five and 533 genes were down-regulated in Obese A and Obese B groups, respectively, compared with those in normal weight subjects (Fig. 4(a)). In all, seventy-four genes were common between the Obese A group and the Obese B group, of which thirty-six genes were up-regulated and thirty-eight genes were down-regulated. The ten most significantly up-regulated or down-regulated genes in Obese A and Obese B groups compared with those in normal weight subjects are shown in Fig. 4(b). In the Obese A group, the up-regulated gene with the highest fold change (1·87) was CD83, which is expressed in mature dendritic cells and activated B and T cells and plays an important role in modulating immune response( Reference Aerts-Toegaert, Heirman and Tuyaerts 12 ), and the down-regulated gene with the lowest fold change (4·18) was SIGLEC14, which encodes a transmembrane protein of the Ig superfamily. However, the role of SIGLEC14 in obesity is poorly understood. In the Obese B group, the up-regulated gene with the highest fold change (5·74) was HBA1, which encodes Hb, and the down-regulated gene with the lowest fold change (4·07) was KLRC2, which encodes a natural killer cell receptor and is down-regulated in immune response-mediated common inflammatory skin diseases such as atopic dermatitis( Reference Li, Li and Yang 13 ). The results of selected microarray analyses were confirmed by performing real-time RT-PCR (Fig. 5).
Differential expression of genes in obese and normal weight subjects. Subjects were categorised as normal weight (Normal), mildly obese (Obese A) and moderately obese (Obese B). (a) Venn diagrams of genes that were significantly up-regulated (left) and down-regulated (right) in Obese A and Obese B groups compared with those in normal-weight subjects. (b) The ten most up-regulated or down-regulated genes in both Obese A and Obese B groups compared with those in normal weight subjects. Differentially expressed genes were determined using Limma in R/BioConductor based on a P value <0·05, false discovery rate <5 % and fold change >1·3.
Validation of microarray results by real-time RT-PCR. Subjects were categorised as normal weight (![]() , Normal), mildly obese (
, Normal), mildly obese (![]() , Obese A) and moderately obese (
, Obese A) and moderately obese (![]() , Obese B). Values are means with their standard errors. a,b Mean values with unlike letters were significantly different (P<0·05) (one-way ANOVA). Differentially expressed genes were determined using Limma in R/BioConductor based on a P value <0·05, false discovery rate <5 % and fold change >1·3.
, Obese B). Values are means with their standard errors. a,b Mean values with unlike letters were significantly different (P<0·05) (one-way ANOVA). Differentially expressed genes were determined using Limma in R/BioConductor based on a P value <0·05, false discovery rate <5 % and fold change >1·3.
To further evaluate the functional differences in PBMC transcriptomes of Obese A and Obese B groups compared with those of normal weight subjects, we performed KEGG pathway analysis using genes that were differentially expressed only in the Obese A group, only in the Obese B group or in both Obese A and Obese B groups compared with those in normal weight subjects. Accordingly, differentially expressed genes only in Obese A group, only in Obese B group and in both Obese A and Obese B groups compared with those in normal weight subjects were used to perform the KEGG pathway analysis, respectively, and the results are indicated in Table 2. In the Obese A group, the differentially expressed genes enriched pathways involved in immune responses, energy metabolism and cancer, such as cytokine–cytokine receptor interaction, NF-κB signalling, toll-like receptor (TLR) signalling, B cell receptor signalling, fatty acid metabolism, PPAR signalling, AMP-activated protein kinase signalling, mammalian target of rapamycin (mTOR) signalling, ras-proximate-1 signalling, calcium signalling, mitogen-activated protein kinase (MAPK) signalling, phosphoinositide-3-kinase (PI3K)–AKT signalling, RAS signalling and p53 signalling pathways. In particular, CD19, CPT1B, CCL4L1 and LPAR5 belonged to the top ten up- or down-regulated genes in the Obese A group compared with the normal weight group. In both Obese A and Obese B groups, the differentially expressed genes enriched pathways regulating NAFLD development, oestrogen signalling and osteoclast differentiation, along with pathways regulating immune responses and cancer, such as cytokine–cytokine receptor interaction, chemokine signalling, NF-κB signalling, TLR signalling, nucleotide-binding oligomerisation domain (NOD)-like receptor signalling, TNF signalling, T cell receptor signalling, B cell receptor signalling, transcriptional misregulation, Wnt signalling, MAPK signalling, p53 signalling, apoptosis and cAMP signalling; two of these genes (CX3CR1 and HSPA1A) belonged to the top ten down-regulated genes in the Obese B group compared with the normal weight group. In addition, genes involved in extracellular matrix (ECM)-receptor interaction, transforming growth factor-β (TGF-β) signalling, TAG synthesis, oxidative phosphorylation, carbohydrate digestion and absorption, insulin signalling and forkhead box O (FOXO) signalling pathways were differentially expressed only in the Obese B group compared with the normal weight group, and MMP9 and FCGR3B belonged to the top ten up-regulated genes in the Obese B group compared with the normal weight group. Microarray analysis of human PBMC transcriptomes showed that genes involved in pathways associated with immune responses; energy, glucose and bone metabolism; NAFLD; and cancer were differentially expressed during the early and/or late stages of obesity.
Kyoto Encyclopedia of Genes and Genomes (KEGG) pathway analysis of genes that were significantly regulated in mildly and moderately obese Korean adult menFootnote *
TLR, toll-like receptor; NOD, nucleotide-binding oligomerisation domain; NAFLD, non-alcoholic fatty liver disease; ECM, extracellular matrix; TGF-β, transforming growth factor-β; AMPK, AMP-activated protein kinase; mTOR, mammalian target of rapamycin; FOXO, forkhead box O; RAP1, ras-proximate-1; MAPK, mitogen-activated protein kinases; PI3K–AKT, phosphoinositide-3-kinase-AKT; cAMP, 3′-5′-cyclic adenosine monophosphate.
* Analyses were performed using KEGG pathway analysis (www.genome.jp/kegg) with genes that were differentially expressed only in the mildly obese (Obese A) group, only in the moderately obese (Obese B) group or in both Obese A and Obese B groups compared with those in normal weight subjects. Genes in red font are those up-regulated in obese subjects compared with those in normal weight subjects; genes in green font are those down-regulated in obese subjects compared with those in normal weight subjects; the underlined genes belong to the top ten up- or down-regulated genes.
† Genes differentially expressed only in the Obese A group compared with those in normal weight subjects.
‡ Genes differentially expressed in both Obese A and Obese B groups compared with those in normal weight subjects.
§ Genes differentially expressed only in the Obese B group compared with those in normal weight subjects.
Next, from all the genes grouped in Table 2, we selected eight genes (CD19, CPT1B, CCL4L1, LPAR5, CX3CR1, HSPA1A, MMP9 and FCGR3B) that belonged to the top ten up- or down-regulated genes in Obese A and Obese B groups compared with those in the normal weight group and analysed correlations between the selected eight genes and clinical parameters using Pearson’s correlation test (Table 3). BMI was negatively correlated with CX3CR1 and HSPA1A. Conversely, a positive correlation was observed between BMI and MMP9 and FCGR3B. Among circulating lipids and apo, HDL-cholesterol level was negatively correlated with CD19, and levels of total cholesterol, non-HDL-cholesterol, LDL-cholesterol and apoB were positively correlated with MMP9, whereas LDL-cholesterol was negatively correlated with CX3CR1. In addition, MMP9 expression showed positive correlations with levels of glucose-regulating hormones (insulin, C-peptide and glucagon) and the insulin resistance marker HOMA-IR, whereas CX3CR1 expression was negatively correlated with levels of insulin, C-peptide and HOMA-IR. MMP9 was also positively correlated with plasma leptin levels, whereas LPAR5 was negatively correlated with IL-8 as well as leptin.
Correlation of clinical parameters and selected genes
HOMA-IR, homoeostasis model assessment for insulin resistance.
**, *Significant at P=0·01, P=0·05, respectively.
Discussion
Comparison of plasma lipids, apo, adipocytokines and markers of insulin resistance, oxidative stress and liver damage
To our knowledge, this is the first study to characterise metabolic biomarkers in the blood and transcriptome profiles of PBMC in Korean adults with mild or moderate obesity on the basis of the newly recommended BMI criteria for Asians( 5 ). Obese A and Obese B groups had abnormal levels of apoB, apoB/apoA1 and lipids, except LDL-cholesterol, which is consistent with previous findings showing that apoB, apoB/apoA1 and non-HDL-cholesterol levels may be more clinically useful than LDL-cholesterol levels for predicting the risk of CVD in obese subjects( Reference Klop, Elte and Cabezas 14 ). In particular, plasma levels of apoB, apoB/apoA1 and TAG were significantly higher in the Obese B group than in the Obese A group, indicating that these blood markers may be more sensitive to the severity of obesity. Increased plasma levels of leptin and decreased plasma levels of adiponectin were observed in both Obese A and Obese B groups. As leptin (positively) and adiponectin (negatively) are correlated with body fat, BMI and dyslipidaemia( Reference Wang, Thornton and Russell 2 ), they could be suitable sensitive biomarkers of body fat accumulation and early risk of obesity-associated dyslipidaemia in obese subjects. Unlike plasma levels of lipids, apoB and adipokines, plasma levels of inflammatory cytokines and markers of insulin resistance, oxidative stress and liver damage were significantly increased in the Obese B group but not in the Obese A group. Although both Obese A and Obese B groups maintained normal fasting blood glucose levels because of increased plasma glucagon and insulin levels, the HOMA-IR of the Obese B group was markedly higher than that of the normal weight group, suggesting that changes in HOMA-IR were more sensitive in predicting the severity of obesity than levels of fasting blood glucose. Thus, a part of our findings suggests that dysregulation of circulating levels of lipids, apoB, leptin and adiponectin may occur before the changes in the circulating levels of markers of inflammation, insulin resistance, oxidative stress and liver function, and thus may be more efficient in predicting the early risk of obesity and associated metabolic diseases. Similarly, circulating levels of adiponectin are suggested to precede the decrease in insulin sensitivity in humans( Reference Stefan, Vozarova and Funahashi 15 ).
Comparison of inflammatory and fibrotic gene expressions in peripheral blood mononuclear cells
Importantly, gene expression profiles of PBMC reflected metabolic differences associated with obesity status. As expected, multiple genes involved in inflammatory pathways were differently expressed in PBMC from Obese A and/or Obese B subjects. Up-regulation of LTB, CCL28, CD19 and CD79A and down-regulation of CCL4L1 and CCL3L1 were observed only in the Obese A group, suggesting that these genes may be involved in the early stage of obesity-related inflammation. In particular, CD19 was negatively correlated with plasma HDL-cholesterol as well as paraoxonase, a lipophilic antioxidant component of HDL-cholesterol, suggesting a possible link between this gene and HDL-cholesterol dysregulation. Further, of the three genes CX3CR1, CCR2 and NLRC4, which were down-regulated in both Obese A and Obese B groups, loss of CX3CR1 (encoding a fractalkine receptor) induces hyperglycaemia with reduced insulin secretion( Reference Lee, Morinaga and Kim 16 ). In contrast, fractalkine improves glucose tolerance and insulin secretion in vivo ( Reference Lee, Morinaga and Kim 16 ), and polymorphisms in CX3CR1 (T280M and V249I) are associated with type 2 diabetes( Reference Shah, Hinkle and Ferguson 17 ). Interestingly, in the present study, a negative correlation was observed between CX3CR1 expression and levels of plasma glucose-regulating hormones (insulin, C-peptide and glucagon) and HOMA-IR, thus supporting the functional role of this gene in the metabolic syndrome. More inflammation-related genes were differentially expressed in the Obese B group than in the Obese A group. In particular, expression of anti-inflammatory IL10 was down-regulated only in the Obese B group – a finding similar to that observed in a previous study( Reference Bories, Caiazzo and Derudas 7 ). In addition, expressions of pro-inflammatory cytokines such as IL6 and TNFα in PBMC were significantly up-regulated only in the Obese B group, which was consistent with their circulating levels.
Along with inflammation, increased fibrosis of the liver and adipose tissue is a hallmark of obesity, and liver fibrosis is a component of NAFLD( Reference Tsuneto, Hida and Sera 18 ). Interestingly, NAFLD-related genes were differentially expressed in PBMC of obese subjects. Of these, an increased expression of endoplasmic reticulum stress-related DDIT3, a gene commonly up-regulated in both Obese A and Obese B groups, is observed in PBMC of type 1 diabetic subjects( Reference Irvine, Gallego and An 19 ), whereas a deficiency of DDIT3 reduces oxidative damage and promotes cell survival in type 2 diabetic mice( Reference Song, Scheuner and Ron 20 ). Moreover, besides the profibrotic mediator MMP9, other genes involved in the fibrotic process such as ECM–receptor interaction and TGF-β signalling were differentially expressed only in the Obese B group. In particular, expression of MMP9, a gene up-regulated only in the Obese B group, showed positive correlations with levels of plasma lipids (total cholesterol, non-HDL-cholesterol and LDL-cholesterol), apo B, glucose-regulating hormones (insulin, C-peptide and glucagon), insulin resistance marker (HOMA-IR) and leptin as well as BMI, suggesting a link between obesity and related metabolic disturbances such as dysregulation of lipid and glucose metabolism. Recently, Mazzotti et al.( Reference Mazzotti, Singulane and Ota 21 ) also reported an association of MMP9 polymorphisms with higher LDL-cholesterol levels. Among other TGF-β signalling-related genes down-regulated only in the Obese B group, loss of CD44 or CD47 induced adiposity or impaired glucose tolerance in mice fed a high-fat diet( Reference Kang, Liao and DeGraff 22 , Reference Chun 23 ). In addition, CD47 expression on the erythrocyte surface was lower in obese patients than in the control group( Reference Wiewiora, Piecuch and Sedek 24 ).
Comparison of expression of genes involved in energy metabolism, insulin resistance and bone metabolism in peripheral blood mononuclear cells
Numerous genes involved in energy metabolism, except CPT1B, were also differentially expressed in PBMC of the Obese B group. In particular, the Obese B group showed up-regulation of FOXO1, which regulates energy and nutrient homoeostasis through energy storage in white adipose tissue( Reference Kousteni 25 ). In mice, FOXO1 haploinsufficiency protected against high‐fat diet‐induced insulin resistance( Reference Kim, Li and Huntley 26 ). Moreover, inhibition of PPA2, which was down-regulated only in the Obese B group, was reported to exacerbate insulin resistance( Reference Galbo, Perry and Nishimura 27 ). In addition, various genes involved in carbohydrate digestion and absorption and insulin resistance were differentially expressed only in the Obese B group, consistent with findings regarding the circulating levels of glucose-related markers. Up-regulation of CPT1B, which encodes a β-oxidation enzyme, only in the Obese A group may be an essential metabolic response for maintaining lipid balance in the early stages of obesity( Reference Bonnefont, Djouadi and Prip-Buus 28 ). Accordingly, CPT1B may be an early complementary marker that protects against obesity-associated lipid dysregulation, and more genes and pathways involved in energy and glucose metabolism may reflect dysregulation of energy homoeostasis and insulin resistance in later stages of obesity.
Oestrogen signalling in men, as in women, prevents adiposity and insulin resistance( Reference Finkelstein, Lee and Burnett-Bowie 29 , Reference Linnér, Svartberg and Giwercman 30 ). Interestingly, both Obese A and Obese B groups showed down-regulation of oestrogen signalling-related HSPA1A, which is also down-regulated in the muscles of patients with type 2 diabetes and protects against obesity-induced insulin resistance( Reference Kurucz, Morva and Vaag 31 , Reference Chung, Nguyen and Henstridge 32 ). Loss of GABBR1 (involved in oestrogen signalling) or ATP2B4 (involved in calcium signalling), which was down-regulated only in the Obese B group, increases insulin resistance and hepatic steatosis and osteoclastogenesis with a concomitant reduction in bone volume in mice( Reference Vassileva, Hu and Hoos 33 , Reference Kim, Prasad and Hyung 34 ). Therefore, these PBMC genes may be associated with obesity-related metabolic disturbances and bone metabolism dysregulation.
Comparison of expression of genes involved in cancer in peripheral blood mononuclear cells
Obesity-related enhancement in growth signalling, inflammation and angiogenesis can contribute to cancer progression( Reference Hursting and Hursting 35 ). The Wnt, MAPK, PI3K-AKT, p53, mTOR and RAS pathways are involved in several aspects of tumourigenesis, such as cell proliferation, survival, migration, invasion and angiogenesis( Reference Wang and Zhang 36 ). In particular, p53 controls apoptosis, and p53-dependent apoptosis suppresses tumourigenesis( Reference Fridman and Lowe 37 ). Of the genes involved in these pathways, up-regulation of CACNA1I, CD19, GNG7 and RPRM and down-regulation of LPAR5 and PPP2R2B were observed only in the Obese A group. CD19 is overexpressed in various cancers, whereas LPAR5 protects against tumour formation( Reference Poe, Minard-Colin and Kountikov 38 , Reference Oda, Strauch and Fujiwara 39 ). In this case, the up-regulation of oncogenes AXIN2, FLT3LG, NFKBIA, BIRC3, DDIT3, and PDE4B and down-regulation of suggested tumour-suppressor genes CACNA2D3, HSPA1A and APAF1 occurred continuously in both Obese A and Obese B groups( Reference Spagnoli, Kloth and Terracciano 40 – Reference Li, Zhu and Nie 48 ). Moreover, more cancer-related genes were expressed in PBMC from the Obese B group than in PBMC from the Obese A group, indicating that after cancer initiation in the early stage of obesity, this ongoing process drives cancer towards more invasive stages. Thus, the PBMC genes identified in our study could be used as potential targets for preventing, treating and diagnosing obesity-related cancers.
In conclusion, we examined, for the first time, the changes in metabolic features and gene expression profiles of PBMC according to BMI in adult Korean men. The Obese B group showed overall characteristics of the metabolic syndrome, including dyslipidaemia, adipocytokine dysregulation, insulin resistance, increased oxidative stress and NAFLD markers, whereas the Obese A group only showed dyslipidaemia and abnormalities in the levels of leptin and adiponectin. Moreover, genes involved in energy metabolism, insulin resistance, bone metabolism, cancer, inflammation and fibrosis were differentially expressed in the PBMC of obese subjects. Of these, fourteen genes differentially expressed only in the Obese A group may be used as potential targets for the early diagnosis and treatment of obesity-related metabolic disturbances. We also identified fifteen genes associated with inflammation, NAFLD and cancer that were common between the Obese A group and the Obese B group, implying that expression and stability of these genes may be associated with obesity-related metabolic disorders. Thus, our findings could be potentially useful for diagnosing and managing obesity. However, further larger-scale studies are required to completely elucidate the role of these genes in the pathogenesis of obesity.
Acknowledgements
This study was supported by the SRC programme (grant number 2015R1A5A6001906) and the Fundamental Technology Program (grant number 2012M3A9C4048818) of the National Research Foundation of Korea funded by the Ministry of Education, Science and Technology.
This study received no specific grant from any funding agency, commercial or not-for-profit sectors. In addition, all the funders had no role in the design and analysis of the study or in the writing of this article.
U. J. J. analysed the data and wrote the manuscript. Y. R. S. and R. R. performed the clinical study and were involved in data interpretation. M.-S.C. designed the study and edited the manuscript. All the authors read and approved the final version of the manuscript.
The authors declare that there are no conflicts of interest.


