


Introduction
In the face of climate change, extreme heat and persistent high temperatures in summer are becoming more prevalent (Witze, Reference Witze2024). This in turn will drive up the demand for indoor cooling, implying more electricity consumption and increased greenhouse gas emissions (Staffell et al., Reference Staffell, Pfenninger and Johnson2023). To emphasize this downward spiral, the International Energy Agency (2018) predicted that the cooling demand will grow exponentially, especially in the Global South. On the demand side, many experts thus have called for switching to more energy-efficient air-conditioners. This, however, risks the rebound effect – that energy efficiency does not necessarily guarantee reduced electricity use – and overcooling, undermining gender equity in indoor comfort (Adua et al., Reference Adua, Clark and York2021; Parkinson et al., Reference Parkinson, Schiavon, de Dear and Brager2021).
Meanwhile, combining behavioral and technological changes could be better synergistic catalysts to achieve net-zero targets than relying on technologies alone (Costa et al., Reference Costa, Moreau, Thurm, Yu, Clora, Baudry, Warmuth, Hezel, Seydewitz, Ranković, Kelly and Kropp2021). Thus, a turn to personal cooling behaviors could help alleviate the concerns of cooling energy demand. Particularly, this study centers on the potential of applying personal cooling in offices as supplements to air conditioning (AC).
Sustainable cooling as supplements
Instead of cooling the rooms, personal cooling devices (PCDs) focus more on directly cooling the body or its immediate, personalized space (Zhang et al., Reference Zhang, Arens and Zhai2015; Kim et al., Reference Kim, Bauman, Raftery, Arens, Zhang, Fierro, Andersen and Culler2019). They include personal electric fans, hand fans, wearable neck fans, cooling office chairs, portable evaporative coolers, cooling cushions, and other accessories (Erwin, Reference Erwin2017; André et al., Reference André, De Vecchi and Lamberts2020b). Individualized cooling can save energy by increasing the acceptable air-conditioning setpoints while still maintaining satisfaction with the environment (Rawal et al., Reference Rawal, Schweiker, Kazanci, Vardhan, Jin and Duanmu2020). A 29% of cooling energy savings could be achieved by raising the cooling temperatures from 22°C to 25°C (Hoyt et al., Reference Hoyt, Arens and Zhang2015). Although some PCDs require electricity,Footnote 1 their use alongside higher AC setpoints would still save more energy than using AC as usual, on the condition of proper coordination between AC and PCDs (Veselý and Zeiler, Reference Veselý and Zeiler2014; He et al., Reference He, Li, Wang, He and He2017; Xu et al., Reference Xu, Liu, Hu and Spanos2017). Besides, PCDs can improve comfort sensation and relieve heat stress, with an effect size Cohen’s d between 0.67 and 2.74 (Song et al., Reference Song, Ding, Huang, Xie and Li2024). While such potential has been increasingly recognized in the scholarship on PCDs, these devices are not widely available or applicable in offices yet (Arens and Zhang, Reference Arens and Zhang2022). This is partly due to the ‘lock-in’ of air-conditioning technologies and the deeply entrenched beliefs and expectations of what a cooled space should be (Shove, Reference Shove2003; Maller and Strengers, Reference Maller and Strengers2011).
Meanwhile, a close cousin to PCDs is cooler clothing, a strategy often ignored in offices because of existing norms of socially acceptable dress (Hitchings, Reference Hitchings2010; Morley, Reference Morley2022). Indeed, material scientists have been developing more flexible, convenient, and energy-saving designs for personal cooling garments (Lou et al., Reference Lou, Shou, Park, Zhao, Wu, Hui, Yang, Kan and Fan2020; Ren et al., Reference Ren, Han and Fang2022), although such options are more often applied in extreme work conditions, for astronauts or firefighters, for instance (Waligora and Michel, Reference Waligora and Michel1968; Nayak et al., Reference Nayak, Houshyar and Padhye2014). A practical alternative, which is the focus of this study, is to reduce the layers of clothing in offices to achieve thermal comfort (Newsham, Reference Newsham1997; Rawal et al., Reference Rawal, Manu, Shukla, Thomas and de Dear2016), even though it means challenging the current norms in office wear, epitomized by a black suit and a tie (Krivacek, Reference Krivacek and Khosrow-Pour2021). One apt real-world example is the Cool Biz Program in Japan, where government ministers led the change in office suit norm by removing the jacket and the tie and allowing short-sleeved shirts and AC setpoints as high as 28°C (Tan et al., Reference Tan, Ogawa and Matsumura2008). This ongoing program has reported carbon emissions savings of one to three million tons each year (Shove and Granier, Reference Shove and Granier2018).
With the potential of PCDs and lighter clothing in mind, this study aims to explore the applicability of these options in the workplace. By expanding occupants’ neutral comfort temperatures, such personal cooling initiatives can allow higher AC setpoints in office areas, which not only reduce energy bills for businesses but also accommodate the thermal demand for those who have to constantly bear the office cold. In China, there has long existed a national guideline for summer AC temperature settings to be no lower than 26°C in public indoor spaces (Xinhua News Agency, 2007). However, the policy was not well-received and was poorly implemented, considering it was little reported in the media. With a slightly warmer office, it is more likely that the employees would wear lighter clothing and more PCDs.
How can we shift towards this practice of personal cooling and higher AC setpoints? As Khosla et al. (Reference Khosla, Miranda, Trotter, Mazzone, Renaldi, McElroy, Cohen, Jani, Perera-Salazar and McCulloch2021) highlight, social interaction is a crucial lever of change in promoting sustainable cooling alongside technologies, businesses, governance, and infrastructure. Acknowledging the importance of occupant-centric cooling design to meet individual cooling preferences, Lizana et al. (Reference Lizana, Miranda, Gross, Mazzone, Cohen, Palafox-Alcantar, Fahr, Jani, Renaldi, McCulloch and Khosla2022) also point to the influence of peers on the adoption of relevant behaviors. Further, the widely acclaimed Cool Biz program would not have been as successful without the then prime minister’s leadership in creating a new norm of office wear nationwide. Thus, one way of employing this lever in sustainable office cooling is to target the social norms in adopting energy-saving cooling strategies.
Social norms and their application in sustainability
In social psychology, social norms refer to ‘rules and standards understood by members of a group, and that guide and/or constrain social behavior without the force of laws’ and come into effect through social interactions (Cialdini and Trost, Reference Cialdini, Trost, Gilbert, Fiske and Lindzey1998). Regarding the influence on behaviors, they are commonly categorized into descriptive and injunctive norms (Cialdini et al., Reference Cialdini, Reno and Kallgren1990). Descriptive norms are usually understood as the common behaviors performed by a majority of the group, or in simple terms, what others are commonly observed to do. For instance, the prevalence of air-conditioning use in financial offices is considered a descriptive norm of office cooling (Yang et al., Reference Yang, Hitchings, Lotti and Shipworth2022). Injunctive norms bear the connotation of social approval for the performance of a behavior, or sanctions for the lack of it, and thus what the social group approves or disapproves of. A case in point is the social expectation of formal dress on certain work occasions, the absence of which would elicit social disapproval in the form of doubts over one’s professionalism (Dellinger, Reference Dellinger2002; Nath et al., Reference Nath, Bach and Lockwood2016).
Given the promise of social norms in engendering behavior change, many empirical studies have tested its power in real-world interventions, albeit with mixed results (Dannenberg et al., Reference Dannenberg, Gutsche, Batzke, Christens, Engler, Mankat, Möller, Weingärtner, Ernst, Lumkowsky, von Wangenheim, Hornung and Ziegler2024). Notably, to accentuate the desired norm, many applied the strategy of normative messages and feedback that can sometimes be personalized and comparative, a majority of which achieved the intended outcome to some extent (Farrow et al., Reference Farrow, Grolleau and Ibanez2017). Similarly, recent evidence synthesized in a broad-brush and less rigorous review demonstrates a large proportion of supportive evidence on the influence of social norms on behaviors related to climate change, including eco-consumption and energy conservation (Cialdini and Jacobson, Reference Cialdini and Jacobson2021). A second-order meta-analysis also confirms the power of social comparison in field behavior change interventions (Bergquist et al., Reference Bergquist, Thiel, Goldberg and van der Linden2023).
So far, only a few experimental studies in China in the field of energy use in buildings have been found, with the common employment of students as samples. One online controlled experiment showed the effectiveness of social norm information to motivate university students to support carbon capture and storage (Wang et al., Reference Wang, Gong, Wang, Li and Sun2021). The more recent experiments tested the effect of social norm feedback in different formats in university dormitories in China (Liu et al., Reference Liu, Luo, Liu and Xing2023; Xiao et al., Reference Xiao, Sparkman and Constantino2023; Zhang et al., Reference Zhang, Zha, Jiang, Wang, Yang, Salman and Wu2023; Zhu et al., Reference Zhu, Li, Liu, Shang, Ding and Alam2024). The focus on students in the experiments above echoes the observation in a systematic review of previous social norm interventions (Yamin et al., Reference Yamin, Fei, Lahlou and Levy2019), indicating a need for more realistic and diverse contexts and populations for social norm applications. Besides, in an office setting, social dynamics influence people’s behaviors (Chen et al., Reference Chen, Hong, de Rubens, Yilmaz, Bandurski, Bélafi, De Simone, Bavaresco, Wang, Liu, Barthelmes, Adams, D’Oca and Przybylski2020). In the collectivist and relatively tight society of China, conformity and harmony are key, and individuals often adhere more to social norms than to their own preferences (Smith et al., Reference Smith, Louis, Terry, Greenaway, Clarke and Cheng2012; Gelfand et al., Reference Gelfand, Harrington and Jackson2017). In this regard, this research on office cooling with financial professionals in the context of China can offer specialized evidence for social norm interventions.
Considering the less-trodden path of applying behavioral nudges in cooling comfort in offices, we are interested in testing two social norm nudges – descriptive norm information and injunctive norm signal from a company leader, and their combination. In the social norms literature, the former leverages descriptive statistics summarizing the common use of sustainable personal cooling by financial professionals in Guangdong; the latter speaks to the ‘top-down’ signals from business leaders to show that personal cooling could be socially acceptable in the office (Tankard and Paluck, Reference Tankard and Paluck2016). We will be testing the following hypotheses with an online cross-sectional survey experiment focused on office workers in the financial sector in Guangdong Province, China:
H1a. Description norm information on sustainable cooling increases the behavioral intention of lighter clothing.
H1b. Descriptive norm information on sustainable cooling increases commitment to lighter clothing.
H2a. Leaders’ injunctive norm signal on sustainable cooling increases the behavioral intention of lighter clothing.
H2b. Leaders’ injunctive norm signal on sustainable cooling increases commitment to lighter clothing.
H3a. Description norm information on sustainable cooling increases the use frequency intention of PCDs.
H3b. Descriptive norm information on sustainable cooling increases commitment to using PCDs more.
H4a. Leaders’ injunctive norm signal on sustainable cooling increases the use frequency intention of PCDs.
H4b. Leaders’ injunctive norm signal on sustainable cooling increases commitment to using PCDs more.
H5a. The effect of both norm treatments to increase the behavioral intention of lighter clothing is stronger than that in the groups that only receive descriptive norm information or leaders’ injunctive norm signal.
H5b. The effect of both norm treatments to increase commitment to lighter clothing is stronger than that in the groups that only receive descriptive norm information or leaders’ injunctive norm signal.
H6a. The effect of both norm treatments to increase the use frequency intention of PCDs is stronger than that in the groups that only receive descriptive norm information or leaders’ injunctive norm signal.
H6b. The effect of both norm treatments to increase commitment to using PCDs more is stronger than that in the groups that only receive descriptive norm information or leaders’ injunctive norm signal.
Methods
Participants
We restricted our participants to financial employees working in Guangdong offices, as we believe this population with their business suit tradition could be a starting point to change the suit norm in the workplace and implement more personal cooling practices. The sample was recruited online through the sampling service provided by Wenjuanxing, a popular Chinese research survey platform. As it was difficult to determine the valid sampling rate with the online survey, we provided the following figures to roughly illustrate the sampling and screening process with the help of the Wenjuanxing Platform. A total of 866 valid responses were collected from the survey platform from August 26 to 26 September 2022.Footnote 2 Figure 1 shows that during the data collection period, the province was still experiencing relatively high and stable temperatures, highlighting the demand for cooling. As prescribed in the pre-analysis plan, we excluded participants whose total response time was beyond the three standard deviations below/above the mean and who failed at least three out of the five attention check questions. This yielded a final sample of 743 (See Figure 2).
Average daily temperatures in Guangdong Province during the experiment (data gathered from weather.com.cn, an official meteorological administration in China).

CONSORT participant flow diagram.

Experimental design
Our pre-registered survey experiment adopts a 2 (receiving descriptive norm information or not) by 2 (receiving leaders’ injunctive norm signal or not) factorial design.Footnote 3
At the beginning of the survey, the participants were screened for their eligibility of working in the financial industry and having worked in the current office for at least a week to ensure some cooling experience in the office. As baseline measurement, participants would answer questions regarding different cooling strategies, including environmental adjustment, use of personal cooling objects, clothing levels, and thermal comfort in the office. These baseline questions also served to build up the context so that the participants could better immerse themselves in the hypothetical treatments.
Next, participants were randomly allocated to one of these four groups to read hypothetical scenarios about their companies (See Figure 3). The instruction directed the participants to read a screenshot of a hypothetical company group chat on WeChat, a well-known and universally used online communication application in China. The control group would see a message from the company admin introducing an initiative to encourage less use of AC and more personal cooling in the company, which serves as the conversation background, and educational information on benefits and strategies of personal cooling. In addition to all the above information, the descriptive norm group would also read a section called Status quo in number about how many other financial employees in Guangdong have already adopted personal cooling in their offices, with factual figures from our previous survey study on office cooling in the regionFootnote 4 (Yang, Reference Yang2024). On the other hand, the injunctive signal group would receive a reply message from the company leader emphasizing the importance of the admin’s message, saying, ‘An important message on personal cooling’, followed by a thumbs-up emoji. For the group that received both norms, the WeChat screen consists of the background, educational and descriptive norm information from the admin and the injunctive norm message from the leader.
Treatment design (translated from Chinese). (a) Control group treatment; (b) Descriptive norm group treatment; (c) Injunctive norm group treatment; (d) Both norm group treatment.

For post-treatment measurement, participants were asked to indicate what level of clothing they intended to wear on the coming working day, the types of personal cooling objects they would use if all were available, and how frequently they would use these selected objects. In line with our control message and to prompt change, we reminded the participants during the post-treatment measurement that the AC setpoint in their offices would be slightly raised. At the start of each question on the behavioral intention, we added ‘suppose your office AC temperature is slightly raised’.Footnote 5 This hypothetical increase in AC temperatures would be treated as part of the control condition in our later discussion. We also asked participants how willing they were to commit to wearing more lighter clothing or to using PCDs more, using the following question, for instance, ‘following the WeChat messages, would you make a personal commitment to wearing cooler clothing in your office in summer?’ Then, we administered a comprehension check with four yes/no questions about the treatment materials. The final parts include demographics and questions about other factors, such as rank in the company. Supplementary Appendix A presents the survey questionnaire.
Instruments
Dependent variables
This experimental study has four dependent variables, with two behavioral intention measures (clothing warmth and PCD use frequency) and two commitment measures (commitment to lighter clothing and commitment to more PCD use).Footnote 6 Regarding clothing, we measured clothing warmth categories before and after receiving the treatment using a self-developed five-point scale measure on the warmth level of clothing as shown in Figure 4 (1 = very cool, 5 = very warm). We also measured the frequency of using PCDs before and after the treatment with a five-point scale (1 = never, 5 = always).
Clothing warmth scale.

Furthermore, we asked participants how willing they were to commit to the two sustainable cooling strategies, respectively, with a seven-point Likert scale (1 = definitely no, 7 = definitely yes). The two variables, commitment to more PCD use and commitment to lighter clothing, are then recategorized to form three categories using a ‘distributional recoding’ approach (de Vaus, Reference de Vaus2002, p. 36), to avoid empty- or small-cell issues in statistical modeling (Cook et al., Reference Cook, Niehaus and Zuhlke2018).Footnote 7 Specifically, those selected ‘definitely yes’ are considered as clearly convinced to make a strong commitment (3 = high), those selected ‘possibly yes’ tend to be slightly convinced and are considered ‘weak commitment’ (2 = mid-level), and the rest will be deemed as unconvinced, i.e., showing little or no commitment (1 = low).Footnote 8
Independent variables
We created three independent dummy variables: manipulated descriptive norm, manipulated leaders’ injunctive norm, and both of these norms (1 = provided).
Covariates
Regarding demographic variables, we controlled for age, biological sex, and company rank. For contextual factors, we controlled for their reported office AC temperature, environmental adjustment opportunities (AC, windows and blinds), and perceived thermal comfort before and after the intervention.Footnote 9 Please refer to Supplementary Appendix B for details on measurement and data processing.
Statistical analysis
Difference-in-differences estimation
In recognizing the importance of a counterfactual in causal inference, we deviated from the pre-analysis plan of using binary and multinomial logistic regressions to estimate the effects on behavioral intentions. Instead, we adopted a difference-in-differences (DiD) approach with ordinary least-squared regression as the regressor.Footnote 10 With the frequency of PCD use and clothing warmth being recorded both before and after the information treatments, DiD can account for any unobserved time-invariant confounders such as environmental or physiological factors across the treatment and control groups and yield more reliable treatment effects on the treated.
Thus, for the pre-post PCD-use and clothing warmth measures only, we constructed DiD models for each treatment group compared with the control group (Descriptive Norm Group versus Control Group, Injunctive Norm Group versus Control Group, Both Norms Group versus Control Group) and for both behavioral intentions of lighter clothing and PCD use.Footnote 11
Multinomial logistic regression
We followed the pre-analysis plan to obtain the treatment effects of social norm information on commitment intentions using multinomial logistic regressions, as both commitment variables (commitment to lighter clothing and to PCDs) are categorical. Since the questionnaire asked for participants’ willingness to commit only after the intervention, performing DiD regressions on commitment outcomes was impossible without repeated measures. The analyses were run on Stata and visualized in R.
Results
Descriptive analysis
Among the final sample, 54% of participants are females, 45% males, and five prefer not to say, which aligns with the distribution of financial workers in Guangdong (Department of Population and Employment Statistics et al., 2021). They are between 18 and 57 years old, with a mean of 30. 58% are working in a junior-rank position. The office AC setpoints are between 16 and 28°C, with an average of 24°C. Regarding environmental feature adjustment, 80% of participants reported having access to adjusting AC, 69% could adjust windows, and 69% could adjust blinds. 71% reported usually feeling thermally comfortable in their offices, 22% slightly uncomfortable, and 7% very uncomfortable. A balance check was conducted using these baseline variables across four groups, which shows no statistically significant difference and suggests that treatment randomization was achieved (See Supplementary Appendix C).
Group-level comparison
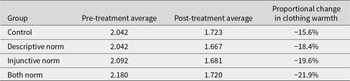
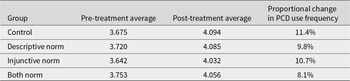
To indicate the difference in change between each treatment group and the control group, we calculated the group mean of PCD use frequency and clothing warmth before and after the treatments without controlling for covariates. Then we obtained the proportional change between the pre- and post-treatment levels for comparison across the groups.
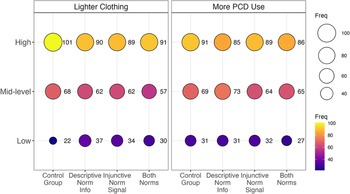
Table 1 and Figure 5 show that clothing warmth decreased after treatment in all four groups.Footnote 12 The three norm groups saw a considerable decrease in clothing warmth on average (18.4–21.9%), particularly the Both Norm Group, compared to the 15.6% change in the Control Group. Similarly, on average, PCD use frequency increased in all four groups (See Table 2 and Figure 5).Footnote 13 This use frequency increased by 10.7% in the Injunctive Norm Group, 9.8% in the Descriptive Norm Group, and 8.1% in the Both Norm Group. The Control Group also saw a similar but slightly higher increase in PCD use frequency (11.4%). Notably, among the norm groups, the injunctive norm seems to be the most effective across clothing and PCD use, despite the changes in the norm groups being similar. Additionally, the control condition appears to be more effective for PCD use.
Percentage changes to lighter clothing and more PCD use by treatment group. The error bars represent the 95% confidence intervals calculated using the standard error of the mean of percentage change and margin of error based on the t-distribution for each treatment group.

Group-level comparison of clothing warmth within experimental groups

Group-level comparison of PCD use frequency within experimental groups

As an alternative measure for behavioral intention, the commitment intention of wearing lighter clothing and using PCDs more is shown in Figure 6. In two separate questions, participants were asked how much they would like to commit to wearing lighter clothing and using PCDs more in their offices in summer. In the plots, the size of the balloon indicates the frequency of participants’ answers under each category (‘high’, ‘mid-level’ and ‘low’) for each group. On average, there is a relatively medium to high commitment to both behaviors across all the groups, as shown by the larger balloons in the ‘high’ and ‘mid-level’ categories. Notably, the distribution of the commitment levels appears very similar across the groups based on the nearly equal frequencies, especially among the three treatment groups. In comparison, the Control Group has the largest number of ‘high’ and ‘mid-level’ commitments to lighter clothing, and it also saw the highest level of commitment to more PCD use among the four groups.
Commitment levels to lighter clothing and more PCD use by treatment group.

Behavioral intentions
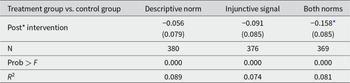
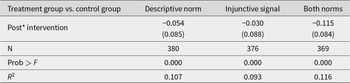
Our pre-registered analysis plan initially specified logistic and multinomial regression models for the change in clothing and in PCD use frequency. These analyses showed no significant effects except that leaders’ injunctive signal positively led to cooler clothing choices (p = 0.099) in the binary logistic regression, with mixed directional effects in the multinomial analysis compared to no change in clothing.Footnote 14 To better account for the experimental design and data structure, we used DiD models to calculate the treatment effects of the norm conditions on the behavioral intentions of lighter clothing and more frequent PCD use while controlling for covariates. Overall, providing normative information is often ineffective compared to the control group, regardless of whether the descriptive norm and the injunctive norm signal are provided separately or together.Footnote 15 Only when participants received both norms did they choose even lighter clothing than the control group (see Table 3).
Treatment effects of norms on clothing warmth (DiD approach, n = 743)

Note: Standard error in parentheses; control variables are directly measured rather than recategorized and treated as continuous, including age, sex (1 = female), rank in company, AC setpoint, AC adjustment, window adjustment, blind adjustment, baseline thermal comfort vote;
* p < 0.1; a ‘−’ sign means cooler clothing and a ‘+’ sign means warmer clothing.
According to Table 3, when participants received descriptive norm or injunctive norm only, they tended to switch to lighter clothing; however, the reduction is not statistically significant. In contrast, when both norms were provided, participants tended to choose cooler clothing, with 0.158 points decrease on the clothing warmth scale (p = 0.063). Thus, providing both norms could potentially reduce the warmth of summer office clothing. As shown in Table 4, there is no statistically significant evidence for the effectiveness of all three norm treatments in changing participants’ frequency of use of PCDs.
Treatment effects of norms on PCD use frequency (DiD approach, n = 743)

Note: Standard error in parentheses; control variables are directly measured rather than recategorized and treated as continuous, including age, sex (1 = female), rank in company, AC setpoint, AC adjustment, window adjustment, blind adjustment, baseline thermal comfort vote; a ‘+’ sign means more frequent use and a ‘−’ sign means less frequent use.
Commitment intentions
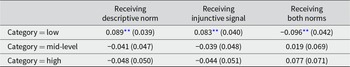
Treatment effects on the commitment to lighter clothing and PCD use are reported as average marginal effects and relative risk ratios (RRR) from multinomial logistic regressions. Regarding lighter clothing (Table 5), there is evidence that providing both norms can increase commitment to lighter clothing. In contrast, descriptive or injunctive norms alone seem to reduce the likelihood of such commitment. Specifically, considering the effects of the descriptive norm, participants are, on average, 8.9 percentage points (p = 0.022) more likely to make a ‘low’ commitment to lighter clothing when receiving descriptive norm information. However, the coefficients for ‘mid-level’ and ‘high’ commitment are not statistically significant. Similarly, leaders’ injunctive norm signal seems to reduce the commitment level to lighter clothing. According to the marginal effects, participants are, on average, 8.3 percentage points (p = 0.037) more likely to make a ‘low’ commitment to lighter clothing when receiving the injunctive signal. Again, the marginal effects for ‘mid-level’ and ‘high’ commitment are not statistically significant.
Average marginal effects of social norm nudges on commitment to lighter clothing (n = 743)

Note: Standard error in parentheses; control variables are treated as categorical, including age, sex (1 = female), rank in company, AC setpoint, AC adjustment, window adjustment, blind adjustment and baseline thermal comfort vote; age, company rank, AC setpoint, and baseline thermal comfort are recategorized;
** p < 0.05.
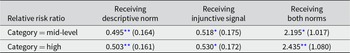
The results in the form of RRRs present a clearer picture (see Table 6). Participants receiving the descriptive norm tend to be less likely to indicate a ‘mid-level’ or ‘high’ commitment, than they are to make a ‘low’ commitment (RRRmid = 0.495, p = 0.034; RRRhigh = 0.503, p = 0.032). Similar effects are found when participants receive an injunctive signal (RRRmid = 0.518, p = 0.052; RRRhigh = 0.530, p = 0.051).
Effects in relative risk ratio of social norm nudges on commitment to lighter clothing (n = 743)

Note: Standard error in parentheses; ‘low’ commitment is the reference category; control variables are treated as categorical, including age, sex (1 = female), rank in company, AC setpoint, AC adjustment, window adjustment, blind adjustment and baseline thermal comfort vote; age, company rank, AC setpoint and baseline thermal comfort are recategorized;
* p < 0.1, **p < 0.05.
Both norm treatments together seem to induce stronger commitment. The result in Table 5 shows that participants receiving both norms are 9.6 percentage points (p = 0.023) less likely to make a ‘low’ commitment to wearing lighter clothing. Although the marginal effects are in the positive direction for the ‘mid-level’ and ‘high’ commitment categories, they are not statistically significant. Regarding the RRRs, participants receiving both treatments are 2.2 times more likely to choose ‘mid-level’ commitment (p = 0.090), and 2.4 times more likely to indicate ‘high’ commitment (p = 0.045), than to make a ‘low’ commitment. Thus, there is statistically significant evidence suggesting that both norm information together can lead to a higher commitment to lighter clothing.
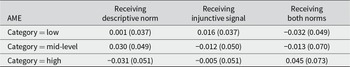
The results in Tables 7 and 8 reveal the null effects on the commitment to more PCD use. In sum, the main effects of receiving descriptive norm, injunctive norm and both treatments are not statistically significant, suggesting that the norm treatments might not work in increasing commitment to PCD use.
Average marginal effects of social norm nudges on commitment to more PCD use (n = 743)

Note: Standard error in parentheses; control variables are treated as categorical, including age, sex (1 = female), rank in company, AC setpoint, AC adjustment, window adjustment, blind adjustment and baseline thermal comfort vote; age, company rank, AC setpoint and baseline thermal comfort are recategorized.
Effects in relative risk ratio of social norm nudges on commitment to more PCD use (n = 743)

Note: Standard error in parentheses; ‘low’ commitment is the reference category; control variables are treated as categorical, including age, sex (1 = female), rank in company, AC setpoint, AC adjustment, window adjustment, blind adjustment and baseline thermal comfort vote; age, company rank, AC setpoint and baseline thermal comfort are recategorized.
Robustness check
To systematically evaluate our analytical choices, we present a summary of results where we modified one analytical setting at a time (either model specifications or exclusion criteria different from our main analyses above), while keeping other specifications unchanged (See Table 9). Apart from the pre-planned analyses, the rest of the robustness tests were run using the model specifications presented above, with DiD for behavioral intentions and multinomial regression for commitments. The model results can be found in Supplementary Appendix E.
Robustness tests

Note: Pre-planned analyses used recategorized 3-category dependent variables, with ‘cooler’, ‘no change’, and ‘warmer’ for change in clothing warmth, and ‘more use’, ‘no change’, ‘less use’ for change in PCD use frequency; ‘No effect’ refers to all three treatment effects failing to pass the p < 0.1 significance level, unless specified.
Overall, the results of the three norm treatments on lighter clothing behavior and commitment are not always robust. In contrast, the effect of any norm conditions on PCD outcomes is almost consistently non-existent. In the cases of using logistic regressions for clothing behavior and alternative case selection, the significant effect of both norms on lighter clothing is not substantiated, while the injunctive norm signal becomes significantly effective in the multinomial logistic model on clothing behavior. On the other hand, the results of the treatments on PCD outcomes are relatively consistent, except when both norms could lead to less PCD use using the full dataset. Notably, when controlling additionally for the decrease in thermal comfort after the suggested hypothetical increase in AC setpoints, the effects from DiD models do not change. This rules out the impact of the hypothetical setpoint increase in the post-treatment questions to some extent.
Discussion
This experiment attempted to increase financial employees’ uptake of sustainable cooling behaviors using three types of normative information: descriptive norm only, leaders’ injunctive norm signal only, and both. Based on the final regression analyses of two outcome measures – behavioral intentions and commitment to the behaviors, we only demonstrated the effectiveness of using both norm treatments to increase the choice of and commitment to lighter clothing. Meanwhile, the rest of the norm treatments were ineffective in generating more behavior change compared to the control condition (see Table 10). Providing only descriptive norm or injunctive norm signal is even likely to result in a weaker commitment to wearing lighter clothing in the workplace. In the following sections, we seek to explain the mixed results in light of the existing literature.
Summary of hypothesis testing

Before discussing the disconnect between the hypotheses and the results, it is worth noting that the control condition seems to have already worked (see the descriptive results from Figures 5 and 6), although this is not part of the original hypotheses. Specifically, the group receiving the control condition showed slightly more acceptance of lighter clothing, the largest shift to more PCD use, and higher levels of commitment to both lighter clothing and PCD use. However, we could not provide further evidence on the effectiveness of the control condition for the following reasons. Firstly, adding a further control group without any information provision would not be feasible for us to measure pre- and post-treatment behaviors because this would add to the confusion or suspicion about the experiment’s intention. A related point on the experimental set-up is that the admin’s words at the start might have introduced an injunctive normative expectation with the sentence ‘we would like to use less AC and more personal cooling in the company’ (Deutsch and Gerard, Reference Deutsch and Gerard1955). Whilst this injunctive expectation might have been behind the positive change in the control group, we still consider this sentence necessary as background information to establish a relatively realistic scene for a company conversation on a non-work-related topic. Secondly, due to the hypothetical nature of the experiment, without mentioning the slightly raised AC setpoints and the possible influence on their thermal comfort, it would be difficult to observe any change in participants’ cooling behaviors. On the other hand, in the absence of such background and educational information as well as setpoint raises, the effect of the norm treatments might have been strongly significant and had large effects. However, this conjecture invites further experimental investigation that relies on a different control condition.
Effectiveness of the social norms
Combining both descriptive norm and injunctive norm signal led to a stronger commitment to lighter clothing (H5b) and the adoption intention of lighter clothing (H5a). Interestingly, the respective effects of receiving descriptive and injunctive norms on the commitment to lighter clothing are negative, but their combination can generate a stronger commitment (H1b and H2b versus H5b). We speculate that by receiving the two consistent pieces of information, participants can more clearly perceive the normative influence and importance of acting upon the treatment. In other words, combining both norms that are congruent to each other creates a synergy that counteracts the boomerang effects of the single norms from psychological reactance, to be discussed next, and the context-dependent limitations of descriptive norms (Reno et al., Reference Reno, Cialdini and Kallgren1993). The power of this combined information has been explicitly discussed in previous literature, including such empirical studies as Kandul et al. (Reference Kandul, Lang and Lanz2020) and Schultz et al. (Reference Schultz, Estrada, Schmitt, Sokoloski and Silva-Send2015) and the review by Miller and Prentice (Reference Miller and Prentice2016).
Limits of social norms
On the other hand, psychological reactance might have played a role in the contradictory results between behavioral intention and commitment regarding the effect of single-norm conditions on lighter clothing. Specifically, the descriptive norm treatment did not increase the choice of lighter clothing but may even undermine one’s commitment to light clothing (H1a versus H1b). While there is no conclusive evidence that the injunctive norm treatment increased the adoption of lighter clothing, the injunctive norm signal from leaders may lower one’s commitment (H2a versus H2b). Psychological Reactance Theory suggests that one’s freedom could be threatened or restricted with the provision of recommendations (Bergquist and Nilsson, Reference Bergquist and Nilsson2019; Reynolds-Tylus et al., Reference Reynolds-Tylus, Martinez Gonzalez and Quick2019). As mentioned earlier, descriptive norm information and the leaders’ injunctive norm signal backfire only in the commitment to clothing but not in the behavioral intention towards lighter clothing. This counterintuitive result is possibly due to the way the questions of post-treatment outcomes were phrased. We explicitly asked participants for their plan for the next working day about the warmth level of their clothing, while the commitment measure implies a longer time in the absence of a given period. In this regard, with the commitment measure, participants would be more likely to feel their freedom being restricted after receiving the descriptive norm or injunctive norm signal alone, than with the behavioral intention measure for the next working day only. In other words, as a reaction to the single-norm recommendations, participants might be willing to try wearing lighter clothing for one week, but they might not want to commit to this behavior for a long time due to a higher perceived threat to freedom. However, no question item was devised in the experiment to measure feelings about the treatment, such as anger or anxiety, so there is no proof from the study, making this point only an inconclusive extrapolation.
Characteristics of the cooling behaviors
One explanation for the null effects of norm treatments in PCD use compared to the clothing behavior lies in the peculiarities of two cooling behaviors. PCDs might not be fully available in the office or might interfere with work by producing noise, causing dizziness and dry eyes, or changing one’s hairstyle with increased airflow from the perspective of office impression management (Schneider, Reference Schneider and Tedeschi1981; He et al., Reference He, Li, Wang, He and He2017; André et al., Reference André, De Vecchi and Lamberts2020a). Studies also found that participants consider personal fans unnecessary when they can control office temperature settings (He et al., Reference He, Li, Li, Li, Yan and Tan2018; Yang et al., Reference Yang, Hitchings, Lotti and Shipworth2022). In contrast, clothing is a more personal possession that participants are familiar and experienced with and can control and easily adjust, as they must own clothes of different levels of warmth as a basic necessity.
Order effect in the design
Finally, the null effects of all the norm treatments on PCD use may also be attributed to an order effect, considering how we measured the post-treatment outcomes, which then relates to the complementarity of and spillover between the two cooling behaviors. Commonly found in surveys, the question order effect denotes that respondents may consider what they have provided for the previous questions when they comprehend and answer the subsequent question (Rasinski et al., Reference Rasinski, Lee, Krishnamurty, Cooper, Camic, Long, Panter, Rindskopf and Sher2012; Dillman et al., Reference Dillman, Smyth and Christian2014). In this case, participants’ answers to the PCD use measure might have been affected by their answers to the clothing choice measure. Meanwhile, existing reviews also highlight that the spillovers across different target behaviors after a social norms intervention are often uncertain – either counterproductive or facilitating (Rasul and Hollywood, Reference Rasul and Hollywood2012; Constantino et al., Reference Constantino, Sparkman, Kraft-Todd, Bicchieri, Centola, Shell-Duncan, Vogt and Weber2022; Kumar et al., Reference Kumar, Caggiano, Cuite, Felder and Shwom2023; An et al., Reference An, Liu, Zhang, Song, Ezzine-de-blas, Dai, Zhang, Lewison, Bohnett, Stow, Xu and Bryan2024). This could serve as a possible interpretation of the statistically significant effects found in clothing-related outcomes (H2b, H5a and H5b) but not in PCD-related ones. After the treatments, participants were first asked about their clothing warmth for the next working day, followed by their intention to use PCDs. As a result, participants seemed to have answered their behavior intention of PCD use based on their answers to the previous question on clothing warmth. This shows that they might have wanted to engage with one of the two cooling behaviors, which they thought suffices to embrace the slightly raised AC setpoints.
This order effect is supported by the results in the Control Group and the Both Norm Group, as discussed earlier in the descriptive results of behavioral intentions (see Figure 5). When participants in the Control condition indicated a smaller shift to lighter clothing, they tended to compensate for the cooling situation by selecting more frequent use of PCDs. When participants in the Both Norm condition chose relatively lighter clothing, they tended not to indicate a higher frequency of PCD use. This contradiction implies that the effectiveness of the norm treatments on the behavioral intention towards more PCD use could have been eclipsed by the choices of lighter clothing in the first place. Participants may likely find it advisable to adopt lighter clothing only (the choice provided the first in the questionnaire) rather than to also adopt PCD use (the choice provided the second). However, considering that we did not randomize the order of the two post-treatment behavioral intentions, further research is needed to validate the possible interference by the question order and determine if the effect would be reversed if the PCD use measure appeared first.
Limitations and future research
There are a few caveats in our experiment. First and foremost, the evidence from our online survey experiment might have been constrained by hypothetical scenarios and could work differently in real-world settings with observations of actual behaviors (Harrison and List, Reference Harrison and List2004; Mutz, Reference Mutz2011; Vesely and Klöckner, Reference Vesely and Klöckner2020). However, we recognize that it is equally challenging to maneuver the temperature settings in real offices (Lakeridou et al., Reference Lakeridou, Ucci, Marmot and Ridley2012) and that a field experiment was impossible for us to run due to COVID lockdown restrictions in Guangdong, China, at the time of our experiment. Secondly, the self-reported frequency of PCD use may not be the best measure of the behavioral intention. It could have been challenging for participants to provide an overall score for their frequency of using any PCDs mentioned in the questionnaire, especially when using different PCDs at different moments. There are additional dynamic dimensions, such as the time of use and combinations of PCDs. Future studies could benefit from field observations to record the above details. Thirdly, we recategorized the commitment outcomes as unipolar to avoid empty- or small-cell issues and to reflect the degree of positive confirmation (e.g., a clear yes versus maybe). Therefore, the results are not comparable to other studies using the same seven-point scale. Finally, caution is warranted in interpreting the results since we did not correct for multiple hypothesis testing. The observed effects of the norm treatments may not hold under more stringent significance criteria.
For future research, we recommend the following improvements. As Parsons (Reference Parsons2002) recognized in their lab experiment, participants’ capability to adjust clothing is bounded to the extent of maintaining modesty and still being accepted by others around. Our experiment might benefit from a better descriptive normative message with unambiguous images of acceptable lighter clothing, such as the combination of shorts and a T-shirt. Another strand of social-norm literature emphasizes the role of social proximity in moderating the effectiveness of norm interventions (Goldstein et al., Reference Goldstein, Cialdini and Griskevicius2008; Bergquist and Nilsson, Reference Bergquist and Nilsson2018; Xiao et al., Reference Xiao, Sparkman and Constantino2023). As such, selecting a reference group with greater social proximity, such as company colleagues in this context, could potentially improve the treatment effect, compared to using the population of financial professionals in Guangdong. It is also important to note that our online cross-sectional experiment does not provide evidence of the long-term effectiveness of social norms, as we cannot observe actual behavior or behavior across time. Some literature indicates that social norm interventions could be more effective over an extended period (Trinh et al., Reference Trinh, Fung and Straka2021). Therefore, given insufficient evidence to confirm parallel trends over time between comparison groups prior to treatment (Angrist and Pischke, Reference Angrist and Pischke2015), we recommend longitudinal field experiments in natural office settings with consistent measurements to both allow habits to form over time and provide the necessary pre-experimental data. Finally, we suspect that the outcomes incongruent with the literature could be specific to the context and population of our study. It is yet to be confirmed whether heterogeneous effects exist in other industries compared to the financial industry, so we encourage further studies to test the social norm messages for sustainable cooling in diverse contexts.
Policy implications
This experiment sheds light on energy-saving policies in organizations, providing an empirical reference for policymaking for more sustainable cooling in regions of a humid subtropical climate in China, and for further investigation and cross-cultural comparison in similar climates such as south-eastern United States and eastern Australia. Specifically, it offers guidance on promoting sustainable cooling supplements, which can improve energy demand management and alleviate office overcooling. First and foremost, descriptive norm information and leaders’ injunctive norm signal might work better in tandem in behavioral interventions promoting sustainable cooling supplements in offices. Organizations can show their employees that others from the same industry are increasingly using personal cooling, while also making salient the leadership’s injunctive signals to show support for the change. The combination is crucial in that descriptive norms can address the lack of reflexivity (Sahakian et al., Reference Sahakian, Rau, Grealis, Godin, Wallenborn, Backhaus, Friis, Genus, Goggins, Heaslip, Heiskanen, Iskandarova, Louise Jensen, Laakso, Musch, Scholl, Vadovics, Vadovics, Vasseur and Fahy2021) regarding cooling the body rather than the space in offices. Injunctive norms from the authority then improve the credibility and highlight the social approval of using more personal cooling with the trans-situational trait (Reno et al., Reference Reno, Cialdini and Kallgren1993). It would be insightful for policymakers to test low-cost social norm nudge programs with this combination on a large scale in the financial industry.
Secondly, educational efforts are crucial to provide office workers with sufficient information regarding the effectiveness and means of personal cooling (Abrahamse et al., Reference Abrahamse, Steg, Vlek and Rothengatter2005; Lotti et al., Reference Lotti, Barile and Manfredi2023), as demonstrated in our experiment design. The information could be delivered via the most frequented communication channels such as WeChat, or more formally, via email sent from the leadership (Russell et al., Reference Russell, Evans, Fielding and Hill2016).
Thirdly, while offering employees a variety of personal cooling objects might raise monetary concern only, a more fundamental obstacle to sustainable office cooling is the suit tradition entrenched in industries featuring formality. Thus, a bold step is necessary away from the strict clothing requirement that, in turn, calls for low indoor temperatures. The Japanese ‘Cool Biz’ program emphasizes the role of leaders as role models in adopting less formal but socially acceptable work clothing in public. Again, our experiment provides a glimpse of hope that leaders’ social approval of lighter clothing, combined with the prevalence of a relaxed dress code in the industry, can induce more willingness to switch to lighter clothing and commit to this action. Challenging the industry norm will be no easy feat, but easing the clothing regulation will be a stride towards more opportunities to reduce energy demand for cooling and thermal discomfort from overcooling. Fortunately, a promising development occurred in Hong Kong when financial companies such as Everbright Securities and Bank of China Hong Kong started to adjust corporate dress codes to allow higher AC temperatures (Ng et al., Reference Ng, Choi and Yiu2022). These companies implemented the green initiative to set AC temperatures to approximately 25–26°C and allow business casual dress code without suit jackets and ties. Showcasing this example to indicate a dynamic social norm might initiate reconsideration of the dress code in its neighboring and less Westernized counterparts, the financial companies in Guangdong province (Sparkman et al., Reference Sparkman, Howe and Walton2021).
Finally, a balanced approach is necessary to promote personal cooling and AC default setpoint regulation in offices. The intention of using personal cooling strategies to supplement air-conditioning is to offer sufficient cooling. This way, cooling equity can be achieved by allowing employees to use additional personal cooling when necessary and easing discomfort for those feeling overly cooled by low AC temperatures (Parkinson et al., Reference Parkinson, Schiavon, de Dear and Brager2021). However, an environment with higher default AC setpoints might disadvantage vulnerable groups during heatwaves, especially those with heat-related health conditions (Meade et al., Reference Meade, Notley, Kirby and Kenny2024). Furthermore, building managers and stakeholders should take heed to avoid undermining productivity with unbearably high-temperature settings (Wang et al., Reference Wang, Li, Menassa and Kamat2019; Kimura et al., Reference Kimura, Takemura, Nakashima, Kobori, Nagahara, Numao and Shinohara2020).
Conclusion
To conclude, we tested the effectiveness of social norm information nudges on the uptake of lighter clothing and more PCD use in an online survey experiment among Chinese financial employees in Guangdong. The control group already exhibited desired behavioral intentions, while the addition of normative information treatments did not show significant effectiveness compared to the control overall. The exception was the positive effects on nudging toward lighter clothing behavior and commitment when both norm treatments were given. Single-norm conditions might even lower commitment to lighter clothing. As the first experiment on office personal cooling behavior, our study contributed to the scholarship on social norm interventions by highlighting the potential complications within this type of behavior. Current practices of air-conditioned cooling can be challenging to replace, as solidified by building standards, infrastructures and everyday expectations (Khosla et al., Reference Khosla, Renaldi, Mazzone, McElroy and Palafox-Alcantar2022). The inconclusiveness in the effect of our social norm treatments warrants further studies in real-world settings, with better designs of social norms, and among different populations. That said, in hopes of ‘cooling people, not buildings’ in an increasingly warmer world (Lizana et al., Reference Lizana, Miranda, Gross, Mazzone, Cohen, Palafox-Alcantar, Fahr, Jani, Renaldi, McCulloch and Khosla2022, p. 1089), the power of social norms should be carefully harnessed.
Supplementary material
The supplementary material for this article can be found at https://doi.org/10.1017/bpp.2025.3.
Acknowledgments
We would like to thank Dr. Gesche Huebner, Dr. Manos Chaniotakis, Dr. Rui Zheng, and Dr. Shumin Li for their valuable advice on the experiment design. We are also grateful to Dr. Nicole Watson for her suggestions on statistical analyses and Dr. Niamh Murtagh and Dr. Mike Brock for their feedback on the study report. Finally, we thank the two anonymous reviewers for their constructive comments that helped improve this paper.
Funding statement
This work received no specific grant from any funding agency, commercial or not-for-profit sectors.
Competing interests
The author(s) declare none.


 Open access