

There is a worldwide workforce shortage in psychiatry.Reference Brockington and Mumford1–Reference Henfrey4 Here in the UK, the Royal College of Psychiatrists Census 2017 projected that UK ‘workforce provision is unlikely to be sufficient to meet the mental health needs of the patient population requiring psychiatric input.’5 Indeed, recruitment to core psychiatry training in the UK has consistently had the lowest competition ratio and the highest percentage of unfilled posts of all specialties.6–Reference Goldacre, Fazel, Smith and Lambert8 Moreover, failure to attract UK graduates has been ‘masked by overseas recruitment, concealing posts that would have been otherwise unoccupied’.Reference Mukherjee, Maier and Wesseley7 Extant literature, predominately survey-based, indicates that cultural and institutional biases against psychiatry influence junior doctors' specialty choice and are a phenomenon, to a greater or lesser extent, internationally.Reference Choudry and Faroo9–Reference Denman, Oyebode and Greening11 However, to our knowledge, research has not been carried out to examine the likelihood of actual application to psychiatry training, given doctors' sociodemographic and educational background, medical education performance, and medical school and foundation school attended.
The recently established UK Medical Education Database (UKMED) now provides a unique opportunity to evaluate the association of such factors with actual application to psychiatry training in the UK.Reference Dowell, Cleland and Fitzpatrick12 The UKMED contains sociodemographic and academic achievement data of medical graduates from secondary education to postgraduate training, details regarding individuals' undergraduate and foundation level pathways, and data collected during applications to specialty training. This enables analysis of factors hypothesised to be associated with the decision to apply for psychiatry training for a large cohort of UK doctors. Our aim was to identify independent factors associated with the decision to apply for psychiatry training in the UK and to delineate typologies of applicants likely to apply, thereby informing workforce planning policy makers involved with attempts to increase recruitment to psychiatry.
Methods
Data, study population and variables
The UKMED Development Group provided remote access to anonymised data on all UK doctors who entered medical school in 2007/8, via the Health Informatics Centre Safe Haven at Dundee University (https://www.dundee.ac.uk/hic/hicsafehaven/). A blanket ethics application exemption applies to all UKMED approved research projects. Queen Mary University of London Research Ethics Committee, on behalf of all UK medical schools, confirmed this ethics exemption.
Focusing on ‘first-time’ applications, the study population included all doctors who applied for specialty training in 2015 or earlier and for whom there was no prior application record in the UKMED data.
Two binary outcomes were investigated:
1. whether or not the doctor applied to core psychiatry training, possibly alongside applications to ‘level 1’ training posts in one or more of the other specialties open to newly qualified doctors; and
2. whether or not the doctor applied solely to core psychiatry training
The associations between these outcomes and a range of background factors were examined using multivariable logistic regression.
There were 14 different ethnic categories in addition to the White category; to avoid problems with small cell sizes in multivariable analyses, these were amalgamated in a higher ethnicity binary variable, BME (Black and minority ethnic) and White. Three more variables were similarly re-categorised into a yes/no format: disability, ‘UK educated’ and Annual Review of Competence Progression (ARCP) outcome.13 ‘UK educated’ identified doctors who had completed their secondary education and any undergraduate degrees in the UK prior to entering medical school.
There are two types of medical degree programmes: ‘standard’ programmes are aimed primarily at school leavers but may also be open to applicants already holding other degrees, while ‘graduate’ programmes are open only to the latter type of applicant. We therefore classified individual's medical school Entry Status as either ‘Non-graduate entrant to Standard Programme’, ‘Graduate entrant to Standard Programme’, or ‘Entrant to Graduate Programme’. Foundation Programme Educational Performance Measure (EPM) outcomes,14 recorded as decile scores for some doctors and as quartiles for others, were recoded as top two quartiles v. bottom two quartiles. Although ARCP outcomes in the data were coded ordinally, most outcomes were ‘Satisfactory’, so we recoded as satisfactory or not.Reference Tiffin, Illing and Kasim15
For systematic reasons, some variables had large numbers of missing values, such as the Foundation Programme Situational Judgement Test (SJT),14 which was first introduced for 2013 entry and not taken by all doctors in the sample. Likewise, most graduate applicants to medical school take the Graduate Australian Medical Schools Admissions Test (GAMSAT; https://gamsat.acer.org/) rather than the UK Clinical Aptitude Test (UKCAT; https://www.ukcat.ac.uk/ukcat-test/), so scores on the latter were missing for those doctors.
Statistical analysis
Univariate analyses identified missing, invalid and outlying values, and assessed distributions for normality. A number of important variables, including total Higher Education Statistics Agency (HESA) tariff (a score for qualifications held on application to university)16 and total UKCAT score, were unrecorded for graduate entrants to medical school. We therefore conducted four parallel analyses examining the two outcomes in (sample A) all doctors (n = 7634), and (sample B) those who had been non-graduate entrants to medical school (n = 5540). We examined the distributions and missing values of each factor in each sample and calculated application rates within each subgroup of doctors (Supplementary Table 1a,b, available at https://doi.org/10.1192/bjb.2019.33).
Appropriate bivariate tests of association were conducted and variables significantly associated with either outcome in either sample were included in all four preliminary multivariable logistic regression models. For each model, list-wise deletion excluded cases containing missing values on any variable. The following variables were non-significant in all four preliminary models and were excluded from all final models: gender, the index of multiple deprivation (a neighbourhood-based measure of social deprivation), the participation of local areas classification (a neighbourhood-based measure of participation in higher education), Office of National Statistics socioeconomic class, whether or not a doctor's parent(s) had a degree, HESA tariff score, UKCAT score, GAMSAT score, whether or not a doctor had intercalated, UK educated (whether or not a doctor had been secondary school and undergraduate educated in the UK) and Foundation Programme SJT score.
Model goodness of fit was assessed using the Hosmer–Lemeshow test (P > 0.05) and the significance of independent variables was assessed using a Wald test (P < 0.05).Reference Long and Freese17 Model classification quality (concordance between predicted and observed outcomes) was assessed using receiver operating characteristic diagnostics, where an area under the curve (AUC) statistic of 0.9–1.0 is considered excellent discrimination, 0.8–0.9 good, 0.7–0.8 fair, 0.6–0.7 poor and 0.5–0.6 no better than chance.Reference Zhou, Obuchowski and McClish18 Sample size adequacy was determined using the formula, N = 10 x k/p, where p is the proportion of negative or positive cases (whichever is the smallest) in the population and k is the number of independent variables, to indicate the minimum number of cases required.Reference Peduzzi, Concato and Kemper19
Two-way interaction effects were explored within the final models reported and, finally, modelling results were interpreted in relation to our study aims, based on predicted probabilities. Typologies of the predicted probability (range 0–1) of the outcome, based on profiles of values for the independent (categorical) variables in a model, were computed. This enabled configurations of variables that were substantively important in influencing the outcome to be identified.Reference Long and Freese17 Analyses were conducted in Stata 14.20
Availability of data and material
Data files used in this study are securely held by the UK Medical Education Database Project and cannot be shared by the authors.
Results
Descriptive statistics
Overall, 5.29% (404/7634) applied to core psychiatry specialty training, including 2.66% (203/7634) who applied solely to the specialty (Table 1). Thus, the latter group comprise just over half (203/404 = 50.25%) of all applicants to psychiatry.
Frequency and patterns of specialty training applications (n = 7634)
Bivariate analyses
Bivariate tests of association, using Pearson's chi-squared test, and univariate logistic regression where appropriate, revealed statistically significant associations (P < 0.05) between applications to core psychiatry training and many of the independent variables (Supplementary Table 2). These variables were incorporated in exploratory multivariable logistic regression models.
Application rates to core psychiatry varied between the medical schools and foundation schools that doctors had attended, ranging from 0.00% to 8.95% across medical schools and from 1.02% to 10.47% across foundation schools (Supplementary Table 3).
Model 1: Applied to core psychiatry training (sample A)
The analytic sample comprised 6603 doctors classified by entry status as non-graduate entrants to standard entry programmes (n = 5247), graduate entrants to standard entry programmes (n = 794), and entrants to graduate entry programmes (n = 562). The predictors included in the final model were BME, disability, age on entry to medical school, entry status, medical school, Foundation Program Application System (FPAS) EPM and foundation school.
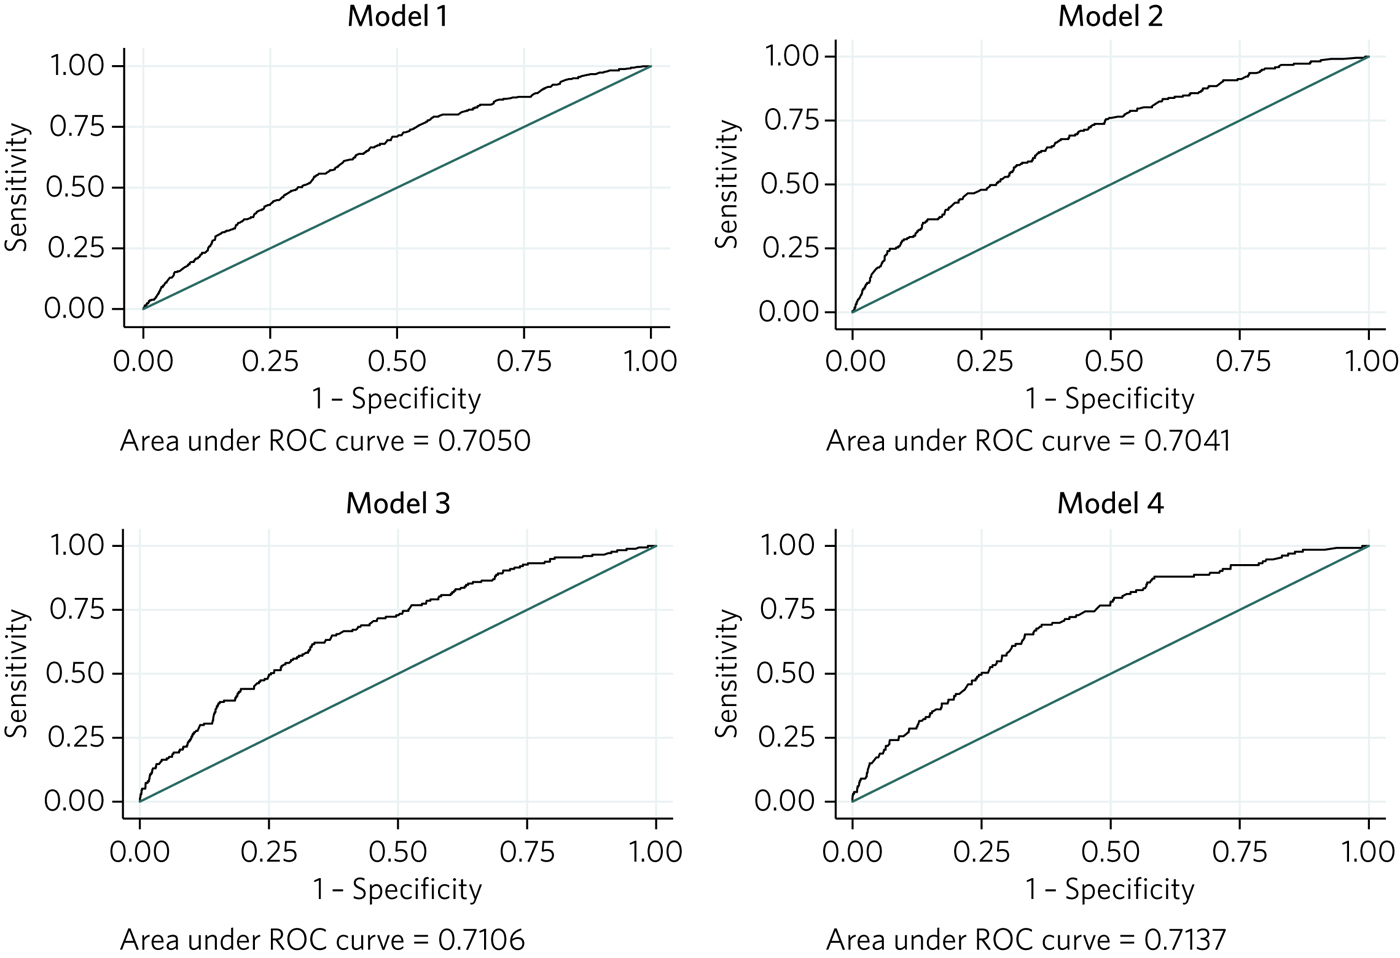
Age on entry to medical school, and FPAS EPM were significantly associated with application to core psychiatry training, whereas medical school and foundation school attended, BME, disability and entry status were non-significant (Supplementary Table 4). The discriminatory ability of the model to correctly classify doctors with respect to the outcome was fair (AUC = 0.71) (Fig. 1, Model 1).
Receiver operating characteristic (ROC) curves for logistic regression models 1–4.
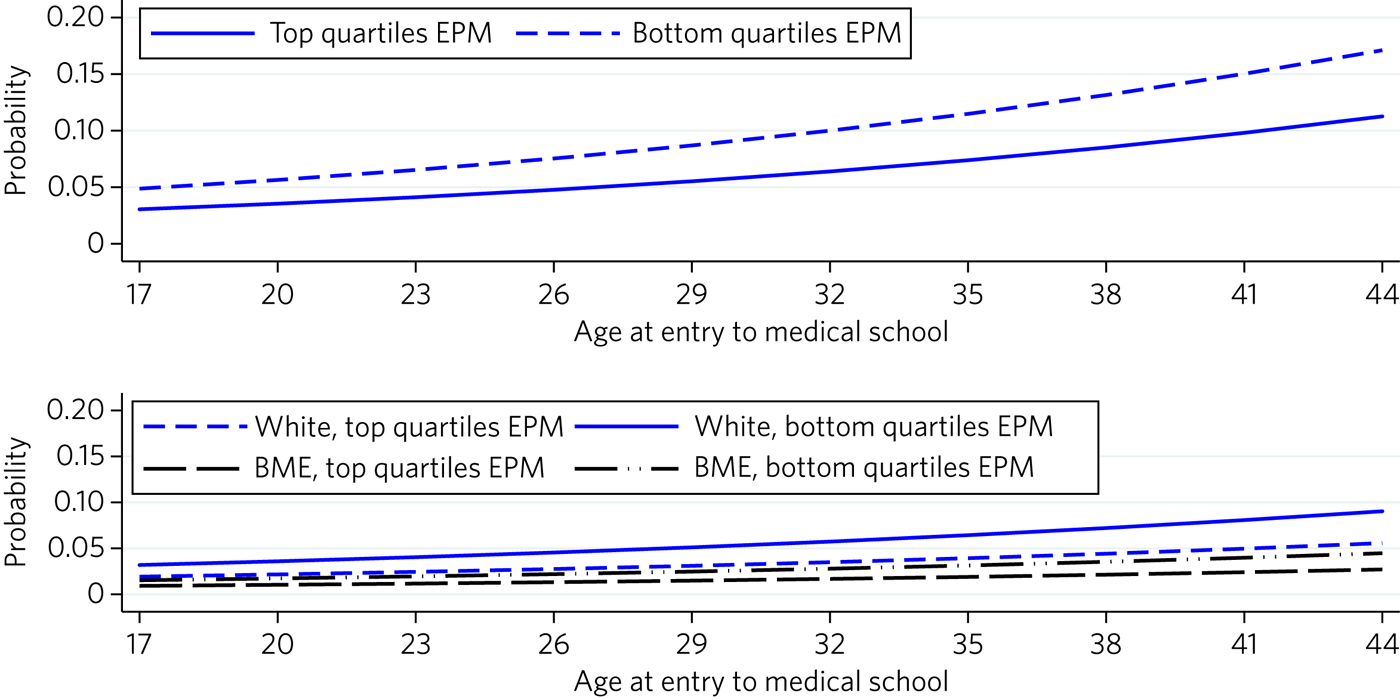
The odds of having applied to core psychiatry training and other specialties for doctors in the top two EPM quartiles were 0.61 times those in the bottom two quartiles (Table 2). However, on average, for each 1 year increase in age at entry to medical school the odds of having applied to core psychiatry specialty training increased by 5% (Fig. 2, graph 1).
Graph 1: predicted probability of the outcome ‘applied to core psychiatry specialty training’ adjusted by FPAS EPM performance and age at entry to medical school (Model 1: sample = all entry programmes). Graph 2: predicted probability of the outcome ‘applied solely to core psychiatry specialty training’ adjusted by FPAS EPM performance, BME status and age at entry to medical school (Model 3: sample = all entry programmes).
Odds ratios (95% confidence interval) for independent predictors of the outcomes in logistic regression models 1 to 4
BME, Black and minority ethnic; EPM, Educational Performance Measure.
Model 2: Applied to psychiatry training (sample B)
The analytic sample comprised 4717 non-graduate entrants to medical school. Predictors included in the final model were BME, disability, type of secondary school attended, medical school, FPAS EPM and foundation school. Of these, only type of secondary school attended and EPM were significantly associated with application to core psychiatry training (Supplementary Table 4). The discriminatory ability of the model to correctly classify doctors in respect of the outcome was fair (AUC = 0.70) (Fig. 1, Model 2).
The odds of having applied to core psychiatry and other specialties for doctors in the top two quartiles of EPM were 0.57 times those in the bottom two quartiles, and the odds for those who had attended state-funded schools were 0.74 times those for doctors who had attended private schools (Table 2).
The predicted probability of having applied to core psychiatry training for a doctor who had attended a privately funded school and who had an EPM score in the bottom two quartiles was 0.06, compared with 0.03 for a state-schooled doctor with an EPM score in the top two quartiles (Supplementary Table 5).
Model 3: Applied solely to core psychiatry training (sample A)
The analytic sample comprised 6601 doctors classified by entry status as non-graduate entrants to standard entry programmes (n = 5426), graduate entrants to standard entry programmes (n = 794) and entrants to graduate entry programmes (n = 561). Predictors included in the final model were BME, disability, age on entry to medical school, entry status, medical school, FPAS EPM and foundation school, of which BME, age at entry to medical school and EPM had a significant ability to predict application solely to core psychiatry training (Supplementary Table 4). The discriminatory ability of the model to correctly classify doctors in respect of the outcome was fair (AUC = 0.71) (Fig. 1, Model 3).
The odds of having applied solely to core psychiatry training for doctors in the top two quartiles of EPM score were 0.59 times those for doctors in the bottom two quartiles, the odds for BME doctors were 0.47 those for non-BME doctors, and for a 1 year increase in age at entry to medical school the odds increased by 4% (Table 2).
Non-BME doctors who had achieved an EPM score in the bottom two quartiles were the most likely to have applied solely to psychiatry (0.04), and BME doctors who had achieved a an EPM score in the top two quartiles were the least likely to have applied (0.01) (Supplementary Table 5). However, across typologies, as age at entry to medical school increased so the probability of sole application increased (Fig. 2, Graph 2).
Model 4: Applied solely to core psychiatry training (sample B)
The analytic sample comprised 5206 non-graduate entrants to medical school. Predictors included in the final model were BME, disability, type of secondary school attended, medical school, FPAS EPM and foundation school. Of these, BME and EPM were significantly associated with application solely to core psychiatry (Supplementary Table 4). The discriminatory ability of the model to correctly classify doctors in respect of the outcome was fair (AUC = 0.71) (Fig. 1, Model 4).
The odds of having applied solely to core psychiatry training for doctors in the top two quartiles of EPM were 0.53 times those for doctors in the bottom two quartiles, and the odds for a BME doctor were 0.43 times those of a non-BME doctor (Table 2).
Non-BME doctors in the bottom two EPM quartiles had the highest probability of sole application (0.04), and BME doctors in the top two EPM quartiles had the lowest probability (0.01) (Supplementary Table 5).
Discussion
Our study identified factors that are independently associated with the likelihood of applying to psychiatry for a cohort of junior doctors applying for the first time to core training posts in the UK during 2015. It responds to calls for a clearer understanding of the drivers of the demand and supply gap in recruitment to psychiatry training at CPT1 level (1st year of core training)21 and of the maldistribution of doctors in the medical workforce.Reference Gorman22 Overall, 5.3% of the sample applied to psychiatry training, but only 2.7% applied solely to the specialty. Significant predictors included ethnicity, age, type of secondary school attended, and a measure of prior academic achievement (EPM). For both outcomes, application to psychiatry training alongside other specialties and application solely to psychiatry, doctors with above-average EPM scores were less likely to apply. Moreover, for both outcomes, the likelihood of applying to psychiatry training increased as doctors' age increased. With respect to application to psychiatry alongside other specialties, when graduate entrants were removed from the sample, state-schooled doctors with above-average EPM scores were less likely to apply than their counterparts, while BME doctors, whatever their EPM performance, were less likely to have applied than their White counterparts. The findings indicate that White doctors educated at privately funded secondary schools who had achieved a below average EPM score were the most likely to apply for psychiatry training, and that likelihood increased with doctors' age at entry to medical school.
The extant literature on recruitment into psychiatry is predominately composed of surveys and questionnaire-based studies eliciting the views of medical students, trainees and consultants on factors that may influence decisions to pursue a career in psychiatry.Reference Farooq, Lydall, Malik, Ndetei and Bhugra3,Reference Choudry and Faroo9,Reference Denman, Oyebode and Greening11,Reference Halder, Hadjidemetriou and Pearson23 Authors of a recent systematic review declared that ‘Psychiatry as a career has been negatively regarded and unpopular among medical students’ and, as a consequence, ‘about 3.6% of British graduates decide on a career in psychiatry whereas 6% are needed.’Reference Choudry and Faroo9 Evidence from other studies indicates that perceptions about psychiatry may be influenced by experiences at medical school (including the type and amount of teaching), at foundation school, and during undergraduate and postgraduate placements.Reference Beattie, Crampton, Swarzlose, Kumar and Cornwall10,Reference Korzun, Dharmaindra and Karavangattu24,Reference Budd, Kelley and Day25 However, a survey of medical students, aged 18 to 37 years, found that age was not significantly associated with having rated psychiatry in the top three most interesting specialties.Reference Budd, Kelley and Day25 Moreover, surveys of UK medical graduates' career intentions between 1974 and 2009 found little variance among medical schools in the proportion reporting psychiatry as a first-choice long-term career, albeit females were slightly more likely to report this than males.Reference Goldacre, Fazel, Smith and Lambert8 A multiplicity of factors and experiences are hypothesised to influence junior doctors' specialty preferences, and an acceptable work-life balance and family friendly career appear to be increasingly salient.Reference Korzun, Dharmaindra and Karavangattu24,Reference Spooner, Pearson and Gibson26,Reference Querido, Vergouw and Wigersma27
Our study findings run contrary to existing evidence of the influence of medical schools and foundation schools on junior doctors' preferences for psychiatry training.Reference Goldacre, Fazel, Smith and Lambert8,Reference Halder, Hadjidemetriou and Pearson23–Reference Budd, Kelley and Day25 Although we found statistically significant bivariate associations between our outcome (having applied to psychiatry training) and medical school and foundation school attended, both were non-significant after adjusting for other factors. We speculate that curricular factors and experiences deterring students and trainees from pursuing a career in psychiatry may be equally prevalent within all UK medical and foundation schools. This is in stark contrast to findings from our parallel study of factors associated with applications to general practice (GP) training,Reference Gale, Lambe and Roberts28 which found significant variation among both medical schools and foundation schools even after adjusting for demographic and other educational factors. Perhaps, as Mukherjee et al recommend, increased early exposure to teaching and practical experience of psychiatry for students and postgraduates may ameliorate the UK recruitment crisis.Reference Mukherjee, Maier and Wesseley7 We found that doctors educated at privately funded, independent secondary schools who achieved a below average EPM score were the most likely to apply for psychiatry training. Interestingly, these variables are related: independent schooling has been shown to be associated with lower EPM scores.Reference Kumwenda, Cleland, Walker, Lee and Greatrix29,Reference Mwandigha, Tiffin, Paton, Kasim and Böhnke30 However, our parallel study of applications to GP training,Reference Gale, Lambe and Roberts28 while also finding lower EPM scores to be associated with a greater likelihood of application, found independent schooling to be associated with a lower likelihood. Thus, while both specialties suffer recruitment shortages, the underlying reasons for this may be different. Contrary to the finding of Budd et al of no significant difference by age in preference for psychiatry, our study found that age was significantly associated with the decision to apply for psychiatry training.Reference Budd, Kelley and Day25 This finding aligns with other studies reporting that the family-friendly status of psychiatry and achievement of an acceptable work-life balance influence specialty choices.Reference Denman, Oyebode and Greening11,Reference Budd, Kelley and Day25–Reference Querido, Vergouw and Wigersma27 Perhaps recruitment drives such as Choose Psychiatry 31 should give greater emphasis to the family-friendly status of psychiatry and the potential to achieve an acceptable work-life balance. However, we found gender to be a non-significant predictor of psychiatry training, supporting the findings of Goldacre et al that although historically more women than men have chosen psychiatry, the gap has recently closed.Reference Goldacre, Fazel, Smith and Lambert8 This result again contrasts with our previous finding that female doctors were more likely than male doctors to apply for GP specialty training.Reference Gale, Lambe and Roberts28
Against a backdrop of the demand and supply gap in recruitment to psychiatry training, the international widening participation agenda to make the medical profession more representative of the population it serves, and the impending expansion in the number of UK medical school student places, identifying factors associated with junior doctors' decision to follow a particular pathway is especially important.5,Reference Cleland J, Nicholson and Kelly32 Our finding that state-educated BME doctors are the least likely group to apply to psychiatry suggests that widening participation in the study of medicine by hitherto historically underrepresented societal groups such as these is unlikely to ameliorate the recruitment crisis. Again, this contrasts with findings from our parallel study of factors influencing decisions to apply for GP training,Reference Gale, Lambe and Roberts28 which found that female BME doctors from areas of most deprivation were the most likely group to apply. Moreover, simply increasing medical student numbers may not improve the match of doctors to national needs;Reference Gorman22 it may just increase competition for specialties that are already popular.Reference Cleland33
A key strength of our study is that it is based on actual first-time applications, as opposed to self-declared intentions, of a UK national cohort of junior doctors and thus is not subject to response rate and representativeness bias. Moreover, with application to psychiatry rather than entry into psychiatry training as the outcome variable, our results were not muddied by the effects of selection-related factors that might prevent applicants from entering the training programme. The major strength of this study is its use of the UKMED database, which conflates a multiplicity of types of information held by diverse organisations into a tractable roadmap of doctors' routes from secondary school to specialist training, thereby providing a unique opportunity to examine the association between a range of educational and sociodemographic factors and the probability of applying to psychiatry training.
We acknowledge that factors not included in the UKMED may have had an effect on application decisions. We also acknowledge limitations due to the historical range of the database, in that data was only available for a single cohort/year group of UK medical students and the observation period was limited. Given that international medical graduates constitute a sizeable proportion of the psychiatry trainee population, the unavailability of data on such applicants at the time of our data extract is an important limitation. Additionally, the database contains no information on the extent of medical students' clinical exposure to psychiatry experience or placements during foundation training. Nevertheless, as the database matures and includes more cohorts and data fields, the UKMED project will, as illustrated by this study, provide a unique and rich resource for future researchers in this field. We also acknowledge the limitations on our findings regarding EPM decile score, which, despite adhering to nationally agreed principles,14 is calculated differently in each medical school and is a locally rather than nationally standardised measure. Finally, we acknowledge the limitations on the generalisability of our findings towards a clearer understanding of what influences decisions to apply for psychiatry training in other countries.
The planned inclusion of future cohorts and bespoke survey data in the UKMED database will facilitate longitudinal, mixed-methods, ‘big numbers’ studies.Reference Dowell, Cleland and Fitzpatrick12 The melding of qualitative data on questions such as why graduates are reluctant to enter some specialties and what influences decision-making with quantitative data on actual training and career choices across stages of the medical education continuum has the potential to inform workforce policy interventions and planning.
Supplementary material
Supplementary material is available online at https://doi.org/10.1192/bjb.2019.33.
Acknowledgements
Data were sourced from the UK Medical Education Database UKMEDP30 extract generated on 22/09/2016 and approved for publication on 27/03/2017 by the UKMED Advisory Board. We are grateful to UKMED for the use of these data. However, UKMED bears no responsibility for their analysis or interpretation. The data include information derived from that collected by HESA and provided to the General Medical Council (GMC). Source: HESA Student Record 2007/2008 and 2008/2009 Copyright Higher Education Statistics Agency Limited. The Higher Education Statistics Agency Limited makes no warranty as to the accuracy of the HESA Data, cannot accept responsibility for any inferences or conclusions derived by third parties from data or other information supplied by it. We thank Daniel Smith from GMC for support with data linkage and troubleshooting throughout the project and the Health Informatics Centre support team at University of Dundee.
About the authors
Paul J. Lambe is an Admissions and Selection Psychometrician at the Faculty of Medicine and Dentistry, Plymouth University, UK. Thomas C. E. Gale is a Clinical Associate Professor and Director of Assessment at the Faculty of Medicine and Dentistry, Plymouth University, UK. Tristan Price is a Postdoctoral Research Fellow at the Faculty of Medicine and Dentistry, Plymouth University, UK. Martin J. Roberts is a Lecturer and Lead in Assessment Psychometrics at the Faculty of Medicine and Dentistry, Plymouth University, UK.


 Open access
eLetters
No eLetters have been published for this article.