


1. Theoretical framework
Bilingualism, the ability to communicate in two languages, is a complex cognitive phenomenon currently not fully understood. Despite growing interest in the field, much remains to be uncovered about the cognitive demands resulting from bilingual language management (Kroll et al., Reference Kroll, Dussias, Bice and Perrotti2015), as well as the intriguing potential cognitive adaptations (also referred to as advantages and/or disadvantages in the literature) that the bilingual experience may entail (Adesope et al., Reference Adesope, Lavin, Thompson and Ungerleider2010; Bialystok, Reference Bialystok2009, Reference Bialystok, Craik and Luk2012; Hilchey & Klein, Reference Hilchey and Klein2011; Lehtonen et al., Reference Lehtonen, Soveri, Laine, Järvenpää, de Bruin and Antfolk2018; Valian, Reference Valian2015). Indeed, bilingualism encompasses a large diversity of experiences and proficiencies, with significant differences depending on age of acquisition, frequency of use, and language context, to name some of the most relevant factors. This heterogeneity underscores the critical need to investigate how various contextual and cognitive aspects of the bilingual experience influence cognitive functions (Leivada et al., Reference Leivada, Westergaard, Duñabeitia and Rothman2021; Masullo et al., Reference Masullo, Dentella and Leivada2024). This approach is essential to disentangle the complex interplay of factors that may explain inconsistencies found across studies.
A central feature of bilingual language processing is the coactivation of both languages (Kroll et al., Reference Kroll, Dussias, Bogulski, Kroff and Ross2012; van Heuven & Dijkstra, Reference van Heuven and Dijkstra2010). Neural and cognitive systems simultaneously activate target and nontarget languages, regardless of the speaker’s intention to use only one. Evidence of coactivation spans across linguistic domains including phonology (Colomé, Reference Colomé2001; Meyer & Damian, Reference Meyer and Damian2007; Ota et al., Reference Ota, Hartsuiker and Haywood2009), lexicon (Kaushanskaya & Marian, Reference Kaushanskaya and Marian2007; Kroll et al., Reference Kroll, Bobb, Misra and Guo2008; Marian & Spivey, Reference Marian and Spivey2003), and syntax (Hartsuiker et al., Reference Hartsuiker, Pickering and Veltkamp2004; Hatzidaki et al., Reference Hatzidaki, Branigan and Pickering2011; Hopp, Reference Hopp2017).
Some theoretical frameworks propose that simultaneous activation of languages in bilinguals requires mechanisms to manage competition between linguistic representations of the two languages. Cross-language interference is thought to be solved through language control processes (e.g., Calabria et al., Reference Calabria, Hernández, Branzi and Costa2012; Green & Abutalebi, Reference Green and Abutalebi2013). One influential account is the Inhibitory Control Model (Green, Reference Green1998), which posits that bilinguals suppress activation in the nontarget language to enable successful language selection. Building on this idea, the Adaptive Control Hypothesis (henceforth ACH, Green & Abutalebi, Reference Green and Abutalebi2013) provides a broader framework for understanding how language control operates across different interactional contexts, which place varying demands on control processes.
The Color–Word Stroop test (Stroop, Reference Stroop1935) is widely used to assess inhibitory control, a key component of executive functioning. For brevity, we refer to it as the Stroop test throughout the manuscript. In the Stroop task, participants complete three phases: (1) reading color words (e.g., “RED,” “BLUE”) printed in black ink, (2) naming the ink color of symbols (e.g., “XXXX” printed in red), and (3) naming the ink color of printed words while ignoring their meaning (e.g., saying “red” when the word “BLUE” is printed in red ink). The third phase introduces interference by requiring suppression of the automatic response of reading in favor of naming the ink color. This structure enables measuring reading speed (phase 1), color-naming ability (phase 2), and interference resolution (phase 3), allowing correction for baseline differences such as reading speed, which is crucial in aging research. The Stroop task provides a reliable measure of inhibitory control across populations with varying cognitive states and processing speeds (MacLeod, Reference MacLeod1991; Miyake et al., Reference Miyake, Friedman, Emerson, Witzki and Howerter2000).
While the ACH emphasizes domain-specific mechanisms of bilingual language control, a debate persists about the relationship between these processes and domain-general executive functions, such as the ones measured with the Stroop test. Some studies suggest an overlap between domain-specific and domain-general inhibitory abilities, which would imply that domain-general inhibitory mechanisms are also responsible for language control.
This view is supported by evidence indicating that domain-general executive mechanisms, particularly inhibition and selective attention, overlap with the control processes recruited during bilingual language use (Dash & Kar, Reference Dash and Kar2014; Declerck et al., Reference Declerck, Grainger, Koch and Philipp2017; Prior & Gollan, Reference Prior and Gollan2011; but see Declerck et al., Reference Declerck, Eben and Grainger2019). In contrast, other studies argue that bilinguals’ language-control system operates, at least partially, independently of broader executive function systems. Supporting this view, research has shown that the cost of switching languages is dissociated from the cost of switching between nonlinguistic tasks, such as color–shape or number–letter switching (Calabria et al., Reference Calabria, Hernández, Branzi and Costa2012; Jylkkä et al., Reference Jylkkä, Lehtonen, Lindholm, Kuusakoski and Laine2018; Magezi et al., Reference Magezi, Khateb, Mouthon, Spierer and Annoni2012; Mas-Herrero et al., Reference Mas-Herrero, Adrover-Roig, Ruz and de Diego-Balaguer2021; Segal et al., Reference Segal, Stasenko and Gollan2019). In line with this, Luk et al. (Reference Luk, Anderson, Craik, Grady and Bialystok2010) found distinct neural correlates for two types of inhibition in bilinguals: while response inhibition (no-go trials in a flanker task) activated largely overlapping regions in bilinguals and monolinguals (right inferior frontal cortex, left supplementary motor area, left inferior parietal lobule, bilateral cerebellum, middle/posterior cingulate and bilateral middle temporal gyri), interference suppression during incongruent trials engaged different patterns, with monolinguals recruiting left temporal pole and superior parietal cortex and bilinguals engaging a broader network including bilateral inferior frontal gyri, SMA, caudate nucleus, thalamus, fusiform and temporal regions, parietal/angular areas, cerebellum and occipital cortices. This finding underscores the selective impact of bilingualism on interference suppression and supports the idea that bilingual language control relies, at least in part, on mechanisms that are partially independent from other executive functions.
Executive functions are typically conceptualized as related yet separable components. Classic latent-variable studies distinguish inhibition (including prepotent response inhibition and interference suppression), task/set shifting, and working-memory updating (Miyake et al., Reference Miyake, Friedman, Emerson, Witzki and Howerter2000). More recent work has expanded this tripartite model to include processes such as monitoring, planning and sustained attention, and has emphasized that different tasks tap partially distinct mechanisms (Dias et al., Reference Dias, Helsdingen, Lins, Etcheverria, Dechen, Steffen and Lopes2024). Within this multicomponent framework, bilingual effects are expected to be selective: tasks taxing interference suppression (e.g., Stroop) may be modulated differently from those emphasizing response inhibition or shifting, helping to explain inconsistencies across studies.
Aging further emphasizes the distinction between language control and other types of cognitive control, as older bilinguals maintain effective language-switching abilities while experiencing greater difficulties with nonlinguistic tasks. Research indicates that language-switching costs and language-mixing effects often remain stable with age (Calabria et al., Reference Calabria, Branzi, Marne, Hernández and Costa2015; Massa et al., Reference Massa, Köpke and El Yagoubi2020; Weissberger et al., Reference Weissberger, Wierenga, Bondi and Gollan2012), whereas nonlinguistic switch costs tend to increase (Calabria et al., Reference Calabria, Branzi, Marne, Hernández and Costa2015; Weissberger et al., Reference Weissberger, Wierenga, Bondi and Gollan2012). However, more recent evidence shows that this pattern is not uniform: in some tasks (e.g., Flanker, Stroop, ANT), older adults display preserved—or even improved—performance (Rey-Mermet et al., Reference Rey-Mermet, Gade and Oberauer2018; Veríssimo et al., Reference Veríssimo, Verhaeghen, Goldman, Weinstein and Ullman2022). Notably, Calabria et al. (Reference Calabria, Branzi, Marne, Hernández and Costa2015) found no significant correlation between these switch costs, suggesting that bilingual language control is differentially resilient to the effects of aging, possibly reflecting a relative preservation of language-specific mechanisms compared to domain-general inhibitory control (Hasher & Zacks, Reference Hasher, Zacks and Bower1988). In contrast, Mas-Herrero et al. (Reference Mas-Herrero, Adrover-Roig, Ruz and de Diego-Balaguer2021) reported a bilingual advantage in nonlinguistic switching among younger adults, but not in within-language switching, highlighting how task demands and age may modulate the interplay between language-specific and domain-general control.
This dissociation aligns with findings from studies on bilingual aphasia, which further support the existence of independent mechanisms for linguistic and nonlinguistic control. For instance, Nair et al. (Reference Nair, Rayner, Siyambalapitiya and Biedermann2021) present a systematic review of cases showing that impairments in domain-general tasks coexist with relatively well-preserved cross-language interference control. Such evidence points to a (fully or partially) independent domain-specific language-control mechanism for language (see also Faroqi-Shah et al., Reference Faroqi-Shah, Frymark, Mullen and Wang2010; Gray & Kiran, Reference Gray and Kiran2016; Mooijman et al., Reference Mooijman, Schoonen, Roelofs and Ruiter2022). Together, these findings strongly suggest that while domain-specific and domain-general systems may share neural substrates (Abutalebi & Green, Reference Abutalebi and Green2016; Branzi et al., Reference Branzi, Della Rosa, Canini, Costa and Abutalebi2016), their functional independence is evident in aging and neurological damage.
In contrast, it is widely reported in the literature that bilinguals exhibit superior performance on tasks measuring domain-general inhibitory control, such as the Stroop, antisaccade, n-back, or Flanker tasks (Bialystok et al., Reference Bialystok, Craik and Ryan2006, Reference Bialystok, Craik and Luk2008; Costa et al., Reference Costa, Hernández and Sebastián-Gallés2008; Yow & Li, Reference Yow and Li2015). Some studies suggest that this general advantage may be either attenuated or amplified with age (Bialystok et al., Reference Bialystok, Craik and Ryan2006; Gold et al., Reference Gold, Kim, Johnson, Kryscio and Smith2013; Ware et al., Reference Ware, Kirkovski and Lum2020). Bilingualism has also been linked to delayed onset of neurodegenerative diseases such as Alzheimer’s (Bialystok et al., Reference Bialystok, Craik and Freedman2007; Craik et al., Reference Craik, Bialystok and Freedman2010; Woumans et al., Reference Woumans, Santens, Sieben, Versijpt, Stevens and Duyck2015). This effect is typically interpreted within the framework of cognitive reserve rather than as the outcome of a single mechanism, with enhanced inhibitory control considered one potential contributor among others. However, these claims remain disputed, with some studies failing to replicate them (Chertkow et al., Reference Chertkow, Whitehead, Phillips, Wolfson, Atherton and Bergman2010; Lawton et al., Reference Lawton, Gasquoine and Weimer2015; Nichols et al., Reference Nichols, Wild, Stojanoski, Battista and Owen2020; Paap et al., Reference Paap, Johnson and Sawi2015; Sanders et al., Reference Sanders, Hall, Katz and Lipton2012; Zahodne et al., Reference Zahodne, Schofield, Farrell, Stern and Manly2014). In the specific case of interference control, a meta-analysis by Donnelly et al. (Reference Donnelly, Brooks and Homer2019) found weak evidence for a bilingual advantage, with small effect sizes for global reaction time and interference cost. The advantage was moderated by the age of second-language acquisition (AoA), with earlier AoA linked to greater benefits in interference control. Overall, these mixed results suggest that the cognitive benefits of bilingualism are shaped by a complex interplay of factors, including cognitive and sociolinguistic profiles, educational background, socioeconomic status, and life experiences, all of which vary significantly across studies (Grundy, Reference Grundy2020; Leivada et al., Reference Leivada, Westergaard, Duñabeitia and Rothman2021).
Building on the view that bilingual language use places differential demands on executive subcomponents depending on context, one proposed explanation for the link between domain-specific and domain-general inhibitory control is the partial overlap of neural substrates, particularly in the prefrontal cortex and anterior cingulate cortex (ACC) (Abutalebi et al., Reference Abutalebi, Della Rosa, Green, Hernandez, Scifo, Keim, Cappa and Costa2012; Abutalebi & Green, Reference Abutalebi and Green2016; Hervais-Adelman et al., Reference Hervais-Adelman, Moser-Mercer and Golestani2011). Managing interference from a nontarget language during bilingual communication is thought to engage and strengthen these domain-general networks, with evidence suggesting that this effect is more pronounced in highly proficient or balanced bilinguals (Abutalebi et al., Reference Abutalebi, Della Rosa, Green, Hernandez, Scifo, Keim, Cappa and Costa2012; Bialystok et al., Reference Bialystok, Craik and Luk2008). However, recent research has highlighted the role of language-switching frequency – rather than linguistic competence – as a key determinant of bilingual advantages in executive control (Barbu et al., Reference Barbu, Orban, Gillet and Poncelet2018; Hartanto & Yang, Reference Hartanto and Yang2016; Verreyt et al., Reference Verreyt, Woumans, Vandelanotte, Szmalec and Duyck2016). Verreyt et al. (Reference Verreyt, Woumans, Vandelanotte, Szmalec and Duyck2016) further found that balanced and unbalanced bilinguals who rarely switched languages showed no difference in executive control performance. This points to the importance of the frequency, context, and social environments of language use in shaping bilingual adaptations.
Green and Abutalebi (Reference Green and Abutalebi2013) propose that bilinguals’ interactional contexts play a key role in shaping cognitive outcomes. The ACH suggests that bilinguals who frequently alternate between languages in dual-language contexts develop enhanced executive control. Specifically, unlike in single-language contexts (where bilinguals use their languages in separate environments) and in dense code-switching contexts (where bilinguals and their interlocutors may frequently alternate languages within a sentence or utterance), dual-language contexts involve using different languages with different interlocutors in the same environment. These contexts are theorized to place especially high demands on control processes such as goal maintenance, conflict monitoring, and interference suppression, potentially fostering stronger executive control. However, while the distinction between context types is conceptually useful, in practice, bilinguals often move fluidly across them depending on social and situational factors.
Hartanto and Yang (Reference Hartanto and Yang2016) investigated the impact of bilinguals’ interactional contexts on task-switching performance. They compared bilinguals in dual-language contexts, characterized by frequent language switching, to those in single-language contexts, where switching is rare. Using a task-switching paradigm and diffusion model analyses, they found that dual-language context bilinguals exhibited smaller switch costs, driven by enhanced task-set reconfiguration rather than reduced proactive interference. This suggests that habitual engagement with both languages in dynamic contexts strengthens specific cognitive control processes. Additional studies have shown that bilinguals’ naturalistic code-switching habits also shape executive control, with dense code-switching practices associated with enhanced conflict monitoring and response inhibition (Hofweber et al., Reference Hofweber, Marinis and Treffers-Daller2016, Reference Hofweber, Marinis and Treffers-Daller2020). Hartanto and Yang (Reference Hartanto and Yang2020) further demonstrated that dual-language contexts significantly predicted task-switching performance, while dense code-switching contexts were associated with enhanced inhibitory control and goal maintenance, even after controlling for potential confounding factors such as socioeconomic status, nonverbal intelligence, and unintended language-switching tendencies.
Gosselin and Sabourin (Reference Gosselin and Sabourin2023) added further depth to this research by focusing on the role of intentionality in language switching. Their study involved 266 French–Canadian bilinguals, who completed both domain-general (Flanker) and language-specific (bilingual Stroop) inhibitory control tasks. Stepwise regressions revealed that deliberate, habitual code-switching between French and English was associated with superior inhibitory control and goal-monitoring abilities. Notably, unintentional language switching was linked to weaker inhibition, emphasizing the importance of active and intentional engagement in dual-language environments for cognitive benefits. These results reinforce the idea that the cognitive benefits of bilingualism are better understood through an experience-based framework, emphasizing the interplay of language use and environmental diversity over linguistic competence alone.
In the current study, we investigate highly proficient Basque (L1/L2)–Spanish (L1/L2) bilinguals living in the Basque Country, where both languages hold official status. Basque, a minority language, varies significantly in its use across geographic regions, providing a unique opportunity to examine how differing degrees of language use influence interference control. By differentiating between home use and social use of Basque, we aim to explore how these dimensions shape cognitive outcomes. This study also focuses on a relatively homogenous sample in terms of socioeconomic and educational status, offering a controlled context to examine the dynamic and context-dependent nature of bilingual language use.
1.1. The Basque language and sociolinguistic context
Much of the research on bilingualism has focused on migrant populations or late second-language (L2) learners, thus reflecting only bilingual experiences shaped by migration or formal language acquisition in adulthood. In contrast, this study investigates Basque–Spanish proficient bilinguals living in a bilingual society with specific linguistic and sociocultural characteristics. They offer an opportunity to examine the cognitive effects of bilingualism in a stable sociolinguistic context, where both languages coexist in daily life.
The Basque language, or Euskara, is a language isolate that is typologically very different from Spanish, the dominant language in the region. Spanish is a Romance language with subject–verb–object (SVO) word order, nominative–accusative alignment, and relatively simple verbal agreement. In contrast, Basque follows a subject–object–verb (SOV) word order, features ergative–absolutive case marking, and exhibits complex verbal morphology with up to three agreement markers (de Rijk, Reference De Rijk2007; Laka, Reference Laka1996).
The Basque Country (Euskal Herria) refers to the broader historical and cultural region where Basque is traditionally spoken, encompassing areas in both Spain and France. In the Spanish territory, Basque coexists with Spanish, while in the northern region of the Basque Country (Iparralde, in France), it coexists with French. The present study focuses exclusively on the Southern Basque Country in Spain, specifically the Basque Autonomous Community (Euskadi). According to the 2021 Sociolinguistic Survey conducted by the Basque Government, there are 700,000 Basque speakers aged 16 years or older in this region. This corresponds to 36.2% of the population, while 18.6% are passive speakers (i.e., they understand but do not speak the language) and 45.3% are Spanish monolinguals (Altuna et al. Reference Altuna, Iñarra and Basurto2021). Compared to 1991, this represents an increase of more than 260,000 active speakers and a 12-point rise in the percentage of Basque speakers over the last 30 years (from 24.1% to 36.2%).
However, proficiency and daily use still vary significantly by region. Spanish remains dominant in urban centers and southern areas, whereas Basque is more widely used in rural zones, coastal towns, and historically Basque-speaking areas, particularly Debagoiena (Gipuzkoa), northern Navarre, and coastal areas of Biscay and Gipuzkoa, which show some of the highest rates of Basque use and intergenerational transmission (Altuna et al. Reference Altuna, Iñarra and Basurto2021). Even within provinces and capital cities, Basque-speaking rates have increased, although asymmetries in use remain. Additionally, the diglossia of the Basque Country entails that Spanish frequently occupies higher domains of use, including professional and formal settings, while Basque use is often relegated to specific sociolinguistic niches. In addition to formal education, exposure to Basque is currently facilitated by its presence in public communication, including official documents, brochures, public signage, and audio announcements in transportation systems. However, this increased visibility does not erase the diglossic hierarchy. Spanish remains the default in formal and professional settings, ensuring communication across the population, while Basque is not universally spoken. Consequently, the public presence of Basque largely reflects language policy rather than a genuine shift in functional domains.
A key sociolinguistic aspect of the current situation is that 55.4% of Basque speakers live in predominantly monolingual Spanish environments (Altuna et al. Reference Altuna, Iñarra and Basurto2021). Unlike bilingual settings where frequent/dense code-switching is natural and unproblematic because both interlocutors understand both languages, Basque speakers often navigate dual-language contexts, where they must choose the appropriate language based on their conversation partner. This dual-language dynamic fosters regular engagement with both Basque and Spanish.
In the Basque Country, bilingual language use unfolds across domains that differ in predictability and control demands. Home interactions are typically stable and routinized, requiring relatively little online monitoring, whereas social and professional exchanges demand flexible adaptation to interlocutors and less predictable language selection. According to the ACH (Green & Abutalebi, Reference Green and Abutalebi2013), such dual-language contexts place heavier demands on conflict monitoring and interference suppression, while dense code-switching emphasizes opportunistic planning. Selection-by-activation accounts (Blanco-Elorrieta & Caramazza, Reference Blanco-Elorrieta and Caramazza2021) further suggest that competition arises chiefly when interactions are unpredictable. Complementarily, Bialystok’s (Reference Bialystok2024) attention-as-adaptation framework holds that dynamic contexts recruit attentional control more strongly than routinized settings. In the Basque sociolinguistic landscape, where speakers often alternate between Basque and Spanish depending on interlocutor, and venue, social use plausibly entails frequent, rapid language choices, and transient conflict. Building on these perspectives, we hypothesized that social use of Basque would be more strongly associated with Stroop performance than home use.
The bilingual participants in our study exemplify this dynamic sociolinguistic environment, revealing a wide spectrum of Basque and Spanish usage. Their experiences reflect the intersection of individual, regional, and societal factors, providing a unique context for examining how bilingual language use influences cognitive outcomes. By comparing Spanish monolinguals with Basque–Spanish bilinguals aged 30–80 years, this research explores how age and varying levels of language use interact to shape cognitive performance.
1.2. The current study
This study investigates the relationship between bilingual language use and interference control, focusing on highly proficient Basque–Spanish bilinguals. Using a standardized version of the Color-Word Stroop task, we aim to determine whether the Stroop effect is modulated by the frequency and context of language use. By comparing bilinguals with a variety of language use patterns to monolingual controls, we explore how these experiences shape cognitive control across the lifespan.
We hypothesize that, given the diglossic bilingual context of the Basque Country, frequent use of Basque will lead to enhanced interference control, even in individuals who do not extensively use Spanish. Unlike most bilingual contexts, where higher interference control is typically associated with balanced use of both languages, here we hypothesized that the sociolinguistic dynamics would play a key role. Specifically, due to the diglossic status of Basque – used primarily in informal and specific settings while Spanish dominates formal and public domains – frequent Basque use requires frequent language switching with Spanish. These switches occur across interactions and within single conversations when interlocutors do not speak Basque, creating significant cognitive demands. Consequently, we expect that this frequent language switching will strengthen interference control mechanisms, particularly in those with frequent use of the minority language, Basque.
Our findings aim to refine theoretical models of bilingual cognition by highlighting the role of dynamic language use in cognitive outcomes. We also provide some practical insights for fields such as education and health services, where patterns of bilingual language use may influence cognitive resilience and executive functioning.
2. Methods
2.1. Participants
This study included 242 participants (158 female), comprising 158 highly proficient Basque–Spanish bilinguals and 84 Spanish monolinguals, aged 30–80 years (M = 53.2, SD = 13.04). Participants were evenly distributed across three age groupsFootnote 1: 30–45 (n = 83), 46–60 (n = 78), and 61–80 (n = 81). Among bilinguals, 86 identified Basque as their L1 and 72 Spanish. All participants had normal or corrected-to-normal vision and no history of neurological or psychiatric conditions. Detailed demographic characteristics are provided in the Supplementary Materials (Tables S1–S2a).
Age did not differ significantly between bilinguals and monolinguals, t(151.7) = −0.50, p = .617. Similarly, sex distribution did not differ between groups, χ2(1) = 1.19, p = .276. By contrast, education levels differed significantly between groups, χ2(4) = 57.23, p < .001. A detailed distribution of educational attainment by group is illustrated in Figure 1 and tabulated in the Supplementary Materials (Tables S2b–S3). Overall attainment was high in both groups but more pronounced among bilinguals (e.g., 86.6% versus 42.9%). Accordingly, Age was modeled as a continuous predictor in all analyses, Education was included as a covariate in group-level models, and Sex was not entered given comparable distributions.
Distribution of participants’ educational levels by age range, separately for monolingual and bilingual groups. Bars represent the proportion of participants within each age range (30–45, 46–60, 61–80) across education levels, displayed as 100% stacked bars. Sample sizes (n) for each age range are shown above the bars.

Spanish-L1 bilinguals typically acquired Basque through a combination of formal schooling and informal exposure. Since the 1980s, Basque has been either taught as a subject or used as a vehicular language for the full curriculum, depending on the educational model, providing up to 10–12 years of instruction. This formal learning is often reinforced by exposure to Basque through bilingual family members, peers and community networks. Older participants (60–80 years), who grew up under Franco’s dictatorship when Basque was banned in schools, generally acquired it through family, community, or adult education (Euskaltegiak). Thus, participants aged 30–80 years followed diverse acquisition pathways, reflecting the Basque Country’s changing sociolinguistic landscape.
Virtually most Basque-speaking participants used both Standard Basque (Batua) and a local variety. Batua was the variety of schooling and public communication, while local dialectal features were part of everyday interaction in family and community contexts. Following common practice in bilingualism research, we do not treat a language and its regional varieties as separate languages; therefore, these individuals are classified as Spanish–Basque bilinguals, not trilinguals. The broader theoretical question of whether Batua–dialect distinctions could justify a trilingual classification lies beyond the scope of the present study.
Cognitive status was evaluated using the Brief Cognitive Status Examination (BCSE) from the Wechsler Memory Scale (Wechsler, Reference Wechsler2012). Only participants scoring within the preserved range (low-average or higher) according to Spanish age- and education-adjusted norms were included.
Bilingual participants were recruited from the administrative region of Debagoiena and from Vitoria-Gasteiz and its surrounding areas. Debagoiena, where Basque is widely spoken in daily life, provided participants with frequent Basque usage, while Vitoria-Gasteiz, where Spanish is widely used, allowed for a broader representation of sociolinguistic contexts. Monolinguals were tested in Vitoria-Gasteiz; several were originally from nearby Spanish-only provinces (e.g., Burgos, La Rioja). All explicitly reported no functional knowledge of Basque.
Bilingual participants were balanced, reporting high proficiency in both languages. Those with Basque as their first language (L1) acquired Spanish during childhood, at an average age of 4.0 years (SD = 2.6), while participants with Spanish as their L1 acquired Basque at an average age of 12.8 years (SD = 10.5). Proficiency was assessed through interviews with native Basque–Spanish researchers and self-reports, with mean proficiency scores of 8.8/10 (SD = 1.2) for Basque and 9.3/10 (SD = 0.75) for Spanish.
Spanish-L1 participants’ acquisition pathways varied by generation. Younger adults typically learned Basque through compulsory schooling and immersion programs introduced in the 1980s, and some pursued university studies in Basque. Older adults, by contrast, grew up under the dictatorship of Franco (1939–1975), during which the public use of Basque – including its teaching – was prohibited. As a result, they had little or no formal instruction and typically acquired Basque orally through family and community transmission, while literacy was generally developed in Spanish. Clandestine teaching and informal literacy practices in Basque also existed but were not officially recognized. These generational differences, shaped by major sociopolitical shifts, produced considerable variability in acquisition experiences.
All bilingual participants reported high proficiency in Basque and Spanish, while monolinguals reported Spanish as their only language. Across the whole sample, some participants – both bilingual and monolingual – reported very limited knowledge of English (younger adults) or French (older adults). This knowledge was typically acquired long ago through formal schooling, never exceeded A2 proficiency on the CEFR scale and was not used professionally or in daily life.
Language history and proficiency were measured with an adapted version of the Language and Social Background Questionnaire (LSBQ; Anderson et al., Reference Anderson, Mak, Keyvani Chahi and Bialystok2018). Forty-three items were summarized into Basque Home Use/Proficiency, Basque Social Use/Proficiency, Spanish Proficiency and a Composite Score (factor scores, mean ≈ 0). In the bilingual sample, ranges were −7.3 to 26.3 (home), −2.1 to 63.0 (social) and −2.8 to 25.7 (composite), reflecting variation in Basque use rather than categorical proficiency differences.
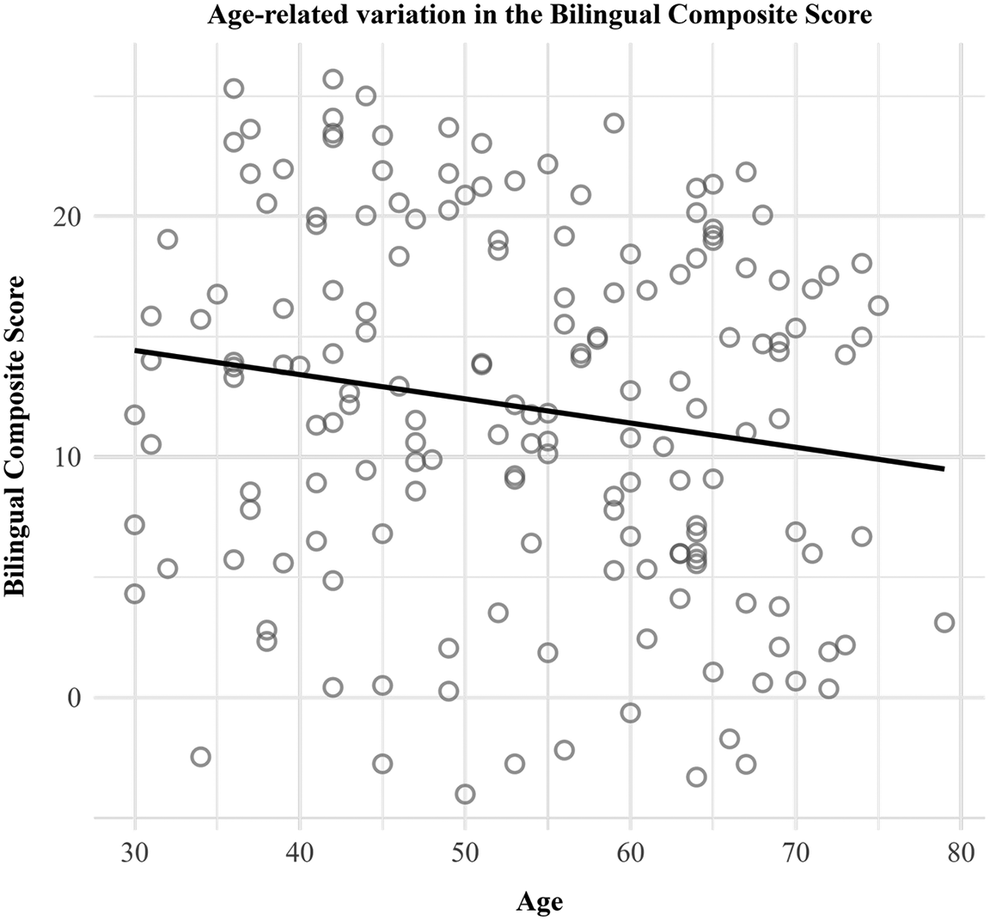
To examine age-related variation in Basque use, we computed the Pearson correlation between Age and the Bilingual Composite Score in the bilingual sample; the association was negative but not significant, r = −0.129, 95% CI [−0.279, 0.028], p = .107 (two-tailed; see Figure 2).
Scatterplot showing the relationship between Age and the Bilingual Composite Score. Each point represents one participant. The solid line depicts the least-squares fit, illustrating the weak, nonsignificant negative correlation (r = −0.13, 95% CI [−0.279, 0.028], p = .107).

The study was approved by the Ethics Committee for Research Involving Human Beings, Their Samples, and Their Data (CEISH) at the University of the Basque Country (project code M10/2021/007). Participants were fully informed about the study, assured of confidentiality and anonymity and reminded of their right to withdraw at any time. Written informed consent was obtained from all participants. The authors assert that all procedures contributing to this work comply with the ethical standards of the relevant national and institutional committees on human experimentation and with the Helsinki Declaration of 1975, as revised in 2013.
3. Materials
3.1. Language and Social Background Questionnaire (LSBQ)
Language history and proficiency were assessed in bilingual participants using an adapted version of the LSBQ (Anderson et al., Reference Anderson, Mak, Keyvani Chahi and Bialystok2018), tailored to the Basque–Spanish context (Basque as the minority language, Spanish as the majority language). A total of 43 items – covering age and mode of acquisition, self-rated proficiency (0–10) and relative language use across contexts (0–100%) – were submitted to a factor-analytic scoring procedure following Anderson et al. This yielded three domain-specific indices (Basque Home Use/Proficiency, Basque Social Use/Proficiency and Spanish Proficiency) and a Composite Score reflecting overall bilingual experience.
Items were direction-aligned (higher = more Basque use/proficiency) and z-standardized before factor analysis. The resulting factor scores have a mean of approximately zero and indicate participants’ relative position on each latent dimension, with negative values reflecting lower and positive values reflecting higher use/proficiency relative to the sample. These indices were used as continuous predictors in subsequent analyses of cognitive control.
3.2. Color–Word Stroop test
To assess interference control, we used the paper version for the Color–Word Stroop test (Golden, Reference Golden, Ruiz-Fernández, Luque and Sánchez-Sánchez2010; Spanish adaptation by Ruiz-Fernández, Luque, & Sánchez-Sánchez). This test comprises three distinct parts, each designed to measure different aspects of processing speed and inhibitory control.
Word Reading Task: In the first part, participants were presented with lists of color words (e.g., RED, BLUE, GREEN) printed in black ink. They were instructed to read the words aloud as quickly as possible within 45 seconds. The total number of words read correctly within the time limit was recorded as the score for this part.
Color Naming Task: In the second part, participants were shown lists of nonverbal stimuli (crosses) printed in different colors (e.g., XXXX printed in BLUE, XXXX printed in RED). They were instructed to name the colors of the crosses as quickly as possible within 45 seconds. The number of correct color-naming responses was recorded as the score for this part.
Interference Task: In the third and most critical part, participants were shown lists of color words (e.g., the word “RED” printed in blue ink). They were instructed to name the color of the ink, while ignoring the written word, within 45 seconds. The score for this part was the total number of correct responses, meaning the number of times they correctly named the ink color while ignoring the word itself.
Interference control, the primary measure of cognitive inhibition, was calculated using the standard formula from the Color–Word Stroop test (Golden, Reference Golden, Ruiz-Fernández, Luque and Sánchez-Sánchez2010):
 $$ \mathrm{I}\mathrm{n}\mathrm{t}\mathrm{e}\mathrm{r}\mathrm{f}\mathrm{e}\mathrm{r}\mathrm{e}\mathrm{n}\mathrm{c}\mathrm{e}\ \mathrm{s}\mathrm{c}\mathrm{o}\mathrm{r}\mathrm{e}=\mathrm{I}\mathrm{n}\mathrm{t}\mathrm{e}\mathrm{r}\mathrm{f}\mathrm{e}\mathrm{r}\mathrm{e}\mathrm{n}\mathrm{c}\mathrm{e}\ \mathrm{t}\mathrm{a}\mathrm{s}\mathrm{k}-\frac{(\mathrm{W}\mathrm{o}\mathrm{r}\mathrm{d}\ \mathrm{r}\mathrm{e}\mathrm{a}\mathrm{d}\mathrm{i}\mathrm{n}\mathrm{g}\times \mathrm{C}\mathrm{o}\mathrm{l}\mathrm{o}\mathrm{r}\ \mathrm{n}\mathrm{a}\mathrm{m}\mathrm{i}\mathrm{n}\mathrm{g})}{(\mathrm{W}\mathrm{o}\mathrm{r}\mathrm{d}\ \mathrm{r}\mathrm{e}\mathrm{a}\mathrm{d}\mathrm{i}\mathrm{n}\mathrm{g}+\mathrm{C}\mathrm{o}\mathrm{l}\mathrm{o}\mathrm{r}\ \mathrm{n}\mathrm{a}\mathrm{m}\mathrm{i}\mathrm{n}\mathrm{g})} $$
This formula accounts for baseline reading and color-naming speed to isolate the participant’s ability to resolve the conflict between word meaning and ink color in the Interference task. A higher interference score indicates greater inhibitory control.
The test has well-established norms based on age and education level in the Spanish population, allowing raw scores to be converted into T-scores for standardized interpretation (Golden, Reference Golden, Ruiz-Fernández, Luque and Sánchez-Sánchez2010; Spanish adaptation). As no standardized and normed version of the Stroop test is available in Basque, all participants completed the test in Spanish.
4. Procedure
Each participant was tested individually by a trained native Basque-Spanish bilingual experimenter. For bilingual participants, the experimenter communicated exclusively in Basque throughout the session to further confirm their high proficiency in the language.
The testing session began with the completion of the LSBQ (Anderson et al., Reference Anderson, Mak, Keyvani Chahi and Bialystok2018). To ensure clarity and consistency across participants, the experimenter provided assistance as needed to help participants fully understand the questions, maintain a consistent response criterion across subjects and accommodate any reading limitations in older participants.
Following the questionnaire, participants completed the Stroop test (Golden, Reference Golden, Ruiz-Fernández, Luque and Sánchez-Sánchez2010). During the Stroop test, the participant and the experimenter sat face to face in a quiet and well-lit experimental room. The experimenter used a hand stopwatch with a top button to measure the 45 seconds allocated to each section of the test.
Both tasks were conducted during the same session, which lasted approximately 60 minutes. This session also included an initial screening to assess cognitive abilities and language proficiency. The individualized nature of the session and the use of Basque with bilingual participants ensured consistent administration and provided an additional verification of their language abilities.
5. Data analysis
All analyses were conducted using linear regression models, with the Stroop interference score as the dependent variable. Fixed effects and interactions were progressively added to a series of models, and competing models were compared using the Akaike Information Criterion (AIC; Akaike, Reference Akaike1974). AIC balances model fit against model complexity, penalizing unnecessary parameters. Following Burnham and Anderson (Reference Burnham and Anderson2002, Reference Burnham and Anderson2004), a reduction in AIC greater than 2 points was taken as evidence of improved fit. This approach means that the best-fitting model is not necessarily the most complex one, but the model that provides the optimal trade-off between fit and parsimony.
Prior to modeling cognitive outcomes, we examined potential differences in educational attainment across groups and age ranges (see Participants). These analyses confirmed group-level differences in Education, which was therefore included as a covariate in group-level models but excluded from bilingual-only models due to its highly skewed distribution.
We first modeled interference control performance across the full sample to examine effects of Age, Group (bilingual versus monolingual) and Education. These predictors were entered as fixed effects, and two-way interactions among them (Age × Group, Age × Education, Group × Education) were tested. Interactions did not improve model fit (ΔAIC ≤2) and were therefore excluded. The final group-level model included only the main effects of Age, Group and Education.
Next, we analyzed the bilingual subgroup to examine whether individual differences in bilingual experience predicted interference control. As Education was strongly skewed among bilinguals (most participants in the highest categories), it was excluded to avoid unstable estimates. Three continuous indices of bilingualism were tested: Composite Score, Basque Home Use/Proficiency and Basque Social Use/Proficiency. All indices were entered jointly with Age in linear models. AIC comparisons evaluated whether including both Home and Social Use improved model fit relative to single-predictor models. The Age + Social Use model provided the best fit; including Home Use/Proficiency did not improve explanatory power (ΔAIC ≤2).
To examine potential nonlinear effects of age, we added a centered quadratic age term (Age2) to each model. Across all analyses, Age2 did not improve model fit (|ΔAIC| < 2). Full comparisons between linear and quadratic models are provided in the Supplementary Materials (Table S4). The linear effect of Age consistently provided the most explanatory and parsimonious account of the data and was therefore retained in all final models.
All analyses were conducted in R (version 4.3.0) using standard linear models (lm). Estimated marginal means (EMMs) and pairwise comparisons were obtained with the emmeans package (Lenth, Reference Lenth2021), and descriptive summaries were produced using sjPlot (Lüdecke, Reference Lüdecke2025). For all final models, we report regression coefficients (β), standard errors (SE), 95% confidence intervals (CIs), and p-values.
6. Results
6.1. Interference control as a function of bilingualism and age
In the first model, the Interference Score was predicted from Age (centered), Group (Bilingual versus Monolingual) and Education level. Model selection by AIC favored the additive specification with main effects only; adding two-way interactions did not improve fit (Table S5 in Supplementary Materials).
The final model revealed a robust negative effect of Age (β = −0.16, SE = 0.036, 95% CI [−0.23, −0.09], p < .001), indicating that interference control declined with increasing age. On average, performance decreased by 1.56 units per decade (SE = 0.36, 95% CI [−2.27, −0.86], p < .001). EMMs, averaged equally over Group and Education, confirmed a progressive decline: predicted scores were 5.20 at age 30 (SE = 1.94), 2.86 at age 45 (SE = 1.69), 0.51 at age 60 (SE = 1.58) and −1.83 at age 75 (SE = 1.65). All pairwise comparisons among these age points were significant (Tukey-adjusted ps < .001). This pattern is illustrated in Figure 3, which shows the negative association between Age and Interference Control, with separate regression lines for bilingual and monolingual participants.
Relationship between age and interference control for bilingual and monolingual participants. Solid lines represent linear fits for each group. A significant age-related decline in interference control is observed, with no significant difference in this effect between the two groups.

The Group contrast (Bilingual − Monolingual), estimated via marginal means, was not significant (estimate = −1.58, SE = 1.08, p = .145), indicating no reliable bilingual versus monolingual difference after controlling for Age and Education.
Education effects were modest overall. Relative to participants with higher education (Level 5), those with no formal education (Level 1) tended to show lower interference scores (estimate = −10.22, SE = 4.08, 95% CI [−20.30, −0.14], p = .053), indicating a marginal effect at the lower end of the educational distribution. No other contrasts – primary (Level 2), secondary (Level 3), or post-secondary/vocational training (Level 4), versus Level 5 – were significant (all ps > .10). Education effects are illustrated in Figure 4A, and full model estimates, contrasts and pairwise comparisons are provided in Table S6 (Supplementary Materials).
Model-predicted interference control scores as a function of Age, Education and Group (A) and standardized T-scores as a function of Group (B). (A) Predicted Interference Scores from a linear model including Age, Education and Group as predictors. Education levels are coded as: 1 = No studies, 2 = Primary, 3 = Secondary, 4 = Post-secondary or vocational training, 5 = Higher education. Lines represent education levels, and facets separate monolingual and bilingual participants; shaded ribbons indicate 95% CIs. (B) Group differences in standardized Stroop T-scores, already adjusted for demographic variables, with points showing model-predicted means and 95% CIs.

6.1.2. Post-hoc analysis using T-scores
To ensure that the age-related decline and group effects reported above were not confounded by demographic variables, we conducted a post-hoc analysis using the standardized T-scores provided in the Spanish adaptation of the Stroop test (Golden, Reference Golden, Ruiz-Fernández, Luque and Sánchez-Sánchez2010; TEA Ediciones). These normative scores are already adjusted for age and education, thereby controlling for demographic influences at the scoring stage. In this model, Group was the only predictor. Results showed that bilinguals obtained higher T-scores (M = 48.3, SE = 0.58, 95% CI [47.2, 49.5]) than monolinguals (M = 46.4, SE = 0.80, 95% CI [44.8, 47.9]). The bilingual–monolingual difference was 1.95 points (SE = 0.99, 95% CI [0.01, 3.89]), which was marginally significant, t(237) = 1.97, p = .050 (see Figure 4B). Full model estimates and marginal means for this analysis are provided in Table S7 (Supplementary Materials).
6.2. Bilingual language use and interference control
To examine the relationship between bilingual language use and interference control, we fitted linear regression models including Age and different indices of bilingual experience (Composite Score, Home/Proficiency, and Social Use).
We first report results for the Composite Score, and then present a joint analysis of Home/Proficiency and Social Use to assess whether these facets of language use uniquely contributed to interference control.
6.2.1. Composite score and interference control
The regression model including Age and the Bilingual Composite Score revealed that both predictors were significant. Higher Composite Scores were associated with better interference control (β = 0.20, SE = 0.08, 95% CI [0.04, 0.36], p = .017), whereas increasing age predicted poorer performance (β = −0.16, SE = 0.05, 95% CI [−0.25, −0.07], p < .001). The Age × Composite interaction was evaluated but did not improve model fit (ΔAIC = 1.69 < 2) and was therefore not retained. Model comparisons and coefficients are presented in Tables S8–S9.
6.2.2. Home use/proficiency, social use and interference control
To assess whether different facets of bilingual experience uniquely contributed to interference control, we compared linear models including Age, Home/Proficiency, and Social Use as predictors. Model selection based on AIC favored the Age + Social Use model; adding Home/Proficiency did not improve fit, and a joint model including both indices offered no advantage over the Age + Social Use model.
In the final model, Age was a robust negative predictor (β = −0.15, SE = 0.046, p = .001), replicating the age-related decline observed in previous analyses. Basque Social Use emerged as a significant positive predictor (β = 0.10, SE = 0.036, 95% CI [0.03, 0.17], p = .007), indicating that participants who reported higher use of Basque in social contexts exhibited better interference control. By contrast, Home/Proficiency did not contribute independently (β = −0.07, SE = 0.09, p = .449). Collinearity diagnostics indicated no problematic overlap between predictors (all VIFs ≤ 2.22). Figure 5 provides a descriptive visualization of individual variability in interference control as a function of Home/Proficiency and Social Use.
Interference control as a function of Basque use in different contexts. The left panel shows the relationship between Interference Control and Home/Proficiency, and the right panel shows the relationship between Interference Control and Social Use in bilingual participants. Each dot represents a participant. The figure illustrates individual variability and overall trends that were formally tested using regression models reported in the main text.

Follow-up tests of two-way interactions (Age × Home/Proficiency, Age × Social Use, Home × Social Use) did not improve model fit and were not included in the final model. An overview of all model comparisons is presented in Table S10, and fixed effects for the final model are reported in Table S11 (Supplementary Materials).
To address the influence of extreme values, we conducted a sensitivity analysis excluding the two bilingual participants with the highest Composite Scores (S157, S158). Results were virtually identical or slightly stronger. In Section 6.2.1, the Composite effect remained significant (β = 0.227, 95% CI [0.063, 0.390], p = .007), with a stable Age effect (β = −0.170, 95% CI [−0.260, −0.080], p < .001). In Section 6.2.2, the AIC-selected model was Age + Social Use; Social Use remained significant (β = 0.111, 95% CI [0.039, 0.183], p = .003), alongside Age (β = −0.160, 95% CI [−0.250, −0.070], p < .001). Full results are reported in Tables S12–S13 (Supplementary Materials). For completeness, zero-order correlations between interference control and bilingualism indices are provided in the Supplementary Materials (Table S14).
In summary, results indicate that although interference control declined with age in both groups, the main effect of Group was attenuated once Education was controlled. However, normative T-scores, which are corrected for demographic factors, revealed a small but consistent bilingual advantage. Importantly, continuous analyses of bilingualism indices (Composite Score, Social Use) showed that the advantage is not uniform across bilinguals, but is primarily driven by those with higher levels of active social use of Basque.
7. Discussion
This study investigated the relationship between bilingual language use, aging, and interference control using the Color–Word Stroop task (Golden, Reference Golden, Ruiz-Fernández, Luque and Sánchez-Sánchez2010). By comparing highly proficient Basque–Spanish bilinguals with varying language use habits to Spanish monolinguals, we examined how language experience shapes cognitive control across the lifespan. Bilingual experience was quantified using separate indices of home use/proficiency and social use derived from an adapted version of the LSBQ (Anderson et al., Reference Anderson, Mak, Keyvani Chahi and Bialystok2018), using the factor-analytic scoring procedure described in that study. This approach allowed us to go beyond global self-reports and explore how different contexts of language use relate to cognitive performance.
Our findings point to three main conclusions. First, interference control declined robustly with age, consistent with prior evidence of age-related reductions in executive function. Second, once Education was controlled, the broad bilingual versus monolingual comparison did not yield a significant advantage, although a small effect in favor of bilinguals emerged in the normative Stroop T-scores, which are already corrected for demographic influences. Third, and most importantly, when bilingualism was examined as a continuous construct, higher Composite Scores – and especially greater Social Use of Basque – were reliably associated with better interference control, whereas Home/Proficiency showed weaker and nonsignificant associations. These regression results indicate that the bilingual advantage is not uniform across bilinguals but is primarily driven by those who engage actively in socially rich Basque-speaking contexts, underscoring the importance of everyday, socially meaningful language use in supporting cognitive control. The ultimate mechanisms underlying this association remain to be fully understood and warrant further investigation.
Our first key finding is that high use of Basque, particularly in social contexts, is associated with superior interference control. This finding is supported by a growing body of literature suggesting that bilingual advantages in executive functioning are not due to language proficiency but rather due to how bilinguals manage their languages in everyday life – such as how often they speak each language, in what settings, and how frequently they switch between them. Across several studies, frequent language switching and engagement in dual-language or dense code-switching contexts have been linked to enhanced executive control. For instance, dual-language contexts have been associated with improved task-set reconfiguration (Hartanto & Yang, Reference Hartanto and Yang2016), and switching in naturalistic settings has been shown to boost executive performance (Barbu et al., Reference Barbu, Orban, Gillet and Poncelet2018; Verreyt et al., Reference Verreyt, Woumans, Vandelanotte, Szmalec and Duyck2016). In addition, Hartanto and Yang (Reference Hartanto and Yang2020) found that dual-language contexts predicted task-switching abilities, while dense code-switching was linked to inhibitory control and goal maintenance. These findings converge with our own, demonstrating that the frequency and context of language use – particularly in interactionally rich and demanding environments – can shape specific components of executive function.
Given the diglossic context the Basque language experiences, frequent use of Basque naturally entails regular language switching, as many speakers routinely interact with interlocutors who either do not speak Basque or vary in their proficiency. As a minority language, Basque is still underrepresented in public and institutional domains, meaning that even highly active Basque speakers must continually adapt to bilingual settings. This constant adjustment likely increases the cognitive demands of communication, reinforcing interference control mechanisms. In line with this, those participants who reported predominantly using Basque in our study – and who are therefore more frequently managing such bilingual interactions – showed the strongest performance on the Stroop task. This finding supports the idea that active engagement with a minority language in dynamic contexts strengthens interference control.
Although we did not directly measure exposure to dual-language or dense code-switching contexts, recruitment site likely shaped participants’ opportunities for each. In Vitoria-Gasteiz, where Spanish predominates, bilinguals are more often required to choose between languages depending on their interlocutor, a pattern characteristic of dual-language contexts. In contrast, in Debagoiena, where Basque is widely used, bilinguals are more likely to engage in dense code-switching within interactions. Importantly, recruitment site was not included as a covariate in our analyses, because it is conceptually upstream of individual language-use behavior. Our primary predictors (Social Use and Home Use) were designed to capture individual variability in bilingual experience beyond coarse geographic distinctions, including variability among speakers living in the same region. Accordingly, the observed association between Social Use of Basque and interference control cannot be reduced to recruitment site alone, although future work should explicitly examine how regional sociolinguistic environments interact with individual language-use patterns.
One of the most novel findings of the study is the stronger role of social language use over home use in predicting interference control. While both contexts involve bilingual interaction, they likely differ in the kinds of cognitive demands they impose. A possible explanation is that social environments tend to be more dynamic and less predictable, requiring more flexible and spontaneous language switching. In contrast, language use at home is often more stable and routinized: speakers typically know in advance which language to use with each family member, and switching patterns may follow familiar routines. Moreover, some participants may live in predominantly Basque-speaking households, where limited exposure to Spanish reduces the need for frequent switching altogether. These factors may reduce the need for real-time control or interference resolution in the home environment, potentially explaining the weaker link between home use and Stroop performance.
While our study did not directly measure the predictability or switching demands of different contexts, prior research offers relevant evidence for this interpretation. For example, Mosca and Clahsen (Reference Mosca and Clahsen2016) found that providing preparation time before a language switch reduces switch costs, suggesting that advance knowledge about the upcoming language decreases processing demands. Similarly, Fink and Goldrick (Reference Fink and Goldrick2015) reported that language preparation facilitates first-language production, consistent with the idea that predictability mitigates interference. These findings suggest that spontaneous and less predictable interactions – more common in social than in home contexts – may engage interference control more strongly.
A second key finding is that bilingual advantages emerged in a graded fashion. Within the bilingual group, higher composite scores and particularly greater social use were linked to reduced interference, indicating that proficiency alone is insufficient to drive cognitive advantages. Instead, it is the intensity and habitual engagement with both languages that appear to shape cognitive outcomes. This interpretation aligns with experience-based models of bilingualism, such as the ACH (Green & Abutalebi, Reference Green and Abutalebi2013), which emphasize the role of habitual language control in driving neurocognitive adaptations. In line with this, Gullifer and Titone (Reference Gullifer and Titone2021) used a continuous, multidimensional approach to language experience and found that while bilingual experience was associated with proactive control, these effects were subtle and required large, diverse samples to detect. Their work highlights the importance of fine-grained measurements of bilingual experience to understand how it relates to executive functioning.
However, not all frameworks interpret such effects as evidence of domain-general cognitive adaptation. For instance, Blanco-Elorrieta and Caramazza (Reference Blanco-Elorrieta and Caramazza2021) caution against attributing performance differences in laboratory tasks to generalized enhancements in executive control. Instead, they argue that cognitive performance in bilinguals likely reflects task-specific adaptations shaped by sociolinguistic demands. From this perspective, the superior Stroop performance of bilinguals who frequently use Basque – particularly in socially complex settings – may reflect refined mechanisms for resolving language-specific conflict, without necessarily implying broader changes in executive functioning. Critically, our interpretation does not assume transfer of a language-specific control mechanism to domain-general executive functions, but rather that recurrent language-use demands shape the efficiency with which attentional resources are deployed under conditions of uncertainty.
The Stroop test remains a suitable testing vehicle not because it mirrors bilingual language processing, but because it places strong demands on interference resolution and selective attention, making experience-driven adaptations observable at the behavioral level. At the same time, not all models assume that such conflict is ubiquitous in bilingual language use; bilinguals can sometimes directly select the intended language without competition. Our findings are compatible with both views. They suggest that Stroop performance reflects those aspects of bilingual experience that involve conflict resolution, without implying that conflict is constant in all bilingual interactions. This perspective is consistent with our emphasis on dynamic, context-dependent language use and underscores the need to interpret experimental outcomes in light of real-world bilingual practices.
Consistent with this nontransfer view, our interpretation also aligns with Bialystok’s attention-as-adaptation framework (Bialystok, Reference Bialystok2024), which posits that attentional control is not a fixed trait but an adaptive response to the structure of bilingual experience. Predictable and routinized language use at home places relatively modest demands on attentional flexibility, whereas dynamic social contexts require continuous monitoring of interlocutors and rapid adaptation to shifting linguistic demands. The fact that only social use of Basque was associated with stronger Stroop performance fits this framework: it is in socially variable settings, rather than in stable home routines, that attentional resources are sharpened. In this way, our findings support the idea that bilingual experience leads to context-dependent recalibration of attentional mechanisms, rather than a broad, undifferentiated enhancement of executive functioning.
The third key finding confirms previous research showing that interference control tends to decline with age (Bialystok et al., Reference Bialystok, Craik and Luk2008; Craik & Bialystok, Reference Craik and Bialystok2006). Although bilinguals outperformed monolinguals overall, this advantage did not completely offset the effects of aging. This suggests that active bilingualism may be associated with more efficient interference control, but does not appear to alter the overall trajectory of age-related decline. These results are consistent with studies reporting dissociations between language-specific and domain-general cognitive control in aging populations (Calabria et al., Reference Calabria, Branzi, Marne, Hernández and Costa2015; Mas-Herrero et al., Reference Mas-Herrero, Adrover-Roig, Ruz and de Diego-Balaguer2021).
A further limitation concerns socio-economic and educational factors. Although Basque was historically marginalized and linked to lower-status employment, bilinguals in our sample were more highly educated than monolinguals, reflecting recent sociolinguistic changes. Education showed substantial explanatory power, largely driven by differences between participants with no formal education and those with higher education. However, the skewed distribution of education, with very few participants in the lowest category, limits the interpretation of these effects. The overall pattern aligns with normative studies showing that higher schooling predicts better Stroop performance (Houx et al., Reference Houx, Jolles and Vreeling1993; Seo et al., Reference Seo, Lee, Choo, Youn, Kim, Lee, Jhoo, Woo and Kim2008; van der Elst et al., Reference van der Elst, van Boxtel, van Breukelen and Jolles2006). Part of the observed group-level differences may therefore reflect educational disparities. Importantly, we did not collect direct measures of socio-economic status (e.g., income, occupation), so potential socio-economic confounds cannot be fully ruled out. Nonetheless, given the historical context of Basque in the labor market, systematic socioeconomic advantages for bilinguals are unlikely to fully explain the observed effects. Within the bilingual group, continuous language-use indices explained additional variance beyond education, indicating that language use itself contributed uniquely to interference control.
Taken together, our findings contribute to the growing body of research linking bilingual language experience – particularly its frequency, context, and social function – to individual differences in executive functioning. They also highlight the importance of examining bilingualism within its broader sociolinguistic environment, as not all bilingual contexts place equal cognitive demands. The Basque–Spanish context, with its diglossic nature, minority language status and interactional asymmetries, offers a valuable lens for understanding how patterns of language use shape cognitive processes. Future research should continue to explore the complexities of bilingual language practices to clarify how different bilingual experiences may support executive function and influence trajectories of cognitive aging.
8. Conclusion
This study shows that the way bilingualism is enacted in daily life – rather than bilingual status alone – relates to individual differences in interference control. Although group-level differences between bilinguals and monolinguals were not conclusive once education was accounted for, within the bilingual group, greater use of the minority language in social contexts predicted stronger performance. Social language use, which typically involves more dynamic and unpredictable interactions than home use, emerged as the most reliable predictor. Interference control declined with age across all participants, and bilingualism did not alter this trajectory.
These findings support experience-based approaches to bilingualism, highlighting the role of language-use patterns and interactional contexts in shaping cognitive control. A limitation is that all participants were tested in Spanish, as no standardized Stroop version exists in Basque; this underscores the need for validated tools in minority languages. Future longitudinal and ecologically grounded studies are needed to clarify how sustained language engagement influences cognitive aging.
Supplementary material
The supplementary material for this article can be found at http://doi.org/10.1017/S1366728926101072.
Data availability statement
The anonymized dataset and analysis scripts supporting the findings of this study are openly available in the Open Science Framework (OSF) repository at: https://osf.io/zxtp4/.
Acknowledgements
We are deeply grateful to all participants for their time, enthusiasm, and generous involvement in this study. We thank our lab technician Yolanda Acedo and research assistant Alazne Sainz for their support. We are also extremely grateful to the town council and Euskaltegi of Arrasate, particularly to Aintzane Lasa and Elena San Martín, for space and help in participant recruitment. We also wish to thank Goiena Komunikazio Taldea and Arabako Alea for their invaluable help in publicizing our project. This research was funded by the project Lenguaje y bilingüismo en el envejecimiento saludable: Un estudio sobre el almacenamiento mental del vocabulario (AGINGLEXICON), supported by a 2021 Leonardo Grant for Researchers and Cultural Creators from Fundación BBVA [MA, ISM]; by the project PID2022-142625OA-I00, funded by MICIU/AEI/10.13039/501100011033 and by FEDER, UE; a Ramón y Cajal Fellowship RYC2021-033222-I, funded by the Spanish Ministry of Science, Innovation and Universities – State Research Agency (MCIU/AEI/10.13039/501100011033) and the EU’s NextGenerationEU/PRTR [MA]; and the Basque Government IT1439-22/IT1439-26 [IL, MA, ISM].
Competing interests
The authors declare none.


 Open access