

Obesity is associated with several co-morbidities such as cardiovascular complications, type 2 diabetes and certain types of cancers and it is considered to be the main factor leading to the development of the metabolic syndromeReference Poirier, Giles, Bray, Hong, Stern, Pi-Sunyer and Eckel1. The prevalence of obesity is increasing dramatically both in Western countries and in the developing worldReference York, Rossner, Caterson, Chen, James, Kumanyika, Martorell and Vorster2. Since nutrition is one of the most important factors affecting the development of obesity, nutritional approaches to prevent and control this growing epidemic are crucial.
The inverse relationship between dietary Ca intake and BMI was first observed in the late 1980sReference McCarron, Morris, Henry and Stanton3, Reference Metz, Karanja, Torok and McCarron4 and since then the association has been further confirmed in several epidemiological studiesReference Zemel, Shi, Greer, Dirienzo and Zemel5–Reference Skinner, Bounds, Carruth and Ziegler8. In addition to the epidemiological findings, the inverse relationship between dietary Ca intake and body weight is supported by data from both human and animal studies Reference Zemel, Shi, Greer, Dirienzo and Zemel5, Reference Shi, Dirienzo and Zemel9–Reference Zemel, Richards, Milstead and Campbell12. However, the mechanisms by which Ca affects body weight are still not fully understood, and studies clarifying the mechanisms are continuously demanded in the literatureReference Harris13, Reference Sakhaee and Maalouf14.
One possible factor explaining the inverse relationship between Ca intake and BMI is the fatty acid-binding capacity of CaReference Denke, Fox and Schulte15, Reference Tadayyon and Lutwak16. Some studies have found it to be a significant factor explaining the anti-obesity effect of dietary CaReference Papakonstantinou, Flatt, Huth and Harris17, Reference Jacobsen, Lorenzen, Toubro, Krog-Mikkelsen and Astrup18, while other researchers argue that the effect that Ca has on fat absorption is too small to explain the influence Ca has on body weightReference Zemel19.
The alternative hypothesis explaining the anti-obesity effect of Ca links dietary Ca intake, serum 1,25-dihydroxyvitamin D3 (1,25-dihydroxycholecalciferol; 1,25(OH)2-D3) concentration and adipocyte intracellular Ca concentration. This theory is based on the finding that adipocyte intracellular Ca is a regulator of both lipogenesis and lipolysisReference Xue, Greenberg, Kraemer and Zemel20–Reference Kim, Mynatt, Moore, Woychik, Moustaid and Zemel22. The hypothesis is further supported by in vitro data which show that one of the factors regulating the intracellular Ca concentration of adipocytes is 1,25(OH)2-D3, which is affected by changes in Ca intake. Low Ca intake increases 1,25(OH)2-D3 concentration, whereas high Ca intake suppresses 1,25(OH)2-D3 levels. 1,25(OH)2-D3 has been found to increase the influx of Ca into the adipocytes and thereby increase the adipocyte intracellular Ca concentration which in turn stimulates lipogenesis by increasing the activity and mRNA expression of fatty acid synthase (FAS) and inhibits lipolysisReference Shi, Norman, Okamura, Sen and Zemel23. These actions altogether lead to increased fat accumulation in a situation of low Ca intake, when serum 1,25(OH)2-D3 concentration is high. In addition to that, 1,25(OH)2-D3 has been shown to inhibit uncoupling protein 2 expression in human adipocytes via the nuclear vitamin D receptor and thereby affect the regulation of thermogenesis and energy metabolismReference Shi, Norman, Okamura, Sen and Zemel24. Furthermore, 1,25(OH)2-D3 is found to be a regulator of adipocyte apoptosis, which may contribute to the effects of a high-Ca dietReference Sun and Zemel25.
Experimental studies investigating the mechanisms of dietary Ca and body-weight control have mainly been performed using the aP2-agouti transgenic mouse. This particular mouse expresses the agouti gene in adipose tissue under the control of the aP2 promoter. aP2-agouti transgenic mice are not obese when fed a standard laboratory diet, but are susceptible to diet-induced obesity and develop marked adipose tissue accumulation on a high-fat–high-sucrose diet. aP2-agouti transgenic mice respond dramatically to changes in Ca content in the diet and the effectiveness of high-Ca diets in reducing adiposity has been shown repeatedly in this modelReference Zemel, Shi, Greer, Dirienzo and Zemel5, Reference Shi, Dirienzo and Zemel9, Reference Sun and Zemel10, Reference Sun and Zemel26. However, these results have not been confirmed in other obese animal models or human subjects, and some human and animal studies have failed to show an inverse relationship between Ca intake and body weightReference Harvey-Berino, Gold, Lauber and Starinski27–Reference Zhang and Tordoff30.
In most of the studies reporting the anti-obesity effects of dietary Ca, the effects of dairy products have been comparable or superior to the effects of Ca aloneReference Zemel, Shi, Greer, Dirienzo and Zemel5, Reference Shi, Dirienzo and Zemel9–Reference Zemel, Richards, Mathis, Milstead, Gebhardt and Silva11. These results point out that there are factors in milk that either potentiate the effects of Ca or have independent health effects. So far the specific components or molecules of dairy products responsible for these effects are not known, but the protein fraction has been suggested to be the source of these bioactive substancesReference Zemel31–Reference Zemel33.
The major protein classes of milk are whey (20 %) and casein (80 %) proteinsReference Huffman and Harper34. The whey protein fraction, especially, has been suggested to contain bioactive substances responsible for the pronounced anti-obesity effect of dairy products, but this has not been demonstrated so far. In the present study we compared the effect of two high-Ca diets with different protein sources (whey and casein) in inhibiting weight and fat-tissue gain in C57Bl/6J mice during a high-fat diet. The C57Bl/6J mouse is a well-established model of diet-induced obesityReference Collins, Martin, Surwit and Robidoux35–Reference Surwit, Kuhn, Cochrane, McCubbin and Feinglos37. This inbred mouse strain develops obesity and insulin resistance when fed a high-fat diet and thus serves as a very human-like experimental model of obesity research.
Methods
Animals and diets
Male C57Bl/6J mice, age 8 weeks, were purchased from Harlan (Horst, The Netherlands). The mice were housed five in a cage in a standard experimental animal laboratory, illuminated from 06.30 to 18.30 hours, temperature 22 ± 1°C. The protocols were approved by the Animal Experimentation Committee of the University of Helsinki (Finland). The mice had free access to feed and tap water during the experiment. After a 1-week acclimatisation period on a low-fat diet (D12450B; protein 20 %, carbohydrate 70 % and fat 10 % of energy; Research Diets Inc., New Brunswick, NJ, USA) the body weight-matched mice (25·6 ± 0·1 g) were divided into three groups receiving modified high-fat diets (60 % of energy from fat) for 21 weeks. The mice were divided into two high-Ca groups (1·8 % calcium carbonate (CaCO3); whey protein group and casein group) and a low-Ca casein group (0·4 % CaCO3) (Table 1). In the beginning of the study the body weights were 25·6 (sem 0·7), 25·6 (sem 0·6) and 25·5 (sem 0·4) g in the high-Ca whey, high-Ca casein and low-Ca casein groups, respectively. All the protein (18 % of energy) in the diet of the high-Ca whey group was of whey protein isolate (Alacen™ 895; NZMP, Auckland, New Zealand) and all the protein (18 % of energy) in the casein groups was of casein isolate (Alacid 714; New Zealand Milk Products Inc., Santa Rosa, CA, USA). Research Diets Inc. manufactured the diets. The powdered diets were moistened with tap water (200 ml/kg in the high-Ca whey, 100 ml/kg in the high-Ca casein and 110 ml/kg in the low-Ca casein diet) using an industrial dough mixer, packed in 1 d portions and stored at − 20°C.
Diet composition*

* Diets were formulated and produced by Research Diets Inc. (New Brunswick, NJ, USA).
Body weight was monitored twice per week and the consumption of feed was monitored daily using a standard table scale (Ohaus Scout™ Pro SP4001; Ohaus Scout, Nänikon, Switzerland). Mean and cumulative energy intake was calculated from the food intake data. Body fat content was analysed by dual-energy X-ray absorptiometry (Lunar PIXImus; GE Healthcare, Chalfont St Giles, Bucks, UK) on weeks 14 and 20 of the treatment period.
Faecal fat and calcium excretion
For the collection of faeces, the mice (seven per group) were housed individually in metabolism cages for 72 h during weeks 3 and 16 of the treatment period. The intake of feed and drink was monitored daily. All faeces excreted during the 72 h period were collected at the end of the 72 h period. The faeces were weighed and stored at − 70°C until assayed. The fat content of the faecal samples was determined by the Schmid–Bondzynski–Ratzlaff method38 and Ca content was determined using inductively coupled plasma MS (Elan 6100; Perkin Elmer, Boston, MA, USA). Apparent fat absorption was calculated from the amount of feed consumed and the amount of fat excreted during the housing in metabolism cages. Apparent fat absorption (%) was determined as 100 × ((fat intake – faecal fat)/(fat intake)). To estimate how much the increased fat excretion actually decreased the amount of absorbed energy from fat during the whole study period, we calculated ‘the apparent cumulative energy absorption from fat’. For this we used the cumulative energy intake data and apparent fat absorption percentage (apparent fat absorption % × cumulative energy intake from fat) as described previouslyReference Papakonstantinou, Flatt, Huth and Harris17.
Blood glucose and serum lipids
Blood glucose and serum lipids were analysed from the blood samples taken at the termination of the animals. Blood glucose was determined by glucometer (Super Glucocard™ II, GT-1630; Arkray Factory Inc., Shiga, Japan). Serum lipids were analysed by an accredited laboratory (HUSLAB, Helsinki University Central Hospital, Helsinki, Finland) using a Hitachi 912 Automatic Analyser (Hitachi Ltd, Tokyo, Japan).
Core temperature
Core temperature was used as an indirect indicator of body thermogenesis. Temperature was measured using a thermocouple (BAT-12; Physitemp, Clifton, NJ, USA), immediately before the termination of the animals. The probe was inserted into the rectum of each mouse at a constant distance (1·5 cm) and the temperature was recorded after stabilisation. All the measurements were performed between 08.00 and 11.00 hours.
Sample preparation
At the end of the treatment period the mice were rendered unconscious with CO2–O2 (95:5, v/v) (AGA, Riihimäki, Finland) and decapitated. Blood samples were taken in plastic tubes, and serum was separated by centrifugation at +4°C for 15 min.
1,25-Dihydroxycholecalciferol and parathyroid hormone
Serum 1,25(OH)2-D3 was determined by a RIA-kit (IDS Ltd, Boldon, Tyne & Wear, UK) and serum intact parathyroid hormone (PTH) was determined by ELISA (Immutopics Inc., San Clemente, CA, USA) according to the instructions of the manufacturer.
Statistical analysis
Data are presented as mean values with their standard errors. Statistically significant difference in mean values were tested by ANOVA followed by Tukey's test. ANOVA for repeated measurements was applied for data consisting of repeated observations at successive time points. The difference was considered significant when P < 0·05. The data were analysed using GraphPad Prism (version 4.02; GraphPad Software, Inc., San Diego, CA, USA) and SPSS (version 10.1; SPSS Inc., Chicago, IL, USA).
Results
Body-weight gain
Body-weight gain in the high-Ca casein group did not differ from the low-Ca casein group (P>0·05) (Fig. 1(a)). However, the mice in the high-Ca whey group gained less body weight than the mice in the high- or low-Ca casein groups. The dips in the body-weight curves at weeks 3, 14 and 20 represent a normal response to housing in metabolism cages and dual-energy X-ray absorptiometry measurements, which were performed at those time points. The final body weight in the high-Ca whey group (44·1 (sem 1·1) g) was 7·9 % lower than in the high-Ca casein (47·9 (sem 1·0) g) and 8·3 % lower than in the low-Ca casein group (48·1 (sem 0·8) g) (Fig. 1(b)).
(a) Body-weight gain of C57Bl/6J mice fed a high-fat diet with high-Ca whey (□), high-Ca casein (○) and low-Ca casein (●). (b) Final body weight after 21 weeks feeding of a high-fat diet with high-Ca whey, high-Ca casein and low-Ca casein. Values are means for ten mice per group, with their standard error of the means represented by vertical bars. *Mean value was significantly different from that of the high-Ca whey group (P < 0·05).

Body fat content
The body fat content of the mice increased significantly during the high-fat diet. The whey protein and Ca significantly attenuated the increase in body fat content (P < 0·05) when compared with the high-Ca casein and low-Ca casein groups (Fig. 2). There was no difference in the body fat gained during the treatment period between the two casein groups.
(a) Body fat content of high-fat-fed C57Bl/6J mice after 14 weeks of treatment in high-Ca whey, high-Ca casein and low-Ca casein groups. (b) Body fat content of high-fat-fed C57Bl/6J mice after 20 weeks of treatment. Values are means for ten mice per group, with their standard error of the means represented by vertical bars. *Mean value was significantly different from that of the high-Ca whey group (P < 0·05).

Food and energy intake
Mean daily food intake was greatest in the high-Ca whey group (3·3 (sem 0·05) g/mouse per d) in comparison with the high-Ca casein (3·0 (sem 0·12) g/mouse per d; P>0·05) and the low-Ca casein group (2·7 (sem 0·002) g/mouse per d; P < 0·05). Cumulative food intake was also greatest in the high-Ca whey group (Fig. 3). However, there were no differences in mean daily energy intakes (56·3 (sem 0·8) kJ/mouse per d in the high-Ca whey, 55·9 (sem 2·1) kJ/mouse per d in the high-Ca casein and 52·5 (sem 0·04) kJ/mouse per d in the low-Ca casein group) or in the cumulative energy intake between the groups.
(a) Cumulative food intake during the study for the high-Ca whey, high-Ca casein and low-Ca casein groups. (b) Cumulative energy intake during the study. Values are means for ten mice per group, with their standard error of the means represented by vertical bars. *Mean value was significantly different from that of the high-Ca whey group (P < 0·05).

Faecal fat and calcium excretion
Faecal fat content was significantly greater in the high-Ca whey group when compared with both casein groups (P < 0·05), but there was no statistical difference in the faecal fat content between the casein groups (Fig. 4(b)). Fat excretion did not change significantly between the first and second collection (data not shown). There was no statistical difference between the high-Ca or casein groups in apparent fat absorption (%), but apparent fat absorption in the high-Ca whey group was significantly smaller than in the low-Ca casein group (P < 0·05) (Fig. 4(c)). However, the apparent cumulative energy absorption from fat did not differ between the groups (4916·4 (sem 84·9) kJ/mouse per 21 weeks in the high-Ca whey, 4891·2 (sem 202·5) kJ/mouse per 21 weeks in the high-Ca casein and 4602·9 (sem 8·4) kJ/mouse per 21 weeks in the low-Ca casein group; ANOVA; P = 0·295). There was a significant difference in Ca excretion between the low-Ca casein group and high-Ca groups (whey and casein) in line with the Ca content of the diets (Table 2).
(a) Fat ingested during the housing in metabolism cages on week 20 of the study for the high-Ca whey, high-Ca casein and low-Ca casein groups. (b) Faecal fat excretion. (c) Calculated fat absorption percentage. Values are means for seven mice per group, with their standard error of the means represented by vertical bars. Mean value was significantly different from that of the high-Ca whey group: *P < 0·05, ***P < 0·001.

Faecal calcium excretion, blood glucose, serum lipids and core temperature at the end of the study (Mean values with their standard error of the means; ten mice per group)
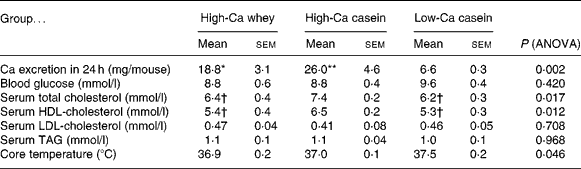
Mean value was significantly different from that of the low-Ca casein group: *P < 0·05, **P < 0·01.
† Mean value was significantly different from that of the high-Ca casein group (P < 0·05).
1,25-Dihydroxycholecalciferol and parathyroid hormone
Serum concentrations of 1,25(OH)2-D3 and intact PTH were significantly lower in the high-Ca (whey and casein) groups than in the low-Ca casein group (Fig. 5). There were no significant differences in either 1,25(OH)2-D3 or intact PTH concentrations between the high-Ca groups.
(a) Serum 1,25-dihydroxycholecalciferol (1,25(OH)2-D3) concentration at the end of the study for the high-Ca whey, high-Ca casein and low-Ca casein groups. (b) Serum intact parathyroid hormone (i-PTH) concentration at the end of the study. Values are means for ten mice per group, with their standard errors represented by vertical bars. ***Mean value was significantly different from that of the low-Ca casein group (P < 0·001).

Core temperature
There were no statistically significant differences in the core temperature between the groups (Table 2).
Blood glucose and serum lipids
There was no statistically significant difference in blood glucose levels between the groups, although blood glucose level was higher in the low-Ca casein group than in the Ca-treated groups (Table 2). Serum HDL-cholesterol concentration was significantly lower in the high-Ca casein group than in the high-Ca whey and low-Ca casein groups (P < 0·05) and so was the concentration of total cholesterol. There were no differences in serum LDL-cholesterol or TAG concentrations between the groups.
Discussion
In the present study we have shown for the first time that a high-Ca diet containing whey protein attenuates body-weight and adipose-tissue gain in a model of diet-induced obesity. In accordance with the literature, the mice gained significantly more weight than what is normally seen in the same mice fed a low-fat dietReference Collins, Martin, Surwit and Robidoux35, Reference Lin, Thomas, Storlien and Huang39. In contrast with previous experimental studies investigating the effect of Ca supplementation on body-weight gainReference Zemel, Shi, Greer, Dirienzo and Zemel5, Reference Papakonstantinou, Flatt, Huth and Harris17, we found no benefit from CaCO3 supplementation in combination with casein protein in attenuating weight and fat-tissue gain.
One possible explanation for reduced fat tissue content in the high-Ca whey group could be energy intake. However, neither the cumulative nor mean daily food intake was smaller in the high-Ca whey group than in the low-Ca casein group. If anything, the high-Ca whey group seemed to have greater food intake than the other groups during the study. Although it has previously been shown that whey protein load acutely increases the plasma levels of cholecystokinin and glucagon-like peptide-1 and thereby increases satiety in comparison with caseinReference Hall, Millward, Long and Morgan40, cumulative energy intake was not affected by the whey protein diet in the present study. This is in accordance with recent clinical data on the effect of whey protein on control of energy intakeReference Bowen, Noakes, Trenerry and Clifton41.
The formation of insoluble fat–Ca salts has been claimed to explain some of the anti-obesity effects of Ca. In the present study, Ca supplementation indeed increased the excretion of fat and the effect was pronounced in the high-Ca whey group. The difference between the high-Ca groups in fat excretion could be explained by the fact that the phosphate groups in casein are known to also bind CaReference Fox and McSweeney42. Hence there could be less free Ca to bind fatty acids in the casein diet. Since there was more added phosphate in the whey protein diet to balance the P levels to the same level as in the casein-based diets, it can also be argued that the supplemental phosphate in the whey diet could be responsible for more amorphous calcium phosphate complexes and thus more fat excretion. However, when the apparent fat absorption percentage was used to estimate the cumulative amount of fat absorbed during the 21-week study period, there was no difference in the amount of absorbed fat between the treatment groups. Although the cumulative amount of absorbed fat is based on calculations, it indicates that the increased fat excretion does not seem to fully explain the differences in body weight in the present study.
Previous studies on the anti-obesity effect of Ca, both in aP2-agouti transgenic mice and adipocyte cultures, have supported the theoretical framework where 1,25(OH)2-D3 plays a central role in the regulation of adipose tissue metabolismReference Zemel, Shi, Greer, Dirienzo and Zemel5, Reference Shi, Dirienzo and Zemel9, Reference Sun and Zemel10, Reference Shi, Norman, Okamura, Sen and Zemel23, Reference Shi, Norman, Okamura, Sen and Zemel24. However, in the present study we were not able to see the effect on the level of fat tissue accumulation in the high-Ca casein group in spite of a significant reduction in the serum concentration of 1,25(OH)2-D3. Even though there is accumulating evidence supporting the role of 1,25(OH)2-D3 in adipose tissue metabolism, its significance in obesity is still not clear. For instance, in a study on 302 healthy volunteers, Parikh et al. found significantly lower plasma 1,25(OH)2-D3-levels in obese than in non-obese subjectsReference Parikh, Edelman, Uwaifo, Freedman, Semega-Janneh, Reynolds and Yanovski43, which is in contrast with the theory that decreasing the amount of 1,25(OH)2-D3 by dietary Ca would lead to a decreased accumulation of fat. In addition to 1,25(OH)2-D3, PTH has also been shown to regulate adipocyte intracellular CaReference Zemel, Shi, Greer, Dirienzo and Zemel5, Reference Ni, Smogorzewski and Massry44 and it has been suggested to be a potential mediator of the anti-obesity effect of dietary CaReference Gunther, Legowski, Lyle, McCabe, Eagan, Peacock and Teegarden28, Reference Teegarden45. To support the role of PTH in obesity, a positive correlation between serum intact PTH and both BMI and fat mass has been reported in several studiesReference Parikh, Edelman, Uwaifo, Freedman, Semega-Janneh, Reynolds and Yanovski43, Reference Kamycheva, Sundsfjord and Jorde46, Reference Snijder, van Dam, Visser, Deeg, Dekker, Bouter, Seidell and Lips47. In the present study, however, the changes in PTH levels did not reflect the differences in body weight or fat mass.
According to the current hypothesis explaining the anti-obesity effect of Ca, 1,25(OH)2-D3 regulates FAS, the key enzyme of lipogenesis via adipocyte intracellular Ca. It has been suggested that de novo lipogenesis contributes to the development of obesity, particularly during a high-carbohydrate dietReference Kersten48. This might explain the controversy between the present results and earlier studies investigating the anti-obesity effect of Ca. The diets used by Zemel et al. have been rich in carbohydrate (sucrose, 64 % of energy) and fat, whereas the main energy source in the present study was fat (lard and soyabean oil, 60 % of energy)Reference Zemel, Shi, Greer, Dirienzo and Zemel5, Reference Shi, Dirienzo and Zemel9, Reference Sun and Zemel10. However, at least rat adipose tissue FAS mRNA expression has been shown to be unaffected by changes in the fat and carbohydrate content of the dietReference Letexier, Pinteur, Large, Frering and Beylot49. In addition, the significance of adipose tissue de novo lipogenesis in obesity is still controversial and the contribution of adipose tissue FAS activity to obesity is not clearReference Schutz50, Reference Schutz51.
Various health effects of whey protein have been described in the literature, but studies investigating the possible mechanisms are scarce. Previously, whey has been reported to inhibit body-weight gain in Wistar rats in comparison with red meatReference Belobrajdic, McIntosh and Owens52. On the other hand, whey protein isolate and its hydrolysate were proven to be less effective than soya protein in a weight-reduction study in genetically obese yellow KK miceReference Aoyama, Fukui, Nakamori, Hashimoto, Yamamoto, Takamatsu and Sugano53. However, in both of these studies whey was used as a part of a high-protein diet, in contrast to the present study, in which the protein content of the diet was in the normal range.
One possible factor contributing to the effect of whey protein is the amino acid content of whey. Whey contains substantial amounts of branched-chain amino acids; leucine, isoleucine and valine. Leucine, especially, is known to have various metabolic functions including the initiation of muscle protein synthesisReference Anthony, Anthony, Kimball and Jefferson54 and modulating insulin–PI3 kinase signallingReference Patti, Brambilla, Luzi, Landaker and Kahn55. This might direct the consumption of energy to muscle protein synthesis instead of energy storage in adipose tissue. Long-term leucine supplementation has indeed been shown to increase body-fat loss during food restriction in Wistar ratsReference Donato, Pedrosa, Cruzat, Pires and Tirapegui56, but it is not known whether leucine supplementation is able to inhibit weight gain during a high-fat diet by promoting muscle protein synthesis.
A whey protein-rich diet has also been shown to have an effect on liver and muscle lipogenic enzyme activities. Morifuji et al. have shown in non-obese Sprague–Dawley rats that a whey protein diet decreases the activity of various hepatic lipogenic enzymes including glucose-6-phosphate dehydrogenase, acetyl-CoA carboxylase and FAS and increases glucokinase activity in comparison with caseinReference Morifuji, Sakai, Sanbongi and Sugiura57, Reference Morifuji, Sakai, Sanbongi and Sugiura58. Additionally, the skeletal muscle FAS and glycogen synthase activity were significantly increased and 6-phosphofructokinase decreased in their studies. This shows that there are factors in whey which may modulate the activity of different key enzymes of energy metabolism and thereby affect energy homeostasis in the body.
In conclusion, we found that a high-Ca diet with whey protein isolate inhibits body-weight gain during a high-fat diet in C57Bl/6J mice. These results indicate that whey protein contributes to the previously described anti-obesity effect of dairy products. The mechanisms of weight-gain attenuation and possible functional compounds in whey protein remain to be studied further.
Acknowledgements
The present study was supported by the Foundation for Nutrition Research, Academy of Finland, Sigrid Juselius Foundation and Valio Ltd, Helsinki, Finland. We are grateful to Ms Sari Laakkonen, Mrs Anneli von Behr, Mr Berndt Köhler, Ms Sonja Latvakoski and Ms Anne-Maria Riihimäki for expert technical assistance.


