




Zaiwa (ISO 639-3 code: atb; Glottocode: zaiw1241) belongs to the Burmese branch of the Tibeto-Burman languages, sharing many common features with the Burmese and Achang languages of the same branch. It is primarily spoken by a subgroup of Jingpo people, who identify as ‘Zaiwa’. Beyond Zaiwa, the Jingpo people encompass four distinct subgroups, each conversing in unique linguistic variations, namely Jingpo (景颇), Langsu (浪速), Leqi (勒期), and Bola (波拉). Jingpo is distinctively affiliated with the Jingpo branch of the Tibeto-Burman languages, whereas the other three languages, including Zaiwa, are categorized within the Burmese branch (He, 2016). The majority of Zaiwa speakers are found in Luxi (潞西), Yingjiang (盈江), Longchuan (陇川), Ruili (瑞丽), Lianghe (梁河), and Wanding (畹町) counties within the Dehong Dai and Jingpo Autonomous Prefecture (德宏傣族景颇族自治州) of Yunnan province (云南省) as well as the Shan and Kachin states in Myanmar. Zaiwa is widely used in Zaiwa-dominant areas or communities with a significant Zaiwa presence. It is used not only in daily life contexts, such as among family members, villages, markets, and shops, but also in a range of social sectors, including in government and judicial offices, as well as on radio and broadcasting stations. Among the Jingpo languages, Zaiwa has the largest number of users. Individuals who speak Zaiwa often speak languages of other Jingpo subgroups in addition to Mandarin Chinese. Due to the extensive promotion and dissemination of Mandarin, particularly in educational and media contexts, Mandarin has emerged as the predominant second language for the youth within the community. Moreover, in neighboring regions or mixed communities where the Zaiwa subgroup is prominent, individuals from other ethnic groups such as the Achang, Han, Dai, and Lisu also frequently speak Zaiwa. According to the statistics from China’s Sixth National Population Census in 2010, the total population of the Jingpo ethnic group is approximately 140,000. There were over 80,000 Zaiwa speakers within China, constituting more than 60% of the total Jingpo ethnic population in the country (He, 2016). Scholars such as Xu and Xu (1984), Dai (1989), Kong (2001), Pan (2014), He (2016), Lu and Kong (2019), and Lu et al. (2025) have conducted studies on the phonetics of Zaiwa.
Previous research has generally categorized Zaiwa into two principal dialects (He, 2016): the Bengwa dialect (迸瓦方言), which encompasses Wuchalu Township (五岔路乡), as well as Yingjiang County and parts of Xishan Township (西山乡) in Mang County (芒市), and the Longzhun dialect (龙准方言), which encompasses Zhefang (遮放) and Manghai (芒海) Townships as well as the southern sector of Xishan Township in Mang County. In addition, the Longzhun dialect spans across Longchuan and Ruili Counties. The present Illustration is based on data collected by a female native Zaiwa speaker from Ruili County. As shown in Figure 1, Ruili is located in the southwestern area of the Dehong Dai and Jingpo Autonomous Prefecture. It is adjacent to Mang County to the east, borders Longchuan County to the north, and shares its northwest, southwest, and southeast borders with Myanmar. As of September 2022, Ruili’s total area included 944.75 square kilometers. By the end of 2021, the county’s permanent resident population totaled 226,639. The female native Zaiwa speaker in our study was 26 years old at the time of recording. She was born and raised in Huyu Township of Ruili County, and had not spent long periods outside of the area. She completed her education at Dehong Teachers’ College, specializing in Zaiwa and is presently employed by a Village Committee of the Ruili Government. The devices used during the recording sessions were a laptop computer, an external sound card, a mixing console, and a unidirectional collar clip microphoneFootnote 1 . The software used was Adobe Audition 2023, with a sampling rate of 44.1 kHz and 16-bit resolution. Recordings were performed in a quiet room. Basic speech parameters were extracted using Praat (Boersma & Weenink, 2020). Chao’s five-scale pitch system was applied to transcribe the tones throughout this article (Chao, 1980). Vowels with pressed voice appear with the “creaky-voiced” diacritic and the distinction between pressed and modal voice vowels will be described in detail in the Vowels section.
Distribution of Zaiwa. The areas of Zaiwa are shaded pink. The map is drawn from C1-24 of Language Atlas of China, second edition.
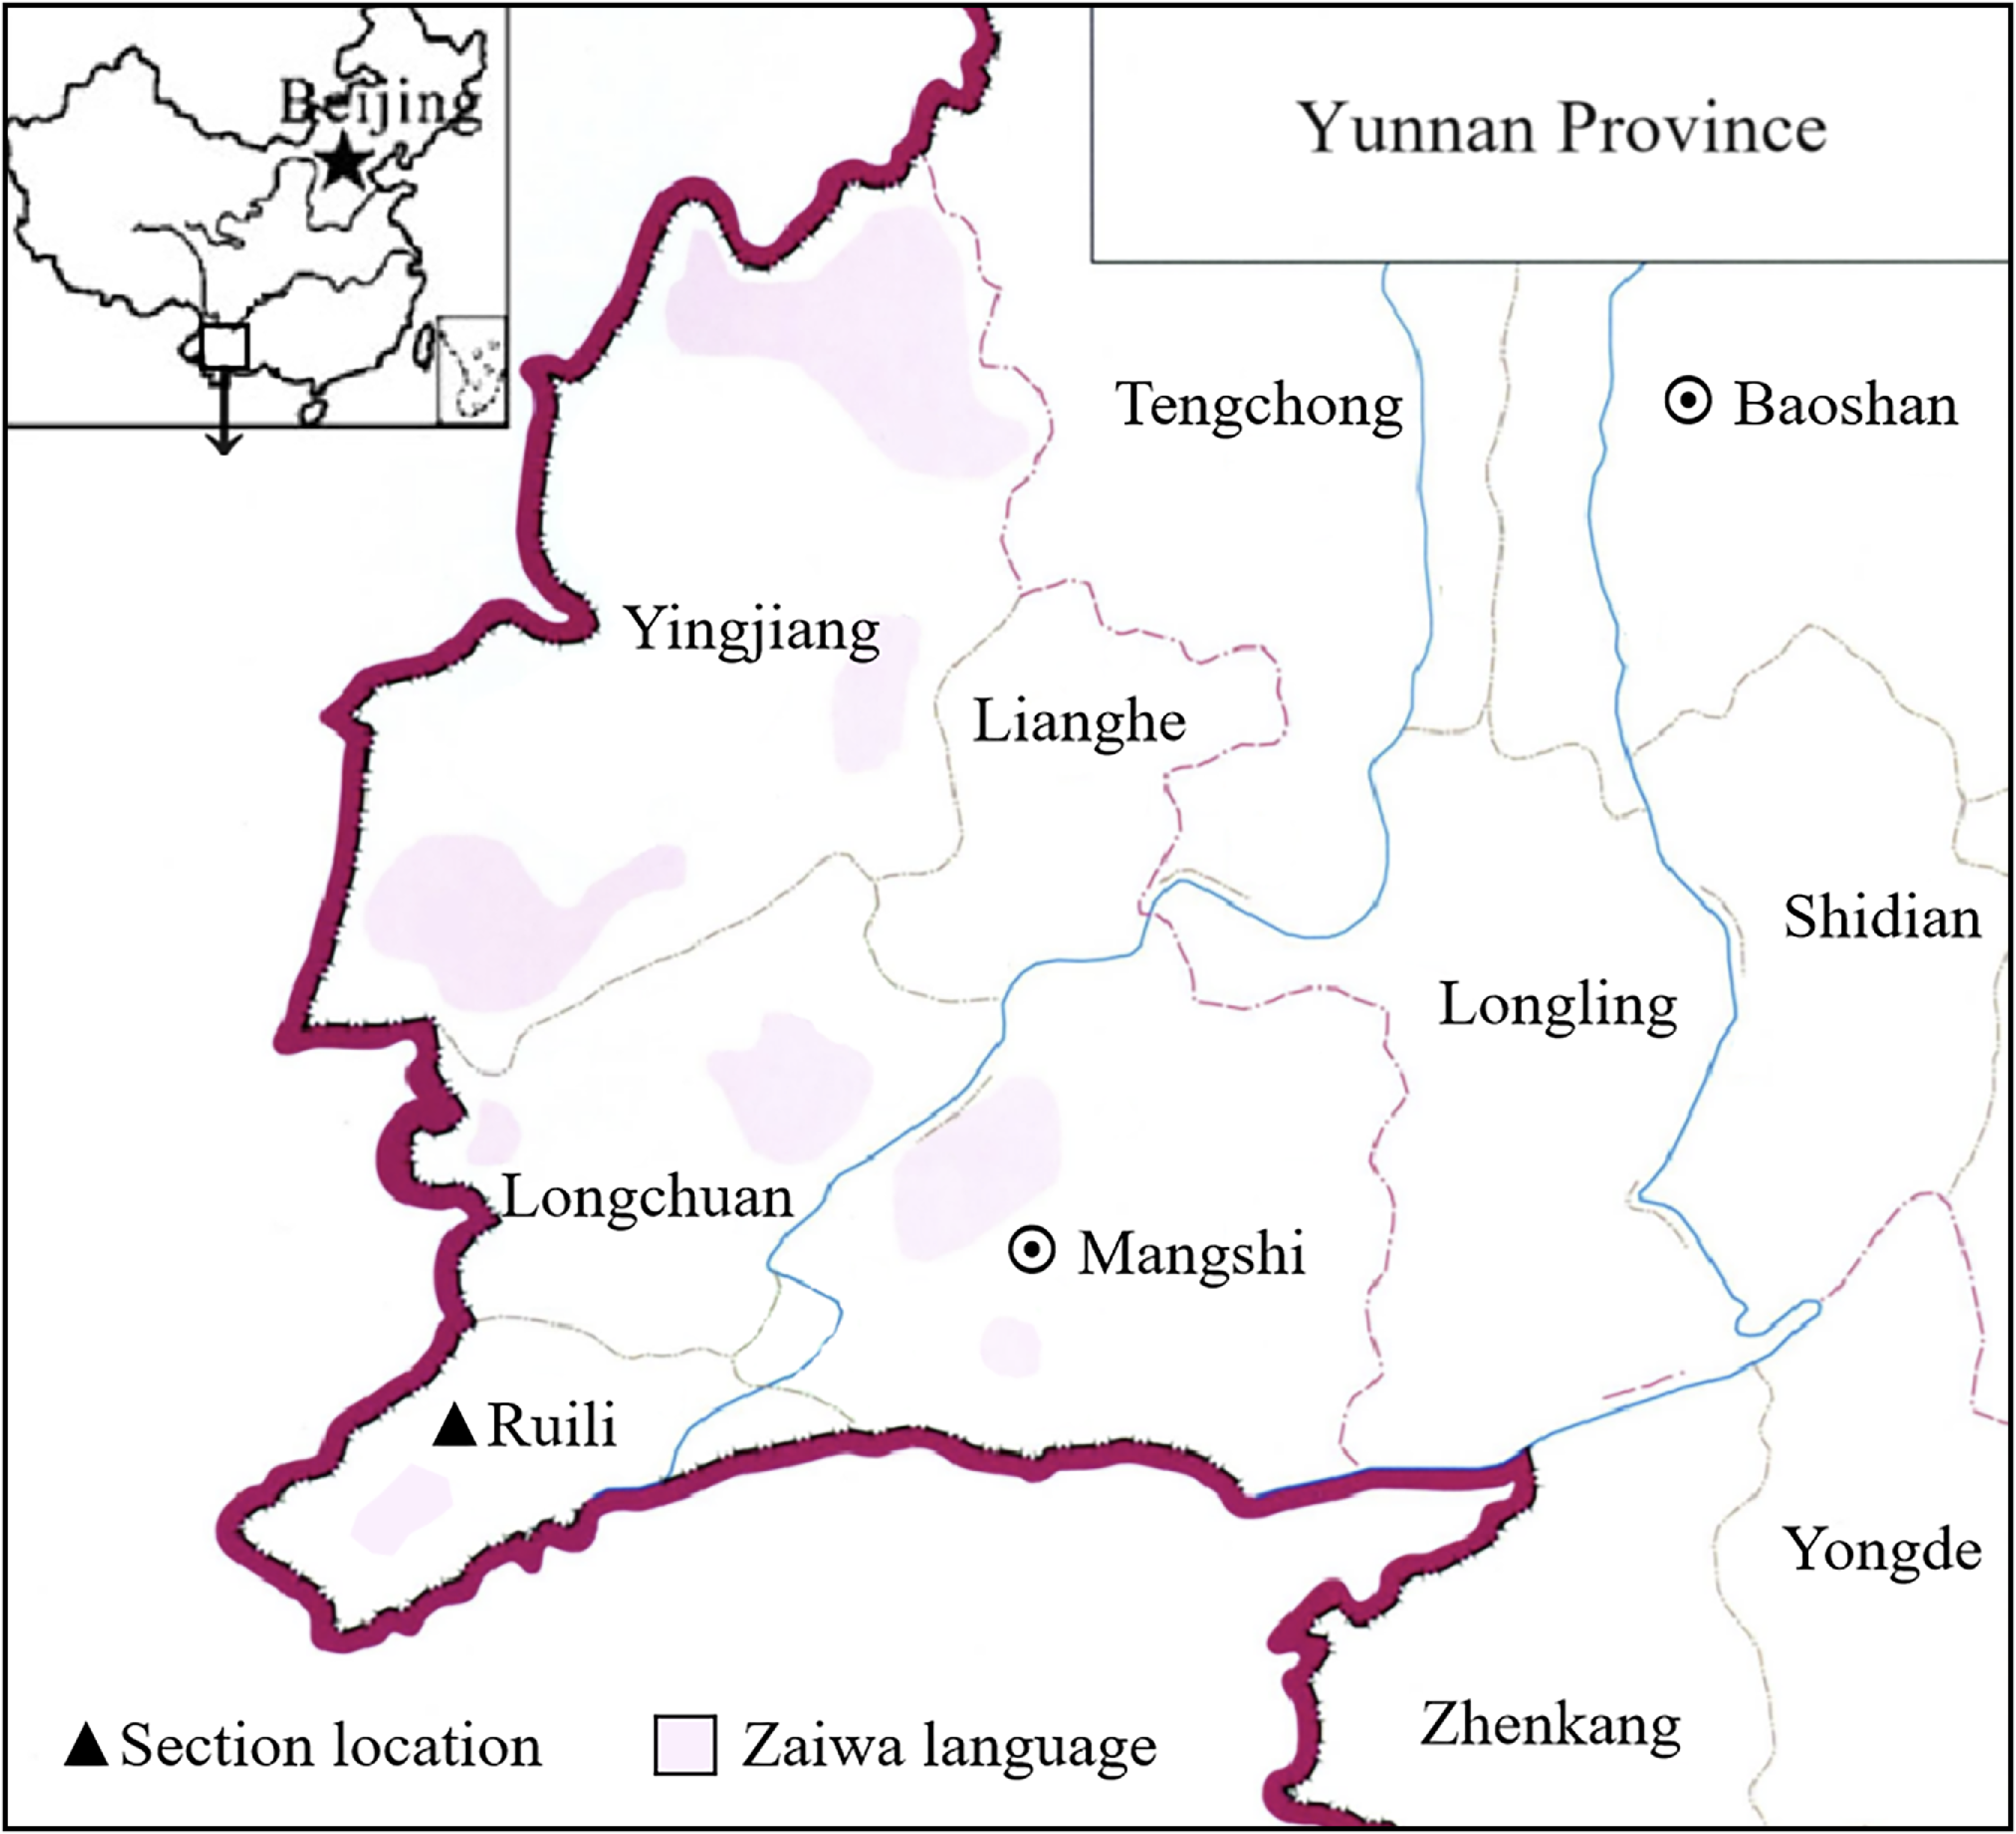
Figure 1 Long description
The map of Yunnan Province in China shows the distribution of the Zaiwa language, with areas shaded in pink. Key locations labeled on the map include Yingjiang, Lianghe, Longchuan, Ruili, Mangshi, Longling, Shidian, Zhenkang, Yongde, Tengchong, and Baoshan. The map is drawn from C1-24 of the Language Atlas of China, second edition. The inset in the top left corner shows the location of Yunnan Province within China, with Beijing marked for reference. The map also includes symbols indicating section locations and the extent of the Zaiwa language area.
Consonants
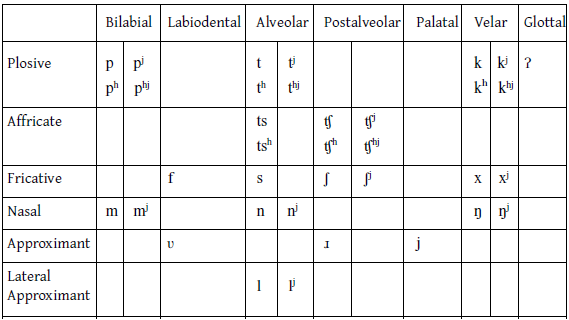
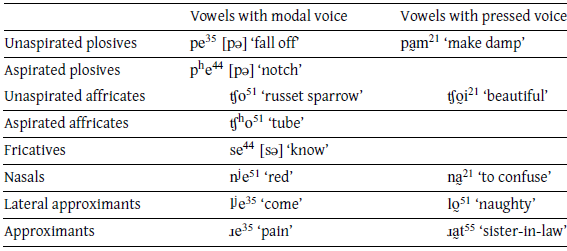
As shown in the table below, the consonants of Zaiwa comprise 36 phonemes, including 22 simple consonants and 14 palatalized consonants. There are only voiceless obstruents, no voiced obstruents, and no consonant clusters. Plosives and affricates contrast in terms of aspiration. Aspirated consonants and fricatives cannot be combined with vowels with pressed voice. The approximant 𰀯ʋ𰀯 has an allophone [w] that precedes the monophthong 𰀯a𰀯. Since the fricative 𰀯f𰀯 generally appears only in Chinese loanwords, such as 𰀯fa21min21𰀯 ‘invention’, examples will not be provided in the following text.
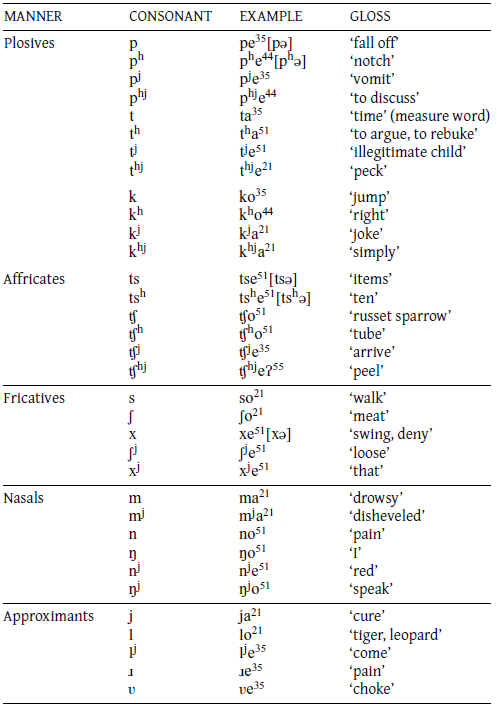
The following minimal and near-minimal pairs illustrate the contrasts summarized above:
Plosives
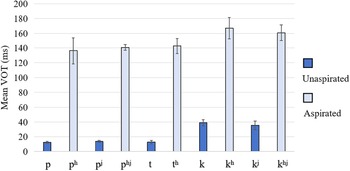
There are 13 plosives in Zaiwa, all voiceless, at bilabial, alveolar, and velar places of articulation. All plosives contrast in terms of aspiration. Voice Onset Time (VOT) for unaspirated voiceless stops is shorter than that for aspirated voiceless stops, with a value of almost zero. Figure 2 presents a spectrogram of 𰀯tha51𰀯 ‘to argue/rebuke’ and 𰀯ta35𰀯 ‘time’ (measure word), demonstrating the difference in the VOT between the two. When pronouncing 𰀯ta35𰀯, the stop release and vocal fold vibration occur almost simultaneously, resulting in a VOT that is almost 0; whereas the VOT for 𰀯tha51𰀯 is approximately 96 ms. As shown in Figure 3, the VOT of unaspirated plosives, that is, 𰀯p t k𰀯, is shorter with the release and voicing onset occurring within approximately 12 ms. By contrast, the VOT of aspirated plosives, that is, 𰀯ph th kh𰀯, ranges from 100–160 ms. In addition to appearing in onset position, the unaspirated plosives 𰀯p𰀯, 𰀯t𰀯, and 𰀯k𰀯 can also appear as stop codas followed by vowels and 𰀯ʔ𰀯 can only appear in coda position.
Waveforms and spectrograms for the minimal pairs 𰀯tha51𰀯 ‘argue, rebuke’ and 𰀯ta35𰀯 ‘time’ (measure).
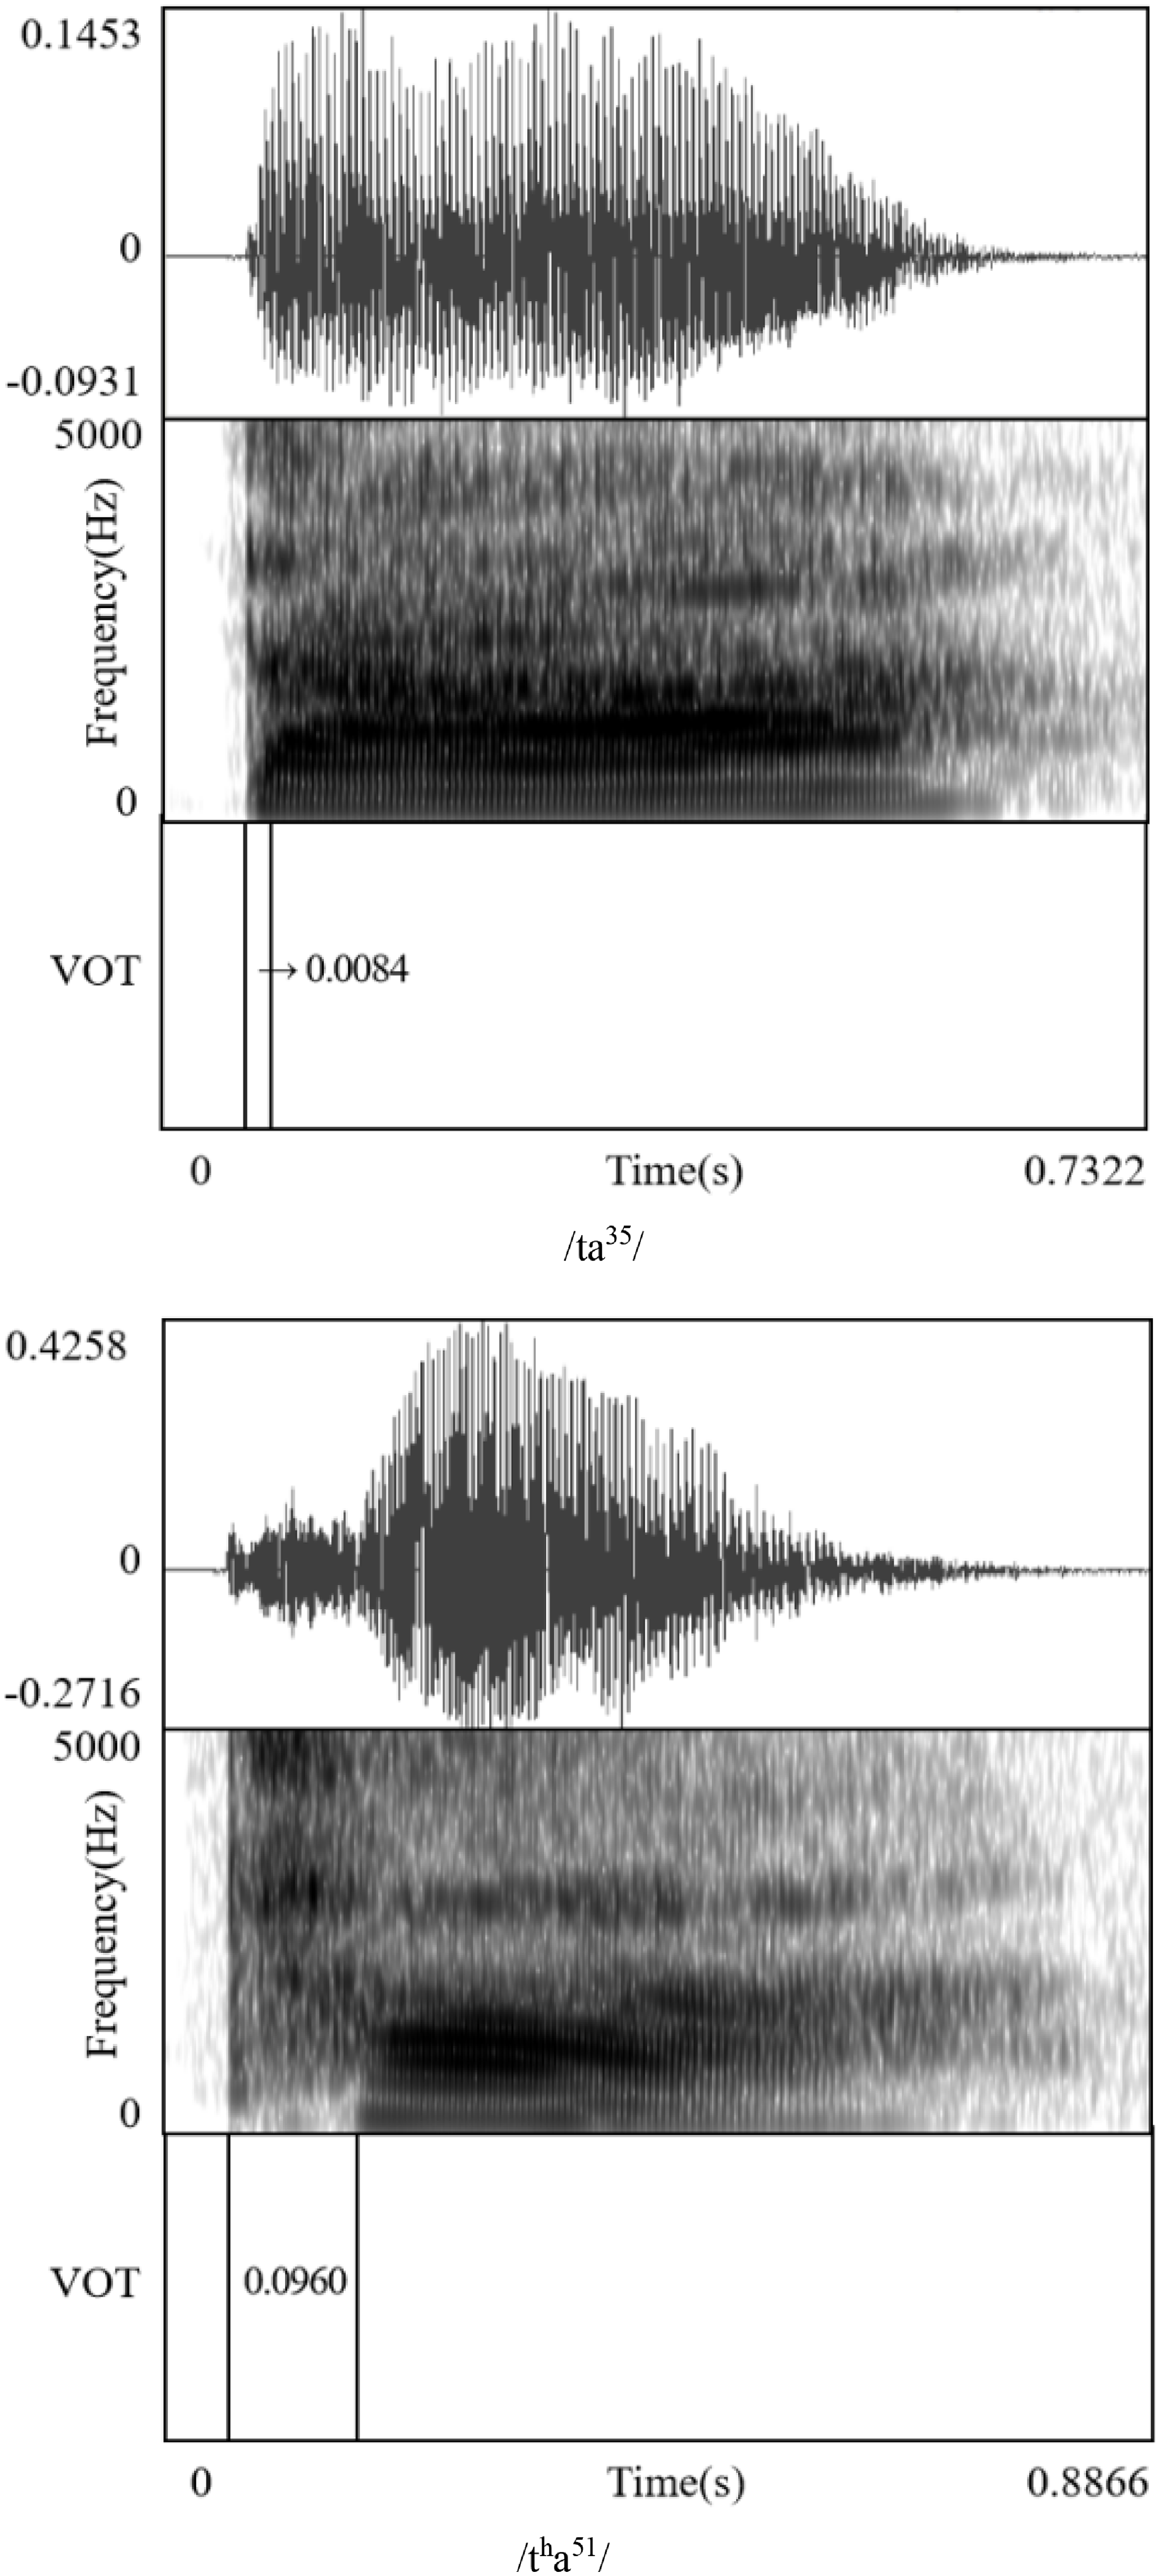
Figure 2 Long description
The image contains two sets of waveforms and spectrograms comparing voice onset times for Zaiwa plosives in minimal pairs. The top set shows the minimal pair tha51 argue, rebuke and the bottom set shows ta35 time measure. Each set includes a waveform plot at the top, a spectrogram in the middle, and a voice onset time (VOT) measurement at the bottom. The waveforms display the amplitude of the sound over time, with the y-axis representing amplitude and the x-axis representing time in seconds. The spectrograms show the frequency content of the sound over time, with the y-axis representing frequency in hertz and the x-axis representing time in seconds. The VOT measurements indicate the time delay between the release of the plosive and the onset of voicing. The top set shows a VOT of 0.0084 seconds for the unaspirated voiceless stop, while the bottom set shows a VOT of 0.0960 seconds for the aspirated voiceless stop. The waveforms and spectrograms illustrate the differences in aspiration between the plosives, with the unaspirated stops having a shorter VOT and the aspirated stops having a longer VOT. All values are approximated.
VOT of plosives in Zaiwa, where unaspirated and aspirated plosives are indicated by distinct colors. The mean and standard deviations were calculated using five tokens of each plosive from a single speaker.
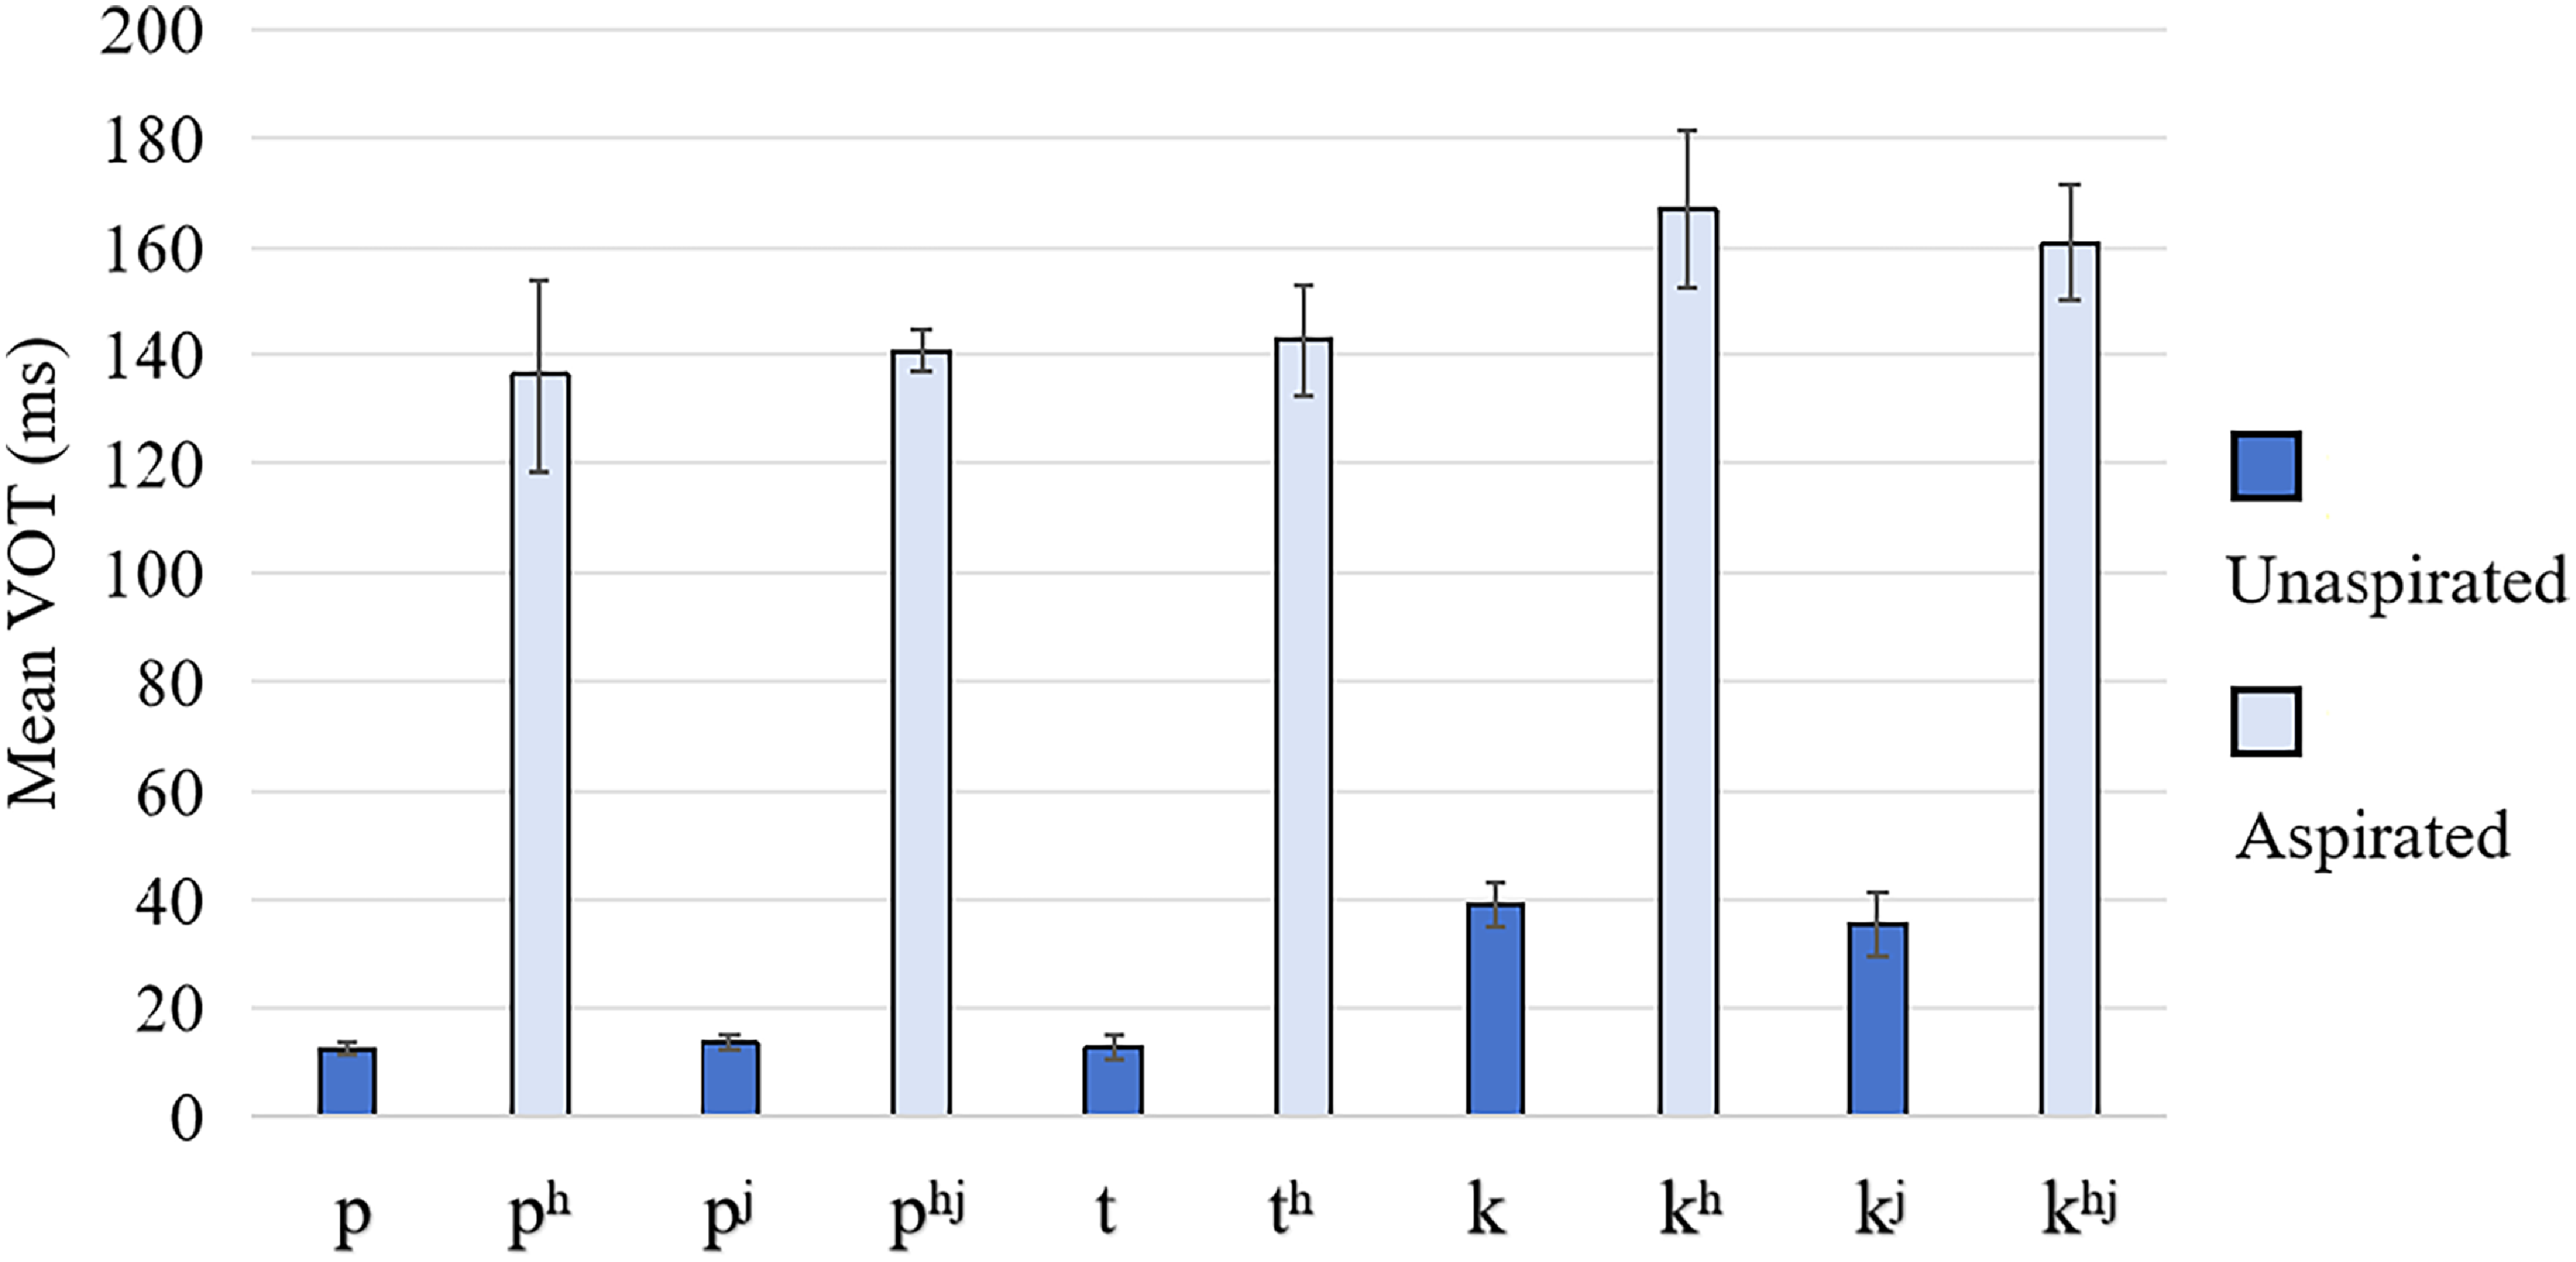
Figure 3 Long description
The bar graph compares mean voice onset time (VOT) in milliseconds for unaspirated and aspirated plosives in Zaiwa. The x-axis lists different plosives, including p, p^h, p^j, p^hj, t, t^h, k, k^h, k^j, and k^hj. The y-axis measures mean VOT in milliseconds, ranging from 0 to 200. Unaspirated plosives are represented by blue bars, while aspirated plosives are represented by gray bars. Each bar shows the mean VOT value with error bars indicating standard deviations. The data is based on five tokens of each plosive from a single speaker. Notable trends include higher mean VOT values for aspirated plosives compared to unaspirated plosives across all categories. All values are approximated.
Affricates
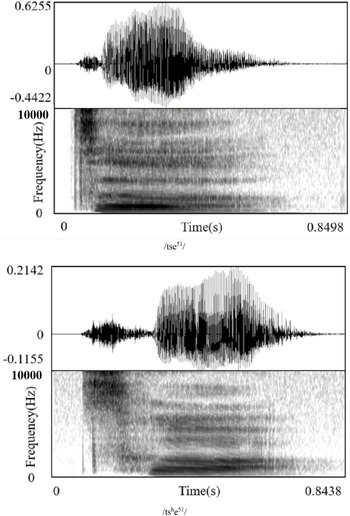
There are 11 affricates in Zaiwa. The spectrogram in Figure 4 shows that the aspirated affricate is acoustically comprised of stop release burst, frication and aspiration intervals whereas the unaspirated affricate has only release burst and frication intervals. As shown in Figure 5, the VOT of unaspirated affricates is much shorter than the aspirated affricates.
Waveforms and spectrograms for the minimal pairs 𰀯tse51𰀯 ‘items’ and 𰀯tsʰe51𰀯 ‘ten’.
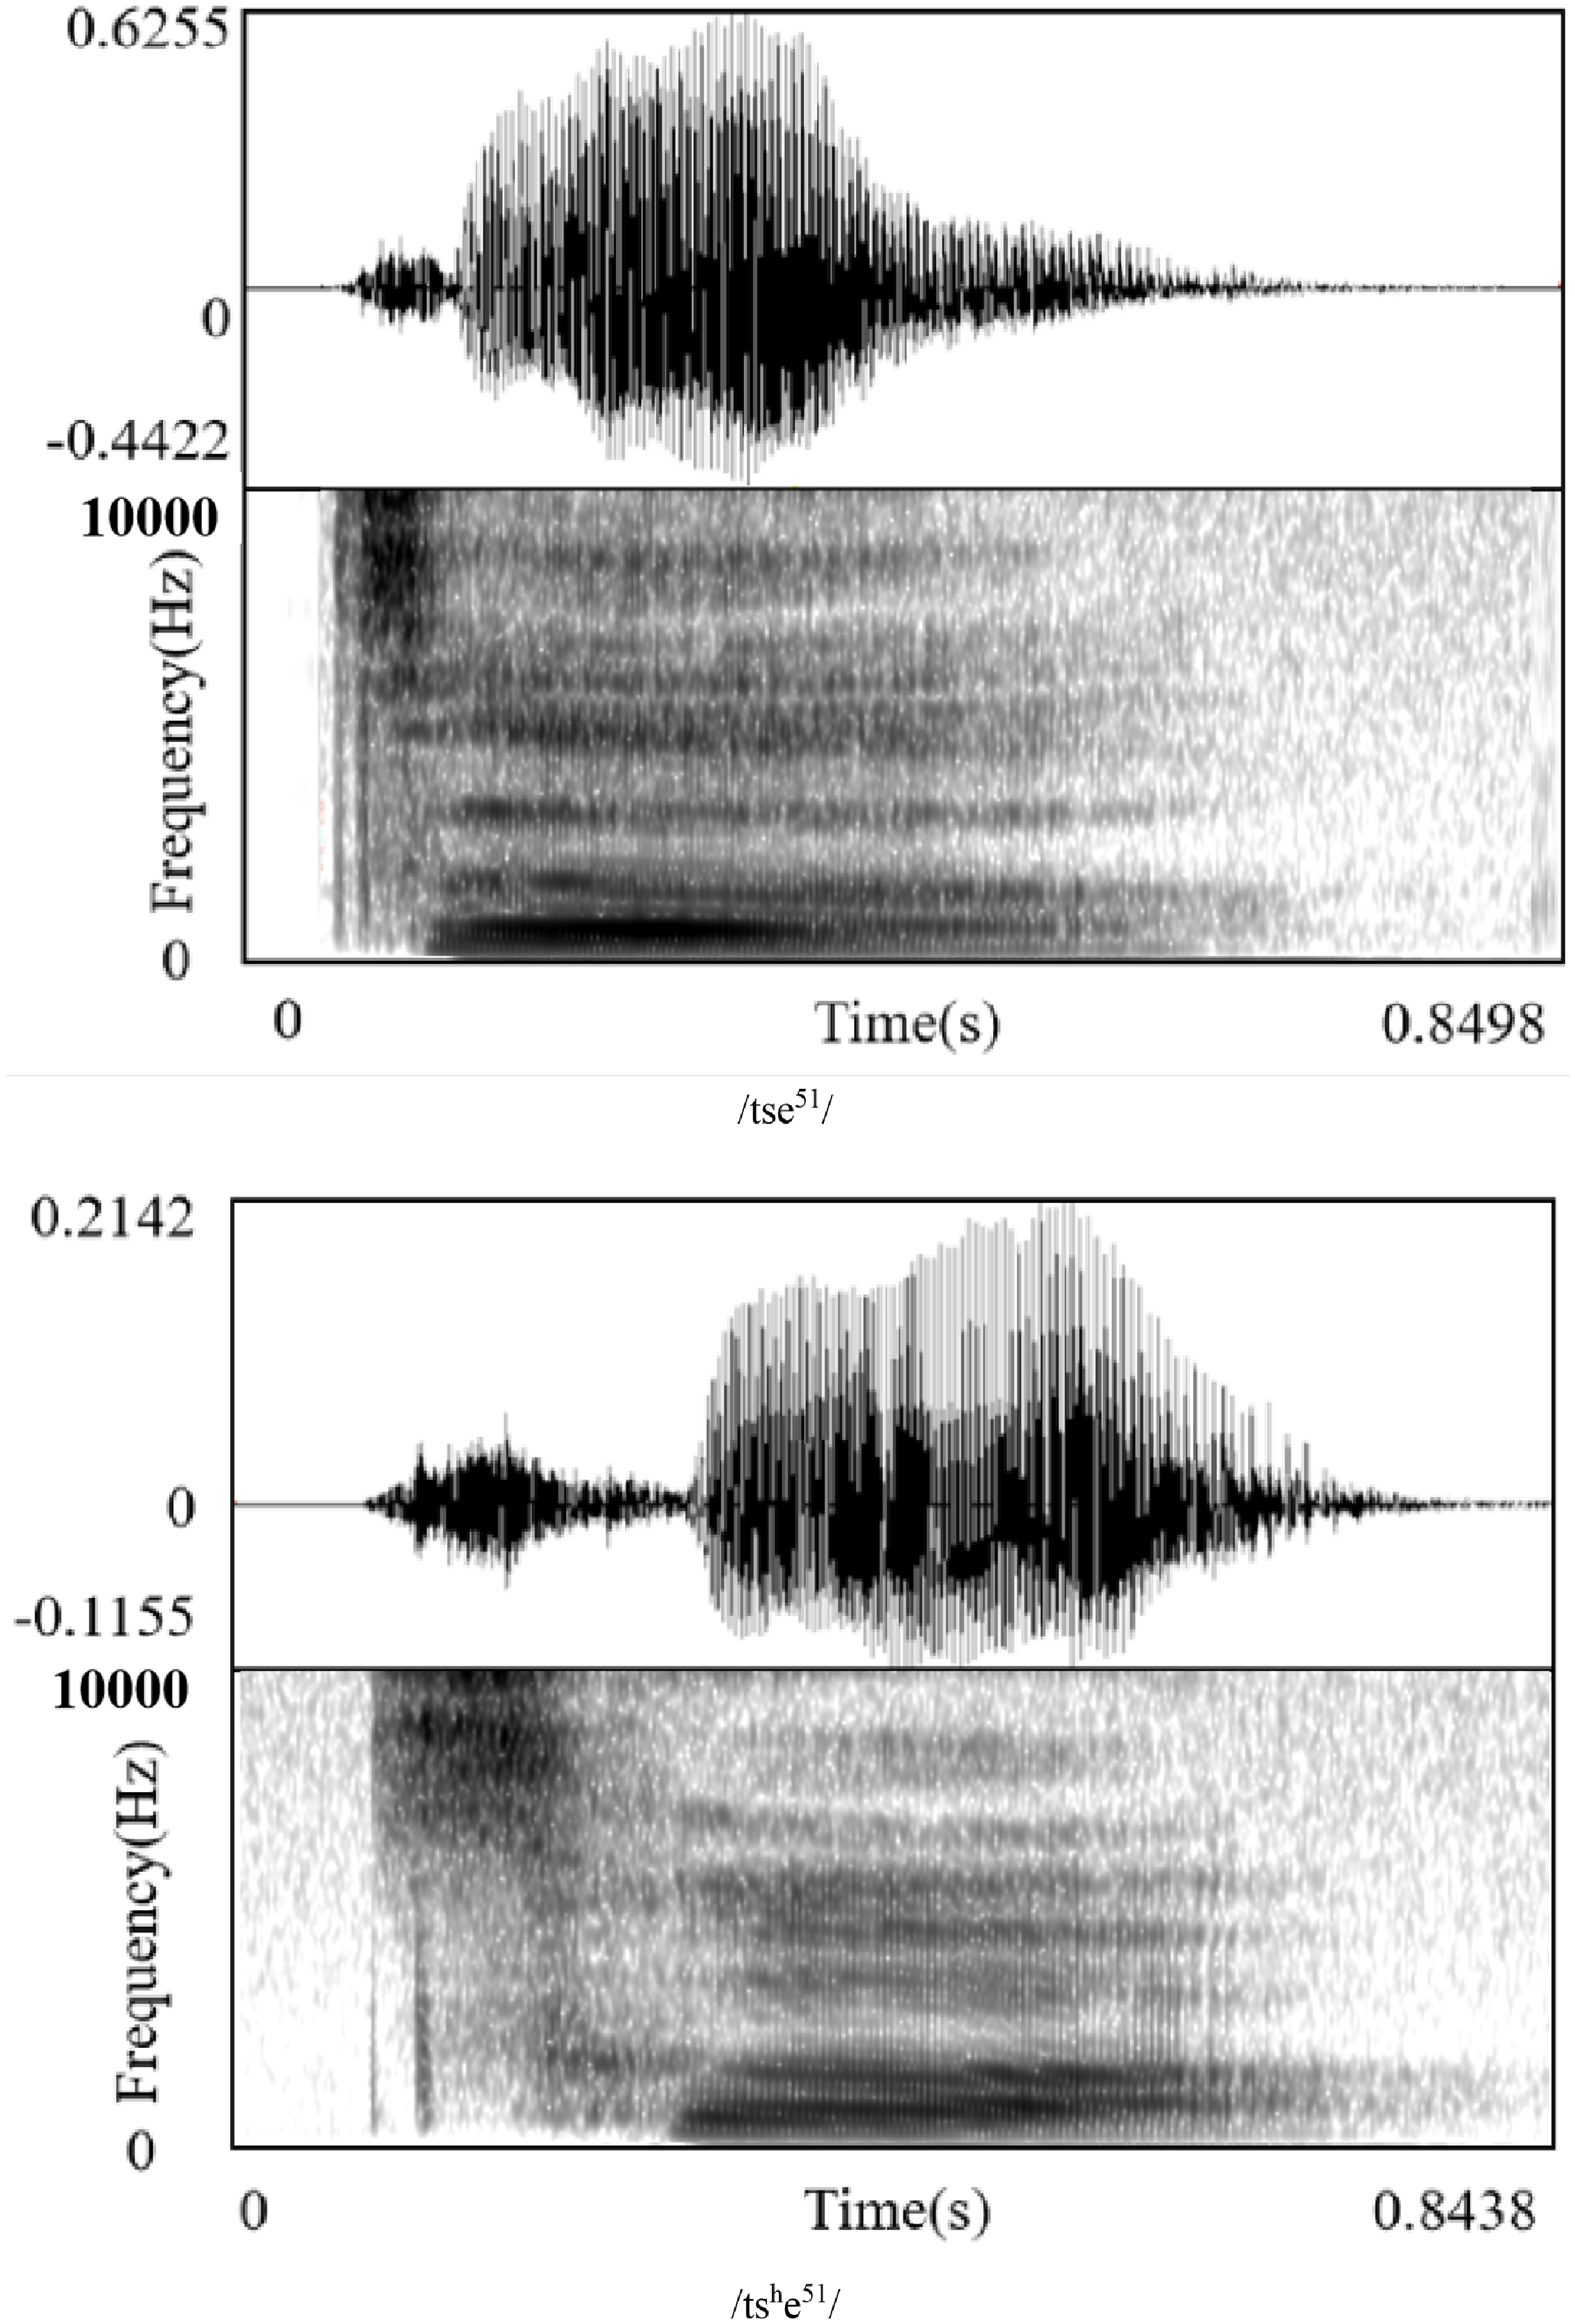
Figure 4 Long description
The image contains two spectrograms, each showing waveforms and frequency analysis for Zaiwa affricates. The top spectrogram represents the affricate tse51 items, while the bottom spectrogram represents tse51 ten. Each spectrogram consists of a waveform plot at the top and a corresponding frequency plot below it. The x-axis of both spectrograms represents time in seconds, ranging from 0 to approximately 0.85 seconds. The y-axis of the waveform plots ranges from -0.4422 to 0.6255 for the top spectrogram and from -0.1155 to 0.2142 for the bottom spectrogram. The y-axis of the frequency plots ranges from 0 to 10000 hertz. The waveforms show the amplitude of the sound over time, while the frequency plots display the spectral content of the sound. The spectrograms illustrate the differences in the acoustic properties of the affricates tse51 items and tse51 ten in the Zaiwa language. All values are approximated.
VOT of affricates in Zaiwa, where unaspirated and aspirated affricates are indicated by distinct colors. The mean and standard deviations were calculated using five tokens of each affricate from a single speaker.

Figure 5 Long description
The bar graph compares mean voice onset time (VOT) in milliseconds for unaspirated and aspirated affricates in Zaiwa. The x-axis lists affricate types: ts, tsh, tɕ, tɕh, tɕj, and tɕhj. The y-axis measures VOT from 0 to 180 milliseconds. Unaspirated affricates are represented by blue bars, while aspirated affricates are shown with gray bars. The graph indicates that aspirated affricates have significantly higher VOT values compared to unaspirated ones. Each bar represents the mean VOT calculated from five tokens of each affricate from a single speaker, with error bars indicating standard deviations. The aspirated affricates tsh, tɕh, and tɕhj show notably higher VOT values around 140 to 160 milliseconds, whereas the unaspirated affricates ts, tɕ, and tɕj have much lower VOT values around 0 to 20 milliseconds. All values are approximated.
Fricatives
Five fricatives are produced at three articulation locations: alveolar, postalveolar, and velar. Fast Fourier Transform (FFT) spectra (made with a 23-ms window centered on the peak of noise intensity) of five fricative samples of Zaiwa are provided in Figure 6. The energy distributions of the five fricatives are different. 𰀯s𰀯 has energy mainly concentrated between 8,000–12,000 Hz. The energy of 𰀯ʃ𰀯 is primarily between 4,000–6,000 Hz, and that of 𰀯x𰀯 is between 2,000–4,000 Hz. The energy of 𰀯ʃj𰀯 is primarily around 6,000 Hz and 𰀯xj𰀯 is primarily around 4,000 Hz. Additionally, the peak frequency and center of gravity of palatalized fricatives’ spectra are comparatively higher than those of their non-palatalized counterparts.
FFT (Fast Fourier Transform, blue) and logarithmic (red) spectra (Linear Predictive Coding, red) spectrum (made with a 23-ms window centered on the peak of noise intensity) of the frication in 𰀯sa51𰀯 ‘hand basket’, 𰀯ʃai51𰀯 ‘naughty’, 𰀯ʃje51𰀯 ‘loose’, 𰀯xe51𰀯 ’swing, deny’, and 𰀯xje51𰀯 ‘that’.
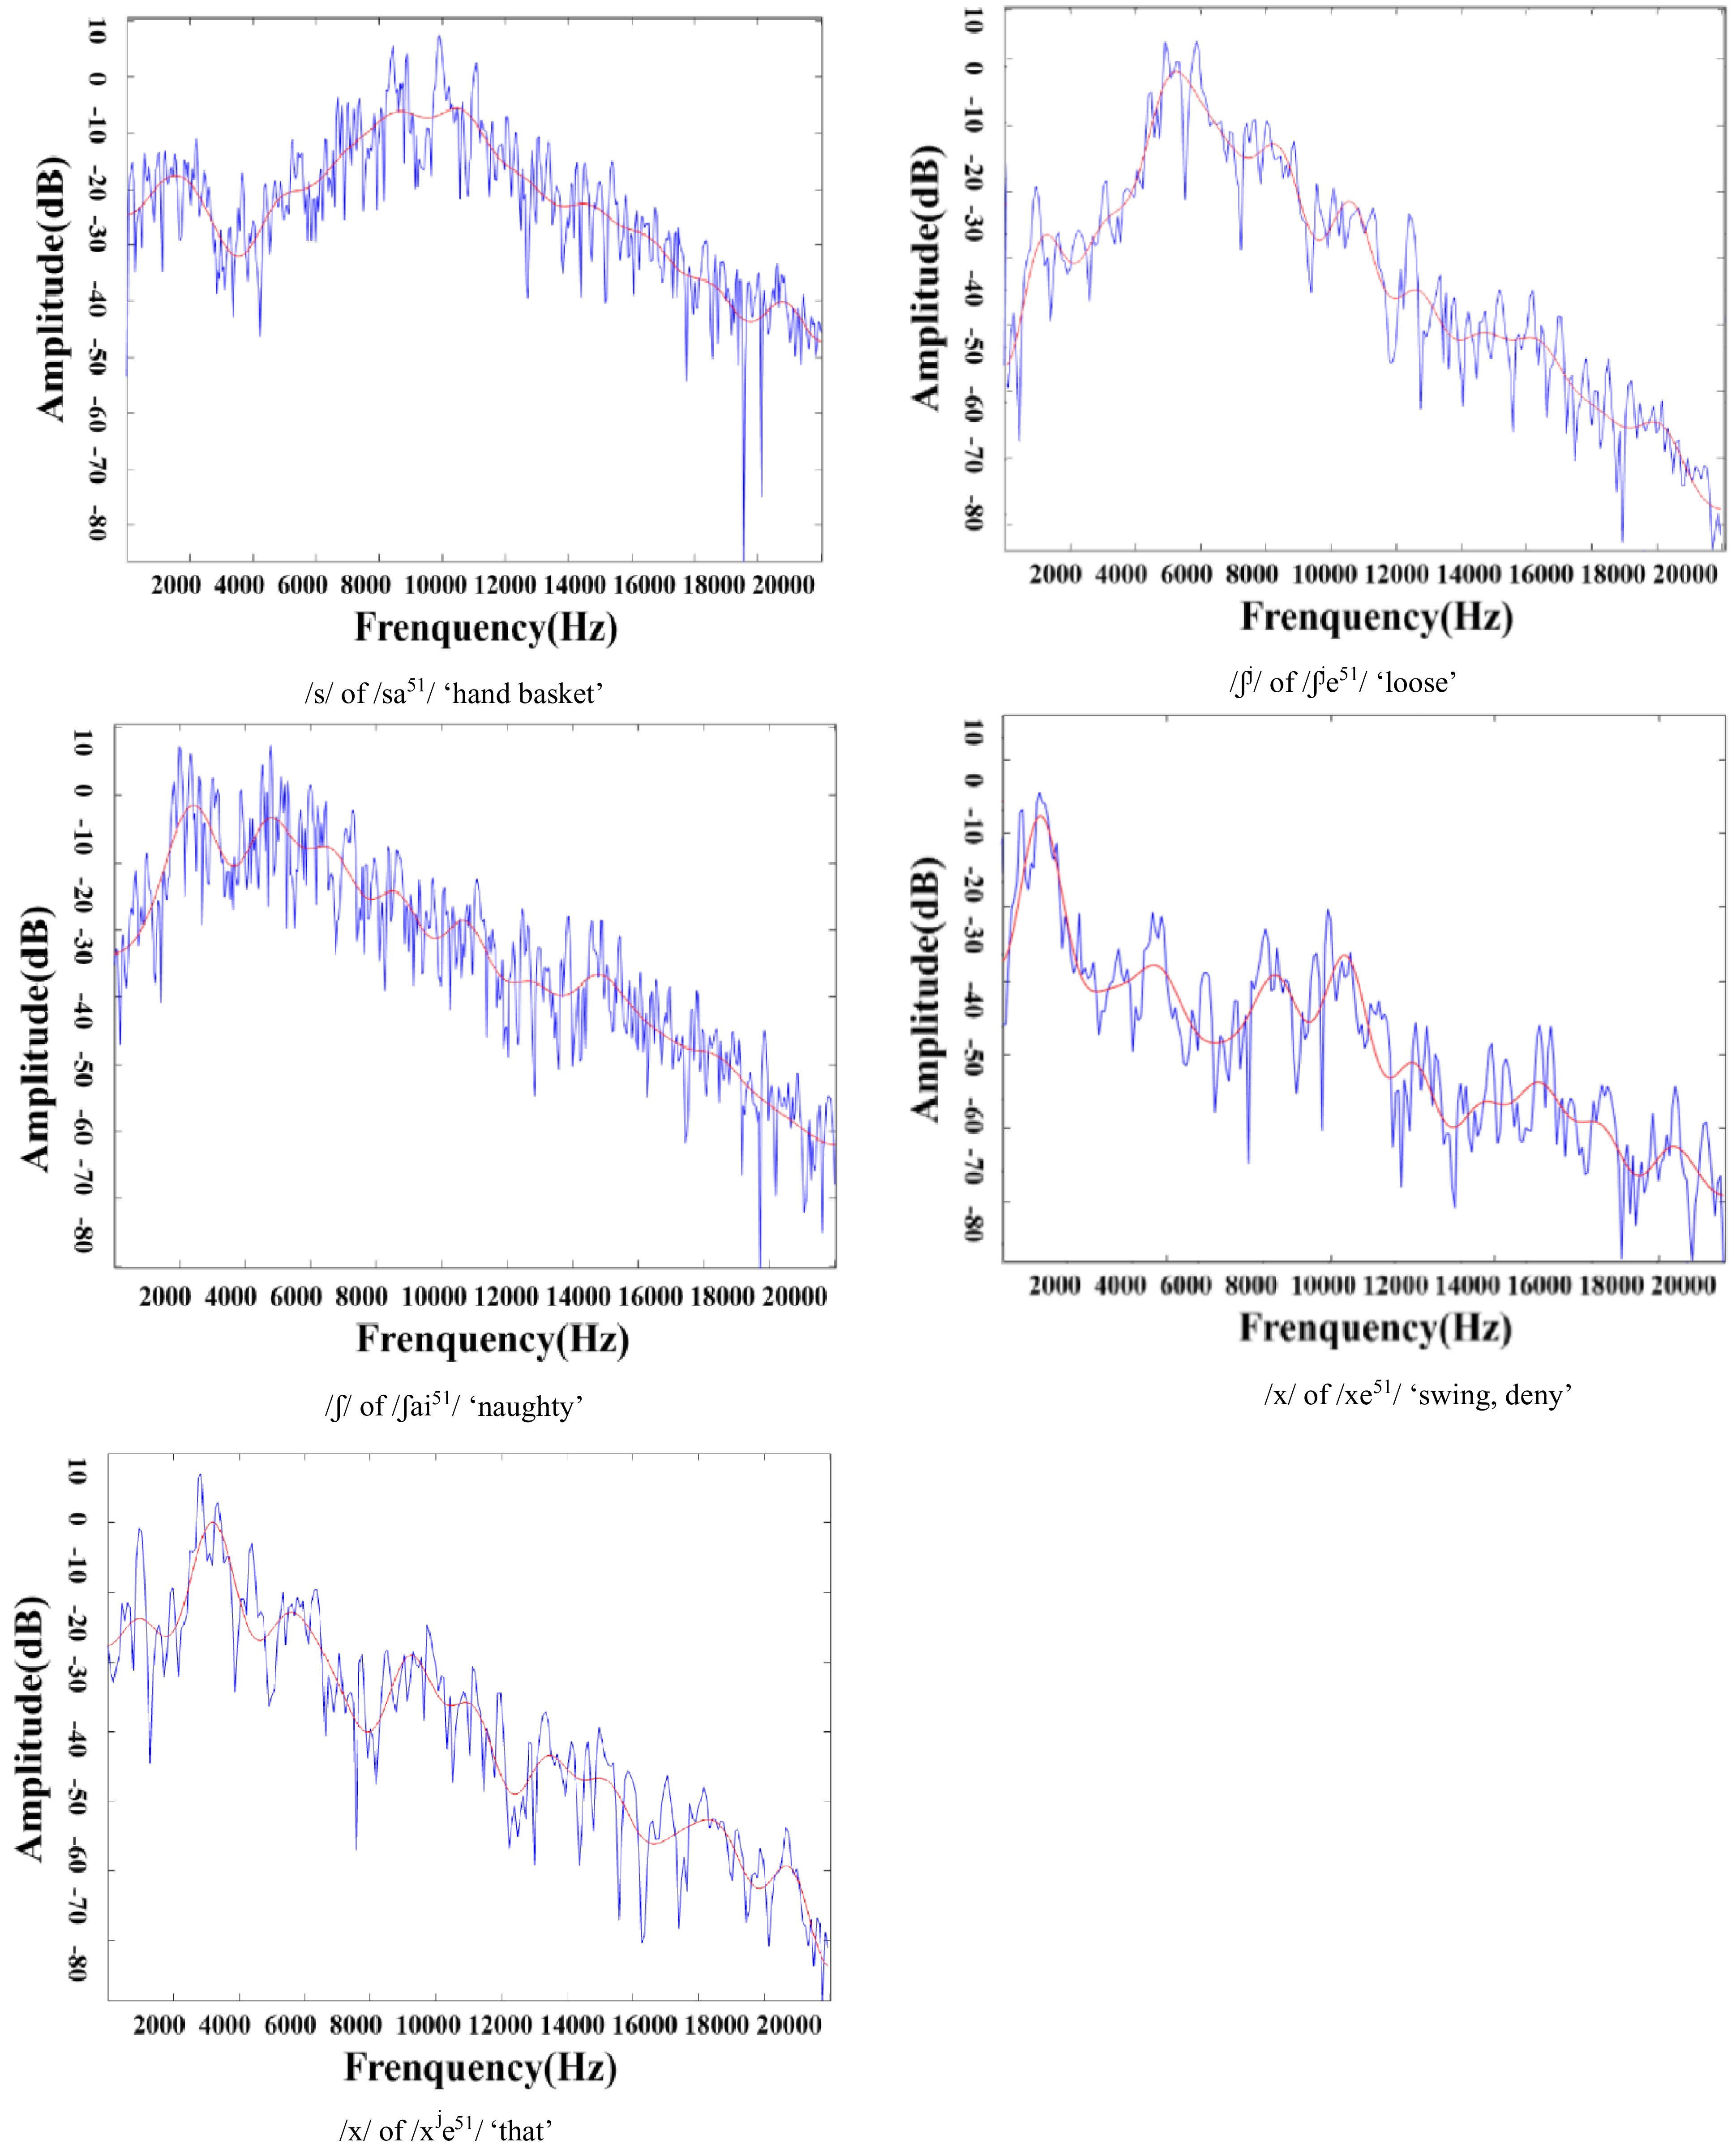
Figure 6 Long description
The image contains five line graphs displaying FFT (Fast Fourier Transform, blue) and logarithmic (red) spectra of fricatives in the Zaiwa language. Each graph represents the spectra of different fricative sounds: sa51 hand basket, ai51 naughty, je51 loose, xe51 swing deny, and xje51 that. The x-axis of each graph represents frequency in Hertz (Hz), ranging from 2000 to 20000 Hz, while the y-axis represents amplitude in decibels (dB), ranging from -90 to 10 dB. The FFT spectra are shown in blue, and the logarithmic spectra are shown in red. Each graph illustrates the amplitude variations across different frequencies for the respective fricative sounds. The spectra are made with a 23-millisecond window centered on the peak of noise intensity. The graphs show distinct patterns and peaks for each fricative sound, highlighting the differences in their spectral characteristics. All values are approximated.
Nasals
The six nasals of Zaiwa include bilabial (𰀯m𰀯, 𰀯mj𰀯), alveolar (𰀯n𰀯, 𰀯nj𰀯), and velar (𰀯ŋ𰀯, 𰀯ŋj𰀯). 𰀯m n ŋ𰀯 can occur both in the onset and coda position, while palatalized 𰀯mj nj ŋj𰀯 occur only in the onset position. Syllabic nasals also occur in certain words, for example, 𰀯m̩51𰀯 for ‘mm-hmm’.
Lateral approximants and approximants
There are two lateral approximants, 𰀯l lʲ𰀯, and three central approximants, 𰀯ʋ𰀯, 𰀯ɹ𰀯, 𰀯j𰀯 in Zaiwa. They are produced at three articulation locations: labiodental, alveolar, and palatal. Scholars (Xu & Xu, 1984) have described 𰀯ʋ𰀯 and 𰀯ɹ𰀯 as the voiced counterparts to the voiceless consonants 𰀯f𰀯 and 𰀯ʃ𰀯, respectively, labeling them as the voiced phonemes 𰀯v𰀯 and 𰀯ʒ𰀯. Subsequent studies, utilizing empirical analyses and comparative studies, have posited that the phonemes 𰀯ʋ𰀯 and 𰀯ɹ𰀯 in Zaiwa exhibit characteristics more akin to those of approximants (Pan, 2014). We posit the latter due to their phonetic characteristics. In our study, we also found that 𰀯ʋ𰀯 and 𰀯ɹ𰀯 are excited mainly by voicing, with only slight frication, as shown in Figure 7. Furthermore, we identified [w] as an allophone of 𰀯ʋ𰀯. Hence, treating 𰀯ʋ𰀯 as an approximant aligns more closely with the data observed. If 𰀯ʋ𰀯 and 𰀯ɹ𰀯 are treated as approximants, this can explain both the phonological configuration and the phonological evolution, and it also aligns more closely to the actual pronunciation.
Waveforms and spectrograms for 𰀯ʋa21𰀯 [wa] ‘bamboo’ and 𰀯ɹa21𰀯 ‘need’.
![Two graphs display waveforms and spectrograms for a21 [wa] bamboo and a21 need.](https://static.cambridge.org/binary/version/id/urn:cambridge.org:id:binary:20260616051928663-0884:S002510032510073X:S002510032510073X_fig7.png?pub-status=live)
Figure 7 Long description
The image contains two sets of graphs, each consisting of a waveform and a spectrogram. The top set represents the phoneme a21 [wa] for the word bamboo, while the bottom set represents the phoneme a21 for the word need. Each waveform shows the amplitude of the sound over time, with the y-axis ranging from negative to positive values. The spectrograms display the frequency content of the sound over time, with the y-axis representing frequency in hertz and the x-axis representing time in seconds. The waveforms and spectrograms illustrate the phonetic characteristics of the approximants in Zaiwa, highlighting the slight frication and voicing excitation.
Palatalized consonants
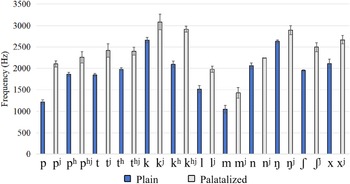
In Zaiwa, the bilabial plosive, alveolar plosive, velar plosive, postalveolar fricatives, velar fricatives, nasals, and lateral approximant each have their palatalized counterpart, namely, 𰀯pj𰀯, 𰀯phj𰀯, 𰀯tj𰀯, 𰀯thj𰀯, 𰀯ʧj𰀯, 𰀯ʧhj𰀯, 𰀯ʃj𰀯, 𰀯kj𰀯, 𰀯khj𰀯, 𰀯xj𰀯, 𰀯mj𰀯, 𰀯nj𰀯, 𰀯ŋj𰀯, and 𰀯lj𰀯. According to the spectrogram for plain 𰀯p𰀯 in Figure 8(a), F1 remains stable at approximately 1,000 Hz, whereas F2 starts at 1,150 Hz and slowly rises to 1,350 Hz, and then remains stable. As can be seen in the spectrogram for palatalized 𰀯p𰀯 in Figure 8(b), F1 starts at 400 Hz, gradually rises to 1,000 Hz, and remains stable, whereas F2 increases 3,000 Hz to 2,300 Hz and then remains steady. The dynamic trajectories of F1 and F2 are similar to the process from the high front vowel to the low central vowel. As shown in Figure 9, we statistically analyzed the mean F2 onset of the plain consonants and corresponding palatalized consonants. The F2 onsets of palatalized consonants were significantly higher than those of plain consonants.
Vowels
Monophthongs
Waveforms and spectrograms for the minimal pairs 𰀯pa51𰀯 ‘silly’ versus 𰀯pja51𰀯 ‘perform’. The red dotted lines represent the formants.
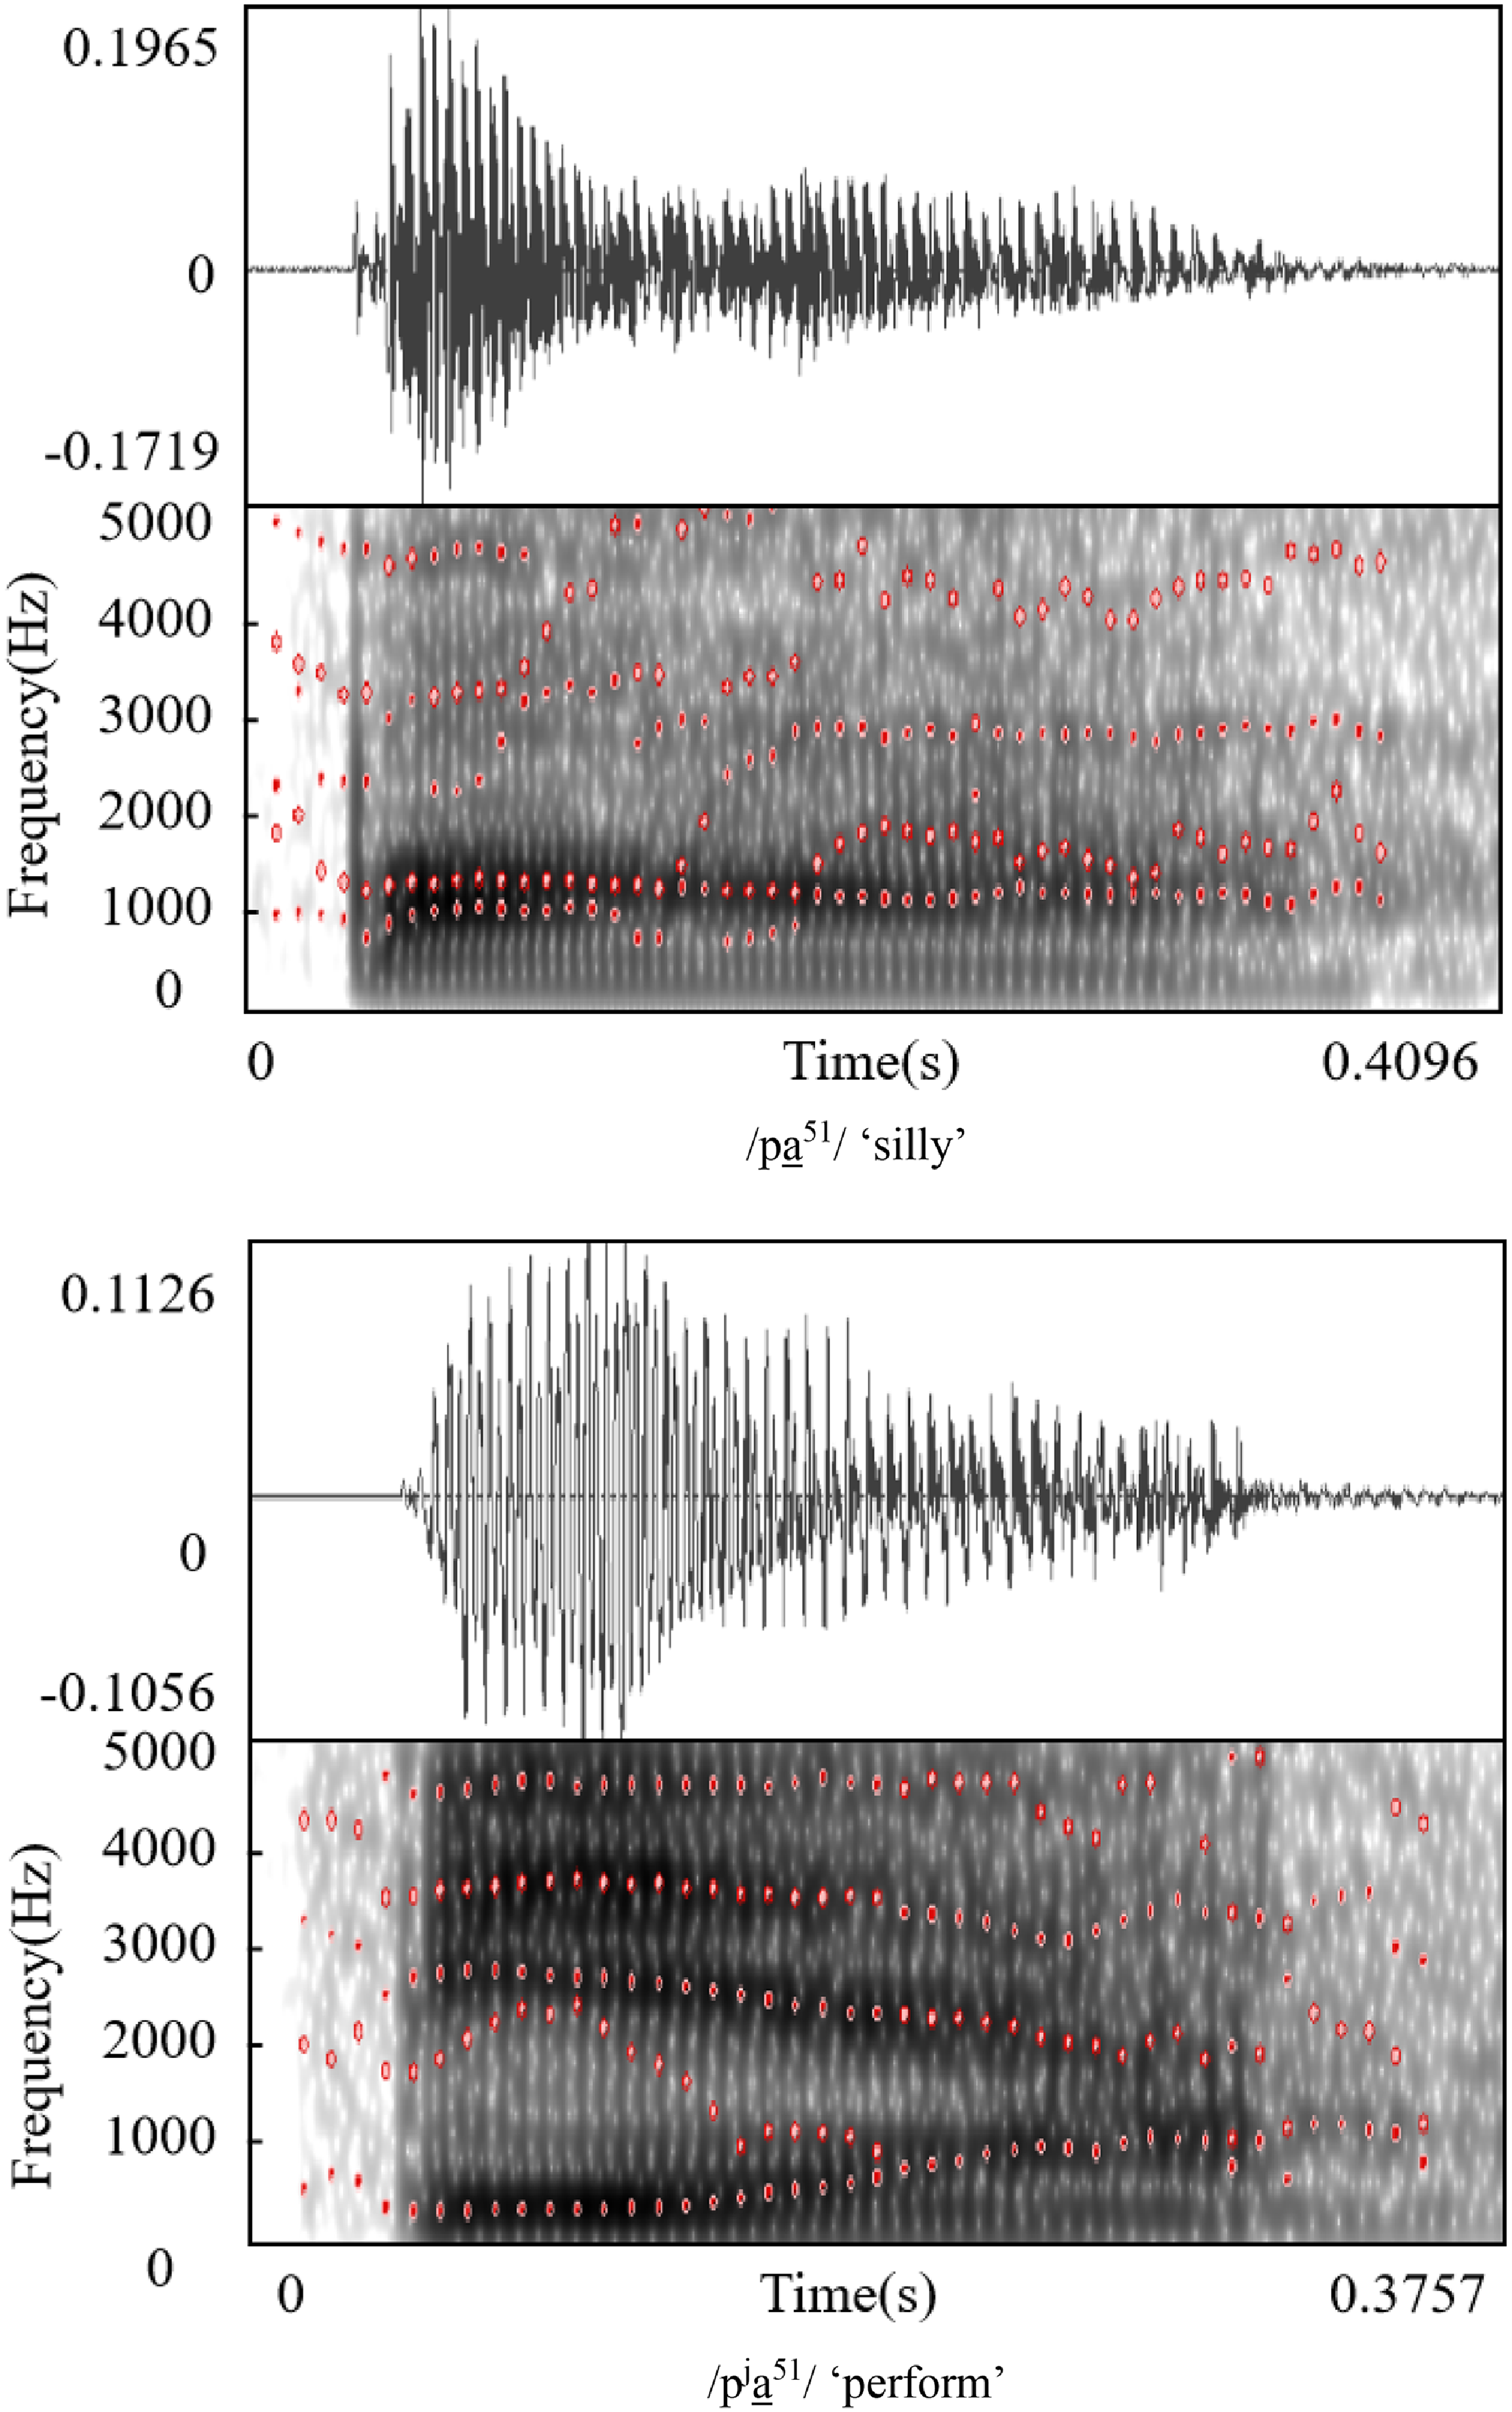
Figure 8 Long description
The image contains two sets of graphs, each consisting of a waveform and a spectrogram. The top set represents the minimal pair pa51 silly, while the bottom set represents pja51 perform. Each waveform shows the amplitude of the sound over time, with the y-axis ranging from approximately -0.1719 to 0.1965 for the top waveform and -0.1056 to 0.1126 for the bottom waveform. The spectrograms display the frequency content of the sound over time, with the y-axis representing frequency in Hertz, ranging from 0 to 5000 Hz. Red dotted lines on the spectrograms indicate the formants, which are the resonant frequencies of the vocal tract. The time axis for both sets of graphs ranges from 0 to approximately 0.4096 seconds for the top set and 0 to 0.3757 seconds for the bottom set. The waveforms show the amplitude variations, while the spectrograms reveal the frequency components and their changes over time. The red dotted lines help identify the formants, which are crucial for distinguishing between the sounds in the minimal pairs.
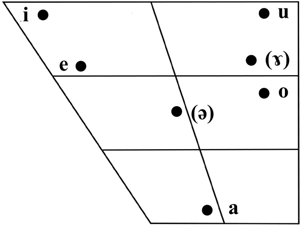
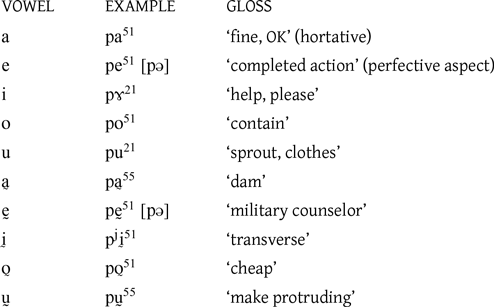
Zaiwa has five vowel phonemes: 𰀯i e a o u𰀯, further differentiated according to phonation (modal versus pressed voice), forming 10 monophthong vowels. Vowels 𰀯i ḭ𰀯 are high front vowels, 𰀯e ḛ𰀯 are mid-high front vowels, 𰀯a a̰𰀯 are central low vowels, 𰀯o o̰𰀯 are mid-low back vowels, and 𰀯u ṵ𰀯 are high back vowels. All 10 vowels can occur in closed syllables with nasal codas 𰀯m n ŋ𰀯 and stop codas 𰀯p t k ʔ𰀯. The vowel chart was plotted based on the relative F1 and F2 values of the vowel phonemes in Zaiwa, as shown in Figure 10. We chose 10 syllables with different consonants for each vowel and then used the Praat software to extract the values of the stable segment of the formants. Vowel [ɤ] is an allophone of 𰀯i𰀯, 𰀯ḭ𰀯, and [ə] is an allophone of 𰀯e𰀯 and 𰀯ḛ𰀯. In the subsequent sections, we will provide a detailed introduction to the conditions under which these two variants occur.
The mean F2 onset after plain versus palatalized consonants. The mean and standard deviations were calculated using eight tokens of each consonant from the single speaker.
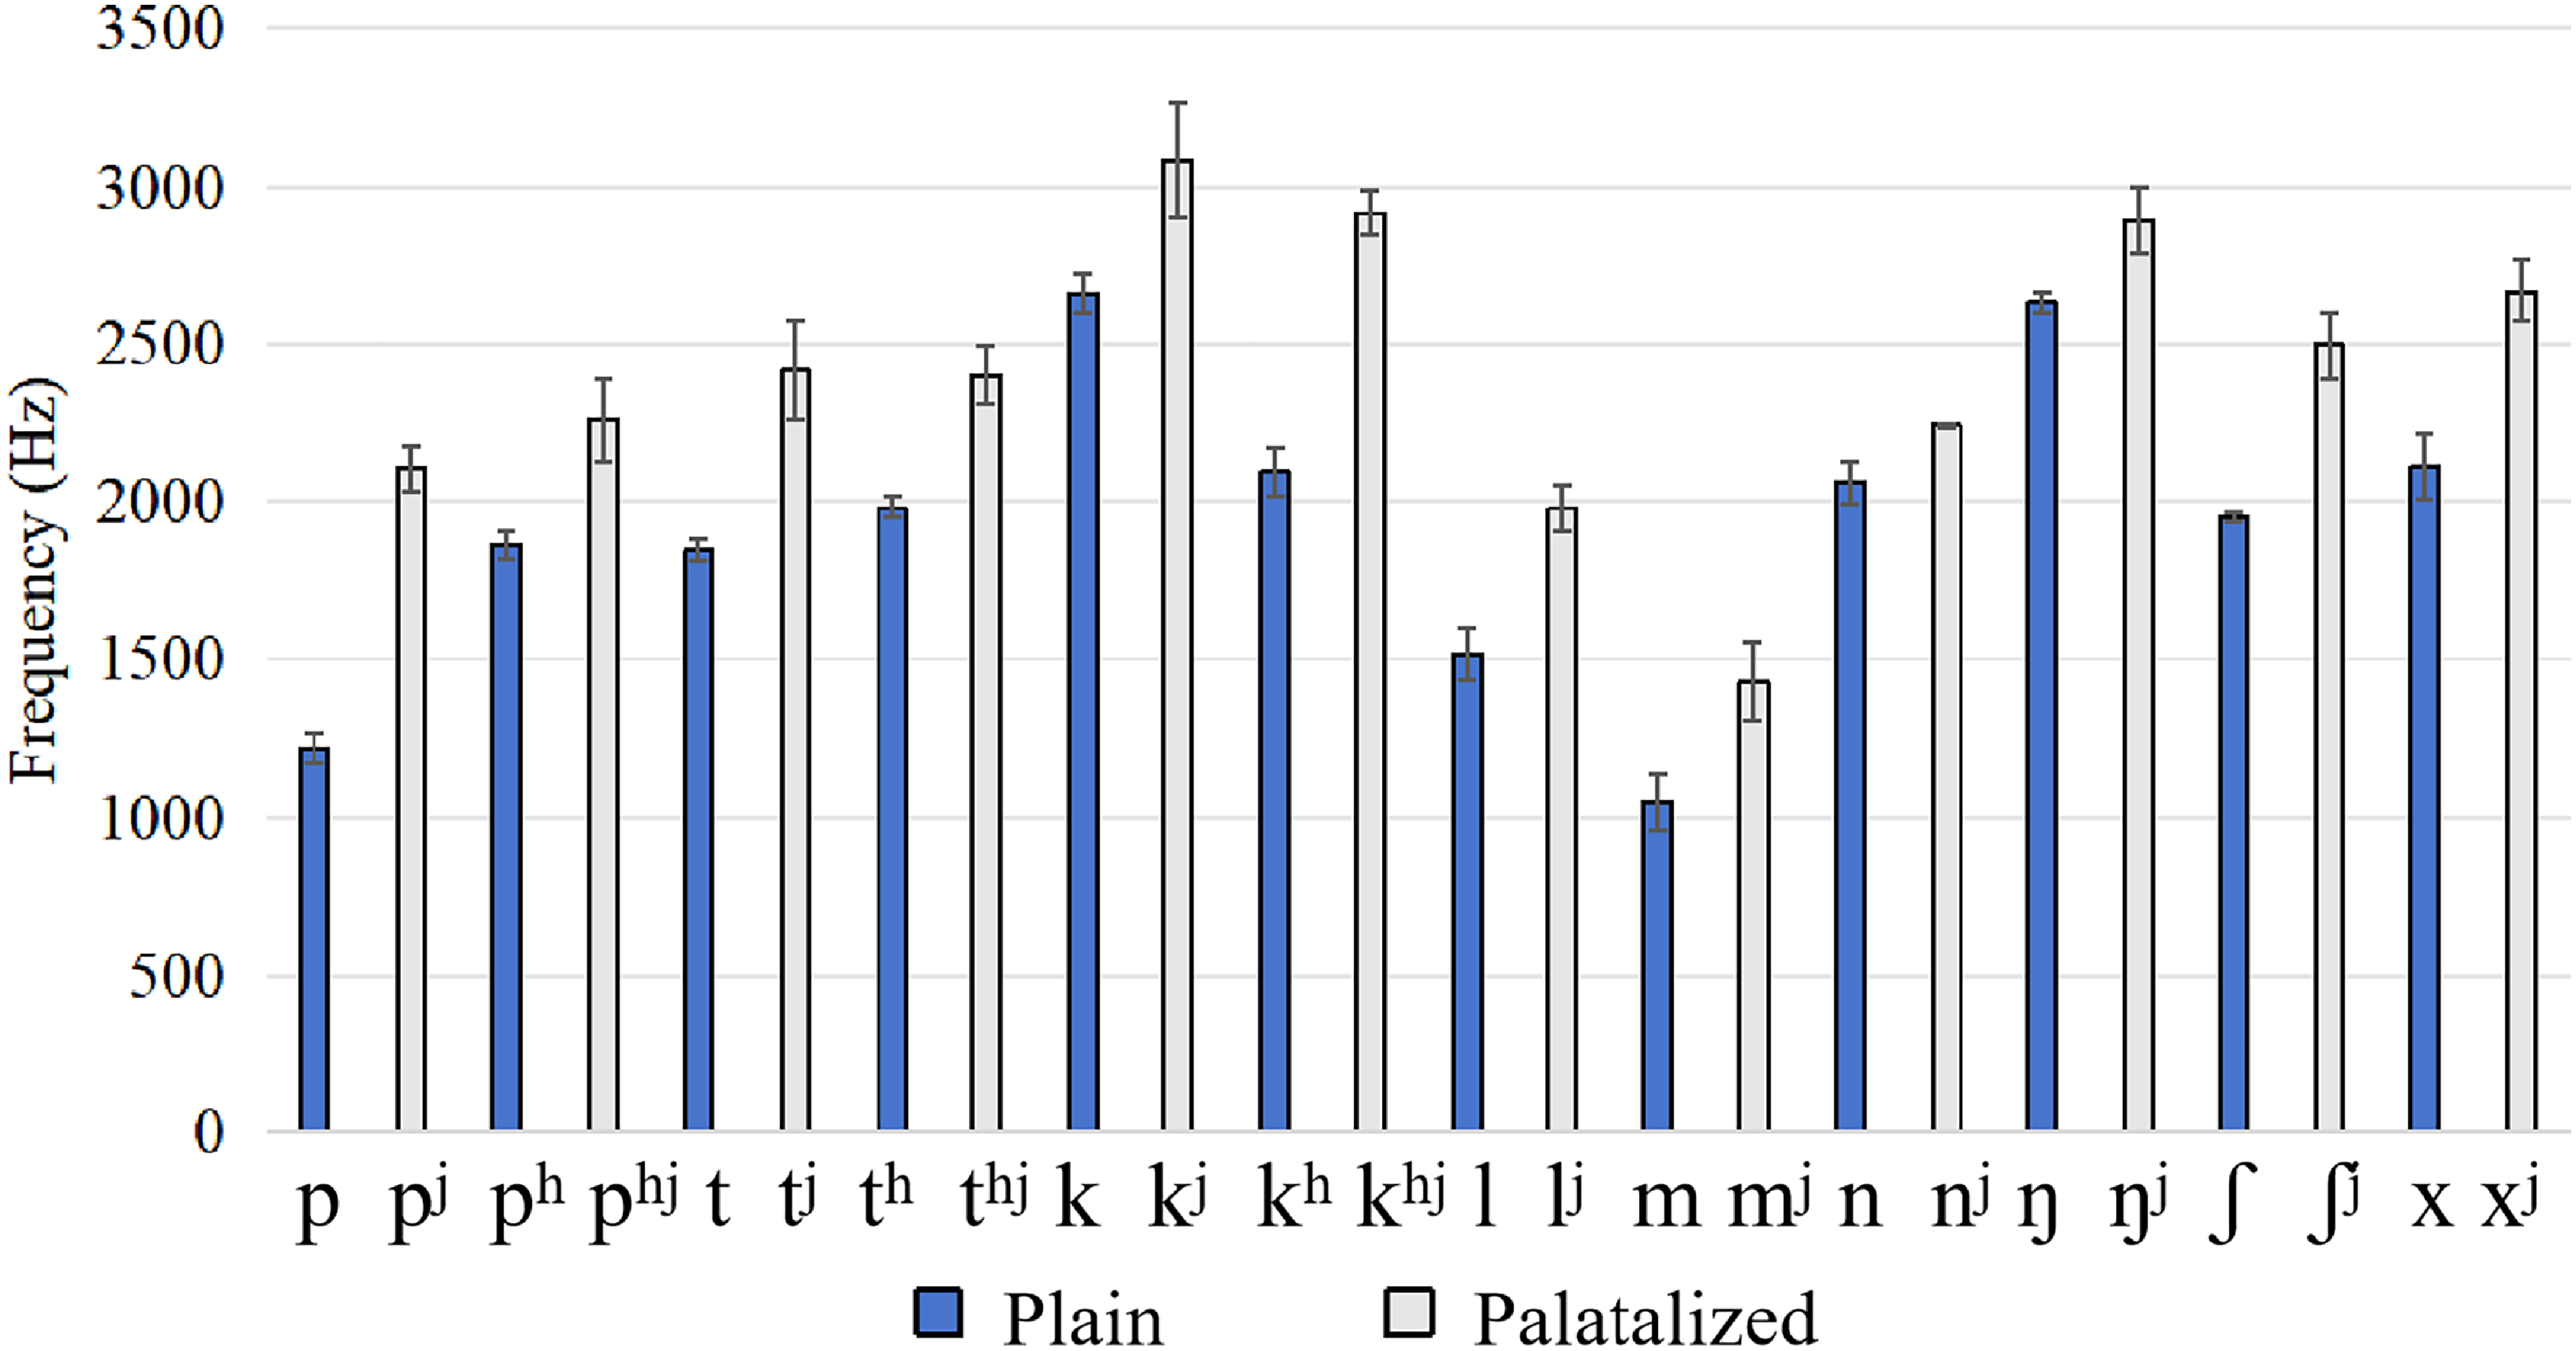
Figure 9 Long description
The bar graph compares the frequency in Hertz of plain and palatalized consonants in Zaiwa, showing mean values and standard deviations for each consonant type. The x-axis lists various consonants, including p, pj, ph, phj, t, tj, th, thj, k, kj, kh, khj, l, lj, m, mj, n, nj, ng, ngj, sh, shj, x, and xj. The y-axis measures frequency in Hertz, ranging from 0 to 3500. Each consonant has two bars: a blue bar representing the plain consonant and a white bar representing the palatalized consonant. The graph indicates that palatalized consonants generally have higher frequencies than their plain counterparts. For example, the plain p consonant has a frequency around 1000 Hz, while the palatalized pj consonant has a frequency around 2000 Hz. The graph also shows standard deviations for each measurement, indicating variability in the data. The mean and standard deviations were calculated using eight tokens of each consonant from a single speaker. All values are approximated.
Formant plots for the monophthongs of Zaiwa, F1 and F2 of each vowel were based on mean formant values of 10 open syllables. The ellipses show the F1 and F2 values to two standard deviations.
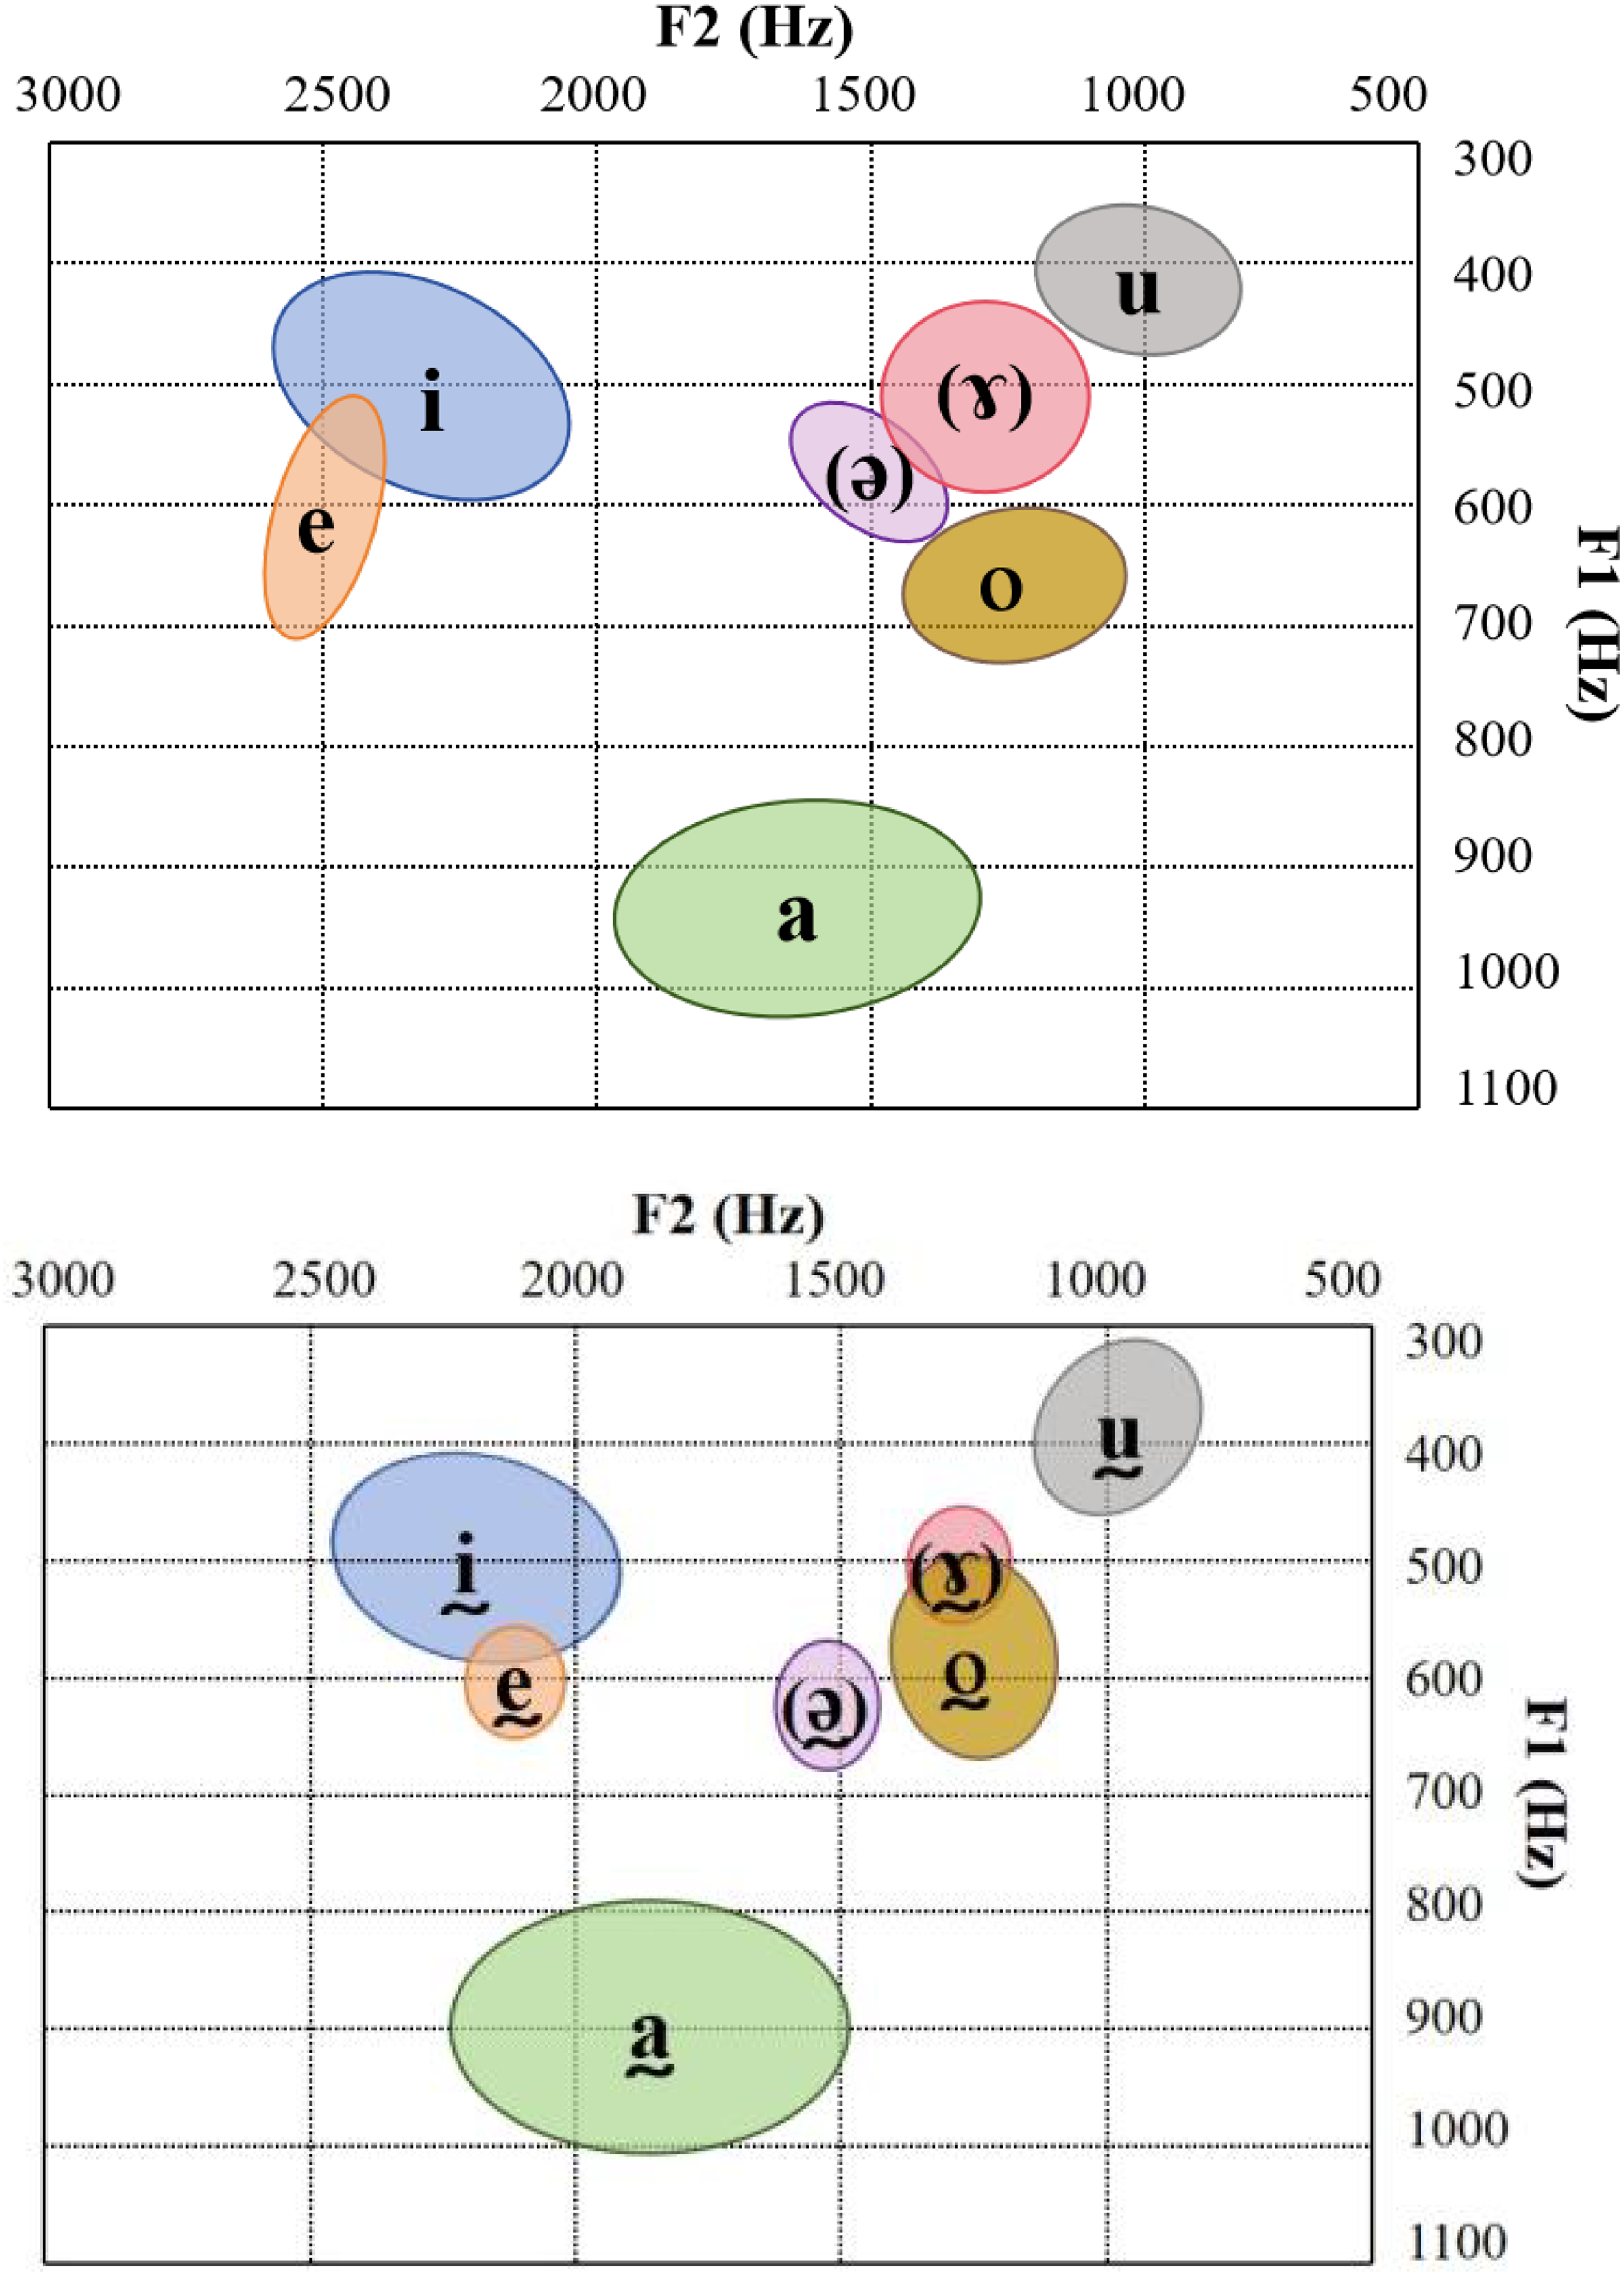
Figure 10 Long description
A scatter plot displays the distribution of monophthongs in Zaiwa, with F1 and F2 values plotted on the y-axis and x-axis respectively. The plot includes five vowel phonemes: i, e, a, o, and u, each represented by colored ellipses. The ellipses show the F1 and F2 values to two standard deviations, indicating the variability within each vowel. The vowels are differentiated according to phonation, forming ten distinct categories. The plot helps visualize the acoustic properties of these vowels in the Zaiwa language.
The phonemes 𰀯i𰀯 and 𰀯ḭ𰀯 are realized as [ɤ] and [ɤ̰] after velar consonants 𰀯k𰀯, 𰀯kh𰀯, 𰀯x𰀯, as well as bilabials, alveolars, and the approximant 𰀯ʋ𰀯, whereas they remain unchanged following the palatalized counterparts of bilabial, alveolar, and velar consonants. The example includes 𰀯pik31𰀯 realized as [pɤk31] ‘to shoot’. The spectrographic analysis presented in Figure 11 for [pɤk31] ‘to shoot’ compared to 𰀯tjik55𰀯 ‘urgent, fast’ distinctly shows that the separation between the formants F1 and F2 in [pɤk31] is markedly less than that observed in 𰀯tjik55𰀯.
Waveforms and spectrograms for [pɤk31] ‘to shoot’ and 𰀯tjik55𰀯 ‘urgent, fast’. The red dotted lines represent the formants.

Figure 11 Long description
The image contains two graphs, each showing waveforms and spectrograms for different phonemes. The first graph represents the phoneme pik31, realized as [pk31] to shoot, while the second graph represents the phoneme tjik55, described as urgent, fast. Both graphs feature waveforms at the top and spectrograms at the bottom. The spectrograms include red dotted lines that represent the formants. The x-axis of each graph indicates time in seconds, ranging from 0 to approximately 0.4561 seconds for the first graph and 0 to approximately 0.4760 seconds for the second graph. The y-axis of the spectrograms shows frequency in Hertz, ranging from 0 to 5000 Hertz. The waveforms display amplitude variations over time, while the spectrograms show frequency components and their intensities. The red dotted lines highlight specific formant frequencies within the spectrograms. All values are approximated.
The phonemes 𰀯e𰀯 and 𰀯ḛ𰀯 are realized as [ə] and [ə̰] following bilabial, alveolar, and velar consonants, the labiodental approximant 𰀯ʋ𰀯, and in null onset positions, whereas they remain unchanged following the palatalized counterparts of bilabial, alveolar, and velar consonants. An example of this phenomenon is observed in 𰀯pe35𰀯, which is articulated as [pə35] ‘fall off’. In Figure 12, which shows spectrograms of [pə35] ‘fall off’ to 𰀯tje35𰀯 ‘send’, we find that the separation between the formants F1 and F2 for [pə35] ’fall off’ is considerably narrower than that for 𰀯tje35𰀯 ‘send’. Figure 13 shows the spectrogram of two syllables 𰀯me21𰀯 ‘green blue’ and 𰀯mik21𰀯 ‘greedy’, which are realized respectively as [mə21] and [mɤk21].
Waveforms and spectrograms for the minimal pairs [pə35] ‘fall off’ versus 𰀯tje35𰀯 ‘send’. The red dotted lines represent the formants.

Figure 12 Long description
The image contains two graphs, each showing waveforms and spectrograms for phonetic sounds. The top graph represents the phonetic sound for 'fall off,' while the bottom graph represents the phonetic sound for 'send.' Each graph has a waveform at the top and a spectrogram below it. The red dotted lines in the spectrograms indicate the formants. The x-axis of each graph represents time in seconds, and the y-axis of the spectrograms represents frequency in Hertz. The waveforms show the amplitude of the sound over time, while the spectrograms display the frequency components of the sound. The formants are highlighted to show the specific frequency components that distinguish the phonetic sounds.
Vowel phonation
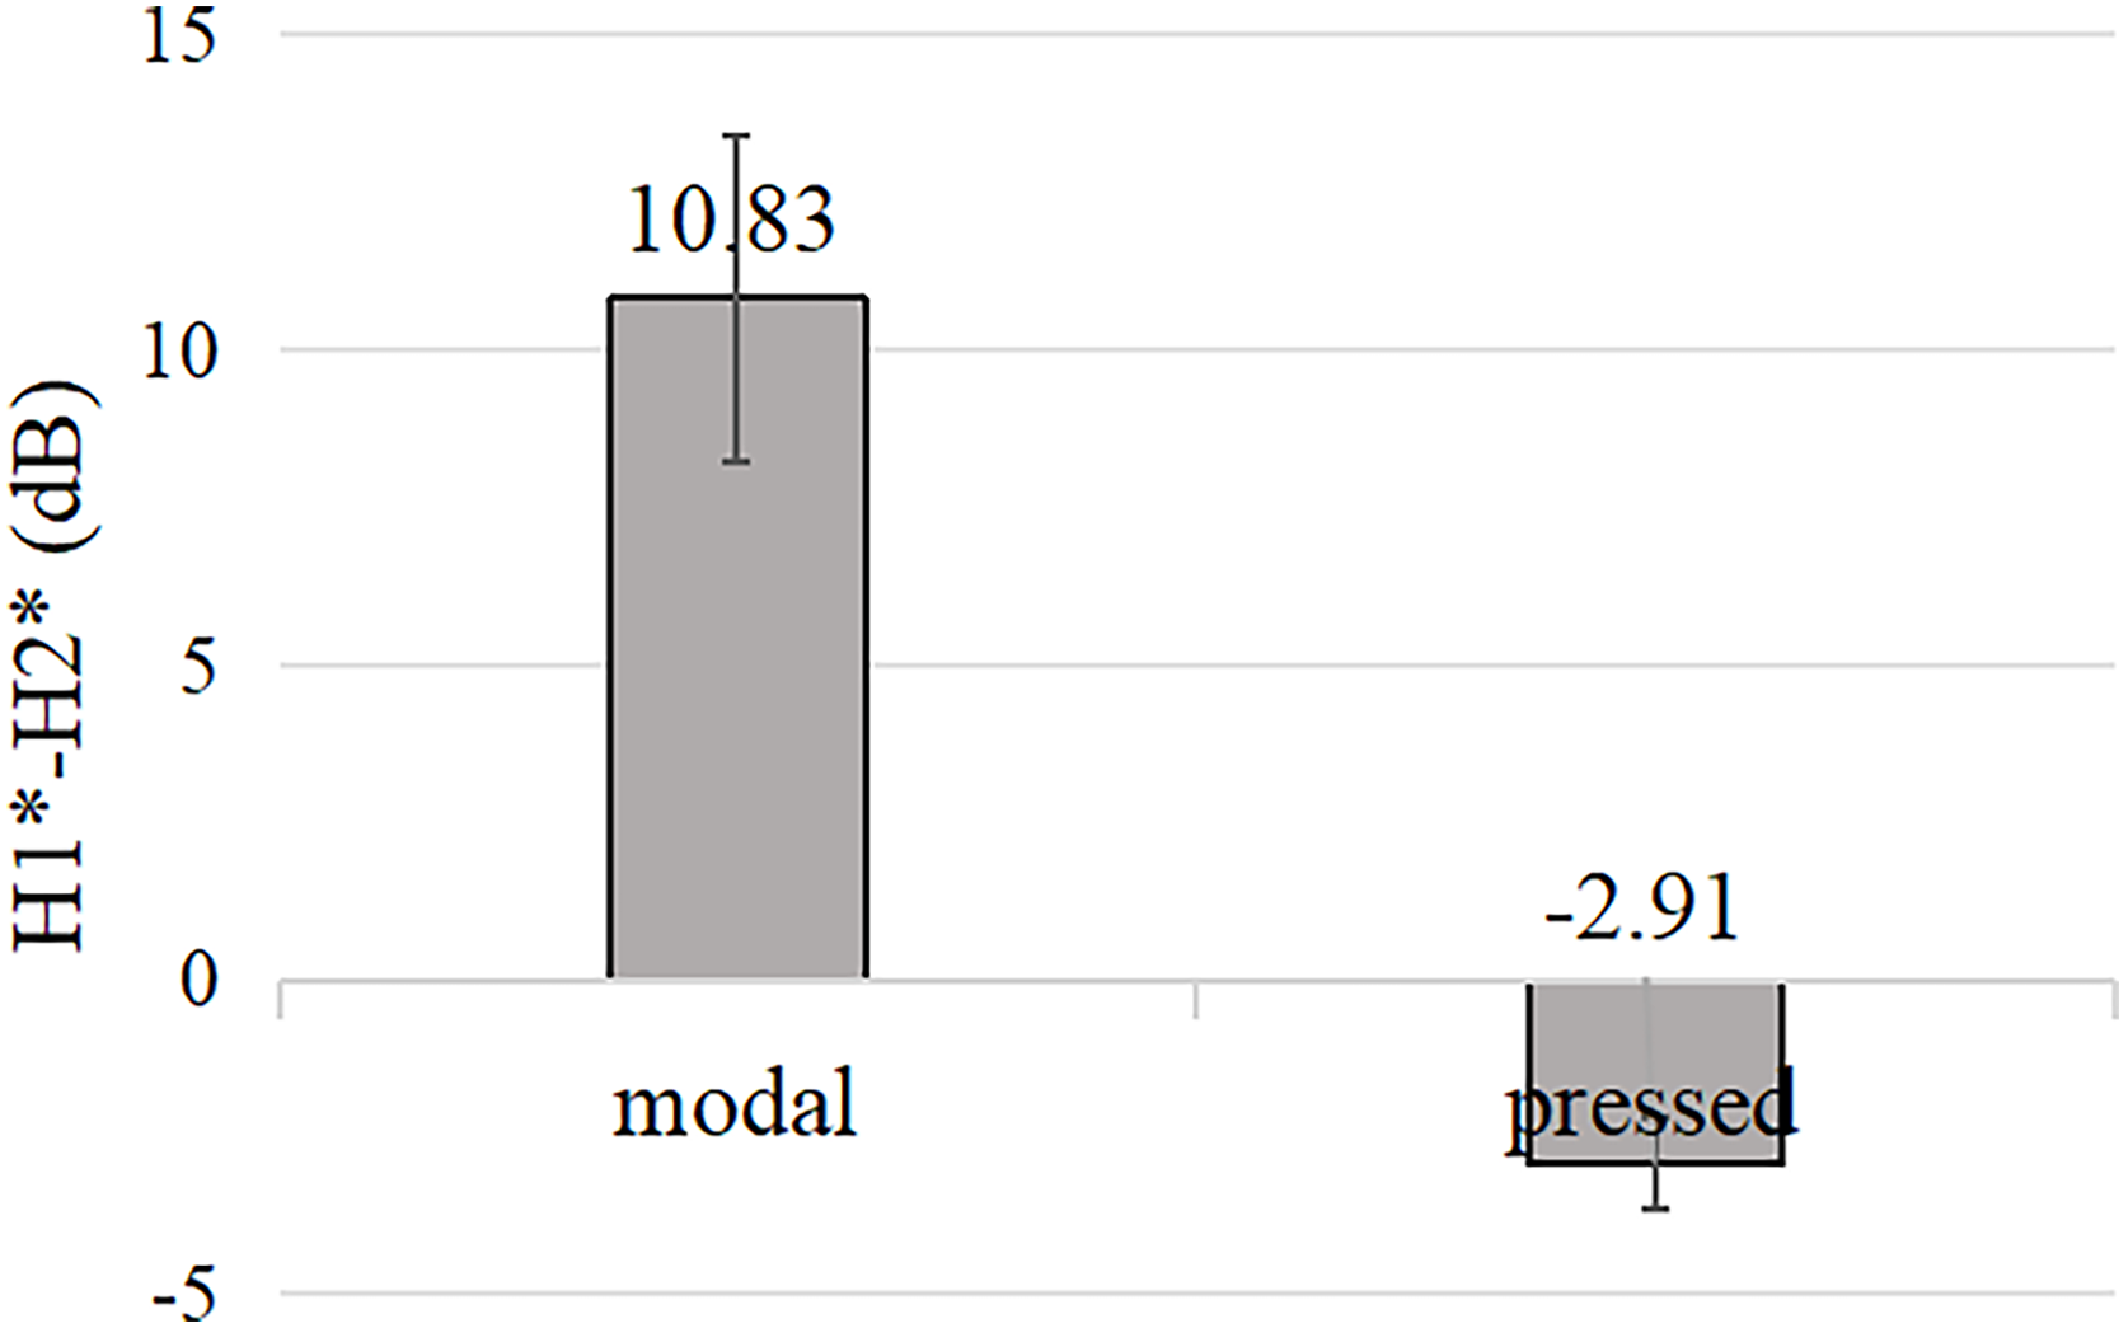
The distinction between vowels with pressed versus modal voice constitutes a pivotal feature within the phonology of Zaiwa. Through an analytical review of the manifestations and combinatorial rules of vowels with pressed voice and modal voice across various Tibeto-Burman languages, Dai (1989) posited that the differentiation between vowels with pressed and modal voice represents a critical characteristic in a subset of Tibeto-Burman languages. Regarding the formation of the pressed and modal voice vowels, Dai (1989) pointed out that the opposition in the Tibeto-Burman language family of China was the result of convergence from two different paths: one derived from the voiced versus voiceless contrast in onset consonants (noted in languages such as Zaiwa and Jingpo), and the other from the contrast between checked and unchecked vowels (observed in languages like Yi, Lahu, Lisu, and Hani). For example, one of the falling tones in Lisu is represented as being ‘checked’ by a glottal stop (Tabain, 2019>). The former involves changes in vowel quality influenced by the elements preceding the vowel, whereas the latter involves changes influenced by the elements following the vowel. Both the consonants before and after the vowel influence vowel changes, driving vowels toward a pressed and modal opposition, albeit under different conditions. This is a distinctive feature of the evolutionary development of the vowel system within the Tibeto-Burman language family, separating it from other language families. From the perspective of phonation types, Kong (2001) indicated that the vowels with modal and pressed voice in Zaiwa belong to different phonation types. The vowels with modal voice are largely modal but with a slightly breathy voice quality, while the vowels with pressed voice have a form representing a highly complex form of creaky voice.
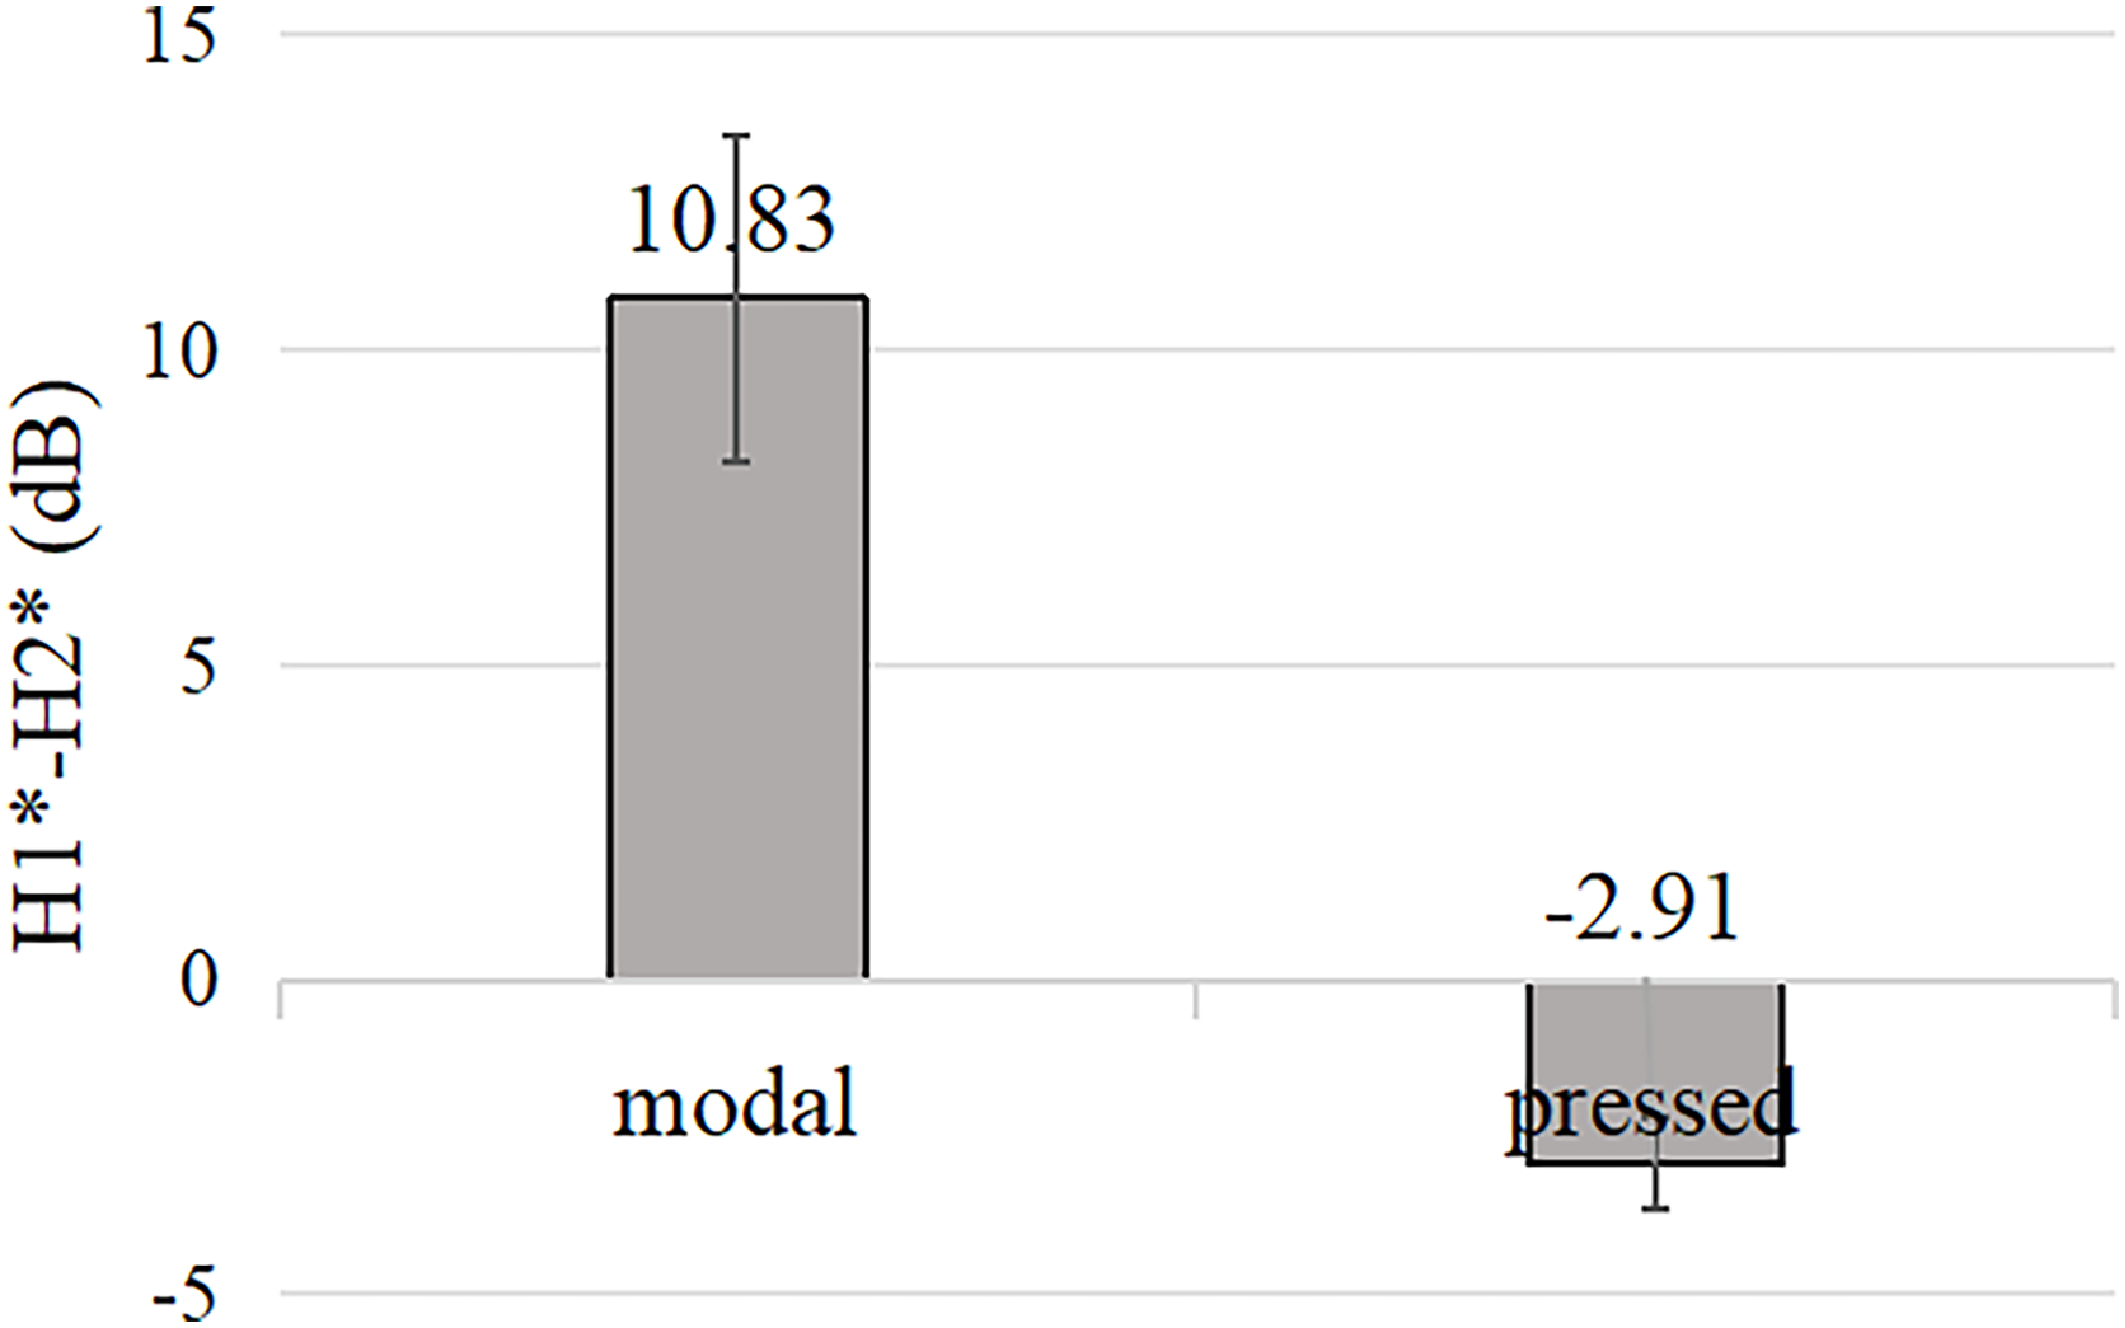
Thus, we calculated corrected H1*–H2* using Matlab for five minimal pairs or near-minimal pairs of vowels with pressed and modal voice in Zaiwa. The findings are presented in Figure 14, and reveal that the difference of H1*–H2* between vowels with pressed and modal voice is large. This suggests that vowels with pressed voice are produced with constricted vocal folds.
Cooccurrence restrictions between consonants and vowels
Vowels with a modal voice can combine with all consonants, while vowels with a pressed voice can only combine with unaspirated plosives, unaspirated affricates, nasals, lateral approximants, and approximants.
Waveforms and spectrograms for [mə21] ‘green blue’ and [mɤk21] ‘greedy’. The red dotted lines represent the formants.
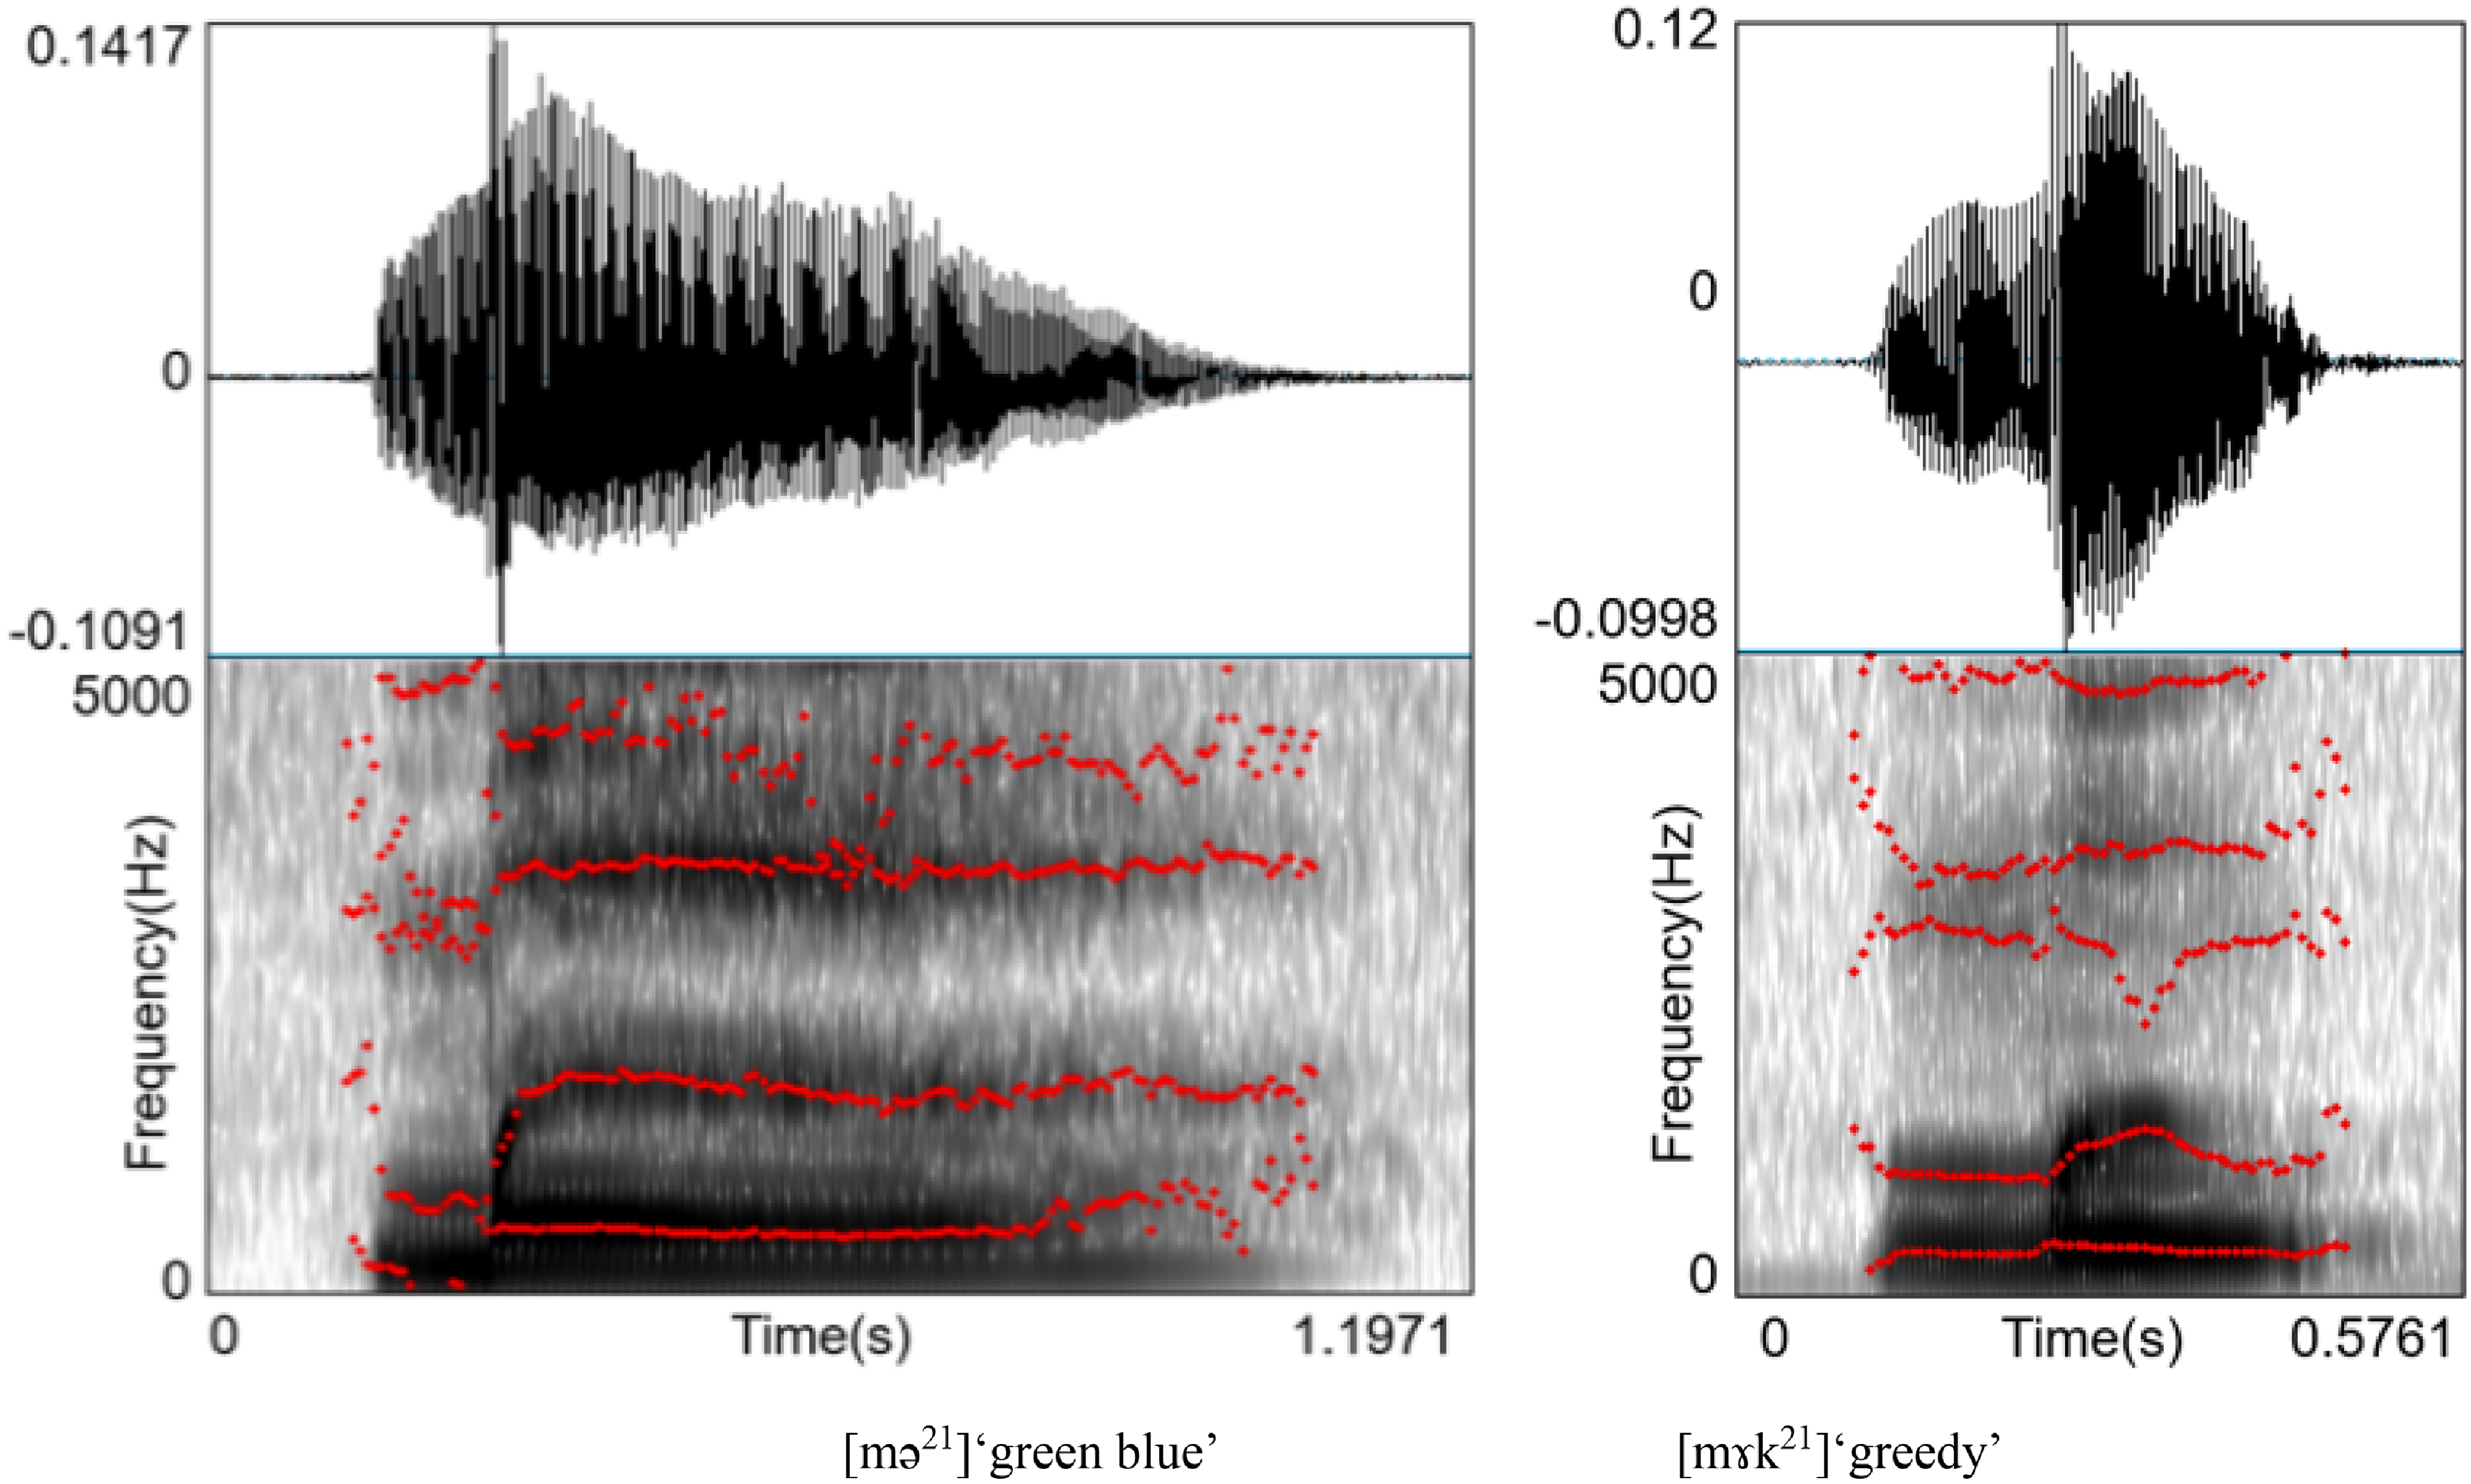
Figure 13 Long description
The image contains two side-by-side graphs, each showing a waveform at the top and a spectrogram at the bottom. The left graph represents the phoneme [m21] green blue, while the right graph represents the phoneme [mk21] greedy. Both spectrograms feature red dotted lines indicating the formant frequencies. The x-axis of each graph represents time in seconds, and the y-axis of the spectrograms represents frequency in Hertz. The waveforms illustrate the amplitude of the sound over time, while the spectrograms show the frequency components of the sound. The red dotted lines help visualize the formants, which are critical for distinguishing different phonemes.
H1*–H2* of vowels with modal and pressed voice. The means and standard deviations were calculated using five tokens of each phonation type from the single speaker.
Diphthongs
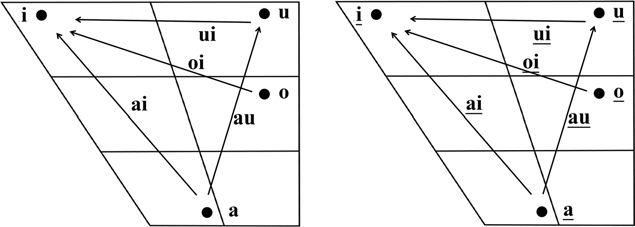
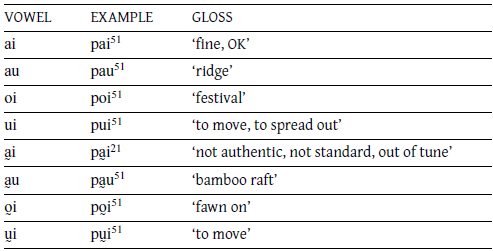
In Zaiwa, the primary vowels 𰀯a o u𰀯 combine with the coda 𰀯-i, -u𰀯 to form eight diphthongs with modal and pressed voice: 𰀯ai a̰i oi o̰i ui ṵi au a̰u𰀯, all of which are rising diphthongs. Figure 15 shows that F1 and F2 of the diphthongs were measured at 20% and 80%, which indicates the onset and offset values of the diphthongs.
Formant plots for the diphthongs of Zaiwa, F1 and F2 of vowel were based on mean formant values of 5 syllables.The ellipses show the F1and F2 values to 2 standard deviations.

Figure 15 Long description
A scatter plot displays the formant values for Zaiwa diphthongs, with the x-axis representing F2 in Hertz and the y-axis representing F1 in Hertz. The plot includes several data points, each representing mean formant values of five syllables. Ellipses around the data points show the F1 and F2 values within two standard deviations. The diphthongs ai, oi, ui, and au are labeled and color-coded in blue, gray, and green. The plot illustrates the distribution and variation of these diphthongs in Zaiwa.
Tones
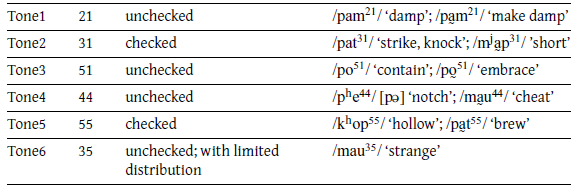
The Zaiwa tone system is rather complex. Previous research by Xu and Xu (1984) suggested that Zaiwa has three tones, with values of 21, 55, and 51. Dai (1989) identified two methods for categorizing Zaiwa tones. The first approach aggregates tones based on their proximal tone values and consolidates checked and unchecked tones into a single tone category. This classification yielded three tones, marked as 21, 55, and 51, with the 21 and 55 categories each encompassing both checked and unchecked variations. The second approach separated checked from unchecked tones, thus leading to five tones: three unchecked (21, 55, 51) and two checked (21, 55). Vowels with stop codas 𰀯p t k ʔ𰀯 can only combine with checked tones. He (2016) concurred with the existence of three tones within Zaiwa but argued for a revision of the tonal values to 22, 55, and 51. Furthermore, it has been shown in past studies that the high level tone 55 in Zaiwa changes to 35 for modal vowels preceded by unaspirated plosives and affricates, nasals, lateral approximants, or approximants. With other tones, vowels can either be pressed or modal in phonation. Lu & Kong (2019) observed that the Zaiwa tonal system has six tones for monosyllabic words, including two level tones, three falling tones and one rising tone, whose tone values are 55, 44, 51, 31, 21, and 35 respectively. As the phonation types of Zaiwa vowels vary between modal and pressed voice, and are closely integrated with tones, Lu & Kong (2019) also agreed with the limitations on the conditions under which the tone 35 appears in previous research.
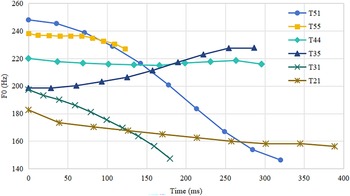
Based on the study by Lu & Kong (2019) and the current survey, we undertook an acoustic analysis of the Zaiwa tones, whereby the fundamental frequency of each monosyllabic utterance was extracted to analyze the tones. When selecting monosyllabic words to determine tones, we preferred words starting with unaspirated stop consonants to facilitate the extraction of fundamental frequency data. The f0 values of each tone were extracted using Praat (Boersma & Weenink, 2020). Each tonal contour is obtained by averaging across six tokens. Tonal values were marked using the five-scale pitch system developed by Chao (1980), in which 5 was the highest and 1 was the lowest. As shown in Figure 16, there is a difference in the tone values between the checked and unchecked tones. Checked tone 55, marked by a stop coda of 𰀯p, t, k, ʔ𰀯, was approximately one semitone higher in F0 than unchecked tone 55. The checked tone was approximated at 55, while the unchecked tone was at 44. Similarly, for tone 21, the checked tone characterized by a stop coda of 𰀯p, t, k, ʔ𰀯 was approximately 31, whereas the unchecked tone was around 21. Additionally, due to the considerable duration difference between checked and unchecked tones, we posit that distinguishing between checked and unchecked tones aligns more closely with perception. Additionally, there is a significant difference in fundamental frequency between the high-level tone and its variant 35, leading us to conclude that they should be distinguished as two separate tones. We also found that the combination of tone 35 with consonants and vowels aligns with the findings of previous researchers.
F0 contours of Zaiwa tones for the one speaker.
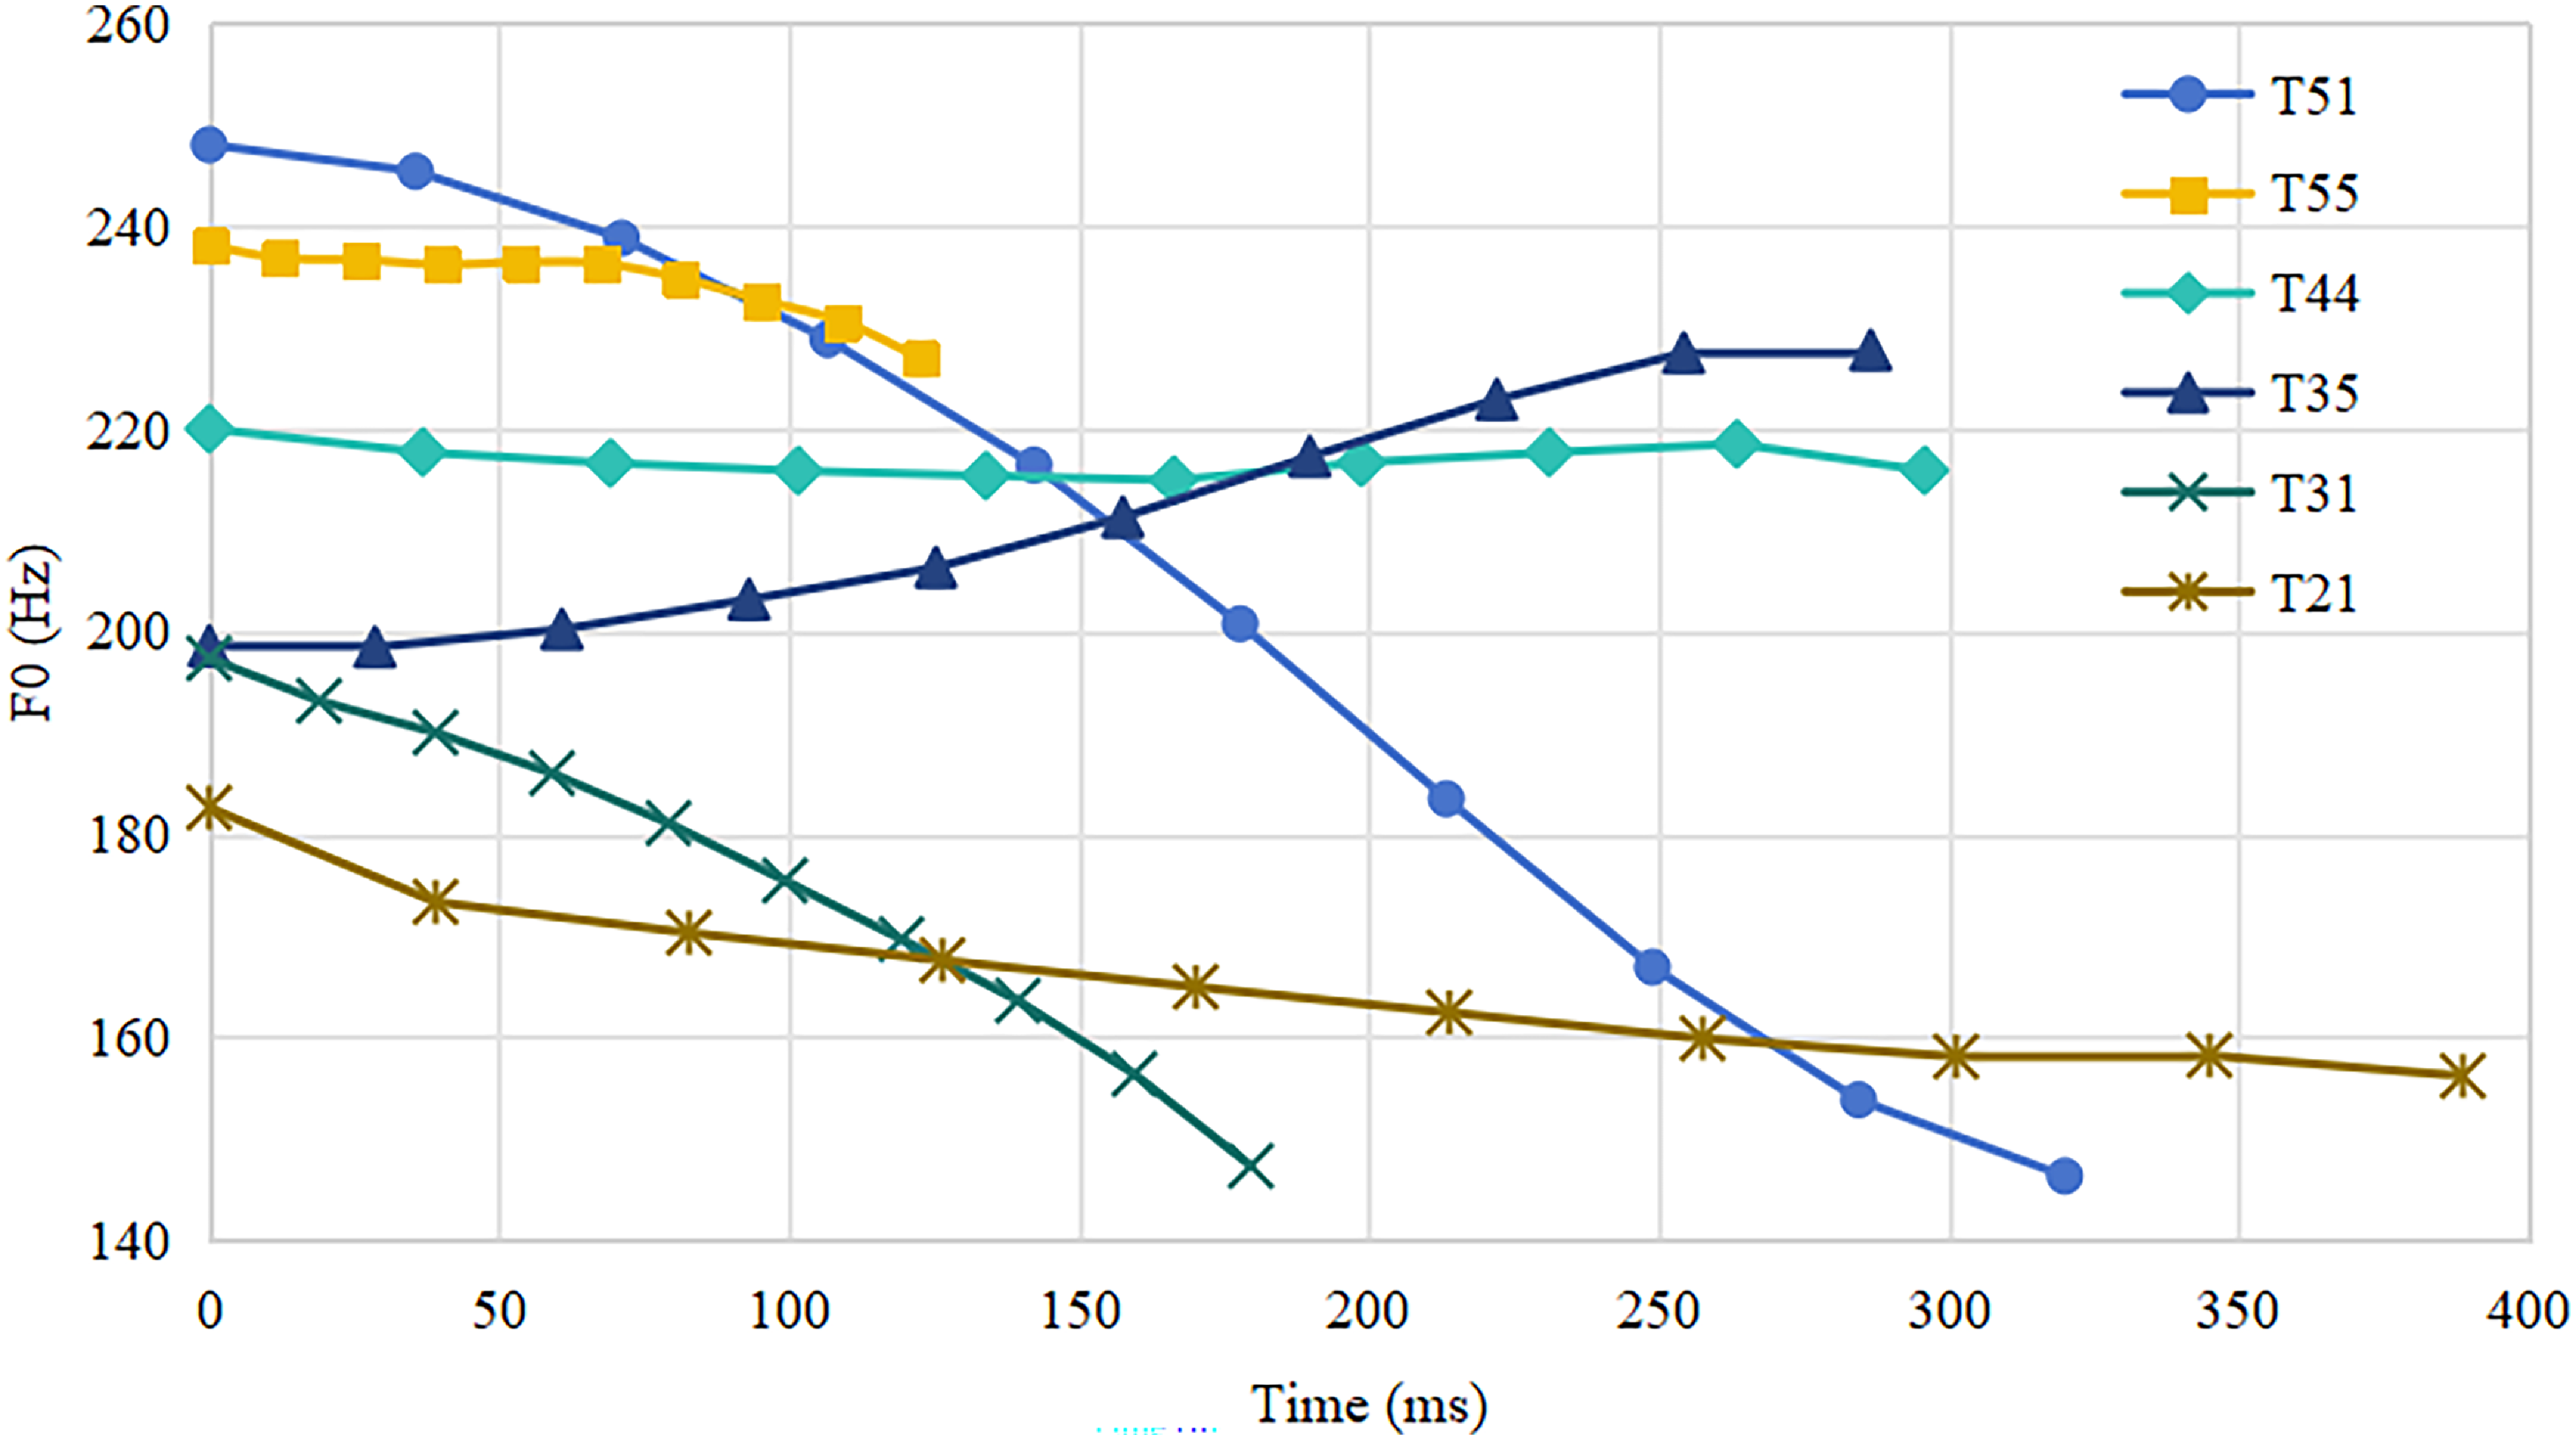
Figure 16 Long description
A line graph displays F0 contours of Zaiwa tones for one speaker. The x-axis represents time in milliseconds, ranging from 0 to 400 milliseconds. The y-axis represents the fundamental frequency (F0) in Hertz, ranging from 140 to 260 Hertz. Six data lines, each representing a different tone, show the tonal contours over time. The tones are labeled as T 51, T 55, T 44, T 35, T 31, and T 21. Each tonal contour is obtained by averaging across six tokens. The data points for each tone are plotted at various intervals, showing how the fundamental frequency changes over time. All values are approximated.
We agree with Lu & Kong (2019), who posit that the tonal system of Zaiwa should be described as follows: Zaiwa has six tones, comprising two level tones, one rising tone, and three falling tones, with the tone values of 55, 44, 35, 51, 31, and 21, respectively. Among these, tones 31 and 55 are checked tones, in that they only occur on syllables ending in a stop coda 𰀯p, t, k, ʔ𰀯, while tones 21, 44 and 35 are unchecked tones, meaning that they cannot occur on syllables ending in a stop coda. The occurrence of rising tone 35 is conditional, requiring the consonant to be unaspirated plosives and affricates, nasals, lateral approximants and approximants, and the vowel to be in a modal voice, whereas the vowels in other tones can be in either a modal or pressed voice.
Syllable structure
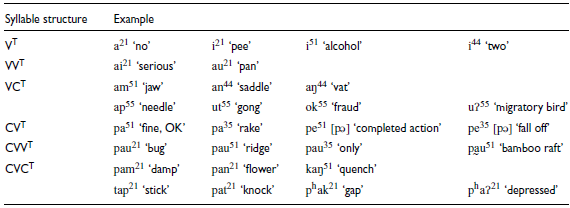
There are seven syllable structures, namely V, VV, C, VC, CV, CVV, and CVC. Since type C consists only of syllabic 𰀯m𰀯 and 𰀯n𰀯, which are modal particles, it should be treated as extra-linguistic and not part of the lexical phonology. As shown in Table 1, syllable types V and VV respectively represent all monophthongs and diphthongs as previously mentioned. In syllable types VC, CV, CVV, and CVC, the onset consonants include all consonants except for the glottal stop, and the coda consonants include the nasal sounds 𰀯m n ŋ𰀯 and the stops 𰀯p t k ʔ𰀯.
Syllable structure and examples of Zaiwa
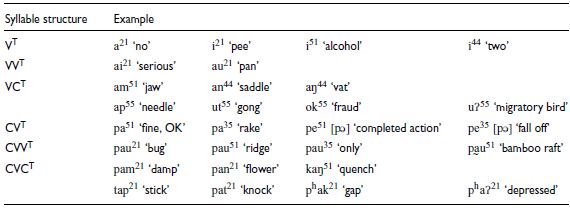
Table 1 Long description
The table presents seven syllable structures in the Zaiwa language, each accompanied by examples. The structures include V, VV, VC, CV, CVV, and CVC. Type C, which consists only of syllabic m and n, is treated as extra-linguistic and not part of the lexical phonology. Syllable types V and VV represent all monophthongs and diphthongs, respectively. In syllable types VC, CV, CVV, and CVC, the onset consonants include all consonants except for the glottal stop, and the coda consonants include the nasal sounds m, n, and the stops p, t, k. The table is organized into two columns: Syllable Structure and Example. The Syllable Structure column lists the different syllable types, while the Example column provides specific examples for each type. For instance, under the V structure, examples include 'no,' 'pee,' 'alcohol,' and 'two.' The VV structure includes examples like 'serious' and 'pan.' The VC structure features examples such as 'jaw,' 'saddle,' and 'vat.' The CV structure includes 'fine,' 'rake,' and 'bug.' The CVV structure lists examples like 'ridge' and 'only,' while the CVC structure includes 'damp,' 'flower,' 'quench,' and 'stick.' This detailed breakdown highlights the phonetic diversity and structural complexity of the Zaiwa language's syllable formations.
Transcription of the recorded passage
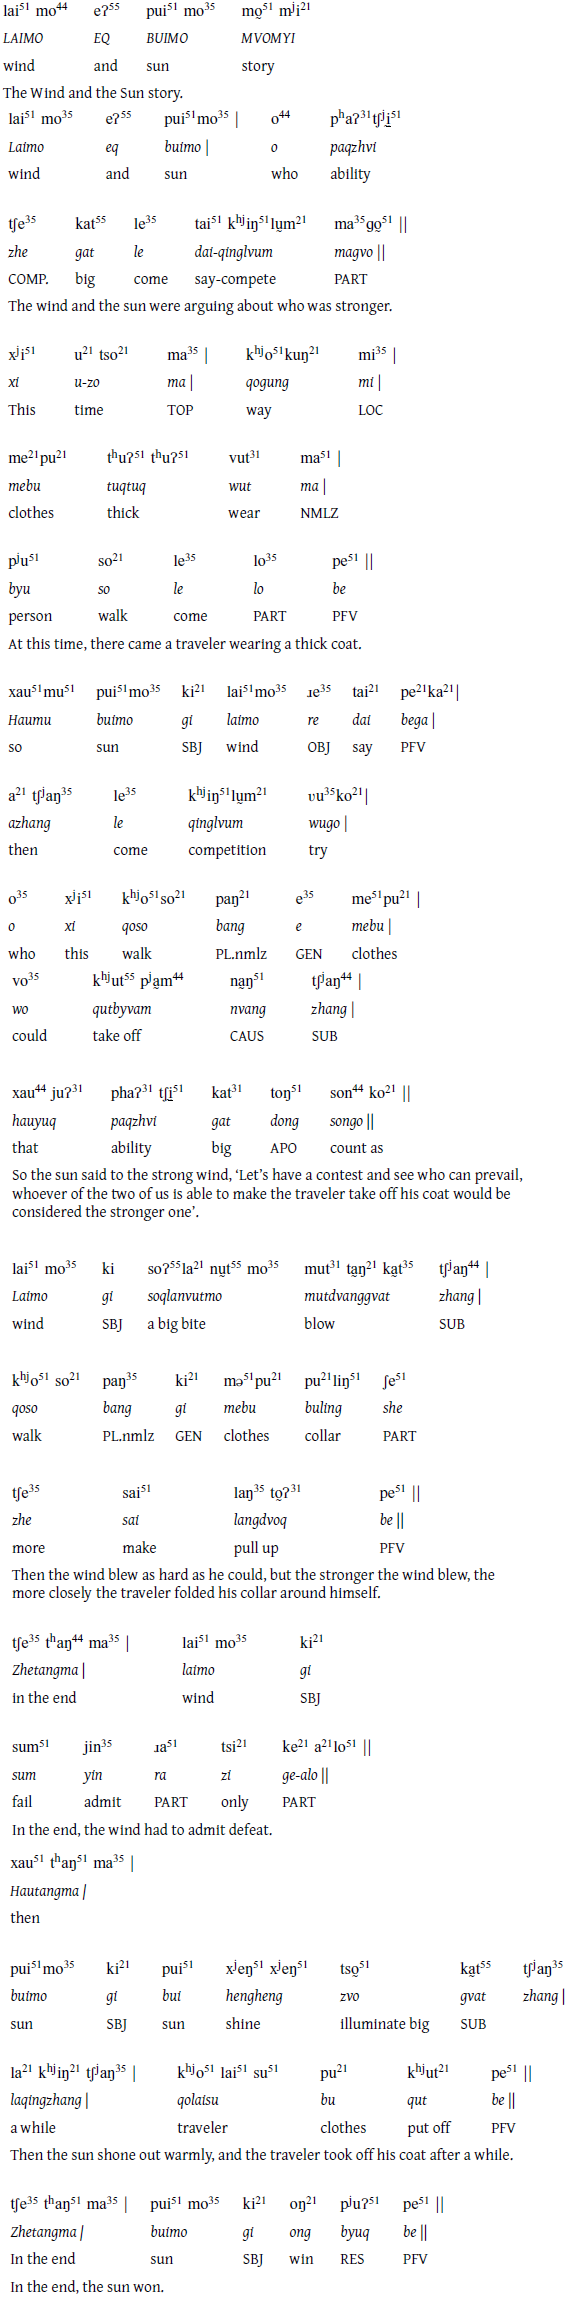
The passage used for the recordings is the story ‘The Wind and the Sun’, which is transcribed using the consonants, vowels, and tones of Zaiwa described above. The transcription below is broad phonemic. The symbol indicates a minor intonational break (corresponding to final lengthening), while denotes a major intonational break preceding a pause, following the International Phonetic Alphabet conventions. The transcription of each sentence is presented in three versions: the first line is an IPA transcription; the second, in italics, is a Zaiwa writing system transcription; and the third is the interlinear morphemic glossing. Abbreviations used in interlinear glossing follow the Leipzig Glossing Rules (LGR, https://www.eva.mpg.de/lingua/pdf/Glossing-Rules.pdf). The non-standard abbreviation (not included in the LGR) is: PREP = preposition. Additionally, a free English translation is also provided in quotations.
Acknowledgments
This work was supported by the National Social Science Fund of China (No. 22&ZD213). We are grateful to the journal’s editors, Marc Garellek and Marija Tabain, as well as the two anonymous reviewers, for their detailed comments and insightful suggestions, which have significantly contributed to improving the analysis and presentation of the Illustration.
Supplementary material
To view supplementary material for this article (including audio files to accompany the language examples), please visit https://doi.org/10.1017/S002510032510073X









 Open access

