

Studies examining the association between obesity and chronic kidney disease (CKD) have largely been conducted in local or regional, rather than national, population samples. Obesity has been identified as an independent risk factor for CKD and progression to kidney failure( Reference Fox, Larson and Leip 1 – Reference Othman, Kawar and El Nahas 4 ), even after adjustment for hypertension and diabetes( Reference Hsu, McCulloch and Iribarren 5 – Reference Hallan, de Mutsert and Carlsen 9 ). However, national population studies are lacking and this relationship has not been fully investigated in the UK, with limited studies suggesting a small increase in the risk of CKD with increasing BMI( Reference Hobbs, Farmer and Irving 10 , Reference Burton, Gray and Webb 11 ).
The Health Survey for England (HSE) is an annual survey of a randomly selected, general population sample of adults and children in households across England, which may include both healthy individuals and those with acute and chronic illnesses( Reference Craig and Mondell 12 ). In 2010, the HSE data set included serum creatinine (from which estimated glomerular filtration rate (eGFR) can be calculated) to assist in determining the prevalence of CKD in the population( Reference Roth, Roderick and Mindel 13 ), and this also provided the opportunity to examine the relationship between BMI and CKD in this nationally representative sample of the English population.
The present study sought to determine if overweight and obesity were independently associated with the risk for CKD (eGFR <60 ml/min per 1·73 m2) in the 2010 HSE population sample of adults living in the UK.
Methods
Study population and setting
The HSE is an annual cross-sectional survey of households in England, which are randomly selected by postcode( Reference Craig and Mondell 12 ). The anonymised data set is publicly available for the purposes of research and education( 14 ), thus ethical approval to use the HSE data set was not required. The HSE data set includes demographics, determinants of socio-economic status, self-reported dietary information, medications, co-morbidities, mental health measures, anthropometric measures, and pre-specified analyses of blood, saliva and urine samples.
Main outcome and measures
The primary outcome was the risk of concomitant CKD as BMI increases in the HSE 2010 population with both BMI and a single serum creatinine measure recorded. Kidney function was defined as eGFR in ml/min per 1·73 m2 calculated with the Chronic Kidney Disease Epidemiology Collaboration (CKD-EPI) formula using serum creatinine, age, gender and ethnicity variables, including adjustment factors of ×1·212 if black race and ×0·742 if female( Reference Levey, Stevens and Schmid 15 ). Kidney function was subsequently categorised using the Kidney Disease Outcomes Quality Initiative (KDOQI) stages of CKD( 16 ); CKD was classified as CKD stage 3 or above, with an eGFR of <60 ml/min per 1·73 m2.
Serum creatinine was measured in a single laboratory using the enzymatic Creatinine Plus (Roche) method on a Modular P analyser (Roche) for all study samples. BMI was calculated as [weight (kg)]/[height (m)]2 from height and weight measured by the study nurse, and categorised into underweight, normal range, overweight and obese classifications according to the WHO criteria( 17 ). Participants aged ≥18 years with both a single serum creatinine value and calculated BMI of 15·0–60·0 kg/m2 were included in the present study. BMI outside this range was deemed to be either incorrect or not representative of population norms and was therefore excluded. Baseline characteristics in the study population, including age, gender, ethnicity, eGFR, diabetes, hypertension and smoking status, were reported.
Diabetes and hypertension status data were collected routinely as part of the data set. Diabetes was classified as a self-reported previous diagnosis of diabetes; hypertension was classified as already receiving treatment (drug, dietary or lifestyle) for hypertension or with a recorded blood pressure of >140/90 mmHg measured by the study nurse( Reference Craig and Mondell 12 ). Smoking status was defined as never smoked (reference category), ex-smoker and current smoker.
Statistical analyses
Statistical analyses were completed using the statistical software package IBM SPSS Statistics version 19. Descriptive statistics were expressed as mean and standard deviation or as median and interquartile range for parametric and non-parametric continuous variables, respectively. Categorical variables were expressed as percentages. Baseline comparisons between continuous variables were performed using Student’s t test or the Mann–Whitney U test for parametric and non-parametric variables, respectively, and using Pearson’s χ 2 test for categorical variables. Normality of the data sets was established using visual assessment of histograms representing a normal curve and non-parametric continuous variables were converted into categorical variables.
Study participants were split into two groups according to eGFR. The CKD group was defined as eGFR < 60 ml/min per 1·73 m2 and the non-CKD group as eGFR ≥60 ml/min per 1·73 m2. Baseline characteristics of the groups were compared for age, gender, ethnicity, diabetes, hypertension and BMI. Participants in both groups were classified by WHO BMI criteria as underweight (<18·5 kg/m2), normal range (18·5–24·9 kg/m2), overweight (25·0–29·9 kg/m2), obese classes I and II (30·0–39·9 kg/m2) and obese class III (≥40·0 kg/m2). The distribution across BMI categories in the CKD group and the non-CKD group were compared using Pearson’s χ 2 test.
To evaluate the relationship between CKD and obesity in the study population, multivariable logistic regression models were developed to calculate odds ratios and 95 % confidence intervals. The BMI reference category was 18·5–24·9 kg/m2. The unadjusted model (model 1) was built upon sequentially to include the predetermined potential confounders of age, gender and ethnicity (model 2), plus effect modifiers of smoking status, diabetes and hypertension (model 3). These analyses were repeated with CKD status classified using eGFR calculated with the four-variable Modification of Diet in Renal Disease (MDRD) study equation, using serum creatinine, age, gender and ethnicity variables, including adjustment factors of×1·210 if black race and×0·742 if female( Reference Levey, Bosch and Lewis 18 , Reference Levey, Greene and Kusek 19 ), to enable comparison with previous studies.
Results
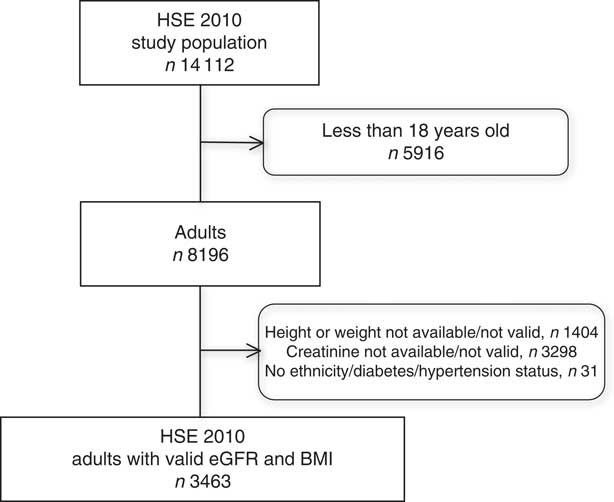
The HSE 2010 included 8196 participants, of whom 4733 were excluded due to missing serum creatinine, height, weight, ethnicity, gender, hypertension or diabetes status information; resulting in a study sample population of 3463 adults (42·3 % of the survey population) with a valid BMI and calculable eGFR (Fig. 1). There were no significant differences in mean age or BMI, gender, ethnicity or prevalence of diabetes or hypertension between the excluded and included participants. The characteristics of the HSE study population and the CKD and non-CKD groups are described in Table 1. Two hundred and four (5·9 %) participants had an eGFR <60 ml/min per 1·73 m2 and were classified as having CKD according to the study criteria. The CKD group was older, with a greater prevalence of diabetes and hypertension and had a higher mean BMI (all P<0·001) than those without CKD. The non-CKD group had greater representation from Black, Asian and other ethnic groups compared with the CKD group (P=0·03).
Selection of the study population from the Health Survey for England (HSE) 2010 (eGFR, estimated glomerular filtration rate calculated using the Chronic Kidney Disease Epidemiology Collaboration equation)
Characteristics of the Health Survey for England (HSE) 2010 study population as a whole and grouped by CKD-EPI equation-defined CKD statusFootnote †
CKD, chronic kidney disease; CKD-EPI, Chronic Kidney Disease Epidemiology Collaboration; eGFR, estimated glomerular filtration rate.
† Data are presented as mean and standard deviation or as percentage prevalence.
‡ eGFR≥60 ml/min per 1·73 m2.
§ eGFR<60 ml/min per 1·73 m2.
|| Comparison between non-CKD group and CKD group with unpaired Student t test.
Over 65 % of the HSE 2010 study population was overweight or obese. The distribution of BMI for the entire study population, and for the CKD and non-CKD groups, is displayed in Table 2. The distribution of BMI differed between the CKD and non-CKD groups (χ 2=30·85, df=4; P<0·001). There were more normal-weight and overweight participants in the non-CKD group, compared with the CKD group, and the CKD group had a greater percentage of obese patients than the non-CKD group.
Distribution across BMI categories of the Health Survey for England (HSE) 2010 study population as a whole and grouped by CKD-EPI equation-defined CKD statusFootnote †,Footnote ‡
CKD, chronic kidney disease; CKD-EPI, Chronic Kidney Disease Epidemiology Collaboration; eGFR, estimated glomerular filtration rate.
† Among those with a valid BMI and eGFR calculable with the CKD-EPI equation.
‡ Data are presented as number and percentage or as percentage.
§ eGFR≥60 ml/min per 1·73 m2.
|| eGFR<60 ml/min per 1·73 m2.
The unadjusted and adjusted odds ratios and 95 % confidence intervals for the risk of CKD with increasing BMI are displayed in Table 3. The risk of CKD increased as BMI increased in the HSE 2010 population. In the unadjusted model (model 1), the risk of CKD was almost three times higher in those with a BMI of 30·0–39·9 kg/m2 than in those with normal BMI. After adjustment for age, gender and ethnicity (model 2), the risk was attenuated but remained significant for the overweight group, while the risk increased with BMI ≥30·0 kg/m2. With further adjustment for smoking, diabetes and hypertension (model 3), the risk of CKD was mitigated slightly, but remained over 2·5 times higher in those with BMI ≥30·0 kg/m2, compared with those of normal weight. The risk for CKD in the overweight group was fully attenuated by adjusting for diabetes, hypertension and smoking status.
Logistic regression models for risk of concomitant CKD (CKD-EPI equation-defined eGFR<60 ml/min per 1·73 m2) by BMI in the Health Survey for England (HSE) 2010 study population (n 3463)
CKD, chronic kidney disease; CKD-EPI, Chronic Kidney Disease Epidemiology Collaboration equation; eGFR, estimated glomerular filtration rate.
Model 1, unadjusted; model 2, adjusted for age, gender and ethnicity; model 3, adjusted for age, gender, ethnicity smoking, diabetes and hypertension.
*P<0·05, **P<0·01, ***P<0·001.
In order to make comparisons with other studies (and to reflect the eGFR reporting method most commonly used clinically), these analyses were repeated using the MDRD study equation to calculate eGFR( Reference Levey, Bosch and Lewis 18 , Reference Levey, Greene and Kusek 19 ). Using MDRD eGFR to define CKD, the risk associated with obesity decreased, yet remained significant for BMI=30·0–39·9 kg/m2 and became non-significant when BMI ≥40·0 kg/m2 (Table 4). The prevalence of MDRD eGFR-defined CKD in the study population was 7·4 % (n 254) compared with 5·9 % using CKD-EPI eGFR. There was a lower prevalence of CKD in obese study participants using MDRD eGFR than with CKD-EPI eGFR (38·1 % v. 42·6 %).
Logistic regression models for risk of concomitant CKD (MDRD equation-defined eGFR < 60 ml/min/1·73 m2) by BMI in the Health Survey for England (HSE) 2010 study population (n 3463)
CKD, chronic kidney disease; MDRD, Modification of Diet in Renal Disease study; eGFR, estimated glomerular filtration rate.
Model 1, unadjusted; model 2, adjusted for age, gender and ethnicity; model 3, adjusted for age, gender, ethnicity smoking, diabetes and hypertension.
*P<0·05, **P<0·01, ***P<0·001.
Discussion
Obesity, but not overweight, is associated with a significantly increased risk of CKD in a large, randomly selected, nationally representative, population sample in England. This is the first evidence to suggest that obesity is a substantial risk factor for CKD in a UK-based population, supporting the findings from previous studies in local and regional populations in Europe, Japan and North America( Reference Kramer, Luke and Bidani 2 , Reference Kawamoto, Kohara and Tabara 7 , Reference Hallan, de Mutsert and Carlsen 9 ). The higher risk associated with obesity in the present study, compared with previous studies in local UK populations( Reference Hobbs, Farmer and Irving 10 , Reference Burton, Gray and Webb 11 ), may reflect sampling biases in local v. national population data sets or differences in population samples (health practitioner-derived v. households randomly selected by postcode).
The strengths of the present study include the use of a nationally representative data set with uniform data collection, predefined terms and standardised methods of data input. The analyses were corrected for known potential confounding variables including age, gender and ethnicity, as well as smoking status, diabetes and hypertension. The cross-sectional design of the study has several limitations. First, by design, the study cannot determine causality or monitor the development of CKD over time. Second, while the HSE was carried out in people’s homes and they were apparently well at the time of the survey, it is not possible to determine whether the single creatinine measure obtained was representative of usual kidney function for all participants. The serum creatinine value used in the HSE was from a single measurement only, so the full definition of CKD, with a chronicity of at least 3 months, was not met in the present study; or in any other population-based study of the relationship between obesity and CKD. Furthermore, there may be other unconsidered (and therefore unaccounted for) variables which may affect the relationship examined.
The prevalence of CKD (eGFR <60 ml/min per 1·73 m2) in the present study population was just under 6 % using the CKD-EPI equation, which concurs with the 5 % prevalence in the HUNT II study in Norway( Reference Hallan, de Mutsert and Carlsen 9 ). In cross-sectional studies of community-based samples, the fully adjusted risk for CKD (MDRD eGFR <60 ml/min per 1·73 m2) with obesity increased by 57 % when adjusted for age and gender only in the HUNT II study( Reference Hallan, de Mutsert and Carlsen 9 ), and the risk for CKD with overweight and obesity combined doubled in a Japanese community population( Reference Kawamoto, Kohara and Tabara 7 ). In our study the risk for CKD was similar using the MDRD study equation, yet the fully adjusted risk for CKD, using the CKD-EPI equation, was over 2·5 times as high for obese participants compared with normal-weight controls.
Using the CKD-EPI equation reduced the percentage of patients classified with CKD compared with the MDRD study equation in the present study, as expected, because the MDRD study equation systematically underestimates GFR at higher levels of GFR( Reference Levey, Stevens and Schmid 15 ), leading to false classification of CKD. The CKD-EPI equation was developed and validated across a wider range of GFR, including those with normal kidney function, to improve the precision of the estimation of GFR at higher levels of kidney function( Reference Levey, Stevens and Schmid 15 ). Although the overall percentage of participants classified with CKD was lower when using the CKD-EPI equation than the MDRD study equation, there was a greater proportion of obese participants in the CKD-EPI-classified CKD group than in the MDRD-defined CKD group. The CKD-EPI equation has good agreement with measured GFR in obese patients with CKD( Reference Lemoine, Guebre-Egziabher and Sens 20 ), therefore lowering the risk of misclassification, which may explain, at least partially, why the risk of CKD with obesity is greater using CKD-EPI-defined eGFR.
In the Hypertension Detection and Follow Up Program population, obese patients with hypertension, a known risk factor for CKD, had a fully adjusted risk of CKD 23 % higher than normal-weight hypertensive patients( Reference Kramer, Luke and Bidani 2 ), indicating that the added risk of obesity for CKD in populations with other identified CKD risk factors may be lower than in studies of mixed or apparently healthy community populations. The independent risk of obesity may appear higher in the ‘healthy’ obese populations, not because the absolute risk is any higher, but because the difference in risk between the groups is reduced. In ‘healthy’ populations, the comparator group lacks other contributing risk factors for CKD that are present in the populations with existing CVD and hypertension.
The evidence presented in the current study demonstrates a concomitant relationship between obesity and CKD in a nationally representative, randomly selected sample from the English population. Given the epidemic rise in population obesity rates in the UK( 14 ), it is recommended that obesity be considered as a risk factor for CKD in guidelines for detection of CKD and that future national health service delivery planning considers interventions to prevent and retard the development and progression of CKD.
Acknowledgements
Acknowledgements: HSE 2010 data were made available by the Information Centre for Health and Social Care (copyright 2012, reused with the permission of the UK Data Service). Financial support: This work was supported by a doctoral research fellowship funded by King’s College Hospital NHS Foundation Trust. King’s College Hospital NHS Foundation Trust had no role in the design, analysis or writing of this article. Conflict of interest: None. Authorship: All authors provided substantial contributions to study conception, design and interpretation of data. H.L.M. analysed the data and drafted the initial manuscript. All authors were involved in revising the manuscript critically for important intellectual content and approved the final version to be published. Ethics of human subject participation: Ethical approval to use the HSE data set was not required.


