


1. Introduction
Agriculture is the backbone of the Rwandan economy, accounting for about 63 per cent of the export earning, 31 per cent of the gross domestic product (GDP) and employing 75 per cent of the labor force (CIA, 2019). Farming in Rwanda remains largely subsistence in nature with an average size of 0.6 ha per agricultural household consisting of mainly fragmented plots of land (Innocent et al., Reference Innocent, Ranganathan and Vasanthakaalam2018). Agriculture in Rwanda is the most vulnerable sector to climatic change as most of agricultural production is mainly small-scale and dependent on rainfall (Gasheja and Gatemberezi, Reference Gasheja and Gatemberezi2017; Republic of Rwanda, 2018). Irregular rainfall and interruption of rainy seasons lead to late planting with negative effects on agricultural production in the country (Mikova et al., Reference Mikova, Makupa and Kayumba2015). According to Bird et al. (Reference Bird, Chabe-Ferret and Simons2022), the triple challenges of acute land scarcity, low capabilities and a sluggish non-farm economy in Rwanda lock together to form a nexus which limits sustained poverty escapes. The Stockholm Environment Institute (SEI, 2009) reported that Rwanda was not adequately adapted to the prevailing climate risks, and hence, climate change could cause economic losses of at least 1 per cent GDP annually by 2030.
In many countries, agricultural extension has been recognized as a critical component for technology transfer, playing a starring role in supporting small-scale agriculture and in achieving food security (Rickards et al., Reference Rickards, Alexandra, Jolley and Frewer2018). Rwanda's Twigire Muhinzi decentralized, farmer-to-farmer agricultural extension system employs Farmer Field Schools (FFS) and village-level Farmer Promoters (FP) to reach most of the country's farmers (Innocent et al., Reference Innocent, Ranganathan and Vasanthakaalam2018; MacNairn and Davis, Reference MacNairn and Davis2018). FPs and FFS facilitators are responsible for transferring knowledge and coordinating practices within their communities. These volunteer lead farmers receive training through the Rwanda Agriculture Board, and guidance and technical support from agricultural professionals employed by district- and sector-level local government.
Climate services – which involve the production, translation, transfer, and use of climate knowledge and information in relevant decision-making, policy and planning – aim to enable decision-makers, from national to local levels, to better manage the risks of climate variability and change at all levels (Vogel et al., Reference Vogel, Steynor and Manyuchi2019). Climate services are a critical component of an enabling environment for climate change adaptation (Hansen et al., Reference Hansen, Furlow, Goddard, Nissan, Vaughan, Rose, Fiondella, Braun, Steynor, Jack, Chinowsky, Thomson, Baethgen, Dinku, Yirgu, Do, Phuong, Huq and Ndiaye2019). Empirical evidence suggests that African smallholder farmers are receiving and using climate services to make changes in farming practices, increase the value of crop production and improve livelihood decisions that enhance their resilience to climate shocks (e.g., Gbetibouo et al., Reference Gbetibouo, Hill, Joseph, Mills, Snyman and Huyser2017; Hansen et al., Reference Hansen, Fara, Milliken, Boyce, Chang'a and Allis2018; McKune et al., Reference McKune, Poulsen, Russo, Devereux, Faas, McOmber and Ryley2018; Tiitmamer and Mayai, Reference Tiitmamer and Mayai2018; Muasa and Matsuda, Reference Muasa and Matsuda2019; Nkiaka et al., Reference Nkiaka, Taylor, Dougill, Antwi-Agyei, Fournier, Bosire, Konte, Lawal, Mutai, Mwangi, Ticehurst, Toure and Warnaars2019; Vaughan et al., Reference Vaughan, Hansen, Roudier, Watkiss and Carr2019; Chiputwa et al., Reference Chiputwa, Blundo-Canto, Steward, Andrieu and Ndiaye2022).
In most African countries, climate services are disseminated free of charge mainly through radio broadcasts (Hampson et al., Reference Hampson, Chapota, Emmanuel, Tall, Huggins-Rao, Leclair, Perkins, Kaur and Hansen2014; World Bank, 2016; Muema et al., Reference Muema, Mburu, Coulibaly and Mutune2018; Tesfaye et al., Reference Tesfaye, Hansen, Kassie, Radeny and Solomon2019), mobile phone and extension agents (Churi et al., Reference Churi, Mlozi, Tumbo and Casmir2012; Etwire et al., Reference Etwire, Buah, Ouedraogo, Zougmor, Partey, Martey, Dayamba and Bayala2017; Tesfaye et al., Reference Tesfaye, Hansen, Kassie, Radeny and Solomon2019). Provision of these services free of charge shows its public nature (Freebairn and Zillman, Reference Freebairn and Zillman2002). The provision of climate services as a public goodFootnote 1 makes it difficult to limit their supply only to those who are willing to contribute to the costs of supplying them (Freebairn and Zillman, Reference Freebairn and Zillman2002; Gunasekera, Reference Gunasekera2002). However, a significant economic feature of information is that it is expensive to produce, but relatively cheap to reproduce. This property suggests that economic efficiency is served by making climate services freely available as a public good (Freebairn and Zillman, Reference Freebairn and Zillman2002). Although the actual and potential benefits to the community from climate services are substantial, when provided freely, these benefits are inadequately recognized and insufficiently exploited (Gunasekera, Reference Gunasekera and Gunasekera2004). Understanding how climate services help the various sectors of society to make informed decisions and reduce risks as well as to outline what changes would be needed to improve decision making is crucial (World Bank, 2008). Similarly, identifying the value of the services can motivate users to be willing to pay for the existing or improved services. It can also help justify funding and guide priorities to invest in managing the impacts of weather and climate across economic sectors (Zillman, Reference Zillman2005).
This study was part of a bigger survey implemented to support an ex-post evaluation of the Rwandan Climate Services for Agriculture (RCSA) project funded by the United States Agency for International Development. The project was implemented from 2016 to 2019. Through the project, climate services were disseminated directly to more than 111,000 farmers in four provinces across Rwanda through Participatory Integrated Climate Services for Agriculture (PICSA), Radio Listener Clubs (RLCs) and cell phones, as well as broadcast by a radio network accessible to about 70 per cent of the population.
This study aims to assess how Rwandan farmers value the general features of improved climate services, investigate their willingness to pay (WTP) to provide insights into how the products and services can be improved, and estimate how project interventions influenced perceived value of climate services. The specific objectives of this study are: (i) identify the preferred package of improved agricultural climate services; (ii) assess preference heterogeneityFootnote 2; and (iii) estimate WTP values among Rwandan farmers – as influenced by participation in PICSA and RLCs. The contribution of this study is novel as the approach presented here introduced a choice experiment (CE) method which allowed farmers who were participating in treatment and control groups to choose among the different characteristics of improved climate services. This study adds to the set of recent studies conducted in Africa (Zongo et al., Reference Zongo, Diarra, Barbier, Zorom, Yacouba and Dogot2016; Amegnaglo et al., Reference Amegnaglo, Anaman, Mensah-Bonsu, Onumah and Gero2017; Ouédraogo et al., Reference Ouédraogo, Barry, Zougmore, Partey, Some and Baki2018; Donkoh, Reference Donkoh2019; Tesfaye et al., Reference Tesfaye, Hansen, Kassie, Radeny and Solomon2019) that report the value smallholder farmers attach to the different characteristics of climate services. Section 2 explains the methodology. Section 3 presents and discusses results, and section 4 concludes with relevant policy implications.
2. Methodology
2.1 The random utility model
Individuals' preferences are modelled in terms of McFadden's (Reference McFadden and Zarembka1974) random utility model. The random utility model can be approximated by the multinomial logit model. In such models, the utility to individual N ($n$ = 1, 2, … 1,525) from choosing alternative improved climate services J ($j$
 = 0, 1, 2) on choice situation $T$
 ($t$
($t$ = 1, 2, … 12) is represented by a utility expression of the general form in equation (1) (Train, Reference Train2003):

The component observed by the analyst, ${x_{njt}}$ , is a vector of independent variables including attributes of the improved climate service alternatives, socio-demographic characteristics of the individual, and descriptors of the decision context and choice task. The components $\beta$
 and ${\varepsilon _{njt}}$
 are not observed by the analyst and are treated as stochastic influences (Hensher and Greene, Reference Hensher and Greene2003). $\beta$
 is a corresponding vector of utility weights that are homogeneous across individuals and ${\varepsilon _{njt}}$
 ~ i.i.d. extreme value type I is the individual specific error component (Kanninen, Reference Kanninen2007).
Individuals are expected to differ in terms of the weather and climate events they face and the bundle of improved climate services they prefer. To account for such preference heterogeneity, the taste parameters for the attributes are allowed to differ across individuals, applying different mixing distributions. The mixed logit is a highly flexible model that can approximate any random utility model (McFadden and Train, Reference McFadden and Train2000). It obviates the three limitations of standard logit by allowing for random taste variation, and correlation in unobserved factors over time (McFadden and Train, Reference McFadden and Train2000). In the mixed logit model, the utility to individual n from choosing alternative improved climate services j on choice situation t is presented as equation (2):

where ${\beta _n}$ is a corresponding vector of utility coefficients that vary randomly over individuals, and ${\varepsilon _{njt}}$
 is a random term that represents the unobserved component of utility. The vector of observed attributes, ${x_{njt}}$
 , can include binary (0/1) terms to allow for alternative specific constants and for individual attribute levels as well as continuous attributes. The unobserved term ${\varepsilon _{njt}}$
 is assumed to be i.i.d. extreme value. The main feature of the mixed logit model is its ability to account for the unobserved heterogeneity; however, the model fails to explain the sources of heterogeneity (Hynes et al., Reference Hynes, Hanley and Scarpa2008). Due to this drawback, interactions of individual specific characteristics can be included with choice-specific attributes in the utility function to improve the model fit (Revelt and Train, Reference Revelt and Train1998). A common objective in the use of discrete choice models is the derivation of measures designed to determine the amount of money individuals are willing to pay to obtain some benefits from a specific task (Hensher et al., Reference Hensher, Rose and Greene2005). In this study, the estimation of farmers' WTP for improved climate services follows the standard practice of calculating the ratio of the attribute's coefficient to the price coefficient holding all else constant.
2.2 Experimental design
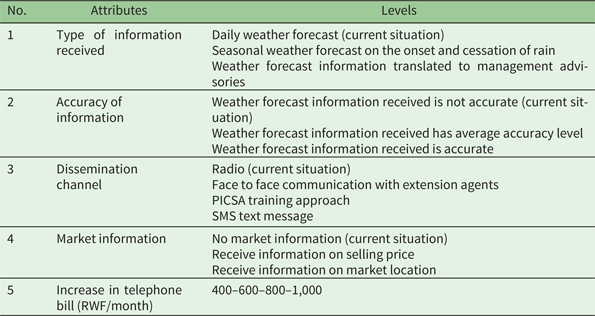
This study considers attributes of climate services including type of climate information received, accuracy of the information, dissemination channel, and synergistic market information. The different characteristics of improved climate services are traded off against the monthly telephone bill which is relatively higher than they currently pay. The different attributes and their levels were selected based on a literature review, focus group discussions, key informant interviews and pretesting.
To test farmers' preference for improved climate information, they were presented with three different types of information: daily weather forecasts, seasonal forecasts of rainfall onset and cessation dates, and farm management advisories. Daily weather forecasts were the baseline, while seasonal onset and cessation forecasts, and management advisories were presented as improved suites of information. Seasonal onset and cessation forecasts provide the opportunity to select more appropriate crops and varieties, and adjust timing of planting (Bryan et al., Reference Bryan, Deressa, Gbetibouo and Ringler2009; Gunda et al., Reference Gunda, Bazuin, Nay and Yeung2017). Advisories translate weather and climate information into farm management recommendations, such as sowing, transplantation of crops, and fertilizer application, which can be used directly to improve and protect farm productivity and income (Chattopadhyay and Chandras, Reference Chattopadhyay and Chandras2018; Roy and Rani, Reference Roy and Rani2018). The accuracy of climate information influences its use and value for farm decision-making (Clements et al., Reference Clements, Ray and Anderson2013; Vaughan et al., Reference Vaughan, Hansen, Roudier, Watkiss and Carr2019). In this CE design, accuracy of climate information was described in three different levels: ‘not accurate’ described in terms of 0 per cent accuracy level, ‘average accuracy’ described as 40 per cent accurate, and ‘accurate’ described as 80 per cent accurate. These accuracy levels are somewhat stylized, and the enumerators did not define what the accuracy percentages referred to.
The preference among communication channels to access climate services was tested by taking radio-based dissemination as the baseline. One of the improvements introduced was face-to-face communication with extension agents. The second improvement introduced was the PICSA approach, which trains and facilitates farmers to make informed decisions based on location-specific climate information (Dorward et al., Reference Dorward, Clarkson and Stern2015). Empirical evidence in Rwanda and elsewhere (Dayamba et al., Reference Dayamba, Ky-Dembelea, Bayalaa, Dorward, Clarkson, Sanogo, Mamadoud, Traorée, Diakitéa, Nenkam, Binama, Ouedraogog and Zougmoreg2018; Clarkson et al., Reference Clarkson, Dorward, Osbahr, Torgbor and Kankam-Boadu2019; Birachi et al., Reference Birachi, Hansen, Radeny, Mutua, Mbugua, Munyangeri, Rose, Chiputwa, Solomon, Zebiak and Kagabo2020) demonstrated that the PICSA training approach em-powered farmers to adapt a range of farm and livelihood management decisions to their local climate. The third improvement over the dominant radio-based dissemination considered was mobile phone text message (SMS), which research in Ghana and Ethiopia showed farmers prefer over radio (Etwire et al., Reference Etwire, Buah, Ouedraogo, Zougmor, Partey, Martey, Dayamba and Bayala2017; Tesfaye et al., Reference Tesfaye, Hansen, Kassie, Radeny and Solomon2019).
Market information can inform farmers' decisions about when and where to sell their produce (Shepherd, Reference Shepherd2011; Courtois and Subervie, Reference Courtois and Subervie2015). Bundling climate services with market information exploits synergies that can increase the value of both (Haile et al., Reference Haile, Kalkuhl and Usman2015). This study tested farmers' preference for bundling climate services with market information by presenting them with two improved levels: (i) information on selling price, and (ii) information on market location to sell their produce, and assuming no market information as the baseline.
To understand the trade-off farmers would make among the different attributes of improved climate services, a monetary amount with different levels was introduced. This amount is an increase in the monthly telephone bill of farmers ranging from 400 to 1,000 Rwandan francs (RWF).Footnote 3 These monetary values were based on focus group discussion and key informant interviews. The choice cards were generated using D-efficient design in NgeneFootnote 4 software version 1. In order to get priors for a Bayesian efficient design, parameter estimates from literature review of related studies were used. Table 1 presents the different attributes and their levels.
List of attributes and their levels
2.3 Sampling design and survey implementation
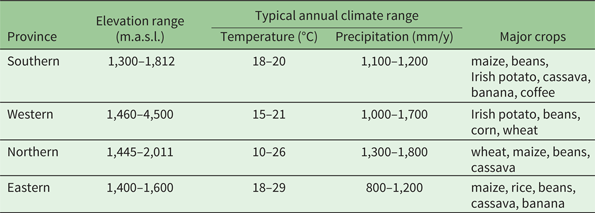
The CE was incorporated into a survey conducted in November 2019 to evaluate RCSA project climate service interventions (Birachi et al., Reference Birachi, Hansen, Radeny, Mutua, Mbugua, Munyangeri, Rose, Chiputwa, Solomon, Zebiak and Kagabo2020). Data were collected from 1,525 household heads sampled from 15 of Rwanda's 30 districts, across all four provinces (table 2), using a farm household survey and trained enumerators who speak the local Kinyarwanda language. The sampling design aimed to provide representative samples of participants in each intervention (PICSA only (n = 395)), RLC only (n = 321), and PICSA + RLC (n = 182)), and a control sample of farmers from sectors where the interventions were not implemented (n = 627). A multistage sampling procedure was used. Within each province, districts where both interventions had been implemented were randomly sampled (three in Western province, four each in the others). Within each selected district, two sectors were randomly selected for a given treatment and in each sector, cells and villages were randomly selected. In each village, proportional sampling was used to achieve the target sample size of 1,525 households and a balance of men and women. The survey was pretested in all survey districts by participating farmers who were not part of the main survey. Based on the feedback from the pretest, the survey questions were modified prior to data collection.
Characteristics of each province in the study
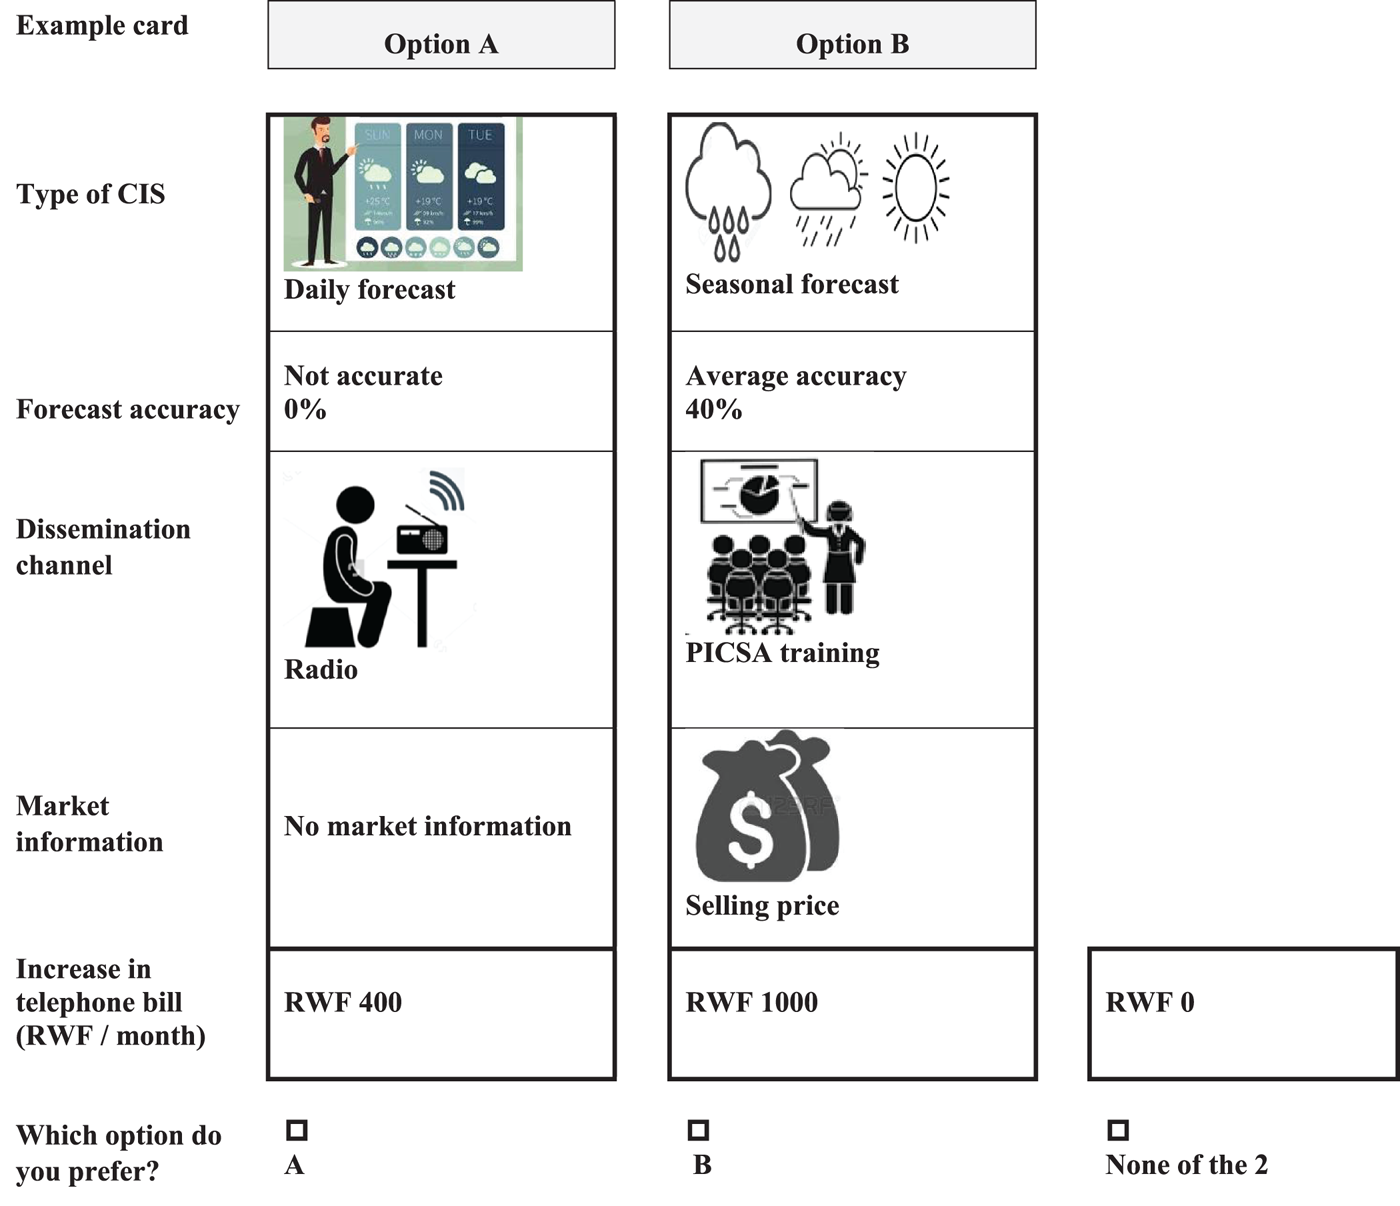
Enumerators for the evaluation survey were also trained to present pairs of climate services alternatives, along with an opt-out option that gave respondents the chance to choose neither option. In cases where respondents chose the opt-out option 12 times, they were asked why. Enumerators memorized an introductory text that explained the attributes and their levels. To address the issue of hypothetical bias, following Ladenburg and Olsen (Reference Ladenburg and Olsen2014), enumerators repeatedly reminded each respondent that they could opt out if they thought the proposed improved alternatives in the choice set were not affordable. In order to make sure farmers had a clear understanding of the choice task, before the experiment started enumerators asked respondents to make their choice using an example card, explained that each card would be independent from the previous card, and gave them the opportunity to ask questions. To help respondents understand the choice task more consistently, attributes and their levels were presented using pictograms. Figure 1 shows an example card that was presented to respondents.
Example choice card.
3. Results and discussion
3.1 Household characteristics
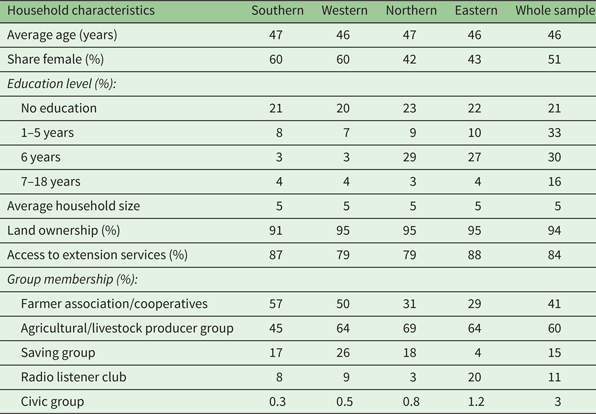
Table 3 presents the general household characteristics across the four provinces. The majority (51 per cent) of the sample respondents were female. The average age of respondents was 46. The average household had five members. About a third of the respondents had formal education of up to 6 years while 21 per cent did not go to school. The remaining respondents had different levels of higher education. Almost all the households (94 per cent) owned land. More than 80 per cent of the respondents had access to extension services. Most respondents (71 per cent) were members of farmer associations or cooperatives, including agriculture-livestock producer groups, saving groups, RLCs developed by the RCSA project, and civic groups.
General household characteristics of sample respondents across the four provinces
3.2 Dissemination channels and awareness about climate services
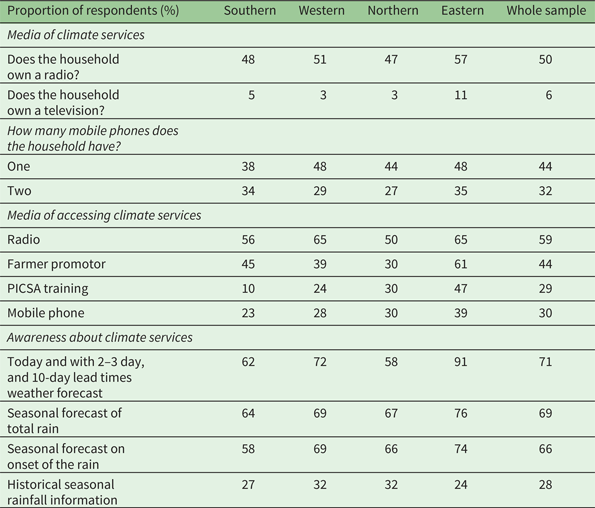
Half of the respondents reported that they owned radios. Respondents who did not own a radio accessed information from their neighbors, community shops, children and spouses. Some mentioned that they did not have access at all. Television was owned by very few respondents. About 76 per cent of the respondents owned one or two mobile phones. Most of these were basic phones, and only a few were smart phones. Those who did not own mobile phones got access from their spouse and neighbors. Fifty-nine per cent of respondents identified radio as their main means of accessing weather and climate information. Radio Rwanda and Radio Huguka (105.9FM) were the main sources of forecast information. Farmer Promoters,Footnote 5 PICSA, and mobile phones were also identified as important channels for accessing climate information. Television did not play any role in accessing these services. When respondents were asked if they were aware of forecasts for today, and with 2–3-day and 10-day lead times, more than 70 per cent confirmed that they are aware of and access such information. A similar proportion of respondents (69 per cent) was aware of seasonal forecasts of total rain, and 66 per cent were aware of seasonal forecasts of the timing of the onset of the rainy season. Only 28 per cent of the respondents were aware of historical information about seasonal rainfall. Table 4 presents the share of respondents using different dissemination channels and their awareness about climate services across the four provinces.
Dissemination channels and awareness about climate services
3.3 Choice model results
The choice share across the three alternatives (the two improved situations and the opt-out option) indicated the positive attitude of respondents toward the proposed improvement in climate services. The first improved alternative was chosen in 36 per cent of the cases and the second was chosen in 47 per cent of the cases. Most of those who chose neither of the two explained that they could not afford to pay extra for improved climate services, while a few more suggested that they were not interested in the proposed improvement. Nearly half of the respondents (49 per cent) said that both alternatives presented to them were very credible, 35 per cent reported they were somewhat credible, and the rest were divided between those who mentioned that it is not credible and those who said, ‘I don't know.’ Almost all (95 per cent) stated that they understood the content of the choice cards. More than 40 per cent reported that the accuracy of climate information was the most important characteristic of the improvement that influenced their decision. About 25 per cent stated that market information influenced their decision, and one-fifth mentioned the dissemination channel as an important characteristic. For about 12 per cent, the type of climate information was the reason for their choice.
The CE data was analyzed using NLOGIT software version 4. Estimates of marginal WTP and standard errors were calculated using the Wald procedure. All attribute levels included in the model were effects coded and treated as random variables with normal distribution and estimated using Halton sequence of 100 random draws. In our model specification, we assigned the alternative specific constant (ASC) as the current situation (status quo). The CE data was disaggregated into four groups while estimating attributes of improved climate services, preference heterogeneity and WTP values. Four models (table 5) were run representing three treatments and a control group that the RCSA project implemented for ex-post evaluation. The three treatment groups were the PICSA training group, the RLC, and those who were involved in both groups (PICSA + RLC), and the control group represented respondents who neither received PICSA training nor were members of the RLC. All four models produced consistent results for attribute levels such as seasonal forecasts, average and accurate forecast information, face-to-face communication, PICSA training and market price information. In the three models, the value of the monetary attribute was negative and significant as expected, allowing for estimating WTP values. In the RLC model, however, the monetary value turned positive and insignificant implying there was no trade-off between the different attributes of climate services and the payment, that is, the price attribute did not influence the respondents' choice behavior. This result is inconsistent with the intuitive understanding of rational economic behavior. Following the insignificant price attribute, we did not estimate WTP value since calculating a measure of WTP needs both attributes to be statistically significant in order to establish a meaningful WTP measure.
Choice model results for treatment and control groups
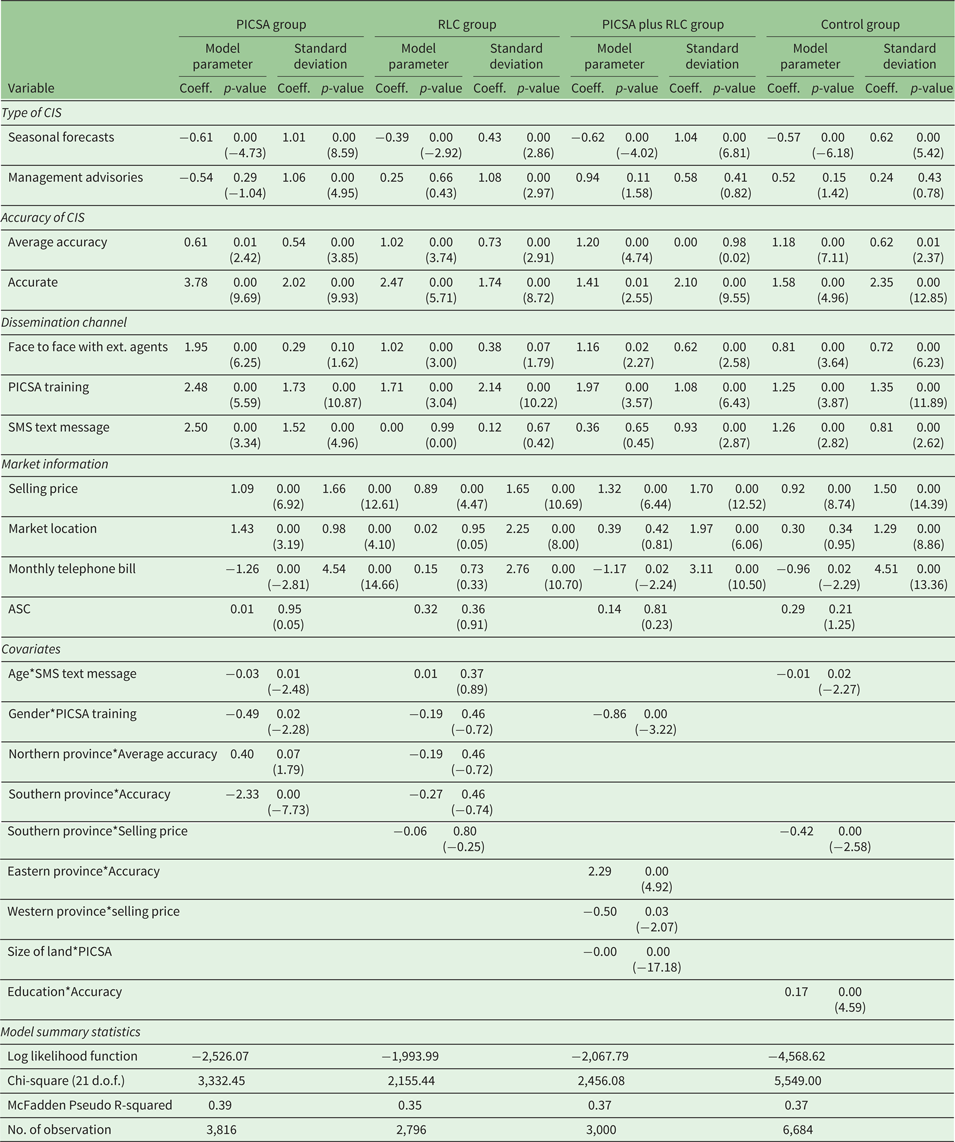
Note: T- ratio in parentheses.
In all four models, respondents preferred daily weather forecasts over the seasonal forecast. This finding was contrary to recent studies that reported the benefits of seasonal forecasts in increasing agricultural income of African farmers and their WTP for these services (e.g., Amegnaglo et al., Reference Amegnaglo, Anaman, Mensah-Bonsu, Onumah and Gero2017; Gunda et al., Reference Gunda, Bazuin, Nay and Yeung2017; Ouédraogo et al., Reference Ouédraogo, Barry, Zougmore, Partey, Some and Baki2018). Unlike studies that argue for the benefits of farm management advisories (e.g., Chattopadhyay and Chandras, Reference Chattopadhyay and Chandras2018; Ramachandrappa et al., Reference Ramachandrappa, Thimmegowda, Krishnamurthy, Srikanth-Babu, Savitha, Srinivasarao, Gopinath and Ravindra-Chary2018), no significant relationship could be detected between farmers choice behavior and advisories in this study. The importance of accuracy of climate information was reflected in the significant positive value respondents attached to the average and high level of accuracy. This result was consistent in all four models. This is also highlighted in the literature (e.g., Hansen et al., Reference Hansen, Furlow, Goddard, Nissan, Vaughan, Rose, Fiondella, Braun, Steynor, Jack, Chinowsky, Thomson, Baethgen, Dinku, Yirgu, Do, Phuong, Huq and Ndiaye2019; Vaughan et al., Reference Vaughan, Hansen, Roudier, Watkiss and Carr2019) where providing farmers with accurate climate information services helps them to make informed decisions that improve agricultural production and enhance agricultural income and food security.
The other interesting finding was the significant positive value respondents attached to the climate information communication channels. In all four models, face-to-face communication with extension agents and the PICSA approach were both highly valued by respondents compared to radio-based dissemination. SMS text message was significantly valued in the PICSA and control models. Rwandan farmers' preference for face-to-face communication of climate information through agricultural extension workers may indicate how well these development agents are performing in carrying out their duties and are therefore trusted by farmers. Respondents' interest in the PICSA training approach in the dissemination of climate information may shed light on the importance of the approach in enabling farmers to make informed decisions by taking advantage of the participatory tools. We also note that these two attributes are not independent, as PICSA was facilitated by FPs and other extension personnel. Similarly, farmers' preference for SMS text messages compared to radio is consistent with studies such as Tesfaye et al. (Reference Tesfaye, Hansen, Kassie, Radeny and Solomon2019) who reported the result of a similar study conducted among Ethiopian farmers, and Churi et al. (Reference Churi, Mlozi, Tumbo and Casmir2012) who examined farmers' information communication approaches for handling climate risks in rural semi-arid areas in Tanzania. Results across all models showed that access to market price information was very important to inform farming decisions. This finding is consistent with studies conducted in other African countries, such as Magesa et al. (Reference Magesa, Michael and Ko2014) who reported the importance of access to agricultural market information to farmers in rural Tanzania, and Arinloye et al. (Reference Arinloye, Linnemann, Hagelaar, Omta, Coulibaly, van Boekel, Bijman and Bitzer2016) who assessed the role market prices play in decreasing transaction costs among Ghanaian farmers and the positive WTP for market price information among Beninese farmers. Information on market location was preferred as an important package for improved climate services only in the PICSA model.
Looking at preference heterogeneity, important covariates that resulted in sources of preference heterogeneity among respondents in the choice of attributes of improved climate services included: age, gender, education level, size of land holding and province. There was a significant negative relationship between age of the respondent and preference for SMS text messages in the PICSA and control groups. The implication of this may be that older respondents were not interested in receiving climate services through SMS text message as elderly populations, particularly across Sub-Saharan Africa, have higher illiteracy rates (UIS, 2016). When the attribute, the PICSA approach, was interacted with gender of the respondents, the result showed a significant inverse relationship, and this was consistent in both the PICSA and PICSA + RLC treatment models. This might indicate that the PICSA training approach was not the preferred means of disseminating climate services among female respondents. One possible explanation could be that these training sessions usually take place when women are engaged in family care work and unable to attend. This highlights the importance of designing trainings and meetings to enable easy participation of both men and women.
Similarly, in the PICSA + RLC group, respondents with bigger land size were not interested in the PICSA approach as a means of communicating the information. In the control group, educated respondents were in favor of accurate climate information. Similarly, the preference for accurate information was detected in Eastern province among respondents who were involved in the PICSA + RLC group and average accuracy was preferred in Northern province among the PICSA group. Contrary to expectation, respondents in Southern province who were involved in the PICSA group were not interested in accurate information. No preference was observed for access to market price information among respondents in the PICSA + RLC and control groups in Western and Southern provinces, respectively. These results are contrary to expectation and may need further investigation.
3.4 Marginal willingness to pay (MWTP)
Table 6 shows MWTP of respondents for improved climate services across the two treatment groups and the control group. Respondents in the PICSA group are willing to pay on average US$3 per month for receiving accurate climate information. This is the highest average amount when comparing the three groups. The second highest amount was US$1.98 per month that was attached to SMS by the same group. Respondents in the PICSA, PICSA + RLC and control groups were willing to pay US$1.96, 1.68 and 1.29, respectively, to get climate information through the PICSA training approach. Those respondents in the PICSA group were also willing to pay US$1.54 per month for communicating face-to-face with extension agents to receive climate services. If climate services are provided together with market price and location information, respondents in the PICSA + RLC group are willing to pay US$1.2 for accessing market price information and those in the PICSA group are willing to pay US$1.1 per month to receive information on market location.
Estimated MWTP values across the two treatments and the control group
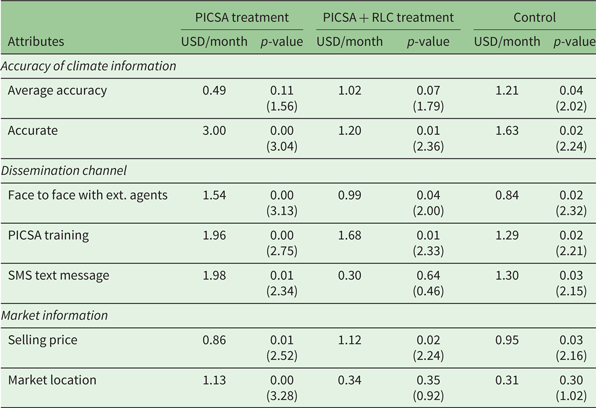
Note: T-ratio in parentheses.
4. Conclusions
This study analyzed the preferred package of improved climate services, assessed preference heterogeneity and estimated WTP values among Rwandan farmers using data from 1,525 randomly selected household heads across four provinces in November 2019. A random parameters logit model was used to analyze the data. The estimation was conducted by breaking down the data into three treatment groups and a control group that were set up by the RCSA project to evaluate the effectiveness of PICSA and RLCs in improving farmers' awareness of and access to climate services in informing farmers' decision-making.
The results in all four models suggest that Rwandan farmers would value: accurate weather forecasts, disseminated through a combination of extension agents and the PICSA training approach, bundled with market price information, as a way to improve their farming and livelihood decisions. Comparing the four groups, respondents in the PICSA group significantly value all the improved characteristics of climate services introduced as a package except for management advisories. The importance of the preferred package of improved climate services was reflected in the WTP values respondents attached to the different characteristics of these services. Particularly in the PICSA group, receiving accurate climate information scored the highest WTP value. Household characteristics such as age, gender, education level, land holding, and location (province) were significant covariates that influenced preference for improved climate services among respondents in the three groups.
This study suggests that to improve agricultural management planning and food security of farmers through the provision of climate services, these services need to be accurate, user-tailored and accessible. To improve the accuracy of climate information, development of modern infrastructure could facilitate the generation of timely and accurate climate information. Capacity building of experts involved in the generation, translation and dissemination of these services would enhance their ability to communicate user tailored climate services. As shown in this study, age and gender were detected as significant sources of taste heterogeneity where older respondents were not interested in receiving climate information services in SMS text messages, and female respondents were not interested in the PICSA training approach as a means of obtaining climate services. Hence, the use of suitable communication channels may benefit the different end users. By providing farmers with market information, it is likely to increase their bargaining power with traders and reduce negotiation failure. Hence, setting up a reliable market information system bundled with climate services may help farmers make informed decisions. Integrating climate services into the policy and resource allocation process may help promote farmers livelihood and food security.
Acknowledgements
This paper is an output of the Rwandan Climate Services for Agriculture project. The project is funded by the United States Agency for International Development (USAID) with grant number AID BFS-G-11-00002-10. Co-funding from World Bank - AICCRA (Accelerating Impacts of CGIAR Climate Research for Africa) for Eastern and Southern Africa regional project is gratefully acknowledged. The opinions expressed herein are those of the author(s) and do not necessarily reflect the views of USAID or the United States Government, or the co-sponsoring or supporting organizations. Special thanks go to Yvonne Munyangeri of CIAT Rwanda for helping in organizing key informant interviews and focus group discussions in the four provinces of Rwanda and assisting with translation when needed. We are grateful to district level officials and experts who contributed to the key informant interviews and farmers who participated in the focus group discussions. A word of thanks also goes to the enumerators who collected the household data and the respondents who spent time to provide the required information.
Conflict of interest
The authors declare none.


 Open access