


1. Introduction
Environmental efficiency is essential as it not only serves as a cornerstone for economic growth but also acts as a pivotal force driving sustainable competitiveness (Balsalobre-Lorente et al., Reference Balsalobre-Lorente, Nur, Topaloglu and Evcimen2024a). One effective approach to bolstering sustainable competitiveness and preparing nations for a low-carbon economy is by prioritizing environmental efficiency (Liu et al., Reference Liu, Shao, Min and Ji2024). The advantages of environmental efficiency are evident. By aiding industries in minimizing environmental impact, it enhances resource productivity and minimizes waste generation (Giganti and Falcone, Reference Giganti and Falcone2025). Moreover, reduced environmental impact transmutes into lower costs for firms, providing them with greater financial stability and flexibility to invest in sustainable practices and innovation (Safitri et al., Reference Safitri, Sari and Gamayuni2020). Additionally, environmental efficiency initiatives generate employment opportunities across various sectors and contribute to the overall well-being of communities (Rafei et al., Reference Rafei, Esmaeili and Balsalobre-Lorente2022; Pillan et al., Reference Pillan, Costa and Caiola2023). By prioritizing environmental efficiency, nations can not only achieve economic growth but also strengthen their position in the global market while safeguarding natural resources for future generations (Ibrahim et al., Reference Ibrahim, Alola and Ferreira2023).
To achieve this objective, numerous policymakers around the globe have introduced a range of measures aimed at mitigating environmental degradation and addressing the challenges of climate change (Barra et al., Reference Barra, Falcone and Giganti2025). Financial development (FD) is a successful method for improving environmental quality since it encompasses the provision of financial resources that are linked to both environmental and socioeconomic sustainability (Aljadani, Reference Aljadani2022). The relationship between economic growth and FD is symbiotic, as institutional funding directed towards private investors has the capacity to fuel long-term economic expansion (Udeagha and Breitenbach, Reference Udeagha and Breitenbach2023). The adequate availability of financial resources facilitates the advancement of new and effective technologies that are both energy-efficient and environmentally sustainable (Falcone and Sica, Reference Falcone and Sica2023). In this regard, Majeed and Mazhar (Reference Majeed and Mazhar2019) demonstrated that FD promotes the use of clean and advanced technology, encourages research and development efforts and offers technical and financial support to businesses. FD is crucial for solving climate change, as supported by several reasons in theoretical study, as it enables the engagement of private and public sector investors in clean energy initiatives, minimizes the necessity for risk diversification and lowers intermediary expenses (Nasir et al., Reference Nasir, Huynh and Tram2019).
However, the association between FD and environmental sustainability is still debated (Guang-Wen et al., Reference Guang-Wen, Murshed, Siddik, Alam, Balsalobre-Lorente and Mahmood2023). The recent economic and financial downturn has underscored the repercussions of malfunctioning within the financial system, impacting not only economic progress but also the prospects for sustainable development (Bădîrcea et al., Reference Bădîrcea, Doran, Manta, Puiu, Meghisan-Toma and Doran2023). Despite notable strides made by corporations and financial entities towards embracing sustainability in the past decade, a significant portion of financial capital continues to flow towards environmentally harmful economic pursuits that lack resource efficiency (Caferra and Falcone, Reference Caferra and Falcone2022). Therefore, FD can have a negative impact on environmental quality by promoting economic expansion, which leads to increased production and consumption, as well as higher fossil-based energy consumption and pollution emissions (Pata, Reference Pata2018).
In this context, institutional quality is crucial as it lays the foundation for establishing the essential conditions that promote FD while fostering a robust and inclusive financial ecosystem supportive of environmentally sustainable economic activities (Khan et al., Reference Khan, Khan and Zuojun2022). High-quality institutions are characterized by transparency, accountability and the rule of law, which foster trust and confidence among investors (Barra and Papaccio, Reference Barra and Papaccio2023). Furthermore, institutional quality involves governance structures that encourage justice and equality of access to financial services, ensuring that all segments of society can participate in and benefit from FD (Corrado, Reference Corrado2020). This inclusivity is crucial for leveraging the full potential of financial markets to drive economic growth and promote environmental sustainability.
Additionally, institutions can facilitate the adoption of policies and incentives that incentivize investments in green finance and sustainable development initiatives, thus aligning FD with environmental objectives (Fu et al., Reference Fu, Lu and Pirabi2023). Institutions set the ‘rules of the game’, shaping incentives, ensuring accountability and enforcing environmental regulations. Strong institutions can channel financial resources towards green technologies, renewable energy and sustainable practices. Conversely, weak governance risks diverting finance into rent-seeking, pollution-intensive activities and short-term gains at the expense of long-term sustainability.
Despite its relevance, the interplay between institutional quality, FD and environmental outcomes remains underexplored. Only a few studies address this gap. Hunjra et al. (Reference Hunjra, Tayachi, Chani, Verhoeven and Mehmood2020) highlight the moderating role of institutional quality in South Asia, while Zakaria and Bibi (Reference Zakaria and Bibi2019) analyse its direct impact alongside growth, trade and foreign investment. These contributions are valuable but limited: they focus narrowly on South Asian economies, adopt restricted environmental measures (mainly CO2 emissions), and rely largely on causality tests that overlook efficiency dynamics. As a result, current evidence fails to fully capture how finance and institutions jointly shape environmental efficiency – defined as maximizing desirable outputs (gross domestic product [GDP]) while minimizing undesirable ones (emissions).
This study seeks to fill these gaps by offering a twofold contribution. First, it applies a stochastic frontier framework with a directional distance function, treating GDP as a desirable output and CO2 emissions as an undesirable one, while incorporating FD and institutional quality directly into the inefficiency term. This allows for a richer and more detailed assessment of how these factors jointly influence environmental efficiency. Building on Mills et al. (Reference Mills, Dong, Yiling, Baafi, Li and Zeng2021), the analysis extends the literature by explicitly integrating external drivers of inefficiency, particularly institutional quality and FD. Second, the study examines the moderating role of institutional quality, asking whether stronger institutions can mitigate the potentially adverse environmental impacts of FD. Importantly, we move beyond aggregate indices and explore a wide array of FD dimensions – such as depth, access and efficiency of both financial institutions and financial markets – to uncover heterogeneity in their effects.
By addressing these questions, the paper aims to shed light on the conditions under which FD contributes to or undermines environmental sustainability, and to highlight the pivotal role that institutional quality plays in steering this relationship. Specifically, the study is guided by three research questions:
RQ1. Does financial development significantly influence environmental inefficiency?
RQ2. What is the impact of institutional quality on environmental inefficiency?
RQ3. Does institutional quality moderate the relationship between financial development and environmental inefficiency?
To investigate our research questions, we employ a dataset consisting of 133 countries spanning a wide time frame from 2006 to 2018. The data was sourced from various publicly available datasets, resulting in an unbalanced sample with 1,285 observations.
Our empirical results offer key insights that extend the existing literature. FD emerges as a crucial driver of environmental sustainability, showing a strong negative association with environmental inefficiency. Institutional quality also plays a pivotal role, exhibiting an inverse relationship with environmental inefficiency. Furthermore, institutional quality moderates the link between FD and environmental outcomes, suggesting that strong governance frameworks amplify the positive environmental effects of FD.
2. Literature review
In this section, we concentrate on research examining the correlation between FD and its implications for environmental sustainability (Section 2.1), along with the significance of institutional quality (Section 2.2). Through this exploration, our goal is to briefly pinpoint any research gaps present in the current literature (Section 2.3).
2.1. The nexus of FD and environmental sustainability
The literature highlights that FD can generate both positive and negative environmental outcomes over the long term. On the one hand, it has been a key driver of business modernization, economic prosperity and sustainable development by facilitating access to financial resources for technological advancement (Soetan and Mogaji, Reference Soetan and Mogaji2024). On the other hand, FD is fundamental to economic growth more broadly, as it promotes capital accumulation through allocation, pooling and savings, while also enhancing knowledge and efficiency in investment and resource distribution (Bonsu et al., Reference Bonsu, Wang, Nartey and Amala2025).
Numerous empirical studies have looked at the environmental effects of FD. However, the conclusions drawn from these studies have been disputed and discordant due to various experimental methods and economies analysed (Udeagha and Breitenbach, Reference Udeagha and Breitenbach2023). FD allows companies to adopt more advanced technologies, which promotes environmentally friendly and energy-efficient operations, according to various studies (Fareed et al., Reference Fareed, Rehman, Adebayo, Wang, Ahmad and Shahzad2022). This group of studies also found that a better financial system reduces CO2 emissions by advancing energy and technology, improving investment efficacy, extending business opportunities and improving organization performance (Ali et al., Reference Ali, Bakhsh, Ullah, Ullah and Ullah2021). It facilitates money flows and exchange of goods and services needed for sustainable development, expanding international relations (Samour et al., Reference Samour, Moyo and Tursoy2022). FD also accelerates economic operations, initiates R&D and attracts FDI to renewable resources initiatives to promote sustainability (Ullah et al., Reference Ullah, Nadeem, Ali and Abbas2022). A robust financial sector not only lowers funding rates and streamlines procurement processes but also mitigates oil pollution by improving energy sector efficiency (Melhim and Isaifan, Reference Melhim and Isaifan2025).
While proponents argue that it could lead to positive outcomes, opponents suggest that FD might exacerbate environmental challenges by driving up household and industrial energy demand. For example, Acheampong (Reference Acheampong2019) examines both the direct and indirect effects of FD on CO2 emissions and reveals that FD contributes to the overall increase in CO2 emissions. Moreover, the author identifies that FD plays a moderating role in the relationship between GDP and energy consumption, thereby exerting an influence on CO2 emissions. Similarly, Khan et al. (Reference Khan, Khan and Rehan2020) observed a degradation in environmental quality attributed to FD in China's emerging economy during the period from 1987 to 2017. This finding was corroborated by Shahbaz et al. (Reference Shahbaz, Haouas, Sohag and Ozturk2020), who examined the UAE as a case study using the ARDL bounds testing approach and found evidence supporting the detrimental impact of FD on the environment. Jianguo et al. (Reference Jianguo, Ali, Alnori and Ullah2022) concluded that FD enhances household purchasing power and expenditure, leading to increased CO2 emissions and environmental degradation in OECD economies. This group of studies acknowledges the detrimental effect of FD on the environment, suggesting that it directs resources towards less environmentally friendly corporate investments, thereby impeding efforts towards sustainability (Jahanger et al., Reference Jahanger, Usman and Balsalobre‐Lorente2022).
A brief mention exists in the literature highlighting the broader significance of institutional quality in influencing the environmental outcomes of financial systems. Through an analysis of panel data spanning from 1984 to 2015, Zakaria and Bibi (Reference Zakaria and Bibi2019) demonstrated that FD in South Asian nations resulted in environmental degradation, suggesting a prioritization of capitalization over technological progress. Additionally, the study identified institutional quality as playing a significant moderating role in this context. This perspective aligns with literature suggesting that the impact of FD on sustainable economic growth is more pronounced in developed countries compared to developing ones, largely due to disparities in institutional quality (Oro and Alagidede, Reference Oro and Alagidede2019).
2.2. The relationship between institutional quality and environmental efficiency
There is consensus among scholars that poor institutional quality is linked to decreased efficiency. This is attributed to three primary factors: firstly, it imposes costs on innovators, diverting resources away from productive activities; secondly, it diminishes incentives for investing in innovative sectors of the economy; and thirdly, it impedes the diffusion of knowledge, leading to the proliferation of generic rather than specialized forms of capital and discouraging foreign direct investments (Méon and Weill, Reference Méon and Weill2005). Effective institutions are essential for promoting equitable development, governmental efficacy, resource allocation and environmental protection in a market-based economy (Ju et al., Reference Ju, Andriamahery, Qamruzzaman and Kor2023; Balsalobre-Lorente et al., Reference Balsalobre-Lorente, Nur, Topaloglu and Evcimen2024b). The effectiveness of democratic institutions, the size of the government bureaucracy, the extent of corruption, respect for the law, political stability, regulatory standards and others are some of the indicators used in the literature as proxies for the appraisal of institutional quality of a country (Barra and Falcone, Reference Barra and Falcone2024a).
The presence of democratic institutions is paramount. According to Bernauer and Koubi (Reference Bernauer and Koubi2009), nations with robust democratic institutions carry out environmental policy implementation more effectively. Free and fair elections, alongside press freedom, are vital pillars of robust democratic institutions, acting as crucial mechanisms for overseeing and balancing the powers of the executive branch of government (Rose-Ackerman and Palifka, Reference Rose-Ackerman and Palifka2016). Press freedom, which is recognized as being successful in influencing public opinion regarding problems, supports this (Riti et al., Reference Riti, Shu and Kamah2021). Recent years have seen a significant increase in the public's awareness of environmental issues, thanks in large part to the media (Zhang and Skoric, Reference Zhang and Skoric2018). The environmental issues are now established among the regularly and even routinely reported topics of the news agenda, and this induces politicians and incumbent administrations to take action against polluters (Lyytimäki, Reference Lyytimäki, Sachsman and Valenti2020).
Yet, the effectiveness of environmental policy implementation can be substantially impacted by governmental bureaucracy (Falcone and Hiete, Reference Falcone and Hiete2019). Businesses are encouraged to embrace eco-innovation technologies as part of their strategy to lower their carbon footprint when there is less government bureaucracy in terms of regulatory approval and compliance costs (Ge et al., Reference Ge, Li, Sha and Hao2020; Nam and Thanh, Reference Nam and Thanh2021). According to Ward (Reference Ward2008), among the main distorting channels weakening the environmental quality, bureaucratic inefficiency is crucial, especially if accompanied by the instability of institutions.
Political stability represents fertile ground for economic growth (Ullah et al., Reference Ullah, Diao and Abbas2024). In nations without violent armed battles, military takeovers, or societal turmoil, private ventures frequently prosper. It can also be claimed that encouraging businesses to invest in eco-innovation or green technology benefits from a stable government environment. According to Kuo and Smith (Reference Kuo and Smith2018), businesses are more likely to green invest if they exclude future political unrest because it is expensive, irreversible, time-consuming and complex. Moreover, a stable political ground enables the provision of green subsidies and the establishment of eco-friendly tax structures (Lu et al., Reference Lu, Kweh, Nourani and Lin2021).
Previous research demonstrates that when the judicial system is effective and independent and laws are properly enforced, businesses tend to comply strictly with environmental rules (i.e., carbon emission standards) (Campbell, Reference Campbell2007). In these situations, businesses typically follow carbon emissions standards to protect themselves from litigation threats (Luo, Reference Luo2019). However, Liu et al. (Reference Liu, Wu, Guo and Fang2021) show that polluting businesses frequently acquire and merge with businesses based in host nations with ineffective and corrupted legal systems and less environmental regulation enforcement in order to engage in regulatory arbitrage. Indeed, the degree of corruption affects how laws and regulations are put into action and explains socio-economic differences among poor and rich countries (Sekkat, Reference Sekkat2023). The effects of corruption on the deterioration of environmental quality are shown by earlier studies on energy and environmental economics. According to research (Desheng et al., Reference Desheng, Jiakui and Ning2021; Ren et al., Reference Ren, Hao and Wu2021; Asif et al., Reference Asif, Sabir and Qayyum2024), corrupt practices are undeniably linked to the erosion of environmental legislation, leading to environmental degradation.
To incentivize businesses to adopt eco-innovation technologies in their manufacturing processes, robust legal protection of intellectual property rights is essential. Without adequate protection and enforcement of proprietary rules, businesses are less inclined to invest in eco-innovation technologies (Tran and Bui, Reference Tran and Bui2025). Latupeirissa and Adhariani (Reference Latupeirissa and Adhariani2020), for instance, discover that Indonesian enterprises’ adoption of eco-innovation fails to elicit a favourable response from capital markets; one factor contributing to this is Indonesia's lax enforcement of intellectual property rights. According to the theory of economic regulation, there is a strong relationship between diverse economic outcomes and regulatory quality (Stigler, Reference Stigler2021). Higher regulatory quality can also develop a better allocation of resources, hence lessening the undesirable impact on the environment (Dong et al., Reference Dong, Ma, Zhang, Zhang, Chen, Song, Shen and Xiang2020). In the context of the relationship between institutional quality and CO2 emissions, research consistently indicates that institutional quality plays a vital role in promoting environmental sustainability (Hassan and Khan, Reference Hassan and Khan2025). Khan et al. (Reference Khan, Weili and Khan2021) scrutinize the correlation between environmental indicators, institutional quality and technological progress using panel data spanning from 2002 to 2018. Their investigation reveals various institutional quality variables influencing the emission of environmental carbon dioxide. Similar findings are echoed in the studies conducted by Wawrzyniak and Doryń (Reference Wawrzyniak and Doryń2020), Haldar and Sethi (Reference Haldar and Sethi2021) and Hussain and Dogan (Reference Hussain and Dogan2021). Conversely, studies by Mehmood et al. (Reference Mehmood, Tariq, Ul-Haq and Meo2021) and Alam et al. (Reference Alam, Hashmi, Jamil, Murshed, Mahmood and Alam2022) reveal neutral effects.
2.3. Literature gaps
While considerable progress has been made in exploring the complex relationships among FD, environmental inefficiency and institutional quality, significant gaps remain in the existing literature. Although prior studies have examined the direct impacts of FD on environmental outcomes, there is a pressing need for more refined analyses that account for the multifaceted interplay between different FD indicators and environmental inefficiency. Furthermore, most research has predominantly addressed the influence of institutional quality on environmental efficiency, leaving a notable void regarding how institutional quality moderates the relationship between FD and environmental outcomes. Additionally, to date, no study has employed a comprehensive panel dataset covering 133 countries worldwide to investigate the effects of FD on environmental efficiency from a global perspective.
A key contribution of this study is the application of a directional distance function within the stochastic frontier analysis framework. This approach enables the integration of external factors such as institutional quality alongside various FD measures, thereby illuminating the moderating role of these variables in shaping the nexus between FD and environmental performance. Moreover, our analysis incorporates multiple dimensions of FD – including indicators related to financial institutions, financial markets and a composite FD index (detailed in Section 4.2). This multidimensional approach strengthens the robustness of our findings and provides a more comprehensive understanding of the environment–finance relationship. By addressing these gaps, our research offers valuable insights for policymakers and stakeholders aiming to design effective strategies that promote environmental sustainability while fostering FD globally.
3. Empirical design: stochastic environment distance frontier
In our empirical analysis, the stochastic environment distance frontier adopts a traditional functional form (i.e., Cobb-Douglas), adhering to conventional practice (Barra and Falcone, Reference Barra and Falcone2023, Reference Barra and Falcone2024b) and diverging from primary empirical research approaches. This adaptability enables more specialized production technology modelling. Our model integrates a CO2 emissions output to assess countries’ environmental efficiency within the production function framework. Additionally, the application of Hausman's testFootnote 1 validates the utilization of fixed effects in our panel data analysis, as evidenced by the significant rejection of the null hypothesis (p-value nearing 0).Footnote 2
This method distinguishes itself from traditional parametric techniques by simultaneously managing multiple outputs, addressing a notable limitation of parametric approaches. Moreover, in comparison to non-parametric methods like data envelopment analysis, it enables the establishment of a functional relationship between inputs and outputs, enhancing the understanding of input-output dynamics. Once more, it expands on production theory's distance function idea and can include time patterns, environmental factors and panel data structures. Put another way, it can be incorporated into more comprehensive econometric frameworks to provide more in-depth economic insights. Furthermore, the parametric approach remains less sensitive to the presence of outliers and data irregularities, common challenges in non-parametric techniques that can distort estimates. Finally, in addition to offering more flexibility and depth in the temporal analysis and efficiency dynamics, the parametric approach also permits more economic interpretability.Footnote 3 Because of these characteristics, the parametric approach is more suitable than the nonparametric approach in our context.
For simplicity, our formulation herein excludes a constant term and time subscript, although the inefficiency component is acknowledged to be time-varying to explore temporal changes in environmental (in)efficiency. Following a similar formulation outlined in Barra and Falcone (Reference Barra and Falcone2024b), we formally describe the ‘output oriented’ stochastic environment distance model as follows:
 \begin{equation}{\text{ln}}(DIST_i^{oo}) = \mathop \sum \limits_{n = 1}^N {\hat \beta _n}{\text{ln}}({{\boldsymbol{Y}}_{ni}}) + \mathop \sum \limits_{p = 1}^P {\hat \theta _p}{\text{ln}}({{\boldsymbol{X}}_{pi}}) + {v_i}\,,\end{equation}
 where  $ln$ stands for the natural logarithmic, ${\boldsymbol{Y}}$ represents the outputs vector for decision-making unit $i$ (i.e., country) (at time $t$) (i.e., real GDP per capita and CO2), while ${\boldsymbol{X}}$ denotes the inputs vector for decision-making unit $i$ (i.e., country) (at time $t$) (i.e., labour force, capital, population) (for further information regarding the production set, see Section 4.2).Footnote 4 As commonly used in the parametric method, in order to ensure linear homogeneity of degree 1 into outputs (i.e. $\mathop \sum \limits_{n = i}^N {\hat \beta _n} = 1$), we normalize by ${{\boldsymbol{Y}}_i}$ (Lovell et al., Reference Lovell, Travers, Richardson, Wood and Eichhorn1994). After this canonical transformation, it is possible to re-write the ‘output oriented’ stochastic environment distance model as follows:
 \begin{equation}\ln \left( {\frac{{DIST_i^{oo}}}{{{{\boldsymbol{Y}}_i}}}} \right) = \mathop \sum \limits_{n = 1}^N {\hat \beta _n}{\text{ln}}\left( {\frac{{{{\boldsymbol{Y}}_{ni}}}}{{{{\boldsymbol{Y}}_i}}}} \right) + \mathop \sum \limits_{p = 1}^P {\hat \theta _p}{\text{ln}}({{\boldsymbol{X}}_{pi}}) + {v_i}.\end{equation} ${\text{A}}$According to this simple transformation, ${{\boldsymbol{Y}}_i} = 1$. It is clear that ${\text{ln}}(DIST_i^{oo})$ is not discernible. To address and solve this issue, we can re-write it as follows: $\left( {\frac{{DIST_i^{oo}}}{{{{\boldsymbol{Y}}_i}}}} \right) = {\text{ln}}(DIST_i^{oo}) - {\text{ln}}\left( {{{\boldsymbol{Y}}_i}} \right)$. Moving ${\text{ln}}(DIST_i^{oo})$ to the residuals, i.e., on the right hand side of the equation, we employ $ - {\text{ln}}\left( {{{\boldsymbol{Y}}_i}} \right)$ as dependent variable (i.e., real GDP per capita)Footnote 5 (Coelli and Perelman, Reference Coelli and Perelman2000). In accordance with Paul et al. (Reference Paul, Johnston and Frengley2000), we impose ${\text{ln}}\left( {{{\boldsymbol{Y}}_i}} \right)$. As a result, Equation (2) can be re-written as follows:
 \begin{equation}{\text{ln}}\left( {{{\boldsymbol{Y}}_i}} \right) = \mathop \sum \limits_{n = 1}^N {\hat \beta _n}{\text{ln}}\left( {\frac{{{{\boldsymbol{Y}}_{ni}}}}{{{{\boldsymbol{Y}}_i}}}} \right) + \mathop \sum \limits_{p = 1}^P {\hat \theta _p}{\text{ln}}({{\boldsymbol{X}}_{pi}}) + {v_i} - {u_i}\,.\end{equation}
 where  $u$ term represents the inefficiency component, which is derived from the distribution's truncation to zero $N({n_i},\sigma _u^2$). Compared to other distribution types, such as half normal, this one allows us to model the mean of the inefficiency component. Formally, the term $n$ (i.e., the mean of the distribution) can be defined as follows:
 \begin{equation}{n_i} = \hat \rho + \hat \varphi {{\boldsymbol{Z}}_i},\end{equation}
 where  $\hat \rho $ indicates the location parameter, ${\boldsymbol{Z}}$ is a vector of factors of (environmental) in-efficiency such as: Financial Development, Trade, Technological progress, Land area, Urban population, Quality of Institutions (see Section 4.2 for more details on the controls incorporated in the inefficiency component), while $\hat \varphi $ represents a vector of unknown coefficients. Moreover, $v$ term (as reported in Equation (3)) represents the vector of random variables that are thought to be independent of the $u$ and identically distributed (i.i.d.) $N(0,\sigma _v^2$). In simpler terms, the inefficiency of country $i$ (i.e., decision-making unit) is expected to consistently change based on certain factors. This approach, which incorporates controls directly into the (mean) inefficiency component, enables us to resolve econometric issues (like correlation) that might occur if an alternative approach, like the two-stage method, is employed. To strengthen our model specification against potential criticism, time dummies are included in the frontier and inefficiency component to consider external factors or changes in the business cycle that might affect the decision-making units’ production process. Additionally, to account for sample heterogeneity, such as in the technological gaps, we included region dummies in the frontier. To ensure uniformity in the data (2006–2018 timeframe) and prevent non-stationary issues that could lead to bias in the estimation, all monetary aggregates are adjusted to 2010 dollars. All estimations presented are conducted using STATA (18) software.
4. Data and production set
4.1. Data
To investigate the impact of FD indicators on environmental inefficiency and whether institutional quality mitigates the link, we aggregated numerous datasets using the alpha three-digit code (ISO3). We can rely on an unbalanced heterogeneous sample of 133 countries.Footnote 6 This spatial stratification will help us better understand how FD indicators influence environmental inefficiency.
4.2. The production set
The data spans multiple countries over a long period of time (2006–2018), and it was collected using publicly available data from a variety of sources. The unbalanced sample comprises of 133 countries, each of which submitted data for 30 years, resulting in 1,285 observations.Footnote 7 According to the available literature (Zhang, Reference Zhang2008; Derbyshire et al., Reference Derbyshire, Gardiner and Waights2013), the production technique is stated with three inputs: Labour force (X1) comprises people ages 15 and older who supply labour for the production of goods and services during a specified period (data from Penn World Table); Capital (X2) consists of outlays on additions to the fixed assets of the economy plus net changes in the level of inventories in current US$ (data from Penn World Table); Population (X3) based on the de facto definition of population, which counts all residents regardless of legal status or citizenship (data from the World Bank's World Development Indicators database).
Moving on to the output side, the model includes two variables that indicate the output growth research functions of countries (similar to Barra and Falcone (Reference Barra and Falcone2024b)). (1) GDP (Y1) (Desirable): the sum of gross value added by all resident producers in the economy plus any product taxes and minus any subsidies not included in the value of the products in current US$ (data from Penn World Table); Carbon dioxide (Y2) (Undesirable): carbon dioxide emissions from the consumption of energy include emissions due to the consumption of petroleum, natural gas and coal, and also from natural gas flaring (data from the API (Application Programming Interface) database). Considering carbon dioxide to be a negative or undesired output, we insert a helpful piece of information to measure environmental performance, thus improving and completing the canonical production set. This method provides a better juxtaposition to the frontier (Barra and Falcone, Reference Barra and Falcone2024).
We enter the following five external factors into the previously described Z vector (see Mills et al., Reference Mills, Dong, Yiling, Baafi, Li and Zeng2021). More information about the production set's composition can be found in Table 1. (1) Trade (Z1): the sum of exports and imports of goods and services (data from the World Bank's World Development Indicators database); (2) Technological progress (Z2): comprises the number of patent applications by residents and non-residents (data from the World Bank's World Development Indicators database). (3) Land area (Z3): is a country's total area, excluding area under inland water bodies, national claims to continental shelf and exclusive economic zones (data from the World Bank's World Development Indicators database); (4) Urban population (Z4): people living in urban areas as defined by national statistical offices (data from the World Bank's World Development Indicators database); (5) Quality of Institutions (Z5). Moreover, unlike Mills et al. (Reference Mills, Dong, Yiling, Baafi, Li and Zeng2021), we consider different dimensions of FD, such as financial institutions (FI) (Model 1), financial markets (FM) (Model 2) and a composite indicator, i.e., FD indicator (FD) (Model 3) (data from the IMF's Financial Development Index database). As further robustness, we also adopt the following sub-indicators of FD, i.e., financial institutions depth (FID); financial institutions access (FIA); financial institutions efficiency (FIE); financial markets depth (FMD); financial markets access (FMA); and financial markets efficiency (FME) (data from the IMF's Financial Development Index Database).
The production set and other variables

Note: Authors’ elaboration. ‘u’ stands for inefficiency component. ‘E(u)’ stands for mean of inefficiency component following truncated-normal distribution. For further information on the variables defined in the production set and the inefficiency component, see Table A1, online appendix. All variables are taken in logarithmic scale, except for institutional quality. FD, composed of FI and FM. FI, composed of FID, FIA and FIE. FM, composed of FMD, FMA and FME. See online appendix Table A4 for the detailed composition of the variables.
Finally, to capture the overall effect of institutional quality on the environmental inefficiency–FD nexus, we use the World Bank Governance Indicators dataset (developed by Kaufmann et al. (Reference Kaufmann, Kraay and Mastruzzi2009)). We use the composite indicator considering the average of all six indicators: control of corruption, government effectiveness, political stability, rule of law, regulatory quality and voice and accountability (see Barra and Falcone, Reference Barra and Falcone2024). This indicator (Z5) lies in the range [−2.5, 2.5]. Higher scores imply higher institutional quality.
Apart from institutional quality, the rest of the controls are taken on logarithmic scale. Finally, as described in Section 3, time dummies are incorporated into both the frontier and inefficiency component to account for exogenous or business cycle effects that may impact the production process of the decision-making units, namely countries, while region dummies are included in the frontier to adjust for sample heterogeneity, such as technology gaps.
5. Results and discussions
5.1. The environmental performance
Table 2 displays the environmental efficiency including FD indicators (i.e., FI, FM and FD) in the inefficiency component.Footnote 8 To further appreciate the differences between countries, we present the environmental efficiency scores for the 133 countries under investigation,Footnote 9 considering their category, region and income level (see Table 2). Finally, the dynamics throughout time are given. As expected, wealthy countries outperform developing countries in all three models, with scores of 12 per cent in Model 1, 11 per cent in Model 2 and 7 per cent in Model 3. NA countries outperform other regions, followed by EAP, ECA, LAC, MENA, SA and then SSA countries (the region abbreviations are defined in Table 2). This allows us to emphasize that countries with high income levels outperform low-income ones in terms of environmental performance.Footnote 10 This finding is corroborated by previous research in this field (Milindi and Inglesi-Lotz, Reference Milindi and Inglesi-Lotz2022; Yu et al., Reference Yu, Yamaguchi and Kittner2022).
Environmental efficiency: benchmark model

Note: Own elaboration. Model 1: including financial institutions index (FI). Model 2: including financial markets index (FM). Model 3: including financial development index (FD).
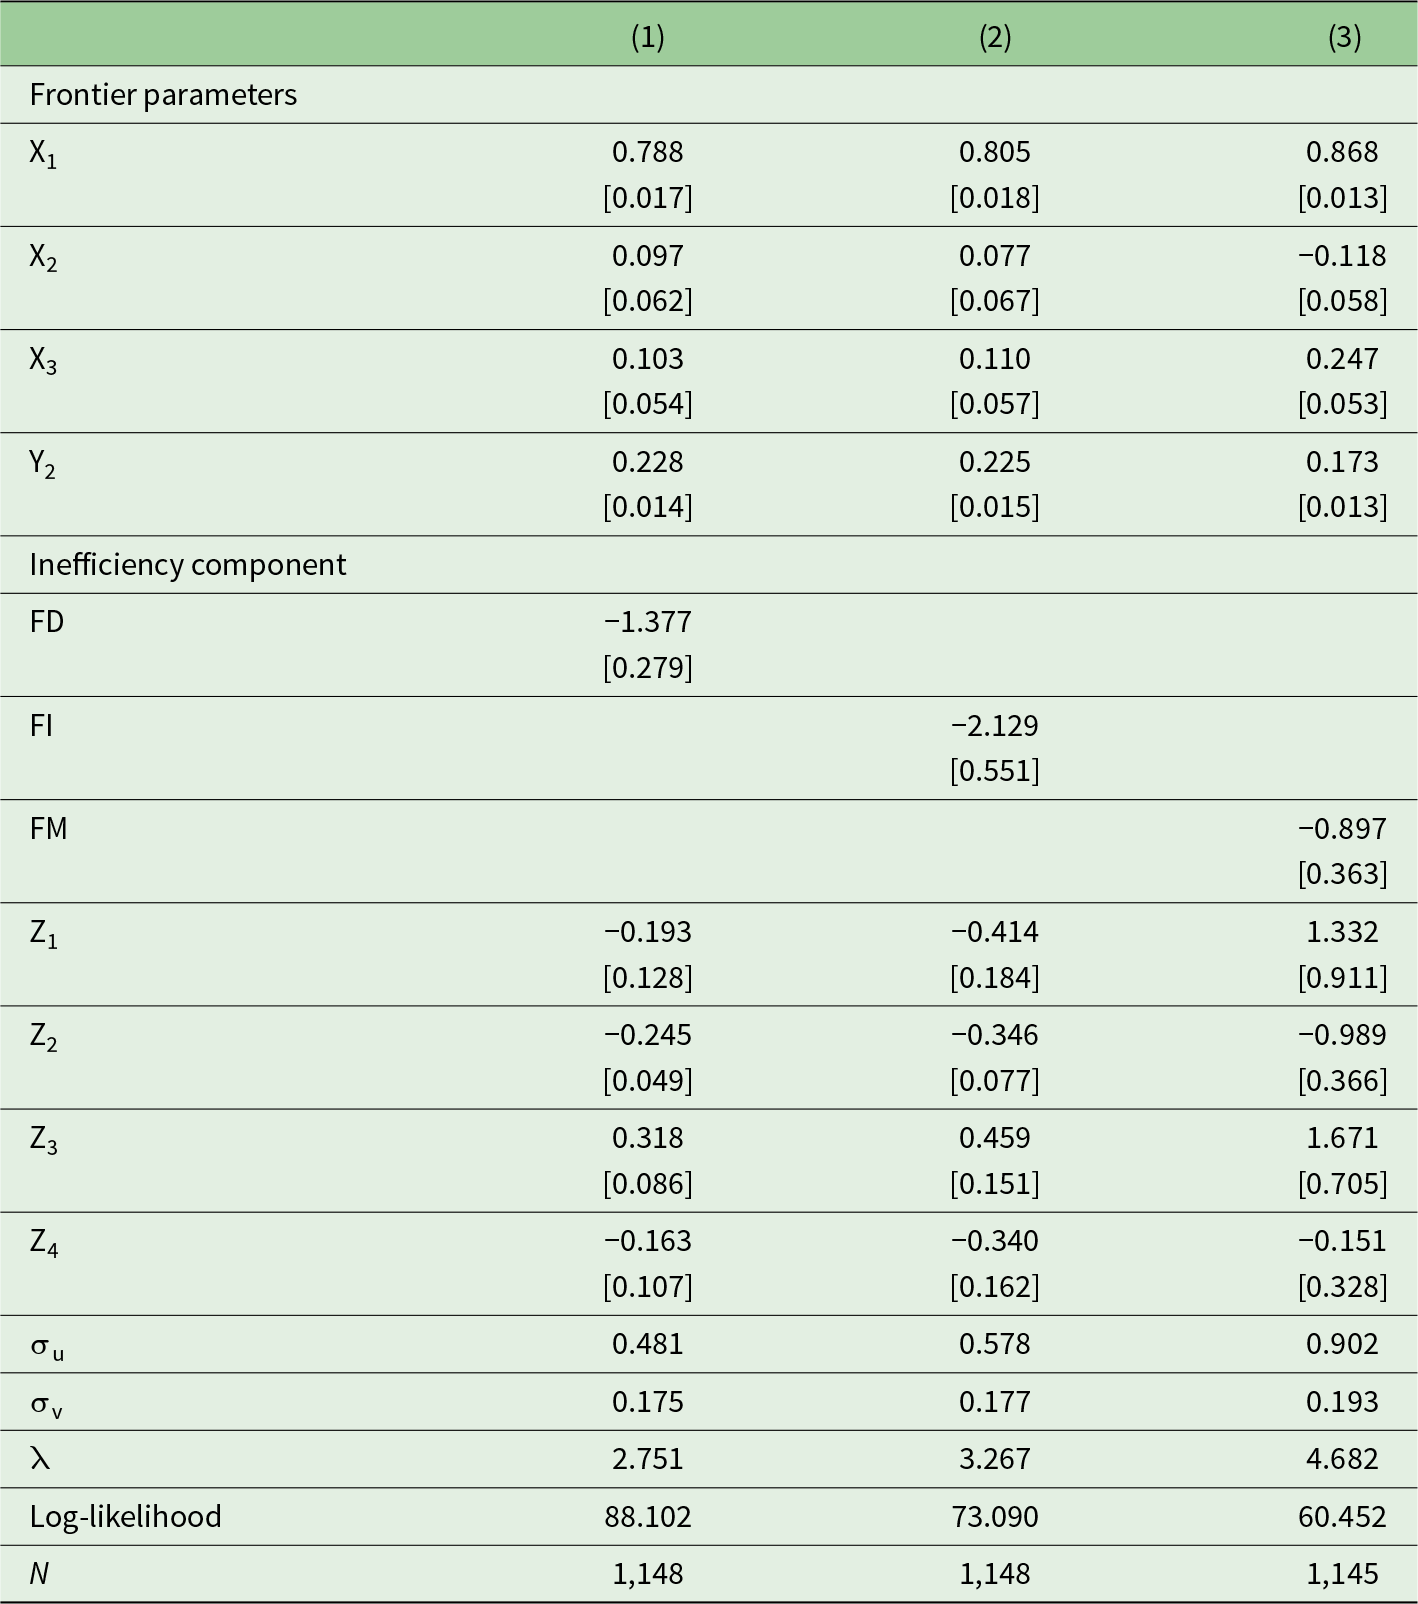
5.2. The impact of FD on environmental inefficiency: the benchmark
Table 3 describes the main findings of our benchmark model, focusing on the role of FD indicators (i.e., FI, FM and FD) on environmental inefficiency, while ignoring institutional quality. In general, there is strong evidence that an increased composite indicator of FD helps to reduce environmental inefficiency (column (1)). In other words, economically developed countries frequently offer more financing options for renewable energy and clean technology. When we divide the FD into its components, FI (column (2)) and FM (column (3)), the same finding is confirmed. Then, businesses can invest in less polluting and energy-efficient technologies thanks to financial availability. In this way, financial markets and institutions can direct funds into R&D for advancements in the environment.
Stochastic frontier estimates: benchmark

Note: Robust standard errors in brackets; Time FE is included in both the frontier and the inefficiency component, whereas region FE is included in the frontier. All variables, except Z5, are in logarithmic scale. σu, variance of inefficiency term. σv, variance of stochastic error term. λ, σu/σv. For further information on the variables defined in the production set and the inefficiency component, see Section 4.2.
Consequently, efficient capital allocation by well-functioning financial markets not only reduces resource waste but also incentivizes investments in environmentally friendly technologies and sustainable business practices. By directing funds towards green projects, renewable energy and low-carbon initiatives, healthy financial systems can shape corporate behaviour and consumer choices towards more ecologically responsible outcomes. This mechanism aligns with and is supported by recent empirical evidence highlighting the role of FD in promoting environmental sustainability (Milindi and Inglesi-Lotz, Reference Milindi and Inglesi-Lotz2022; Usman and Balsalobre-Lorente, Reference Usman and Balsalobre-Lorente2022). Specifically, higher levels of FD are associated with lower environmental inefficiency.Footnote 11 When focusing on control variables, technological progress (Z2) exhibits a negative relationship with environmental inefficiency, implying that advancements in technology may contribute to lower carbon emissions. Moreover, land area (Z3) and urban population (Z4) both display positive associations with environmental inefficiency. This observation is consistent with existing literature (Xie et al., Reference Xie, Wu and Wang2021; Zhou et al., Reference Zhou, Chen, Tang and Mei2021), which indicates that regions with larger land areas and denser urban populations tend to exhibit higher carbon emissions. The relationship reflects the combined effects of increased energy consumption, transportation demands and industrial activity associated with urban expansion and extensive territorial coverage.
5.3. The role of institutional quality
We will now provide some evidence of the impact of institutional quality on environmental inefficiency. This mechanism allows us to investigate if the most virtuous countries in terms of institutional integrity may perform better on environmental challenges, resulting in lower CO2 emissions. As stated in Section 4.2, we use a composite indicator of institutional quality that is the average of all six variables obtained from the World Bank Governance variables dataset (produced by Kaufmann et al. (Reference Kaufmann, Kraay and Mastruzzi2009)). To save space, we will only address the effect of both FD and institutional quality on environmental inefficiency.
Table 4 highlights the impact of FD on environmental inefficiency, with a focus on institutional quality. The analysis reaffirms that robust FD contributes to mitigating environmental inefficiency (column (1)). The same conclusion is supported once again when we break down the FD into two indicators: FI (column (2)) and FM (column (3)).
Stochastic frontier estimates: the role of institutional quality

Note: Robust standard errors in brackets. Time FE is included in both the frontier and the inefficiency component, whereas region FE is included in the frontier. All variables, except Z5, are taken in logarithmic scale. σu, variance of inefficiency term. σv, variance of stochastic error term. λ, σu/σv. For further information on the variables defined in the production set and the inefficiency component, see Section 4.2.
Furthermore, the observed negative and statistically significant impact of institutional quality (Z5) on environmental inefficiency highlights the critical link between stronger institutions and lower carbon emissions. Economies characterized by robust institutional frameworks – encompassing control of corruption, rule of law, regulatory quality, government effectiveness and political stability – tend to exhibit reduced environmental inefficiency. This finding corroborates prior studies demonstrating that higher institutional quality is associated with lower carbon emissions and improved environmental performance (Aldieri et al., Reference Aldieri, Barra, Ruggiero and Vinci2020; Haldar and Sethi, Reference Haldar and Sethi2021).
The evidence underscores the essential role of effective governance in enforcing environmental regulations and promoting sustainable practices across economic sectors. Countries with well-developed financial systems and strong institutional frameworks are better positioned to implement environmental policies and incentives, thereby encouraging firms to adopt cleaner technologies and environmentally friendly practices (Salman et al., Reference Salman, Long, Dauda and Mensah2019). Moreover, efficient financial institutions can facilitate targeted investments in sustainable projects and green technologies, further contributing to reductions in environmental impact (Taghizadeh-Hesary and Yoshino, Reference Taghizadeh-Hesary and Yoshino2020).
5.4. The moderating role of institutional quality
One of the most important areas of study in environmental economics and sustainable development is the moderating effect of institutions on the relationship between finance and environment. This idea centres on how institutional quality either amplifies the good effects or lessens the negative ones in the relationship between FD and environmental inefficiency. Formally, by adding the interaction term between FD and institutional quality (i.e., FD*Z5) to the previously mentioned model, the moderating effect of institutional quality on the nexus is captured. If the interaction is negative, we might conclude that FD is positively correlated with environmental performance in countries with higher levels of institutional quality (e.g., regulatory quality, rule of law and corruption). Table 5 shows the influence of FD on environmental inefficiency, accounting for the moderating role of institutional quality. Overall, our findings strongly indicate that countries with higher levels of FD tend to exhibit reduced environmental inefficiency (columns (1), (2) and (3)). Moreover, we observe that institutional quality plays a significant role in lowering environmental inefficiency. Importantly, our analysis reveals a quite weak moderating effect of institutional quality (when the FI index is used; column (2)), indicating that developing countries are most likely to be the primary cause of this result. Indeed, rapid urbanization and industrialization brought on by easier access to capital, particularly in developing nations, are frequently accompanied by environmental deterioration. When institutions play a weak moderating function, FD either does not help or makes environmental inefficiency worse. Institutions cannot encourage green investment or enforce environmental standards in such environments. Finance thus turns into a vehicle for economic growth devoid of sustainability, underscoring the urgent need for institutional development to make finance environmentally efficient.
Stochastic frontier estimates: the moderating role of institutional quality

Note: Robust standard errors in brackets. Time FE is included in both the frontier and the inefficiency component, whereas region FE is included in the frontier. All variables, except Z5, are taken in logarithmic scale. σu, variance of inefficiency term. σv, variance of stochastic error term. λ, σu/σv. For further information on the variables defined in the production set and the inefficiency component, see Section 4.2.
5.5. Testing the nonlinear effects
Following Mills et al. (Reference Mills, Dong, Yiling, Baafi, Li and Zeng2021), we test the presence of nonlinear effects of FD measures upon environmental inefficiency (columns (1), (2) and (3) of appendix Table A10). The empirical findings show that there is a monotonic link between FD indicators and environmental efficiency (similar to Mills et al. (Reference Mills, Dong, Yiling, Baafi, Li and Zeng2021)). Specifically, the analysis indicates that as FD increases, environmental inefficiency tends to decrease, implying a consistent trend of improvement (columns (1), (2) and (3)). This pattern suggests that more developed financial systems enhance the allocation of capital towards environmentally sustainable projects, facilitate investments in cleaner technologies, and support the adoption of energy-efficient practices. Such mechanisms align with prior studies that highlight the role of FD in promoting environmentally friendly behaviours and reducing carbon emissions (Al-Zubairi et al., Reference Al-Zubairi, AL-Akheli and Elfarra2024). Overall, these findings reinforce the notion that robust financial systems can act as catalysts for sustainable development by improving the efficiency of environmental outcomes.
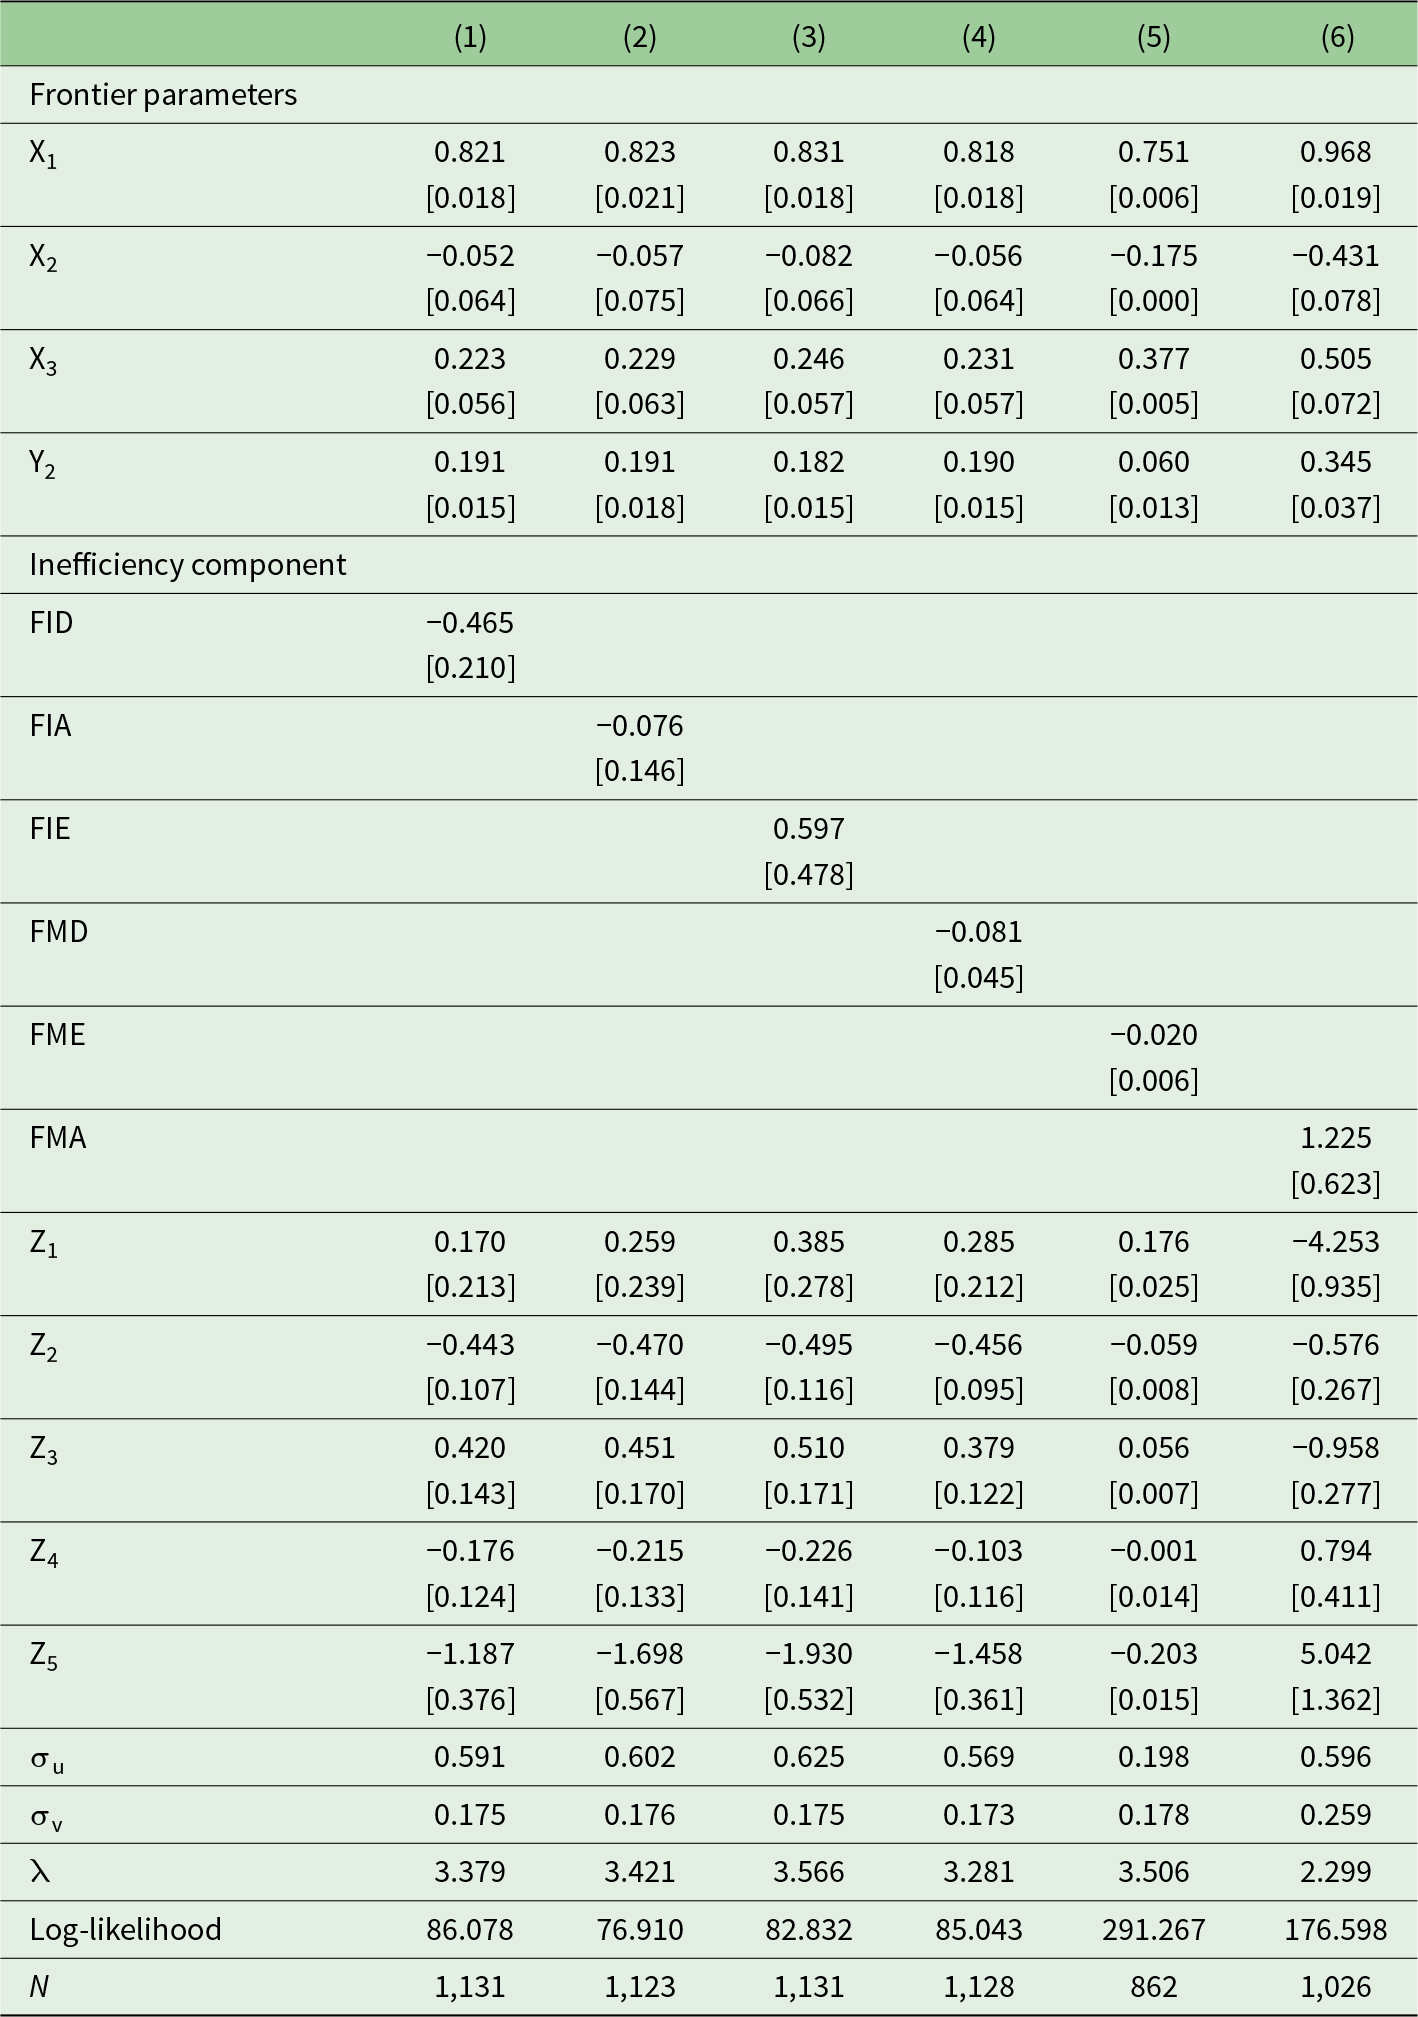
5.6. Employing sub-indicators of FD
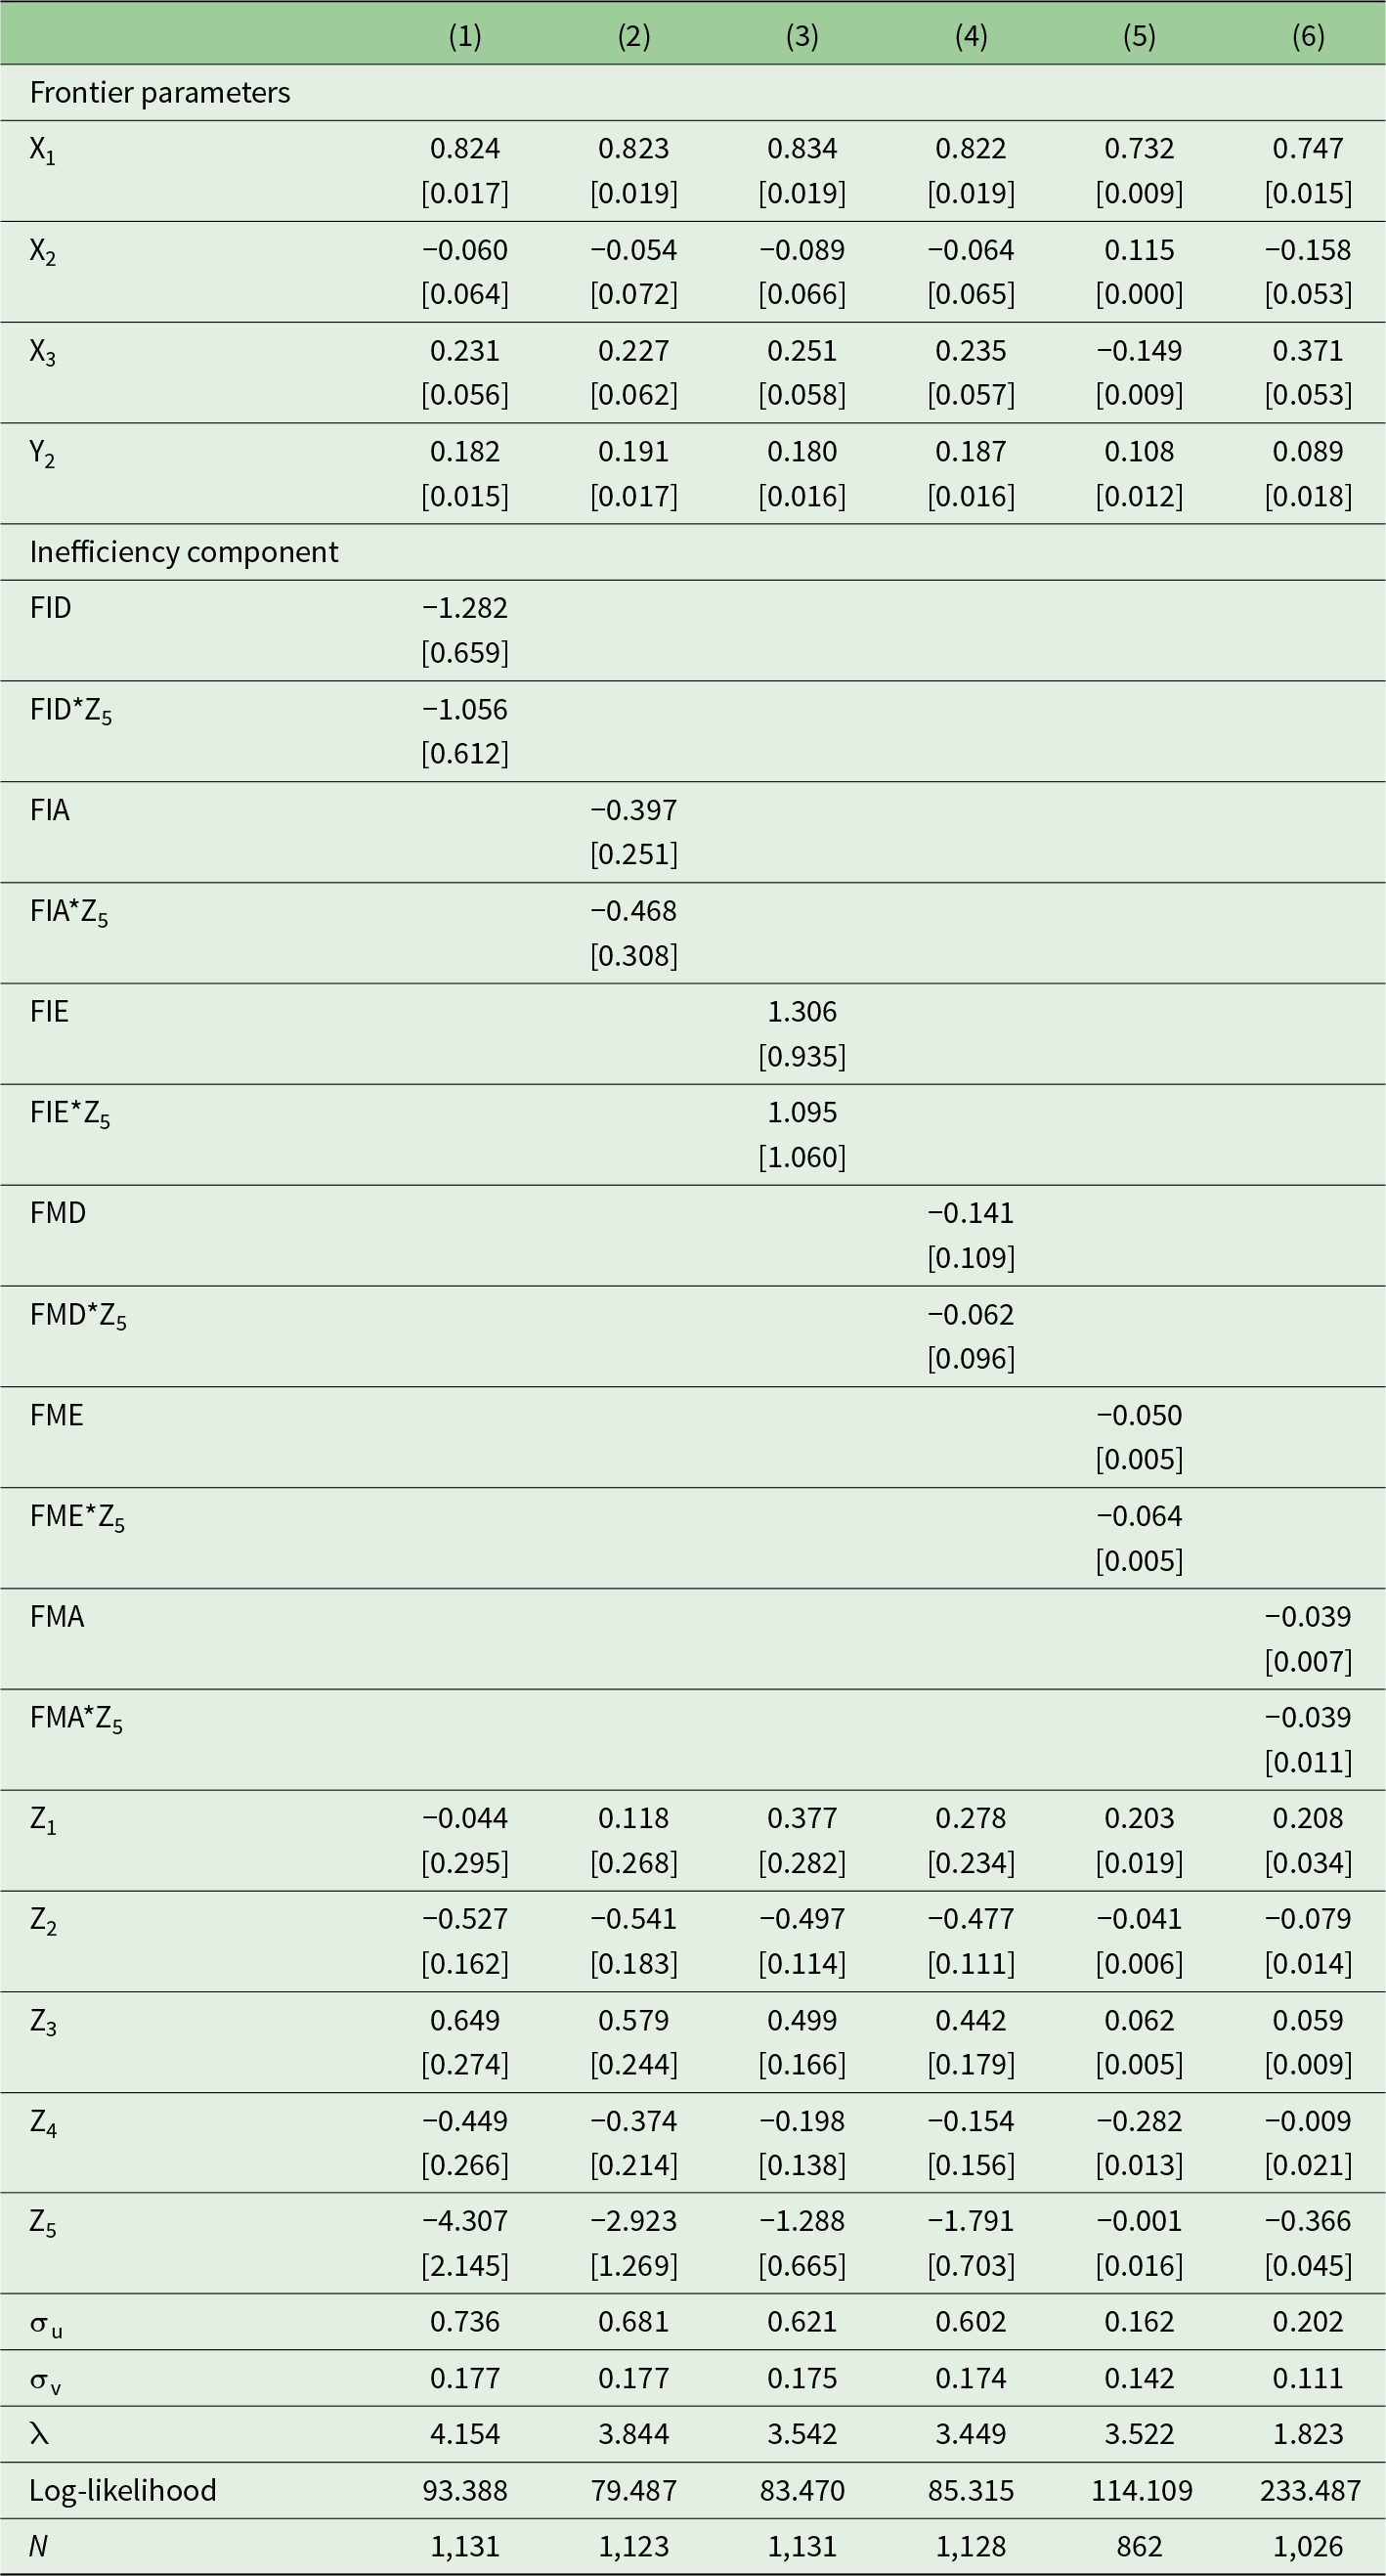
As additional robustness, Table 6 (without institutional quality, Z5), Table 7 (with institutional quality, Z5) and Table 8 (with institutional quality, Z5, and its moderating role) report the empirical findings considering sub-indicators of FD.Footnote 12 Specifically, the sub-indicators of FD refer to six variables listed in Section 4.2, based on the decomposition of the FI and FM indicators, which are: FID, FIA, FIE, FMD, FMA and FME (for further information on their definitions, please refer to Table A4 in the online appendix). This strategy will enable us to identify which components of FI and FM have a significant impact on environmental inefficiency. Except for FIE (column (3)), where the impact on environmental inefficiency is not statistically significant, the results in Table 6 (without institutional quality, Z5) typically imply that FD has a negative and statistically significant impact on environmental inefficiency (columns (1), (2), (4), (5) and (6)).
Stochastic frontier estimates: benchmark

Note: Robust standard errors in brackets. Time FE is included in both the frontier and the inefficiency component, whereas region FE is included in the frontier. All variables, except Z5, are taken in logarithmic scale. σu, variance of inefficiency term. σv, variance of stochastic error term. λ, σu/σv. For further information on the variables defined in the production set and the inefficiency component, see Section 4.2.
Stochastic frontier estimates: the role of institutional quality

Note: Robust standard errors in brackets. Time FE is included in both the frontier and the inefficiency component, whereas region FE is included in the frontier. All variables, except Z5, are taken in logarithmic scale. σu, variance of inefficiency term. σv, variance of stochastic error term. λ, σu/σv. For further information on the variables defined in the production set and the inefficiency component, see Section 4.2.
Stochastic frontier estimates: the moderating role of institutional quality

Note: Robust standard errors in brackets. Time FE is included in both the frontier and the inefficiency component, whereas region FE is included in the frontier. All variables, except Z5, are taken in logarithmic scale. σu, variance of inefficiency term. σv, variance of stochastic error term. λ, σu/σv. For further information on the variables defined in the production set and the inefficiency component, see Section 4.2.
As expected, the results of Table 7 (with institutional quality, Z5) show that, while FIA and FIE have no statistically significant effect on environmental inefficiency (columns (2) and (3)), institutional quality plays a critical role in reducing environmental inefficiency, especially when taking into account estimation sub-indicators related to financial markets, such as FMD, FME and FMA (columns (4), (5) and (6)). Overall, the impact of institutions on environmental inefficiency is negative and statistically significant.
We further assess how institutional quality can help to mitigate the link between FD and environmental inefficiency (Table 8). We find that institutional quality has a weak moderating effect when we use FID (column (1)), but not when we use FIA, FIE, or FMD (columns (2), (3) and (4)). It is interesting to note that institutional quality does play a moderating impact, particularly when FME and FMA are considered (columns (5) and (6)). With implications for lowering environmental inefficiency, this finding emphasizes the role that institutions play in fostering the efficiency of financial markets.
Finally, Table A11 (online appendix) contains the estimates for the nonlinear effects. The results demonstrate a consistent monotonic trend, particularly for FIA, FMD and FMA (columns (2), (4) and (6)). Stated differently, while considering FID, FIE and FME (columns (1), (3) and (5)) does not have a monotonic effect, empirical evidence indicates that countries with higher levels of FD have lower levels of environmental inefficiency.
6. Conclusions and implications
One effective strategy to bolster sustainable competitiveness and pave the way for a low-carbon economy worldwide is to prioritize environmental efficiency. Across nations globally, serious challenges persist concerning both FD and environmental degradation, compounded by the depletion of energy resources. Environmental efficiency, as a manifestation of green growth, intertwines economic progress with environmental conservation, offering a pathway to align with the UN's sustainable development goals. Literature has mainly concentrated on the influence of FD on environmental efficiency, overlooking the examination of how institutional quality may moderate this relationship. This study addresses important gaps in the literature by exploring the interplay between FD, environmental inefficiency and institutional quality. It applies a stochastic frontier approach with a directional distance function, while incorporating innovative dimensions such as institutional quality and a broad set of FD indicators.
Some key results emerge. Firstly, the significant impact of FD on the environmental efficiency of countries. Robust financial systems are shown to contribute to the mitigation of environmental inefficiency which underscores the potential of financial institutions to allocate resources towards environmentally sustainable projects and technologies, thereby reducing pollution and promoting resource efficiency. Secondly, our analysis emphasizes the crucial role of institutional quality in shaping environmental outcomes, particularly when FD proxies are linked to the financial markets (both in terms of accessibility and efficiency). Higher institutional quality is associated with reduced environmental inefficiency, indicating that effective governance structures play a vital role in implementing and enforcing environmental regulations and incentives. Furthermore, our study reveals a moderating effect of institutional quality on the relationship between FD and environmental inefficiency. This suggests that the effectiveness of FD in promoting environmental sustainability is enhanced in environments with higher institutional quality.
The findings of this study yield several concrete policy implications. FD alone is insufficient to enhance environmental efficiency unless supported by robust institutional quality; therefore, policymakers should design integrated policy frameworks that simultaneously strengthen financial markets and institutional capacity, adapting interventions to regional governance conditions. In regions with weaker institutions, reforms should first target governance improvements – such as the rule of law and anti-corruption measures – before expanding credit and capital market access to ensure that financial resources are effectively directed towards environmentally efficient activities. Given that FD linked to credit access shows the strongest association with improved environmental outcomes, governments should promote credit-based green finance instruments, including subsidized loans for small and medium-sized enterprises investing in energy efficiency and preferential lending for bioeconomy enterprises. Strengthening institutional capacity is also essential to translate financial reforms into tangible environmental benefits; thus, policymakers should invest in training programs and digital monitoring tools enabling regulators to evaluate the environmental impact of financial flows and coordinate across financial, environmental and industrial authorities. Moreover, advancing data integration by developing sub-national databases that combine financial and environmental indicators would support evidence-based, adaptive policymaking. Finally, as the sustainability impact of financial markets depends critically on institutional governance, regulators should reinforce investor protection, enhance transparency and disclosure standards for green investments, and ensure that deeper financial markets channel capital towards projects that improve environmental efficiency and support long-term sustainability goals.
While this study provides valuable insights, it is not without limitations, which also suggest avenues for future research. First, the focus on a specific set of FD indicators and institutional quality measures may overlook other influential variables – such as technological innovation, environmental regulation and social governance factors – that could affect the relationship between FD and environmental efficiency. Expanding the analytical scope to include these dimensions would yield a more comprehensive picture. Second, the reliance on aggregated country-level data may obscure substantial intra-country and regional heterogeneities, particularly in large or economically diverse nations. Employing sub-national or firm-level data in future research could help uncover localized dynamics and more granular patterns in the environment–finance nexus. Third, although the moderating role of institutional quality is considered, the analysis does not unpack the specific mechanisms – such as regulatory enforcement, public accountability, or bureaucratic efficiency – through which institutional frameworks exert influence. Future studies could employ structural modelling or case-based qualitative approaches to illuminate these pathways. Moreover, a mixed-methods design combining econometric analysis with interviews or policy reviews could enrich understanding by revealing contextual factors and actionable policy implications.
Finally, as the study spans 133 countries, another limitation arises from potential measurement inconsistencies across nations, particularly regarding FD, institutional quality and environmental indicators. Cross-country datasets may embed reporting biases or structural differences in how variables are defined and collected. Future research could address this by triangulating multiple data sources, employing robustness checks across alternative indicators, or conducting regional case comparisons to validate cross-national findings.
Together, these limitations highlight the need for interdisciplinary and multi-method research to deepen our understanding of the evolving interactions between financial systems, institutional quality and environmental performance.
Supplementary material
The supplementary material for this article can be found at https://doi.org/10.1017/S1355770X25100375.
Competing interests
The authors declare none.


 Open access