

INTRODUCTION
Gornergletscher is Switzerland's second largest glacier, located in southern Switzerland near the border with Italy (Fig. 1). This glacier has an area of 60 km2, stretches 14 km in length over altitudes 2200–4550 m with a maximum ice thickness of more than 400 m (Huss, Reference Huss2005). The Gornergletscher system has been the subject of research for several decades (Bezinge and others, Reference Bezinge, Perreten and Schafer1973; Aschwanden and Leibundgut, Reference Aschwanden and Leibundgut1982; Haeberli and Funk, Reference Haeberli and Funk1991; Iken and others, Reference Iken, Fabri and Funk1996; Lüthi and Funk, Reference Lüthi and Funk2000, Reference Lüthi and Funk2001; Suter and others, Reference Suter, Laternser, Haeberli, Frauenfelder and Hoelzle2001; Walter and others, Reference Walter, Deichmann and Funk2008; McBride and others, Reference McBride2012). Within the glacier system, we focus on a region located at the confluence of two large tributary glaciers, Gornergletscher and Grenzgletscher, at an elevation of 2600 m ~5 km from the glacier terminus. In recent years, Gornergletscher has thinned significantly, such that the dominant contribution to the system now comes from Grenzgletscher (unpublished images from a webcam maintained by VAW). At the confluence, the flowline of Grenzgletscher rotates counterclockwise from north to west as it heads toward the western terminus.
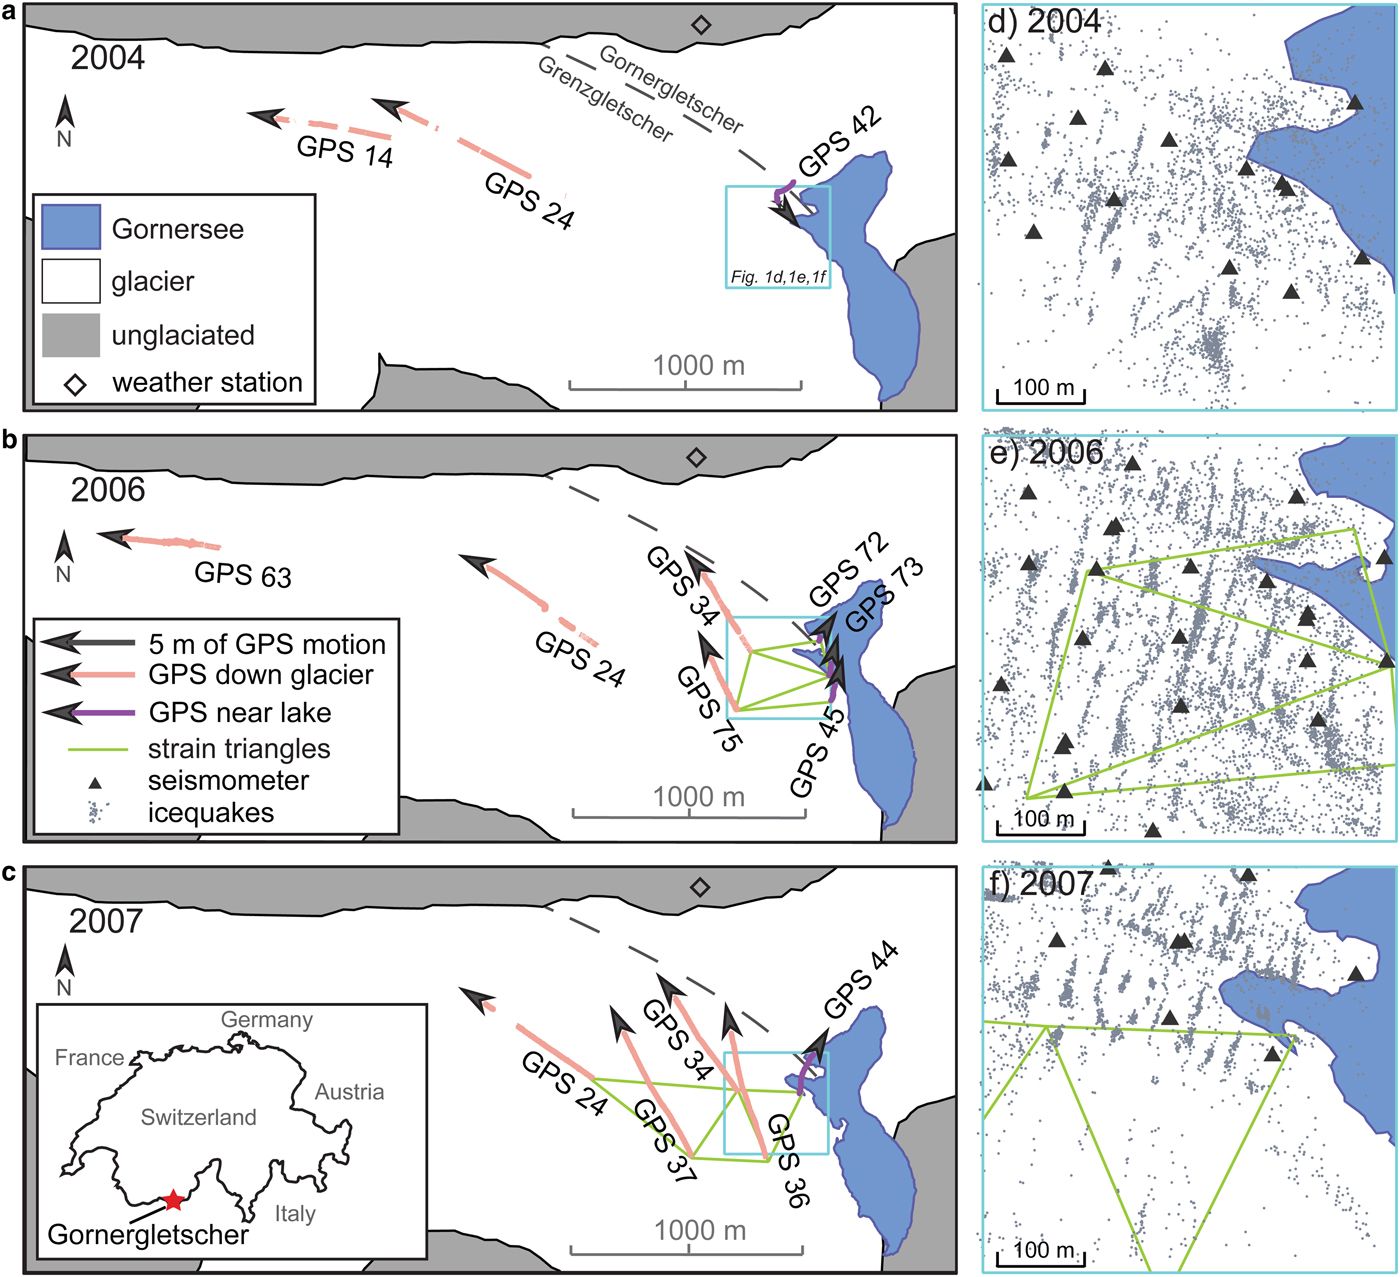
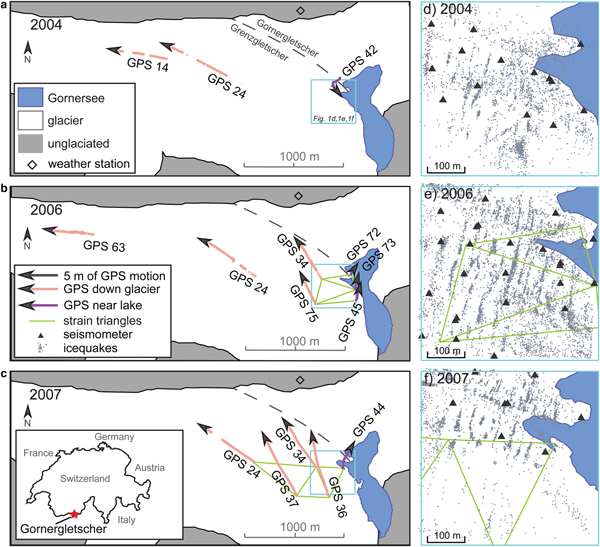
Maps of Gornergletscher and the deployed networks in (a) 2004, (b) 2006 and (c) 2007. Inset in (c) shows Gornergletscher's location in Switzerland. The Gornersee (blue) is located at the confluence of Gornergletscher (North) and Grenzgletscher (South). Air temperature records taken from nearby weather station indicated by diamond. GPS station tracks for stations near the lake and down-glacier from the lake indicated by purple and pink arrows, respectively (gaps indicate data gaps in the time series). Note the different network configurations for the 2004, 2006 and 2007 field seasons. (d–f) Close up of the seismic network (black triangles), strain triangle configurations (green lines) and icequakes locations (gray dots) used in this work.
Every spring at this confluence, the ice-marginal Gornersee lake forms and subsequently drains in the summer (Huss and others, Reference Huss, Bauder, Werder, Funk and Hock2007; Sugiyama and others, Reference Sugiyama, Bauder, Weiss and Funk2007, Reference Sugiyama, Bauder, Huss, Riesen and Funk2008; Walter, Reference Walter2009; Werder, Reference Werder2009). Although the Gornersee typically fills over the course of several months, it can drain within a few days as water is routed via subglacial channels to the proglacial stream (Huss and others, Reference Huss, Bauder, Werder, Funk and Hock2007; Werder and others, Reference Werder, Schuler and Funk2010). Drainage typically occurs in early July, and the exact mechanism of drainage varies year to year (Huss and others, Reference Huss, Bauder, Werder, Funk and Hock2007). In some years, it overspills slowly over a period of weeks, and in other years, subglacial drainage quickly evacuates the water mass as an outburst flood. In the early 20th century these down-glacier flood intensities reached more than 100 m3/s, which routinely caused hazardous conditions and damage in the downstream valley of Zermatt (Harrison and others, Reference Harrison, Raymond, Echelmeyer and Krimmel2003; Huss and others, Reference Huss, Bauder, Werder, Funk and Hock2007).
In this work, we examine both seismic and geodetic data collected from the area of glacier confluence west of Gornersee during three summer ablation seasons: May to August of 2004, 2006 and 2007 (Fig. 1). Within our study area near the lake, the glacier is prone to high tensile stresses that produce a heavily crevassed surface, giving rise to thousands of near-surface icequakes a day (Walter and others, Reference Walter, Deichmann and Funk2008). We independently generate an icequake catalog of crevasse events and calculate high rate two-dimensional (2-D) surface strains throughout the ablation season and interpret them in light of available meteorological data and observations of the Gornersee lake level. Our overall goal is to gain a better understanding of Gornergletscher crevassing activity and its sensitivity to various perturbations, including seasonal changes, the formation and drainage of Gornersee, and diurnal variations. Our study includes three primary parts: region-wide temporal variations in icequakes and surface strains throughout the ablation season (‘Gornergletscher icequakes and surface strain throughout the ablation season’ section); spatial variations in icequake and surface strain in response to Gornersee drainage each year (‘Spatial variations in surface crevasse response to Gornersee drainage’ section); and spatial variations in diurnal pulses of icequakes and surface strain observed throughout each season (‘Spatial variations in preferred time-of-day for surface crevasse activity’ section).
DATA AND METHODS
Detecting and locating surface icequakes
We use data from a network of three-component seismic stations deployed on the Gornergletscher surface during the summers of 2004, 2006 and 2007 (Walter and others, Reference Walter, Deichmann and Funk2008). These arrays consisted of 8–24 sensors with an aperture of ~300–400 m located within 400 m of Gornersee on the western side (Fig. 1; Table S1). The sensors had high pass corner frequencies between 1 and 28 Hz and operated at high sampling frequencies between 1000 and 4000 Hz (Table S2). The 2004 and 2006 recordings were based on event recognition using a trigger algorithm at the recording stage (Walter and others, Reference Walter, Deichmann and Funk2008), whereas in 2007 seismic ground motion was recorded continuously and a short-term average to long-term average (STA/LTA) trigger algorithm (see Supplemental Text S1) was applied to these data at the processing stage (Walter and others, Reference Walter, Canassy, Husen and Clinton2013).
Icequake activity is pervasive within our study region, and the networks recorded between 30 000 and 200 000 events in each summer season. The vast majority of these events are surface crevasse openings, although intermediate depth as well as basal events were also recorded (Walter and others, Reference Walter, Deichmann and Funk2008, Reference Walter, Dreger, Clinton, Deichmann and Funk2010; Heeszel and others, Reference Heeszel, Walter and Kilb2014). Only a small fraction of the recorded events originate at depths below the surface crevasse zones, primarily locating near the glacier bed (Walter and others, Reference Walter, Deichmann and Funk2008, Reference Walter, Dreger, Clinton, Deichmann and Funk2010, Reference Walter, Canassy, Husen and Clinton2013). These deep icequakes are related to hydrofracturing and have waveforms with dominant and impulsive P- and S-waves. In contrast, the waveforms of surface icequakes are dominated by Rayleigh waves (Deichmann and others, Reference Deichmann, Ansorge, Scherbaum and Aschwanden2000; Walter and others, Reference Walter, Deichmann and Funk2008). These Rayleigh waves are prime candidates for waveform cross-correlation methods to determine travel time differences because the waveforms tend to be very simple and very similar (Roux and others, Reference Roux, Walter, Riesen, Sugiyama and Funk2010).
We use the batch processing waveform cross-correlation method of Roux and others (Reference Roux, Walter, Riesen, Sugiyama and Funk2010) to locate surface icequakes on Gornergletscher, implementing an additional processing step for the continuous data recorded in 2007 (see Supplementary Text S1). This method uses a time-domain cross-correlation of the Rayleigh wave recorded on vertical component velocity records. We require the relocation scheme successfully iterate to an acceptable solution (<500 iterations) and that the average standard deviation of the epicentral location and velocity remains reasonable (Roux and others, Reference Roux, Walter, Riesen, Sugiyama and Funk2010). When applying the Roux and others (Reference Roux, Walter, Riesen, Sugiyama and Funk2010) icequake location method to our data, we require the waveform cross-correlation values to be 95% or above (e.g. Fig. S1). This 95% threshold is more restrictive than previous studies (e.g. compare with 80% from Roux and others, Reference Roux, Walter, Riesen, Sugiyama and Funk2010), but preferred so we can capture primarily icequakes that have similar strong signals, and reduce the amount of spurious background events. The different thresholds do not spatially change the icequake locations, as our icequake locations are within 0.2 m of the locations calculated by Roux and others (Reference Roux, Walter, Riesen, Sugiyama and Funk2010) for the 2004 seismic data. To assure that our dataset contains icequakes that can be adequately recorded by multiple stations in the network, we further restrict the data to only events located within the combined footprint of all three networks. The final region of interest is shown by the blue box in Figure 1, encompassing the region: eastings 627 992–628 427 and northings 90 628–91 057 inclusive, using the CH1903 + coordinate system. Using these processing steps, we produce a catalog of 3289, 7939 and 4087 icequakes from 2004, 2006 and 2007 data, respectively (Table S2). The locations of these events are shown in Figure 1, revealing activity at distinct crevasses trending ~10°EofN along with some zones of diffuse seismicity.
When analyzing sub-diurnal spatiotemporal patterns in seismic catalogs, it is essential to establish a detection threshold and evaluate how this threshold varies as a function of time-of-day to ensure any observed time-of-day patterns are not artifacts of variations in noise levels (e.g. Velasco and others, Reference Velasco, Alfaro-Diaz, Kilb and Pankow2016). To this aim, we examine each of the three-waveform components (X, Y and Z) individually and determine the maximum absolute amplitude of the waveform signal as a function of time-of-day. We find no correlation between source origin time-of-day and waveform amplitude indicating that there is no strong time-of-day dependence on icequake signal detectability. We also find that events with the lowest amplitude waveforms are randomly distributed throughout our study region (i.e. the low amplitudes are not constrained to only the edges of the study region), which suggests that detectability of events within our study region is relatively uniform. This is not surprising because we limited our study region to the footprint of the networks and our location algorithm only accepts the cleanest waveforms.
We note that in 2004 there was a partial seismic network outage between days 176 and 181, and other short outages also occurred during the 2006 and 2007 recording periods. Icequakes during these periods are located using the remaining functional stations, so icequake activity estimates during these times may be biased low. For the purposes of this work, these outages will not significantly change our results or the interpretation of our results, and so we simply note the outage here in the aim to help future studies that examine these data in more detail.
Measuring surface displacement and calculating 2-D strain
In addition to the deployed seismic networks, 3–8 GPS stations were deployed on the Gornergletscher surface during the summers of 2004, 2006 and 2007 (Sugiyama and others, Reference Sugiyama, Bauder, Weiss and Funk2007). GPS station placement varied each year (Table S3) with stations distributed from within 100 m of Gornersee (up-glacier) to 3 km downstream (down-glacier) (Fig. 1). The exception is GPS station #24, which was installed in approximately the same location ~1 km west of Gornersee each year. The high glacier flow rate of 10 s of meters per year (Riesen and others, Reference Riesen, Sugiyama and Funk2010) and surface melt required repositioning the GPS antennas at multiple times during the recording period. Position time series were calculated using the methods described by Sugiyama and Gudmundsson (Reference Sugiyama and Gudmundsson2004), accounting for antenna repositioning. The raw sample interval varied between stations and throughout each season, resulting in a processed position time series with intervals of 3 s to 3 h (Table S4). These positions have an estimated horizontal and vertical accuracy of ±1.4 and ±3 mm, respectively.
We find that GPS stations down-glacier (pink arrows, Fig. 1) traveled an average of 8–10 m during the period of observation, in a west to northwest direction consistent with the general counter-clockwise flow direction of Grenzgletscher in this region. Stations closest to Gornersee (purple arrows, Fig. 1) traveled much slower averaging only 1–3 m during their deployment and are observed to travel northeast toward the lake. This ‘upstream’ motion is likely a local effect of the convergence of Grenzgletscher and Gornergletscher in this area.
Because the sampling rate at individual GPS sites varied, and because the time series have several data gaps, we smoothed the position time series and resampled these data at even intervals before calculating strains. We use a non-parametric smoothing protocol of
 $${y}^{\prime} = \displaystyle{{\mathop \sum {W_i} {y_i} \over {\mathop \sum W_i}}$$
with weights given by
 $$W_i = \left[ {1-{\lpar {d_i/l} \rpar }^2} \right] ^2,$$
where y′ is the smoothed value, y i is the unsmoothed point within the window, W i is the weight at a particular step in the window, d i is the difference in time between that step and the center of the window and l is the window length. For high sample rate data (2007 and 2006 down-glacier sites prior to day 185), we use a 7 h window with a 1 h time step, while a 13 h window with a 3 h time step was used for the remainder of the data (2004 and 2006 after day 185). This protocol mostly down sampled the data, but at stations 45, 72 and 73 in 2006, the data up to day 185 were interpolated from 3 h intervals to 1 h intervals. These three stations (42, 72 and 73) are very close to Gornersee and have relatively low velocities and low noise levels, resulting in a relatively smooth time series that can be interpolated without introducing major artifacts. Data gaps larger than 4 h were omitted from the strain analysis to further prevent the introduction of spurious signals.
We used the smoothed position time series to calculate the displacement at each time step relative to the previous time step, equivalent to the station velocity during each time interval. We then group the stations into triads (green lines, Fig. 1e–f) and calculate strain rates using the method of Savage and others (Reference Savage, Gan and Svarc2001). In a 2-D system, the horizontal velocity components ( $\dot{u}_x$ and $\dot{u}_y$) of each GPS station are given by
 $$\dot{u}_x = \dot{U}_x + {\dot{{\cal E}}}_{xx}{\rm \Delta} x + {\dot{{\cal E}}}_{xy}\Delta y-\omega \Delta y,$$
 $$\dot{u}_y = \dot{U}_y + {\dot{{\cal E}}}_{xy}{\rm \Delta} x + {\dot{{\cal E}}}_{yy}\Delta y-\omega \Delta x,$$
where  $\dot{u}_x$ and $\dot{u}_y$ are the unknown velocities of the centroid of the triangle, ${ \dot{{\cal E}}}_{xx}$, ${\dot{{\cal E}}}_{xy}$ and ${ \dot{{\cal E}}}_{yy}$ are the unknown components of the 2-D strain rate tensor, Δx and Δy are the known distances to the centroid, and ω is the unknown rotation. We solve for the best-fitting strain rate, translation and rotation components for each strain triangle at each time step using a weighted linear least-squares method, assuming independent errors of ±3 mm for each position estimate. The principal strain rates and principal axes were calculated as the eigenvalues and eigenvectors of the strain rate tensor at each time step. The overall magnitude of the strain rate tensor is represented by the differential strain rate, calculated as the difference between the maximum and minimum principal strain rates. We estimate the errors in principal strain rates using bootstrap sampling of the range of possible values of each Cartesian strain rate component, given its weighted linear least-squares error. We then calculate the principal strain rates of each sample and define the error to be the standard deviation of the resulting sample set. Strain is a dimensionless quantity, so we report strain rates in units of microstrain per day (10−6 d−1).
We note that the GPS stations considered here are a subset of the Gornergletscher monitoring initiative targeting ice surface deformation between 2004 and 2008. Other parts of this monitoring initiative include theodolite surveys of reflectors installed on the ice and interferometric radar (e.g. Riesen, Reference Riesen2011). At 3 mm, the GPS stations’ errors in horizontal position are lower than the location uncertainties of the theodolite measurements by a factor of 2–3 (Sugiyama and others, Reference Sugiyama, Bauder, Huss, Riesen and Funk2008). Moreover, in contrast to the interferometric radar deployment, GPS stations were operational during the 2004, 2005 and 2007 seismic measurement, which is why we confine our present analysis to the GPS measurements.
Gornersee lake level and meteorological observations
In addition to seismic and geodetic data, we also consider records of environmental phenomena that may perturb surface crevasse activity throughout the ablation season. Gornersee lake levels were measured by a pressure transducer deployed in the lake for the duration of the melt season and subsequent drainage each year with sampling intervals of 10 min or less (Table S5) (Werder and others, Reference Werder, Schuler and Funk2010). Lake drainage onset times are defined as the time of peak lake level each year. Depending on the year and mode of lake drainage, this may precede high flow-rate drops in the lake level by up to a few days. Drainage duration is computed from the time of drainage initiation until sensor failure in 2004 (Huss and others, Reference Huss, Bauder, Werder, Funk and Hock2007) or until the sensor was subaerially exposed in 2006 and 2007. Air temperature and precipitation data for the region were obtained from a permanent meteorological station at Gornergrat, located 2.5 km away on the unglaciated, northern margin of Gornergletscher at an elevation 600 m above the study site (Fig. 1). We do not expect the absolute temperatures at the weather station and glacial surface to be the same, but we do expect the diurnal and seasonal temperature patterns to be similar. We therefore consider only relative variations in temperature throughout this analysis.
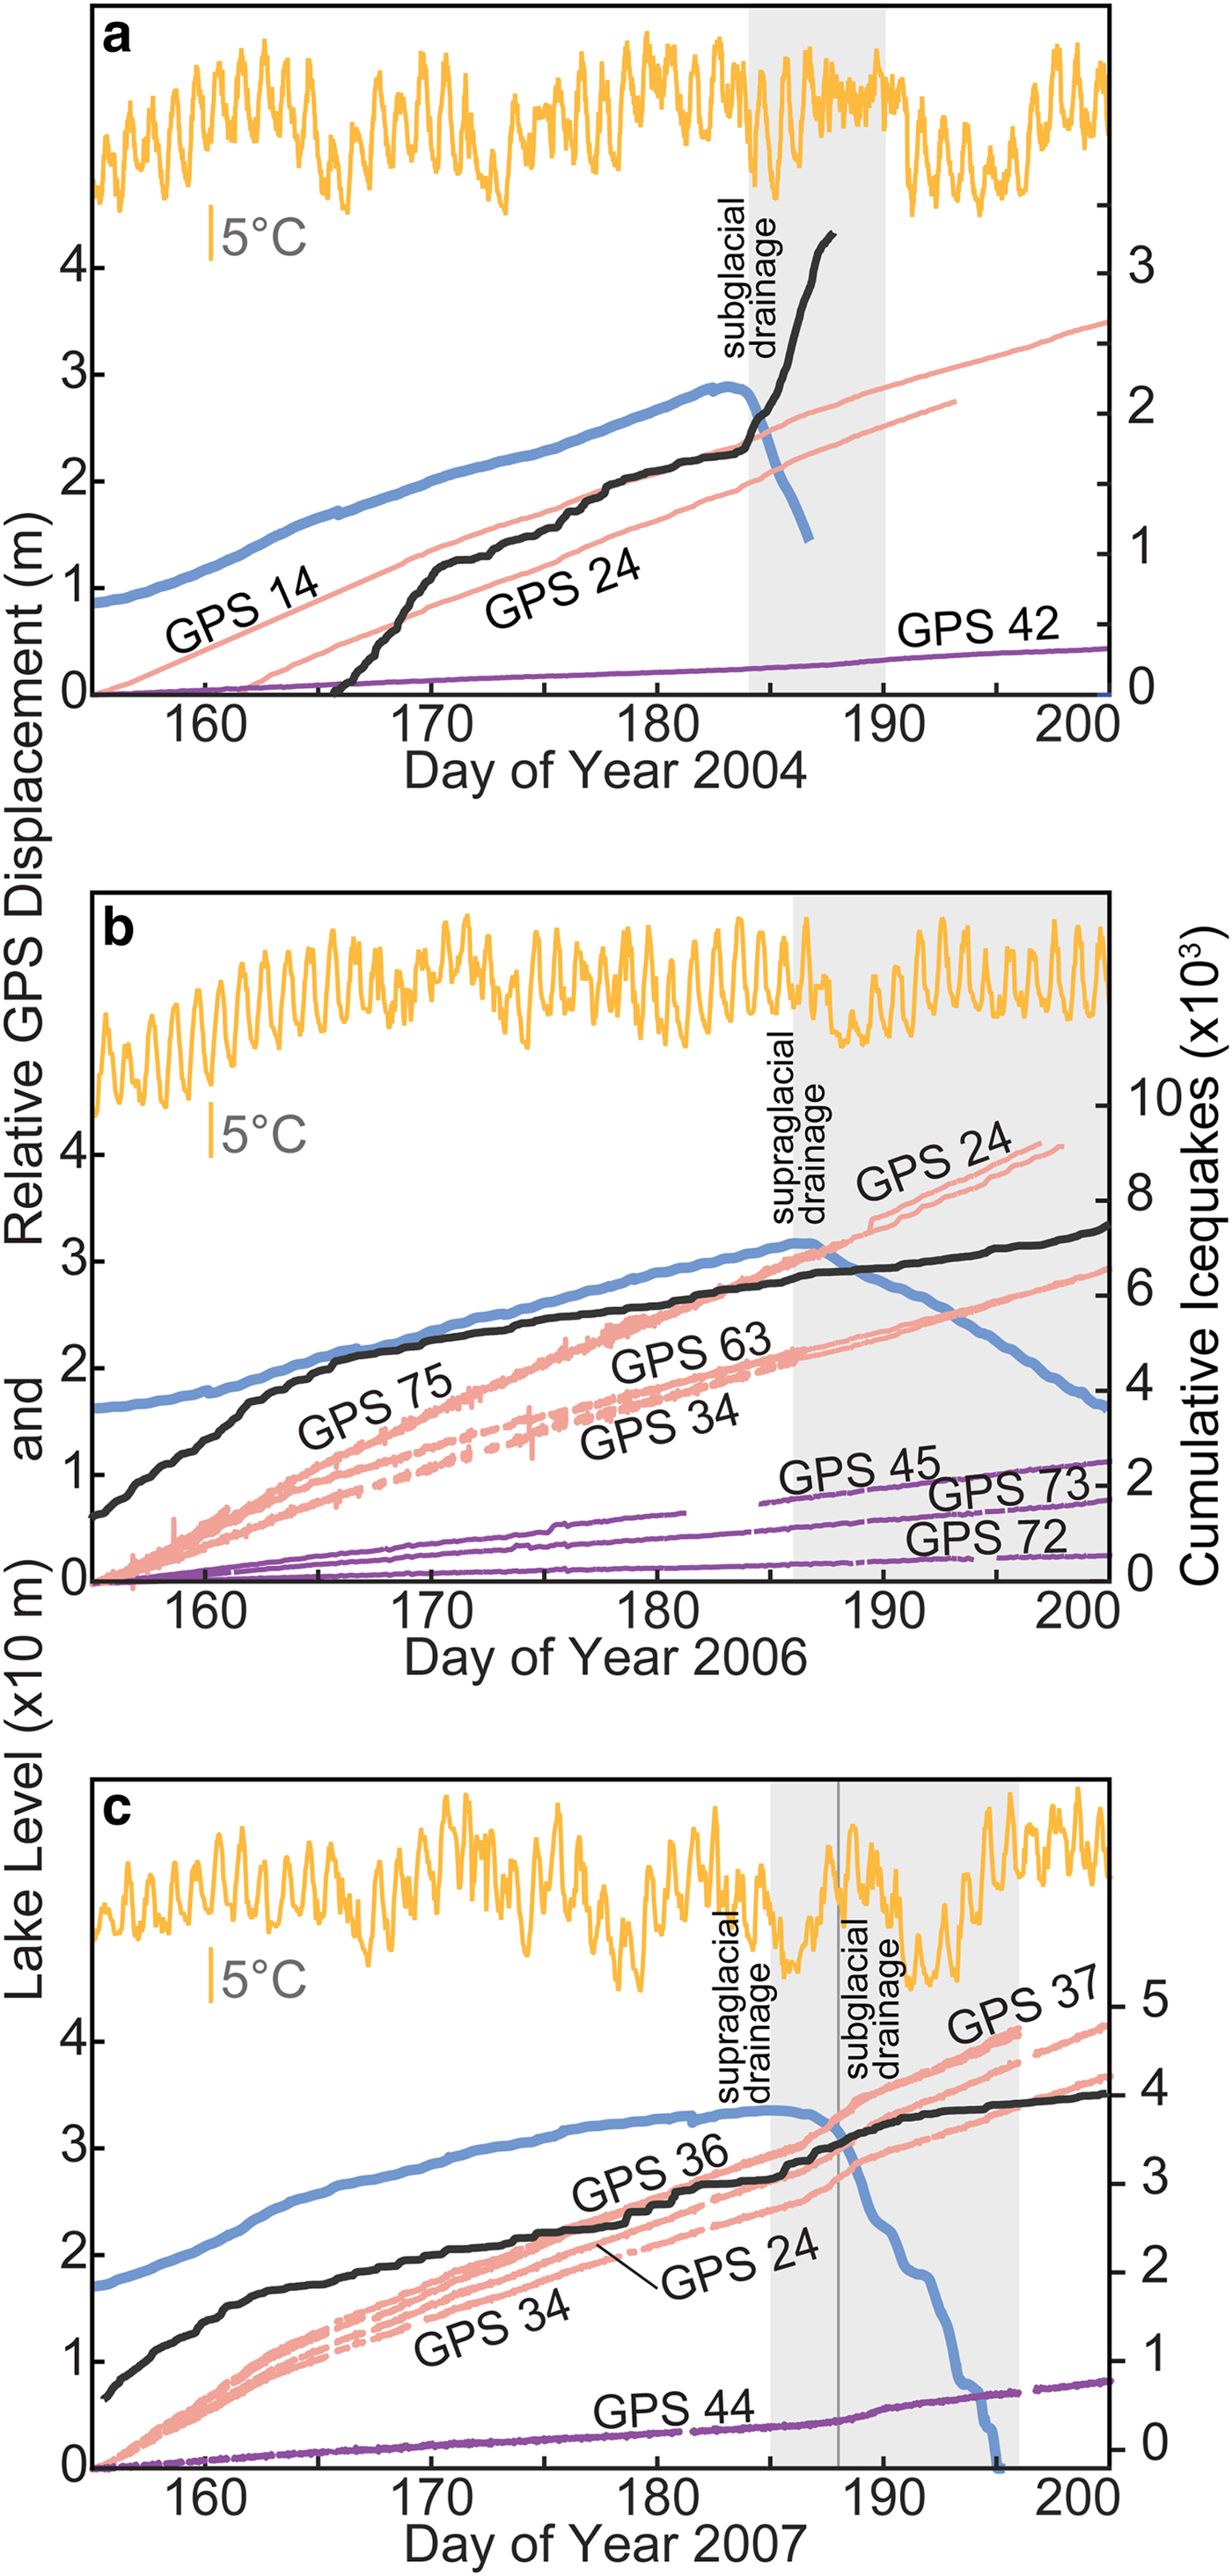
The records show Gornersee beginning to form in the late spring each year (Fig. 2, blue lines) (Werder, Reference Werder2009; Werder and others, Reference Werder, Schuler and Funk2010). Water levels increase throughout the summer ablation season, rising by 28–33 m depth until early July (day-of-year ~155–185). Around early July each year, the lake drains either subglacially, supraglacially, englacially or some combination of the three (Table 1; see Supplementary Text S2). In both 2004 (Fig. 2a) and 2007 (Fig. 2c), Gornersee drained subglacially and the lake level dropped precipitously over a few days (Sugiyama and other, Reference Sugiyama, Bauder, Huss, Riesen and Funk2008; Werder and others, Reference Werder, Loye and Funk2009). In these years, the lake drainages were preceded by calving events off the dam (Huss and others, Reference Huss, Bauder, Werder, Funk and Hock2007). In 2007, the subglacial drainage was preceded by a brief period of supraglacial overspill and several englacial drainage pathways routing the lake water to the subglacial drainage system. Accordingly, the step-like drainage pattern in 2007 (Fig. 2c) was caused by the opening of new englacial drainage pathways and subsequent lake level drops below these openings. By contrast, during the 2006 supraglacial drainage (Fig. 2b) lake levels dropped more gradually over a few weeks (Werder and others, Reference Werder, Schuler and Funk2010). In all years, the lake level exhibits a daily pulse-like behavior in the afternoons both before and after the drainage, which is particularly evident in 2006 (Fig. 2b). This is the signal of diurnal temperature variations generating meltwater pulses that enter Gornersee throughout the melt season.
Lake level (blue), relative air temperature (yellow), cumulative icequakes (black) and relative non-smoothed GPS displacement for down-glacier (pink) and up-glacier near lake (purple) stations for (a) 2004, (b) 2006 and (c) 2007. Gray shaded regions indicate onset and duration of lake drainage.
Lake drainage summary parameters for each of the 3 study years
* From Walter (Reference Walter2009) and Werder and others (Reference Werder, Schuler and Funk2010).
† In 2004, data collection ended before drainage was complete.
Spatio-temporal analysis throughout ablation season
We first examine the basic temporal evolution of the lake level, temperature, cumulative icequake count data and un-smoothed net displacement at GPS stations both near Gornersee and those down-glacier throughout the ablation season for all 3 years (Fig. 2). We focus on days 155–200 (3 June to 18 July in 2004, 4 June to 19 July in 2006 and 2007). In all years, we find that the icequakes exhibit the highest activity (i.e. highest temporal density, steepest slope of black line) in the early season before decreasing in mid-June (day-of-year ~163–170). Similarly, the down-glacier faster moving GPS station velocities are generally highest (steepest slope) in the early season and decrease in mid-June. This mid-season behavior continues until Gornersee drainage, which triggered different responses from Gornergletscher each year. Following drainage, the icequake and GPS behavior changes once again, exhibiting a different response each year.
To quantify changes in icequake activity and glacier flow rate throughout each season, we first divide each season into four timespans: early season, mid-season before drainage initiates, during active drainage, and after active drainage has ceased. We identify representative time windows of up to 7 d within each period (the precise dates of these time windows vary year to year and are reported in Table S6). For each time window, we calculate the mean and standard deviation of the number of icequakes per day during that time period. We also calculate the mean and standard deviation of the velocities of each GPS station, using the smoothed 1 h time series. For both datasets, we expect a 7 d window is long enough to average out the effects of the diurnal fluctuations and give a reliable estimate of the background variation, but because of the diurnal variations, we expect the standard deviation to be biased high.
The study-area-wide averages described above reveal the major transitions in the general behavior of the glacier throughout the summer ablation season, but a full understanding of the observations requires consideration of the differences in behavior at different locations across the glacier. To address this, we calculated the 2-D strain rate tensor for triads of GPS stations in 2006 and 2007 (Fig. 1). In 2004, the GPS stations were deployed nearly collinear, which is not optimal for strain calculations. We therefore do not calculate strain from the 2004 GPS data, and instead interpret only the 2004 GPS station velocities. We do note that Roux and others (Reference Roux, Walter, Riesen, Sugiyama and Funk2010) investigated the displacements of additional on-ice reflectors measured with theodolite during strong deformations of the 2004 lake drainage. They showed that for at least some crevasse icequakes, the tensile fault plane orientations changed in response to a changing strain field.
In 2006, the seismic and geodetic networks overlapped in the region within 500 m downstream of Gornersee (Fig. 1e), allowing for a direct comparison of strain rates and icequake activity. This is not the case for the configurations in 2004 (Fig. 1d) and 2007 (Fig. 1f), when the seismic and geodetic networks were adjacent and non-overlapping. Supplementary Movie SVideo1 shows the spatiotemporal evolution of icequakes and the calculated strain field through the entire ablation season of 2006.
The strain rate tensor from each GPS triad represents the mean strain rate and orientation within the area of that triad, and we interpret the time series from each triad independently for perturbations associated with lake drainage or diurnal variations. We compare these with the icequake rate, calculated as the number of icequakes in 3 h bins throughout the season. For 2006 when the seismic and geodetic networks overlapped, the icequake rates are calculated from the set of icequakes occurring within each strain triad (Fig. 3 and Fig. S2). For 2007, when the seismic and geodetic networks do not overlap, the icequake rate is calculated from all available icequakes and compared with each individual triad (Fig. 4 and Fig. S3).
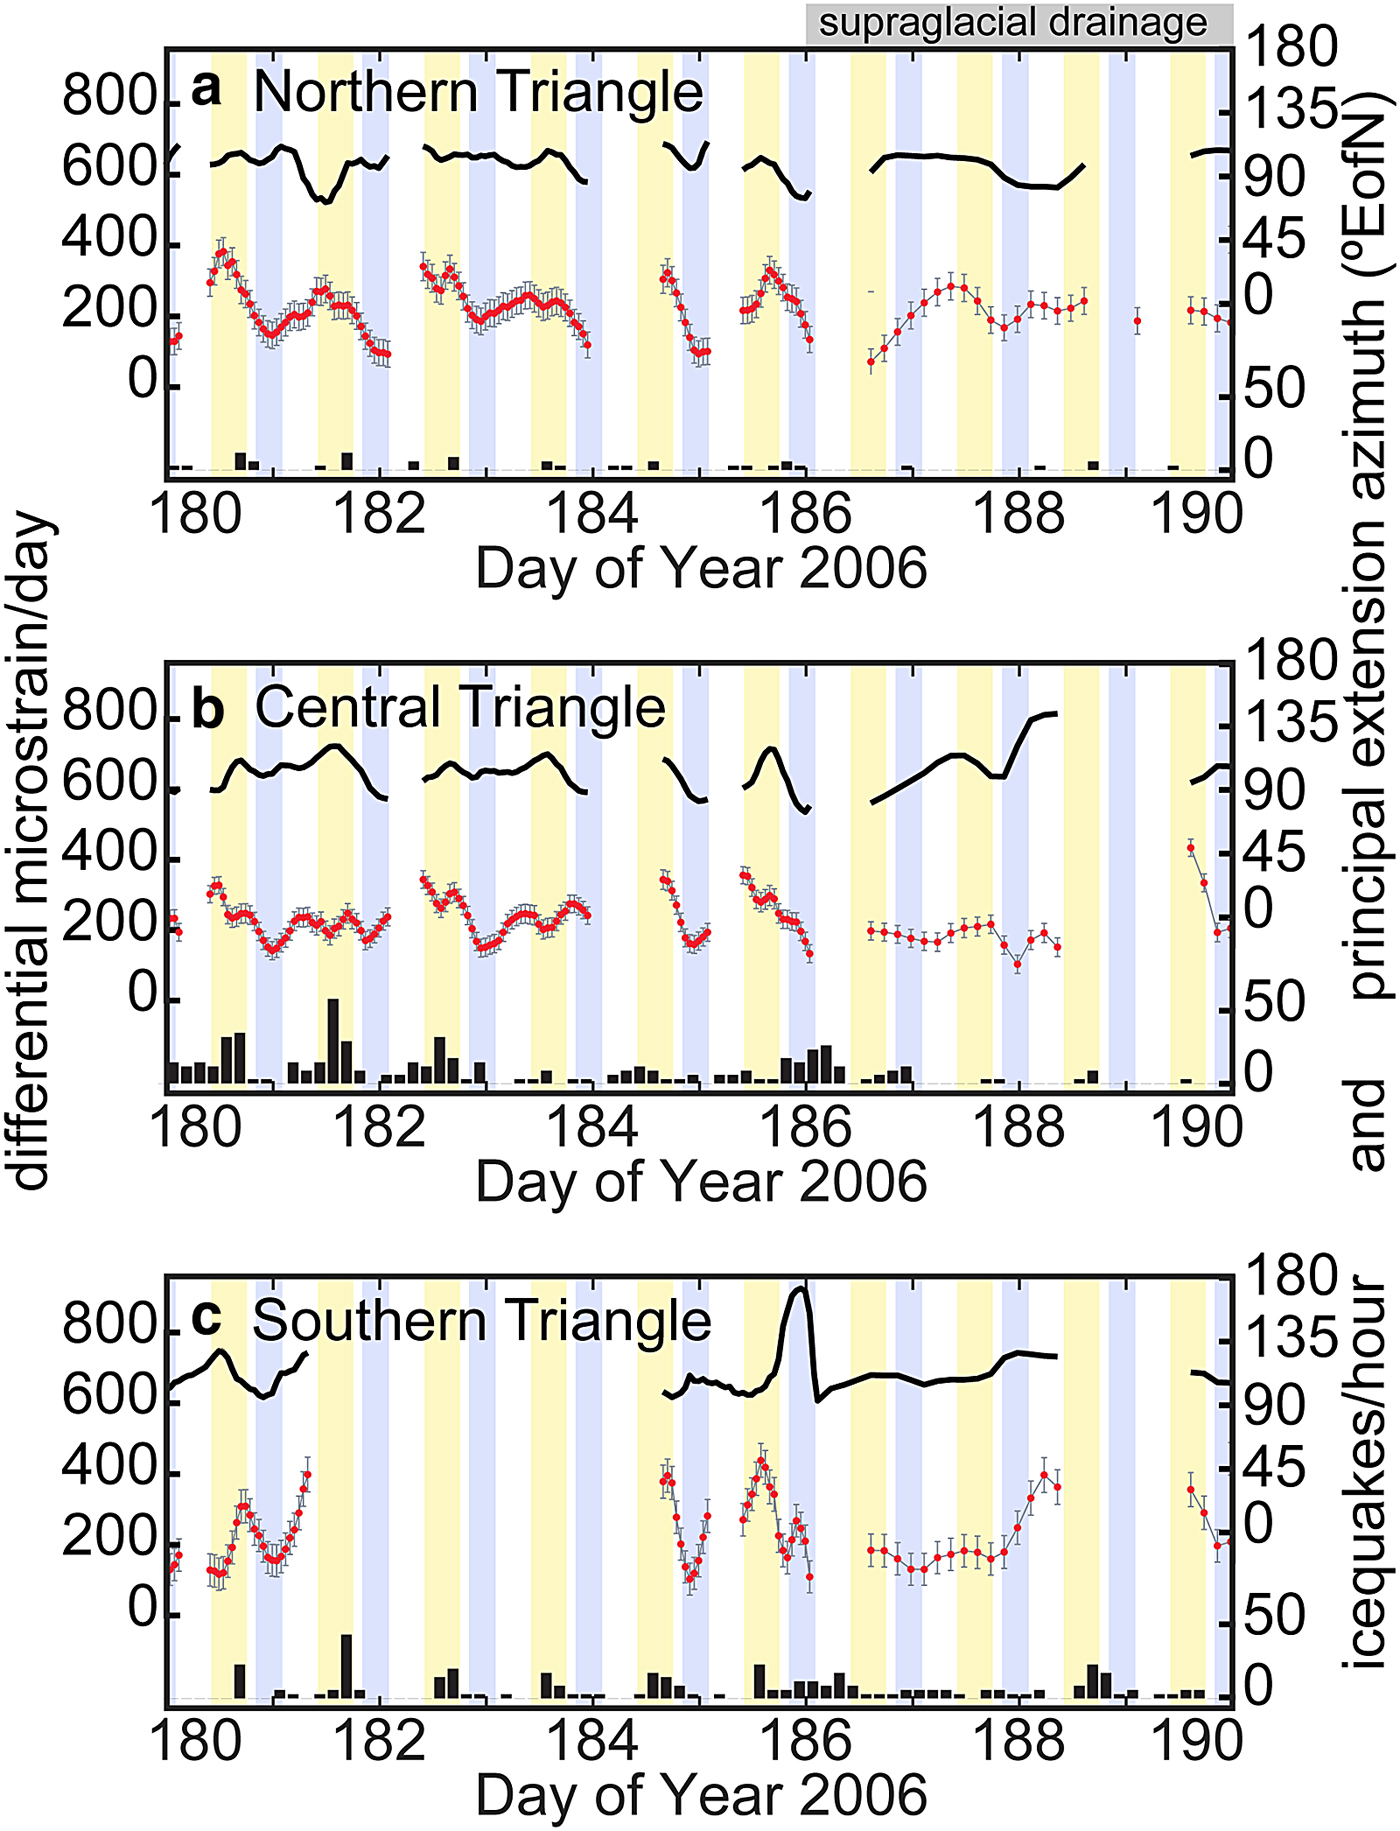
Data from 2006. Differential strain rate (red line with error bars), azimuth of principal extension axis in degrees East of North (black line) and icequake activity within each triangle (histograms) for (a) northern, (b) central and (c) southern strain triangles, as indicated in Figure 1e. Yellow- and blue-shaded regions indicate daytime and nighttime periods, as defined in the text. Note little change in differential strain with onset of drainage (day 186). Also note that diurnal strain peaks during daytime in all triangles.
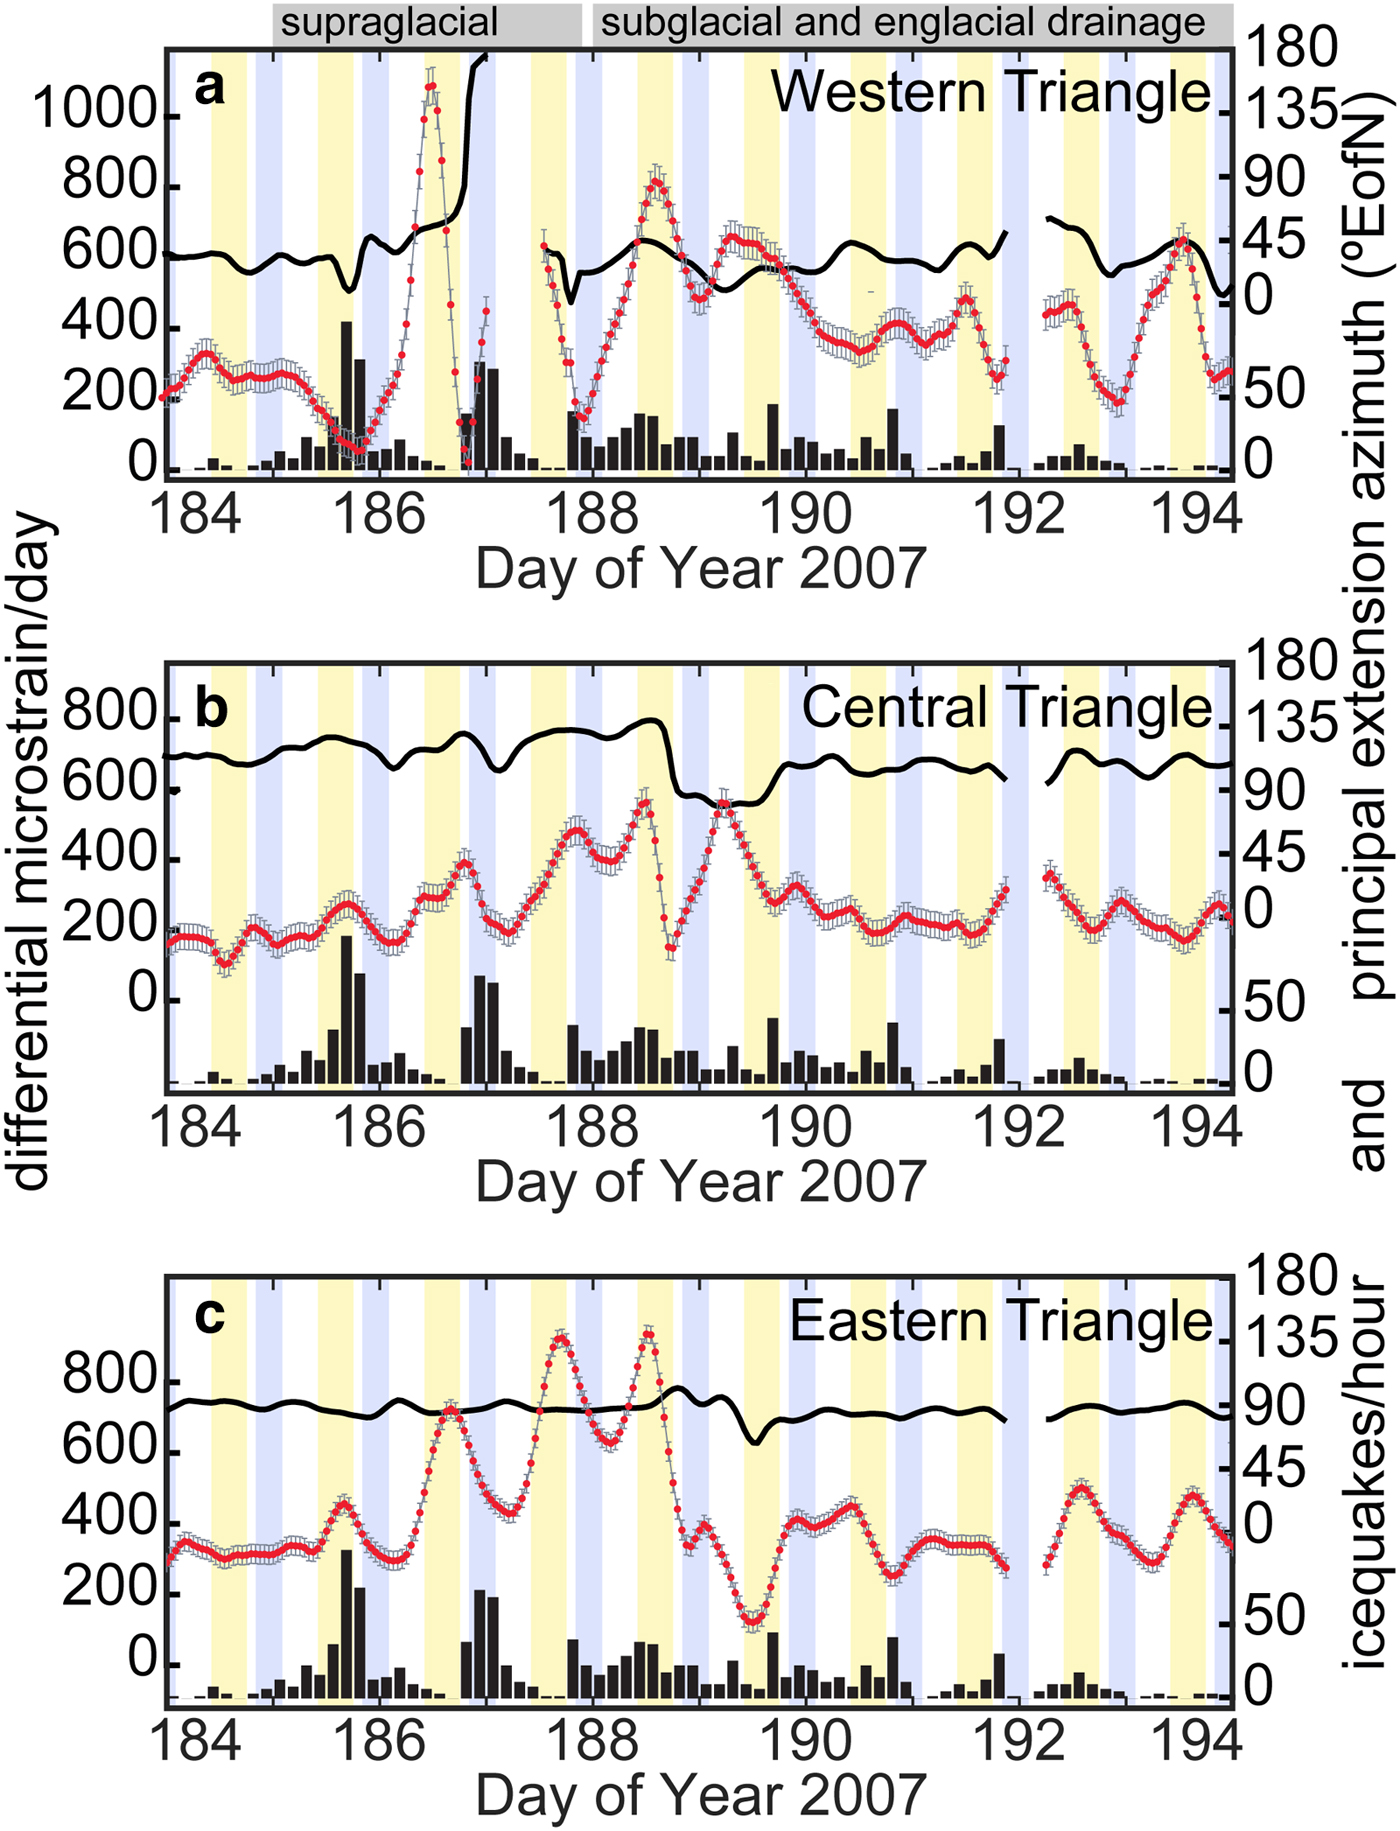
Data from 2007. Differential strain rate (red line with error bars), azimuth of principal extension axis in degrees East of North (black line), and icequake activity within entire study region (histogram) for (a) western, (b) central and (c) eastern strain triangles, as indicated in Figure 1f. Yellow- and blue-shaded regions indicate daytime and nighttime periods, as defined in text. Note increase in differential strain with onset of drainage (days 185–189). Also note that following initial drainage, diurnal strain peaks during daytime in eastern triangle and during nighttime in central triangle (days 192–194).
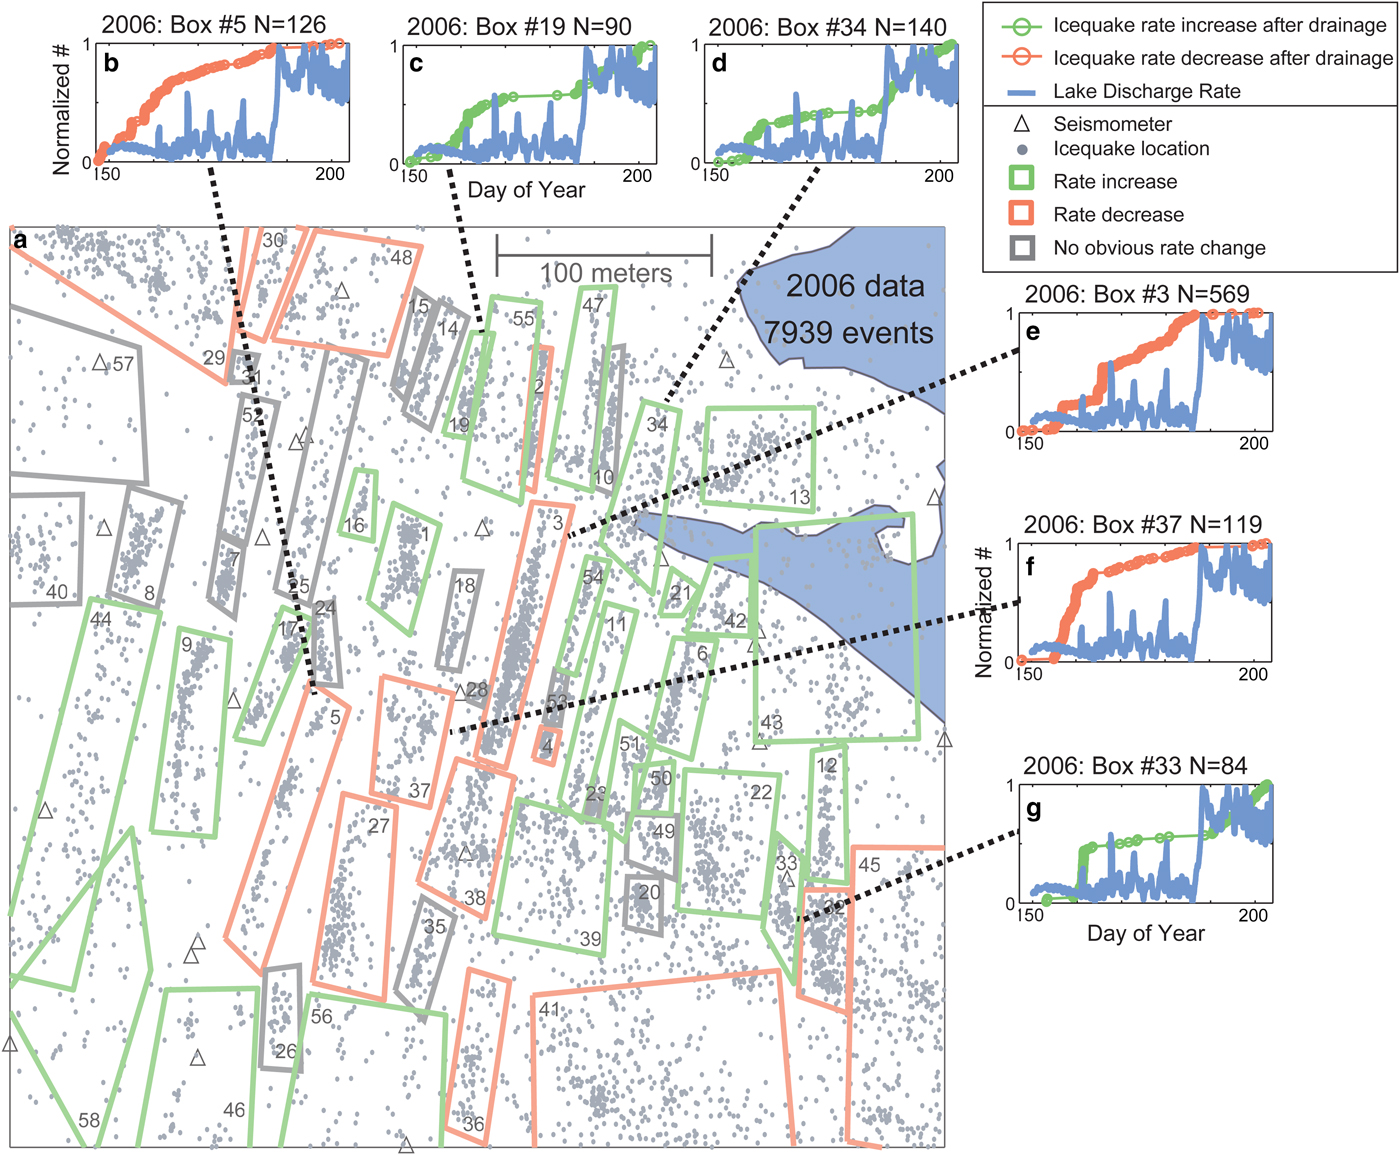
To further understand the spatial variations in crevasse behavior, for each summer we group the icequakes into sub-regions based on their mapped distribution, restricting each sub-region to have at least 7 d of data (not required to be consecutive) and 25 events. For each year of data, we spatially assign the events within a given sub-region a box number (Fig. 5, Figs S4 and S5). This allows us to consider the activity associated with lake drainage or diurnal variations independently within each box (i.e. at each crevasse). To investigate glacier response to lake drainage, we compare the cumulative icequake count within each box with the lake discharge rate. Icequake activity within each box is then characterized as either a rate increase during drainage (seismicity ‘turns on’), a rate decrease during drainage (seismicity ‘turns off’) or as drainage having no effect on seismicity in that box.
Data from 2006. (a) Map of 7939 icequakes (gray dots) and seismic station locations (triangles). Boxes outline 57 sub-regions. (b–g) Normalized lake discharge rates (blue) and normalized icequake rates (green (red) indicate icequake rate increase (decrease) following drainage) within select sub-regions. Subplot headings indicate the year of recording, the box identification number (listed on map) and the total number of icequakes listed as ‘N = ’. Here, we show only a small sample of results depicting clear increases in seismicity rates (green cumulative number of icequake vs. time and green boxes on map) and clear decreases in seismicity rates (red cumulative number of icequake vs. time and red boxes on map).
In the sections that follow, we first describe in detail the observed changes in glacier behavior throughout the ablation season, in particular associated with the drainage of Gornersee (‘Gornergletscher icequakes and surface strain throughout the ablation season’ section). We then consider the spatial variations in glacial response to Gornersee drainage (‘Spatial variations in surface crevasse response to Gornersee drainage’ section). Finally, we describe the spatial variations in the diurnal behavior of Gornergletscher that persist throughout the ablation season (‘Spatial variations in preferred time-of-day for surface crevasse activity’ section).
RESULTS
Gornergletscher icequakes and surface strain throughout the ablation season
We begin by assessing the average icequake activity and surface velocity for the four different time windows within our study period: early season, mid-season, during drainage and post-drainage (Table 2 and Table S7). We find that in all 3 years, icequake activity decreases by ~50% between the early season and the mid-season, while GPS velocities decrease by ~25%. The 2007 GPS speeds exhibit the strongest changes with all down-glacier stations slowing by ~2 cm d−1. In 2006, the early season strain rates range between ~200 and ~400 × 10−6 d−1, with strong diurnal variations of 200–500 × 10−6 d−1 (Fig. S2; Supplementary Text S3). The principal extension axis for all three strain triangles is oriented at ~100°EofN, approximately perpendicular to the crevasses striking ~10°EofN, according to both mapped lineations of icequakes and available aerial photographs. This suggests that the crevasses in this region reflect the local strain field rather than the strain history through which the ice had flowed. The strain rates and strain orientations are similar during the early season of 2007 (Fig. S3), again with strong diurnal variations. These observations represent the ‘background’ levels of glacier activity, which we will compare with the behavior during Gornersee drainage.
Changes in glacier speed and icequake activity throughout melt season
* For precise date range, see Table S6.
† For complete list of average speeds, see Table S7.
During the 2004 subglacial drainage, the mean icequake activity increased substantially, from 76 ± 38 icequakes per day to 396 ± 203 icequakes per day and the icequake activity continued at this elevated rate through the end of the seismic recording on day 188 (Table 2). GPS station velocities show a moderate increase (~25%) during drainage, followed by a return to pre-drainage speeds after active drainage ceases. During the 2006 supraglacial drainage, there were small increases (~10%) in both mean icequake activity and mean GPS velocities at most stations, though down-glacier GPS stations 63 and 75 both showed dramatic increases in speed (by a factor of two). During the 2007 drainage, there was again a slight increase in icequake activity (~10%), but there were large increases (by a factor of two) in GPS station velocities during drainage. Following the drainage, both these velocities and the mean icequake activity returned to values slightly above pre-drainage rates. These study area-wide averages reveal the major transitions in the general behavior of the glacier throughout the summer ablation season and highlight that differences in the Gornersee drainage mechanisms result in differing glacial response. We investigate these differences in more detail below.
We next investigate the 2006 data in terms of the differential strain rate, principal extension azimuth and icequake rate for the three strain triads from 2006 during the initiation of Gornersee drainage (Fig. 3). Unfortunately, the start of the supraglacial drainage coincides with a 12 h geodetic data gap, yet in all three triangles the differential strain rate magnitude remain at ~200 × 10−6 d−1, similar to values observed earlier in the mid-season. The principal extension axis remains ~100°EofN, with the exception of the southern triangle which experiences an ~8 h hiatus in which the strain field rotates ~60°clockwise to a nearly north-south orientation, then back to a south-of-east orientation (Fig. 3c, day 186). The northern and central triangles do not show this behavior, though this may be hidden by the GPS data gap at the time of drainage. The rotation of the southern triangle does not appear to have a net influence on icequake activity within that area. There is a small net increase in seismicity at the central triangle, but it does not appear to correlate to a change in strain rate (Fig. 3b, day 186), though again such a signal may be lost by the coincident data gap. There is also some evidence for a gradual rotation of the strain field in the central triangle a few days after drainage initiates (Fig. 3b, day 188). Overall, the calculated strain rates and icequake rates are consistent with the area-wide averages that suggest the 2006 supraglacial lake drainage induced at most subtle changes in glacier behavior, in stark contrast to the glacier behavior during the 2004 lake drainage.
We turn next to the 2007 data. Figure 4 shows the differential strain rate, principal extension azimuth and whole-region icequake rate for the three strain triads from 2007 during the initiation of Gornersee drainage. When the supraglacial drainage initiates on day 185, there is an immediate increase in surface crevasse icequakes and a ~100 × 10−6 d−1 increase at the central and eastern triangles (Fig. 4b and c), along with a corresponding decrease in differential strain rate in the western triangle (Fig. 4a). Over the subsequent 3 d, the differential strain rate in the eastern triangle closest to Gornersee increases from ~300 × 10−6 to ~800 × 10−6 d−1, with large diurnal variations, while the principal extension axis oscillates between 90 and 100°EofN (Fig. 4c). The central triangle experiences a subtler increase in differential strain rate (Fig. 4b), while the down-glacier western triangle experiences wild fluctuations in both differential strain rate (800 × 10−6 d−1) and orientation (>90° rotation). After subglacial drainage starts on day 188 (July 7), the strain rate gradually decreases to a background rate of ~200–400 × 10−6 d−1 and the regional icequake activity decreases to pre-drainage levels (Table 2), though still with diurnal pulses of both strain and icequakes. Overall the 2007 drainage appears to have induced large changes in glacial flow rate but only slight increases in icequake activity, the opposite of the behavior observed during 2004 lake drainage.
Spatial variations in surface crevasse response to Gornersee drainage
The area-wide icequake behavior following the 2004 drainage was as expected, in that the rapid subglacial drainage resulted in a strong increase in icequake activity (Roux and others, Reference Roux, Walter, Riesen, Sugiyama and Funk2010). One might have expected a similar increase in activity following the drainages in 2006 and 2007, but the area-wide averages demonstrate slight to negligible increases in icequake activity. Calculated strain rates meanwhile indicate slight increases in 2006 but strong increases in 2007. These perplexing differences in behavior led us to investigate the spatial variations in drainage response at the scale of individual crevasses. The mapped crevasses from 2004, 2006 and 2007 are shown in detail in Figure S4, Figure 5 and Figure S5 respectively, with numbered sub-regions assigned to each crevasse indicated by boxes. These figures summarize which regions exhibited a clear increase in activity during drainage and which regions exhibited a clear decrease in activity. Sub-regions with no clear change in icequake activity are also shown.
For 2004, we find that following lake drainage, the seismicity rate increases in most sub-regions (Fig. S4). This is consistent with the dramatic increase in seismicity observed in the area-wide averages and is similar to observations of supraglacial lake drainages on the Greenland ice sheet (Carmichael and others, Reference Carmichael2015). However, for the 2006 (Fig. 5) and 2007 (Fig. S5) data, we find that in some locations, lake drainage accelerates or initiates the icequake activity (‘turns on’, sometimes after a time-delay), while in other regions, lake drainage diminishes or halts the icequake activity (‘turns off’, again sometimes after a time-delay). In all years, there are some locations where icequake activity was either unaffected by the lake drainage or the data were too sparse to discern any rate change. In aggregate, the combination of these increases and decreases results in a relatively constant overall seismicity rate for the 2006 and 2007 data, showing no strong seismicity rate change at the time of lake drainage.
The observation that the crevasses primarily ‘turned on’ after the 2004 drainage suggests that crevasse response to drainage should be broadly uniform across the full region (Fig. S4). Instead in 2006, we find that crevasses that ‘turn on’ are typically located near other crevasses that ‘turn on’ and indeed the pattern is not completely random (Fig. 5). However, the distribution of ‘on’ regions and ‘off’ regions have an interspersed patch-work pattern. The spatial pattern of small strain responses to 2006 lake drainage (Fig. 3) does not appear to correlate with the spatial pattern of promoted or inhibited icequake behavior (Fig. 5) in any straight forward way, leading us to suspect the perturbations in the 2006 icequake behavior are caused by highly localized effects.
In 2007, there is a tendency for the regions that ‘turn off’ to be closer to the lake, but there are some exceptions (Fig. S5). Because the seismic and geodetic networks in 2007 do not overlap, we cannot directly compare the distribution of icequakes and strain field behavior for the same regions. However, we do note that the peak increase in icequake activity occurs ~1 d before the peak increase in differential strain rate in the eastern triangle closest to Gornersee (Fig. 4c). This may suggest glacier response to drainage initiated further north, within the footprint of the seismic network, and then propagated south.
Spatial variations in preferred time-of-day for surface crevasse activity
One of the strongest features observed in both the crevasse icequakes and the calculated strain rates is the diurnal pulsing evident in both. We are confident that these are real earth signals and not artifacts of network sensitivity. Though the amplitude of the diurnal modulation varies, it is present throughout all four phases of the ablation season each year. To investigate further, we examine icequakes at each individual crevasse, as defined by the sub-regions used in ‘Spatial variations in surface crevasse response to Gornersee drainage’ section, to assess if there is a preferred time-of-day for icequake occurrence (i.e. daytime or nighttime). For simplicity, we define daytime as local Swiss time 12:00 to 20:00 (8 h total) and nighttime as local Swiss time 22:00 to 24:00 and 0:00 to 04:00 (6 h total). These are equivalent to daytime hours of 10:00 to 18:00 UTC and nighttime hours of 20:00 to 24:00 UTC and 00:00 to 02:00 UTC. We categorize each box as hosting seismicity primarily in the daytime (Fig. S6), primarily in the nighttime (Fig. S7) or no strong time-of-day preference (Fig. S8).
We find that locations that host primarily daytime events tend to be in the northeast of our study area and locations that primarily host nighttime events tend to be in the southwest (Fig. 6a). This dichotomy is clearly seen in all 3 years of recording. We know this is a sustainable dichotomy (i.e. not dominated by individual bursts of activity that last only a few days) because we require each sub-region to include icequakes on at least 7 different days (not required to be contiguous). Similarly, we avoid artifacts from lack of sufficient data because we require each box to have 25 or more events. These restrictions help us focus on sustainable features common over the full observation period, avoiding one-time bursts of seismicity in a short time period. Our findings show that there is a clear diurnal spatial pattern within the seismic data.
(a) Sub-regions of icequakes from 2004 (blue boxes), 2006 (green boxes) and 2007 (red boxes) that exhibit preference for occurrence during day (yellow highlight) or night (dark blue highlight). Sub-regions with no strong preference are indicated with gray boxes. Approximate Gornersee extent shown in blue. Dashed orange line indicates shear zone. (b) 2006 ortho-photograph of the same region, with strain networks from 2006 (green) and 2007 (red). Heavily crevassed shear zone (dashed orange line) and darker medial moraine area indicated.
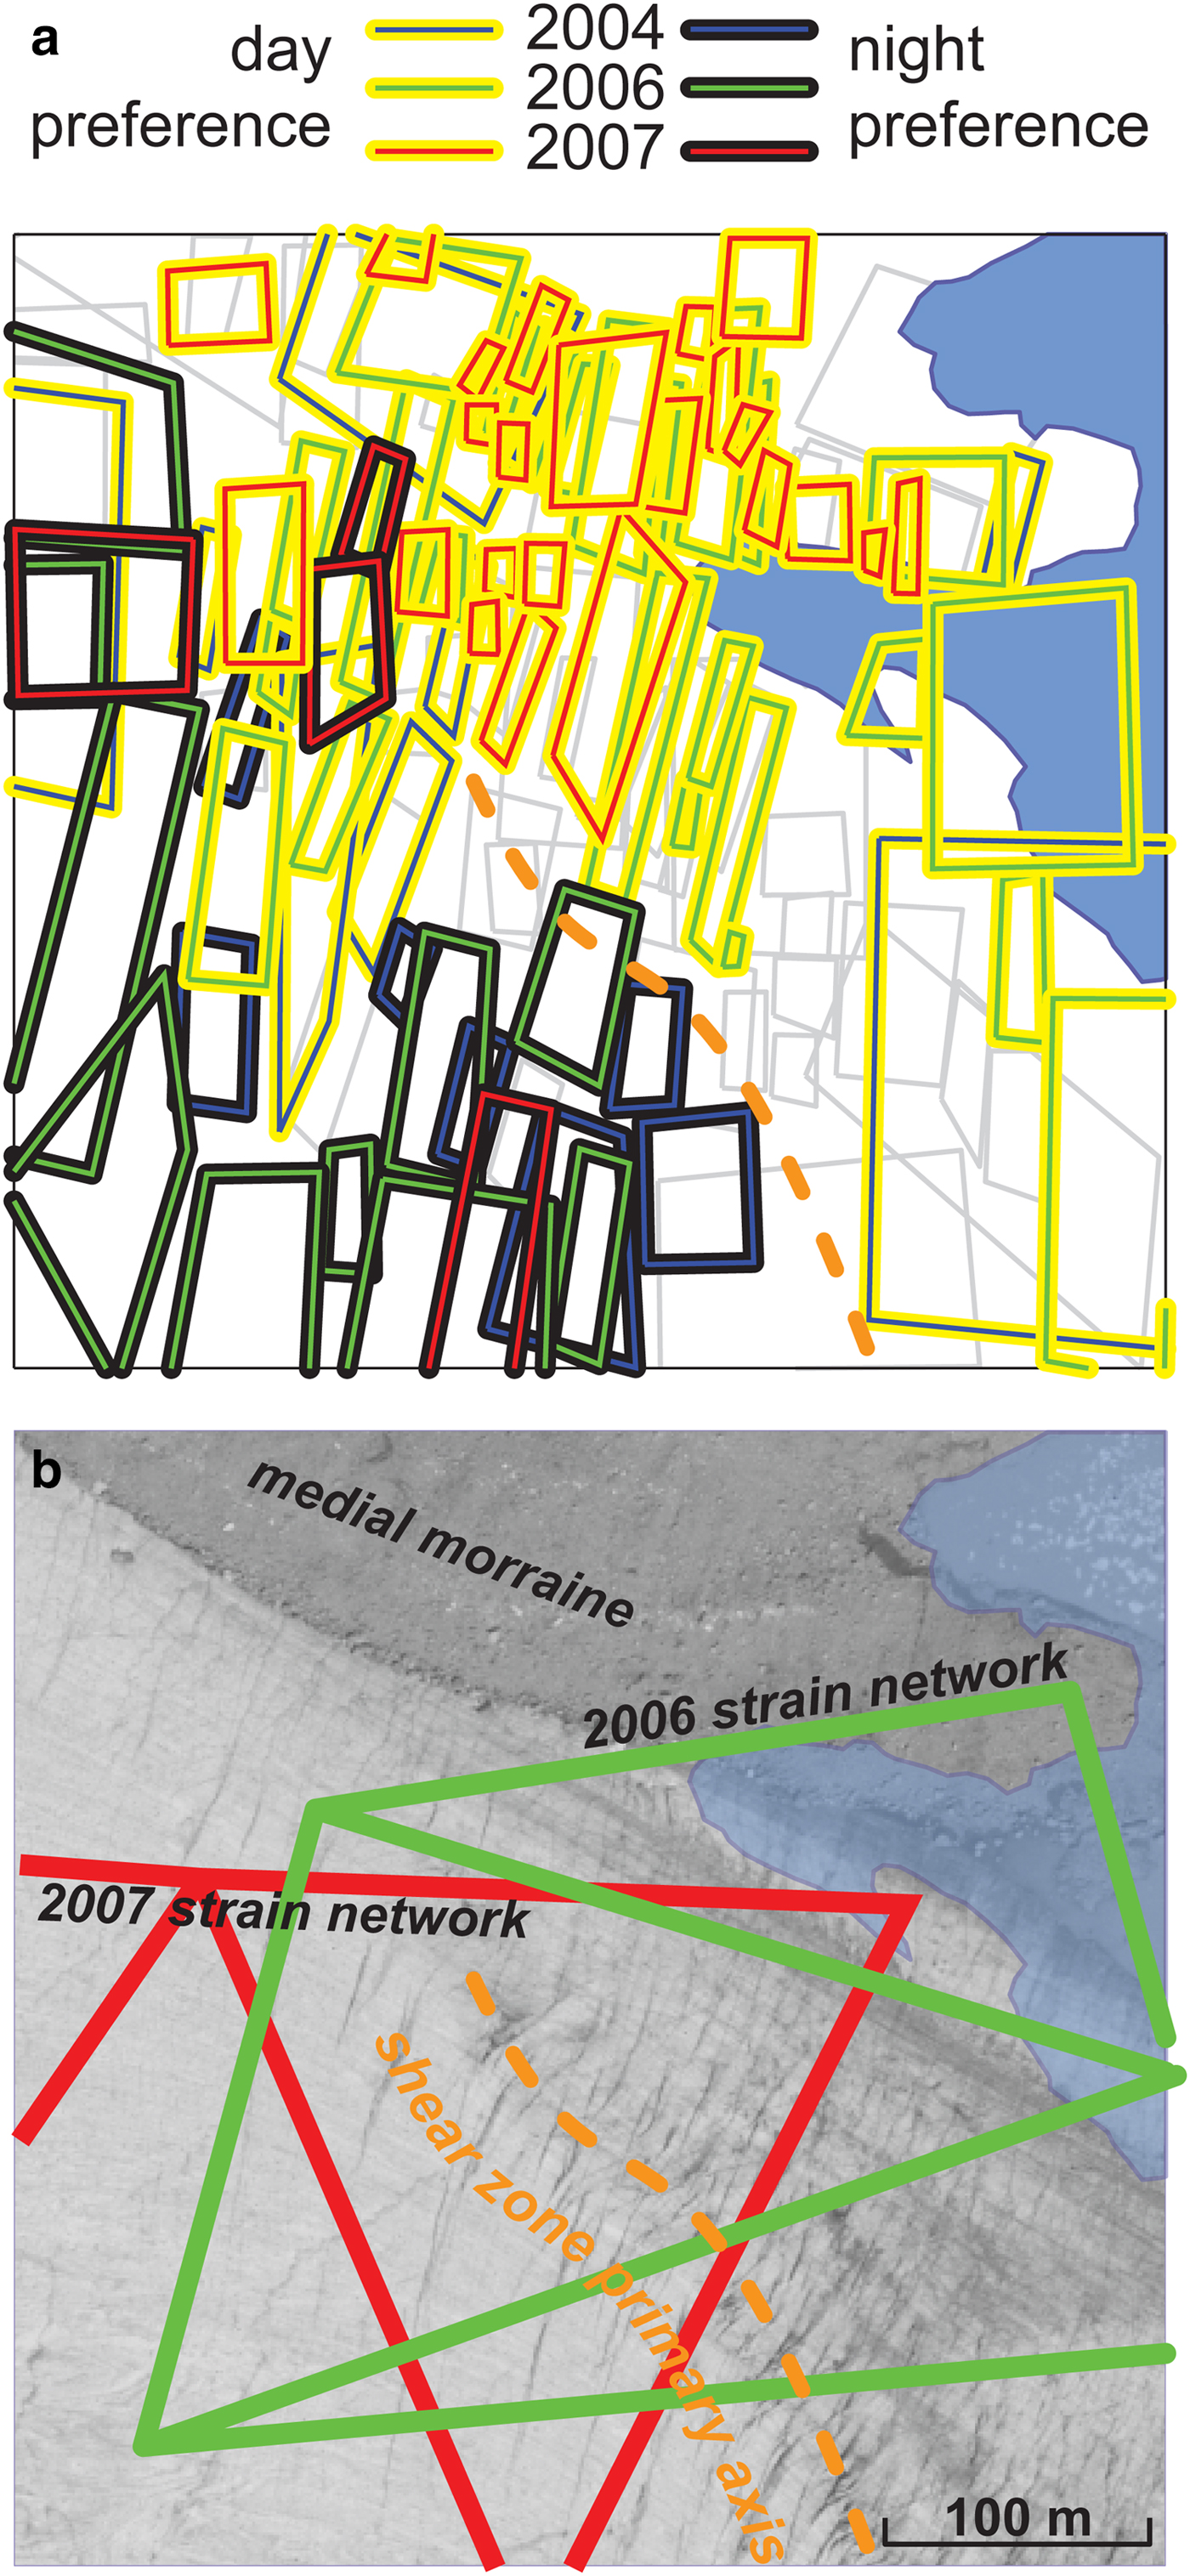
Using either aerial photography or the lineations mapped by the icequakes, we find a clear morphological distinction between the sub-regions of preferred daytime icequakes (in the northeast) and nighttime icequakes (in the southwest) (Fig. 6b). Between these two regions, there is a clear zone with non-linear crevasses, visible in the aerial photography as a series of clockwise deviations from the otherwise straight crevasses oriented ~10°EofN (Fig. 6b). This is also evident as a band of diffuse icequakes between the well-defined crevasse seismicity (Fig. 5). This complexity suggests the presence of a concentrated shear zone between the faster moving ice in the center of Grenzgletscher and the slower up-glacier section of ice at the edge of Gornersee. These crevasses necessarily reflect a combination of in situ stresses and the stress fields through which they previously moved (Colgan and others, Reference Colgan2016). The observation that principal extension is approximately perpendicular to crevasse strike suggests that these crevasses primarily reflect the in situ stress state. One might then expect that the diurnal rotations of the strain field might bring the principle extension axis more perpendicular to crevasses in the northeast of the study region during the daytime, while the principal extension axis is more perpendicular to crevasses in the southwest of the study region during the nighttime. However, we do not see clear evidence that fractures on either side of the central shear zone are consistently oriented differently from one another. We must therefore look for a different mechanism beyond variations in fracture orientation.
We next consider the diurnal variations in the magnitude of differential strain rate. During 2006, the northern triangle is located within the ‘daytime’ region, while the central and southern triangles straddle the day/night boundary (Fig. 6). There are no strain triangles in 2006 that solely sample the ‘nighttime’ region. We find that during 2006, the differential strain rate generally increases and peaks during daytime hours (Fig. S2 and Fig. 3), with strong diurnal variations of 200–500 × 10−6 d−1 in magnitude. This is particularly evident during the early season (Fig. S2) and mid-season prior to the initiation of drainage (Fig. 3, prior to day 186), and is consistent with icequakes preferentially occurring during the daytime in this area. During 2007, the strain triangles cover a wider area, such that the eastern triangle covers approximately the same area as the 2006 strain network. The central triangle is offset to the west and encompasses the expected ‘nighttime’ region, while the western triangle is outside the region of observed seismicity. We find that the eastern triangle of 2007 behaves similarly to the triangles from 2006, with peak strain rates in the afternoon during ‘daytime’ hours (Fig. S3 and Fig. 4). The central triangle, on the other hand, exhibits low daytime strain and peak strain instead occurs during nighttime hours. This is most evident during the early season (Fig. S3) and after peak drainage (Fig. 4, after day 192). Overall these spatial patterns in the timing of peak strain are consistent with the observed spatial patterns in the timing of peak icequake occurrence.
It is also possible that diurnal rotations of the principal extension axis differ between the ‘daytime’ and ‘nighttime’ regions, and could be contributing to the pattern of icequake activity. Unfortunately, the phase of diurnal rotation (i.e. what time-of-day is most perpendicular to crevasse orientation) is somewhat obscured by data gaps in the time series, particularly for the 2007 central triangle, which is most representative of the ‘nighttime’ region (Fig. S3). Based on the available data, the 2007 central triangle experiences large diurnal fluctuations in orientation of ~45°, particularly in the early season. It appears that principal extension is most perpendicular to crevasse strike during daytime hours, and that the nighttime orientation of 45° would be unfavorable to generating icequakes. While the spacing of GPS receivers during the study years was not ideal for testing this hypothesis, these findings suggest that the variations in crevasse icequake activity are more sensitive to diurnal variations in flow rate than they are to rotations in the principal strain axis, even when those rotations are routinely more than 10°.
DISCUSSION
Summary of results
Here, we summarize the principal results from our observations. Consistently in each year (2004, 2006 and 2007), we find icequake activity and glacial velocity are highest in the early season (prior to June ~9–11), after which the icequake activity and glacial velocity both decrease in mid-June. Icequake activity levels remain lower throughout the mid-season from mid-June until lake drainage occurs in early July. Subglacial lake drainage in 2004 resulted in an increase in glacier speeds of ~20% and a fourfold increase in icequake activity in all regions across the seismic network. By contrast, in 2006, the relatively slow supraglacial lake drainage that lasted ~3 weeks resulted in negligible differences in glacial speed and differential strain rate amplitudes, but it did result in some short-lived large rotations of the glacial strain field. During this time, icequake activity was promoted at some crevasses and inhibited in others. During the 2007 11 d drainage, the onset of subglacial drainage corresponds to a >50% increase in glacial speeds and strain rate amplitudes, while icequake activity once again showed spatial variability, increasing at crevasses in some regions and decreasing in others, resulting in a net no-change in icequake activity across the combined region in both the 2006 and 2007 data.
Throughout the entire summer ablation season in each year, we observe clear diurnal pulses in icequake activity and differential strain rate magnitude. For crevasses in the northeast area of our study region closer to Gornersee, icequake activity preferentially occurs during the late afternoons (12:00 to 20:00 local Swiss time), while in the southwest area of our study region, icequakes preferentially occur overnight (22:00 to 24:00 and 0:00 to 4:00 local Swiss time). These same diurnal patterns are observed in all 3 years and coincide with morphological variations in crevasse strike indicating a concentrated zone of shear flow (Fig. 6). The strain rate in the northeast area generally increases and peaks during late afternoons, as demonstrated by the strain triangles of the 2006 network (Fig. S2) and the eastern triangle of the 2007 network (Fig.S3c). The strain rate in the southwest area is generally at its lowest point during late afternoons, as demonstrated by the central triangle of the 2007 network (Fig. S3b). Though the principal strain axis is observed to rotate by >10° daily throughout the season, the timing of the rotations in the central triangle of 2007 seems to be unfavorable for nighttime icequake occurrence, contrary to observations. This suggests the diurnal variations in icequake locations are more sensitive to diurnal variations in flow rate, mitigated by the differential motion of sections of ice separated by the observed shear zone, than they are to rotations in the principal strain axis.
Hydraulic network development influences crevasse icequakes and strains
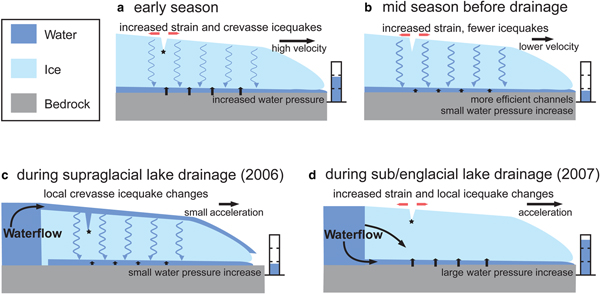
In the beginning of the season, we find increased strain rates corresponded with increased icequake activity (Figs S2 and S3). During this early season time period, the influx of water is greater than the amount of water the relatively inefficient subglacial hydraulic network can accommodate, which increases water pressures within the system (e.g. Iken and Truffer, Reference Iken and Truffer1997; Anderson, Reference Anderson2004; Werder, Reference Werder2009; Werder and others, Reference Werder, Schuler and Funk2010). We propose that in the beginning of the season, as the pressures increase and the glacier reaches the flotation level, basal resistance decreases, promoting increased basal sliding (Fig. 7a; Cuffey and Paterson, Reference Cuffey and Paterson2010). The basal sliding increases surface motion and strain at the stations near the lake moving slower than the stations downstream, driving surface straining within the system.
Cartoon cross-section of the glacier (light blue), lake water (dark blue) and glacier bed (gray). This schematic representation shows the proposed relationship between meltwater, icequake activity and glacial motion during (a) early season, (b) middle season prior to Gornersee drainage, (c) supraglacial drainage in 2006 and (d) subglacial and englacial drainage in 2007. Surface icequakes are depicted as crevasse openings in regions of strain increases (red arrows). Black horizontal arrows indicate glacier motion. Wavy blue arrows indicate water percolation to the glacier base, and vertical black arrows and adjacent standpipes indicate basal water pressure increase. Water flow directions during Gornersee drainage are also shown.

Around the time period of ~9–11 June, we observe that both the background strain rate and the magnitude of the diurnal variations decrease as does the icequake activity (Figs S2 and S3; after day of year 160 and 162, respectively). We suggest the cause of these rate reductions is that early season drainage water has eroded larger subglacial channels that can accommodate more meltwater. In the case of Gornergletscher, these larger meltwater channels can drain water into the channel networks faster, lower the diurnal pressure fluctuations, which in turn will diminish pressure build-up (Werder and others, Reference Werder, Schuler and Funk2010). This lowering of the pressures causes resistance between the base of the glacier and its bed to increase, slowing the motion of the glacier (Fig. 7b). Overall, we attribute the mid-season reduction in strain rates and icequakes to the lowering of the surface strain resulting from lowering of subglacial water pressure.
Gornersee drainage has variable effects on Gornergletscher
Our initial expectation was that lake drainage would coincide with an increase in surface motion and increase in the number of icequakes caused by increased meltwater to the base of the glacier and subsequent overpressurization, enhance sliding and uplift (Fig. 7c). Indeed, that was what was observed in 2004 when surface motion and strain rates increased up to 40% for 4 d and in 2007 for the western triangle when surface motion and strain rates increase up to 100%. However, uniformly increased surface speeds, strain rates and icequake rates were not observed in 2006 when the lake drained slowly over ~3 weeks supraglacially. One explanation consistent with these observations is that in 2006 there was a relatively low flux of water to the base that occurred over a much longer duration than the other drainages (Table 1), resulting in not enough water volume or water volume rate change to increase the pressure within the system over a wide region (Fig. 7d).
In contrast, the 2007 sub/en/supraglacial drainage of the lake shows a very large increase in strain rates in all three triangles (Fig. 4), but an associated increase in icequakes at only some of the crevasses (Fig. S5). It is possible that the 20°C drop in air temperature coincident with the onset of drainage in 2007 (Fig. 2c, day 185) could have suppressed melt runoff generation, promoting creep closure of the subglacial hydraulic network (Copland and others, Reference Copland, Sharp and Nienow2003). This potential reduction in the channels' capacity to accommodate water flow would be spatially heterogeneous, where the originally larger channels would remain open and the smaller channels would be the first to close. As a result, pressure-enhanced sliding variations are also expected to be heterogeneous. While the lake was still draining, the strain rates decreased as did the icequake rates (Fig. 3; after day ~190). Overall, because there is no obvious consistent signature of the icequake rate behavior season to season, and no clear spatial correlation to changes in the strain field, we conclude that drainage perturbations to icequake behavior near Gornersee are indicative of highly localized effects such as particular drainage routes, while perturbations to the strain field indicate the broader response of Gornergletscher as a whole.
Diurnal crevasse activity at Gornergletscher confluence
We find there are distinct spatial groupings of icequakes that specifically favor daytime (northeast portion of our study region) or nighttime (southwest portion of our study region) occurrence. One hypothesis that might explain these differences is that these spatial groupings are a signature of differences in basal conditions (e.g. basal water pressure, basal topography) and resulting differences of sliding-induced ice deformation. For example, one bed region may receive more meltwater during the day than the other. Alternatively, the diurnal variations in flow speed combined with the local changes in the glacial flow direction (i.e. ‘turning a corner’) can shift which regions undergo tensile stresses. If so, this could indicate that surface fracturing depends not only on stress, but also on stress change and stress change orientation. This hypothesis is based on observations from aerial photography of our study region. The aerial photography depicts a concentrated shear zone between sections of ice trending southeast to northwest near the Gornergletscher–Grenzgletscher confluence. The shear zone between these two sections of ice coincides with the transition between regions that primarily host daytime icequakes and those regions where nighttime icequakes are more prevalent.
We speculate that as Grenzgletscher traverses north and joins Gornergletscher, the stress regime within the ice in the northeast part of our study differs from the main glacier stream. The ice at the outside edge of Grenzgletscher starts to turn counterclockwise and flow west down the glacial valley, but it is inhibited from doing so by the confluence with Gornergletscher. As a result, this ice is subject to different stresses and strains than the main ice stream and is pushed north and slightly to the east by the motion of the primary ice stream. This motion is supported by the north and northeast velocities of the up-glacier GPS stations (purple arrows, Fig. 1). It is possible that the stress of this impact and rotation is so substantial that it can create new crevasses within the surface concentrated shear zone (Fig. 6). However, we expect that while the crevasse pattern in the study region principally reflects the local stresses, it may also be sensitive to the stress fields through which the crevassed ice had previously propagated, whether or not these particular crevasses are relict from upstream (e.g. Colgan and others, Reference Colgan2016). As the ice enters our study region, it is preconditioned by damage zones with a preferential orientation, which may lead to more efficient channeling of daily surface meltwater from the surface to the base on one side of the shear zone than on the other, which may in turn lead to the observed difference in diurnal pulses of strain. In this case, the two different regions may be responding to the same overall strain field as it rotates diurnally. Either way, this section of ice and adjacent damaged shear zone, with its rheology and complicated stress orientations and rotations, is a key component driving the spatial and temporal signature of the glacier movement and associated icequakes.
CONCLUSIONS
In this work, we analyze three summer seasons of seismic, GPS, meteorological and ice-marginal lake-level data collected at Gornergletscher, Switzerland during the ablation seasons in 2004, 2006 and 2007. Using these seismic data, we create an icequake catalog for each year using a Rayleigh Wave coherence method (Roux and others, Reference Roux, Walter, Riesen, Sugiyama and Funk2010). For GPS station configurations where strain calculations are feasible, we compute 2-D strain rates based upon the GPS station displacements. In 2006, the GPS and seismic networks overlapped, but in 2004 and 2007, the two networks were adjacent to each other. In all years, within our study region, we find the GPS stations near the lake are moving slower than the GPS stations down-glacier, creating a velocity gradient. There is approximately an order of magnitude difference between the slowest and fastest moving stations, resulting in large strain rates across our study region. There is a consistent transition from the early season to the mid-season each year during which the icequake activity decreases by ~50% and the GPS velocities decrease by ~25%.
We find that lake drainage has different effects on the glacier system depending on the degree to which the lake drainage was subglacial. When the lake drainage is relatively fast and subglacial, as in 2004, the drainage caused a ~25% increase in glacial speed and a fourfold increase in icequake activity. However, when the lake drainage is not primarily or not only subglacial, as in 2006 and 2007, we find that icequake activity is promoted at some crevasses and inhibited at others. The combination of these rate changes counteract each other and result in no obvious change in the area-wide icequake rate. During the 2006 supraglacial drainage, the GPS velocities and strain rates remained mostly constant, although the southern strain triangle did exhibit a strong rotation at the drainage onset. During 2007, strain rates increased by ~150% as the drainage network develops and subglacial drainage initiates. For these 2007 data, however, there is no clear correlation between the spatial pattern of the changes in icequake activity following drainage and the strain rate responses. In general, lake drainages that route their water flux quickly subglacially at higher rates will lead to uniformly larger strain and icequake rate increases. During lake drainages with more moderate flow rates, the response of crevasse icequakes is more variable suggesting that the icequake behavior is governed by more local processes and features.
We observe diurnal pulses, corresponding with daily temperature fluctuations, in both icequake activity and glacial strain throughout the season. Many crevasses exhibit preference of icequakes occurring during a particular time-of-day, with the northeast of our study region prone to daytime icequakes and the southwest prone to nighttime icequakes. This dichotomy is a robust feature and is consistent in all 3 years studied. Both differential strain rate magnitude and principal extension axis orientation exhibit diurnal variations, but the spatial division between daytime- and nighttime-preferred crevasses is most consistent with diurnal variations in flow rate as the primary governing mechanism, perhaps driven by the differential movement across the observed concentrated shear zone.
Overall, we demonstrate the potential advantages of joint cryoseismology–cryogeodesy study, with advanced icequake location techniques and high rate GPS observations. Independently measuring the glacial strain field and resulting crevasse icequakes allows us to interrogate crevasse processes more fully than with icequake locations alone. For Gornergletscher, we demonstrate the surprising result that the drainage of Gornersee is not always the dominant driver of glacial activity in a given ablation season. In fact, in some instances, the diurnal changes may be the most dynamic signals with the largest strain variations. Further study with higher spatial geodetic resolution is needed to fully understand the glacier's dynamic reaction to the ablation season near Gornersee.
ACKNOWLEDGEMENTS
We thank those from the ETH group who collected and processed these icequake data and GPS data that we use in this work. The seismograms and GPS data used in this project are available upon request. The lake level, lake drainage and meteorological data come from published sources referenced in the manuscript. We also thank David Heeszel for helpful discussions pertaining to this work, and Doug MacAyeal and Kelly Brunt for their assistance with our original proposal. To complete this work, LG was funded by the Southern Regents Educational Board, KL was funded by the Louisiana Board of Regents RCS #LEQSF(2014-17)-RD-A-04, DK was funded by NSF award #1239277 titled ‘EAGER: Expanding Our Understanding of Seismic Sources via Investigations of Icequakes on an Alpine Glacier’ and FW's salary was funded by the Swiss National Science Foundation (GlaHMSeis Project PP00P2_157551).
SUPPLEMENTARY MATERIAL
The supplementary material for this article can be found at https://doi.org/10.1017/aog.2018.32


 Open access