Caffeine is a widely consumed psychoactive substance found in a variety of beverages including coffee, tea, soft drinks, energy drinks, as well as in products containing cocoa or chocolate and even in medications(Reference Frary, Johnson and Wang1). Caffeine is metabolised in the liver, where it is transformed into several metabolites, primarily excreted through urine(Reference Arnaud and Fredholm2). The half-life of caffeine is approximately 4 h, depending on the dose administered. Caffeine and its metabolites reach peak levels in urine around 5–12 h after their maximum plasma concentrations(Reference Arnaud and Fredholm2,Reference Martínez-López, Sarriá and Baeza3) . Notably, caffeine metabolites do not return to basal levels after 24 h, indicating slow metabolism and prolonged elimination(Reference Arnaud and Fredholm2,Reference Martínez-López, Sarriá and Baeza3) . About 84 % of ingested caffeine is metabolised into paraxanthine, followed by 12 % into theobromine and 4 % into theophylline. These metabolic pathways also generate various other metabolites(Reference Arnaud and Fredholm2). Consequently, urine samples from caffeine consumers typically exhibit low concentrations of caffeine. Therefore, the primary method for evaluating caffeine intake is through the analysis of its metabolites. The amount of caffeine metabolites can vary depending on the dosage and frequency of consumption, as well as individual sensitivity(Reference Arnaud and Fredholm2). Consumption of caffeine from dietary sources is associated with several effects on the human body, including muscle strength(Reference Batista-da-Silva, Limirio and de Oliveira4,Reference de Oliveira, Limirio and Batista-da-Silva5) , stimulation of the central nervous system(Reference Fiani, Zhu and Musch6), beneficial effects on microvascular function(Reference Noguchi, Matsuzaki and Sakanashi7) and potentially reducing serum uric acid (UA) levels(Reference Park, Kim and Ahn8).
UA is the end product of both exogenous and endogenous purine metabolism in humans(Reference de Oliveira and Burini9,Reference Kaneko, Aoyagi and Fukuuchi10) . Exogenous purines are obtained through dietary protein intake, contributing to approximately one-third of UA production(Reference Kaneko, Aoyagi and Fukuuchi10,Reference Bobulescu and Moe11) . On the other hand, endogenous purines stem from the breakdown of nucleoproteins, constituting the remaining two-thirds of UA production(Reference Bobulescu and Moe11–Reference Ekpenyong and Daniel15). Factors such as reduced renal and intestinal excretion, increased production or a combination thereof can elevate UA levels, leading to hyperuricaemia(Reference de Oliveira and Burini9,Reference Fathallah-Shaykh and Cramer16) . Hyperuricaemia is an independent risk factor for the development of gout and has also been associated with obesity, dyslipidaemia, hypertension, insulin resistance and systemic inflammation(Reference Hayden and Tyagi17–Reference de Oliveira, Moreto and Silveira19). Moreover, elevated UA levels have been associated with an increased risk of cardiovascular diseases in the general population(Reference Zuo, Liu and Jiang20,Reference Wei, Zhang and Huang21) , as well as with the progression of renal function decline in patients with chronic kidney disease(Reference Huang, Li and Huang22,Reference Gonçalves, Moreira and da Silva23) , although this evidence is still controversial(Reference Doria, Galecki and Spino24,Reference Badve, Pascoe and Tiku25) . Therefore, it is crucial to understand the relationship between caffeine consumption and serum UA concentrations to prevent hyperuricaemia.
Several studies have investigated the relationship between coffee, tea and chocolate consumption – common sources of caffeine metabolites in urine(Reference Rybak, Sternberg and Pao26) – and UA levels, with most reporting an inverse association with serum UA(Reference Pham, Yoshida and Morita27–Reference Limirio, Santos and dos Reis30). However, assessing caffeine intake via dietary surveys has limitations, including imprecise food quantification and inaccurate participant reporting(Reference Grandjean31), potentially affecting the reliability of the association between dietary caffeine and UA(Reference Park, Dodd and Kipnis32). Consequently, evaluating caffeine and its metabolites in urine may offer a more reliable method for assessing caffeine intake compared to food questionnaires(Reference Park, Dodd and Kipnis32), as it directly measures the final product of caffeine metabolism(Reference Arnaud and Fredholm2,Reference Rybak, Sternberg and Pao26) . To our knowledge, no study has investigated the association between caffeine metabolites and serum UA levels. Therefore, the aim of this study was to assess the association between caffeine metabolites in urine and serum UA levels in a representative sample of the USA. We hypothesised that urinary caffeine levels would not be associated with UA levels, given that caffeine is primarily metabolised into paraxanthine, theobromine and theophylline, metabolites that, in turn, generate several downstream metabolites(Reference Arnaud and Fredholm2). Therefore, these caffeine-derived metabolites, rather than caffeine itself, would be more likely to show associations with UA levels.
Methods
Study design and subjects’ characteristics
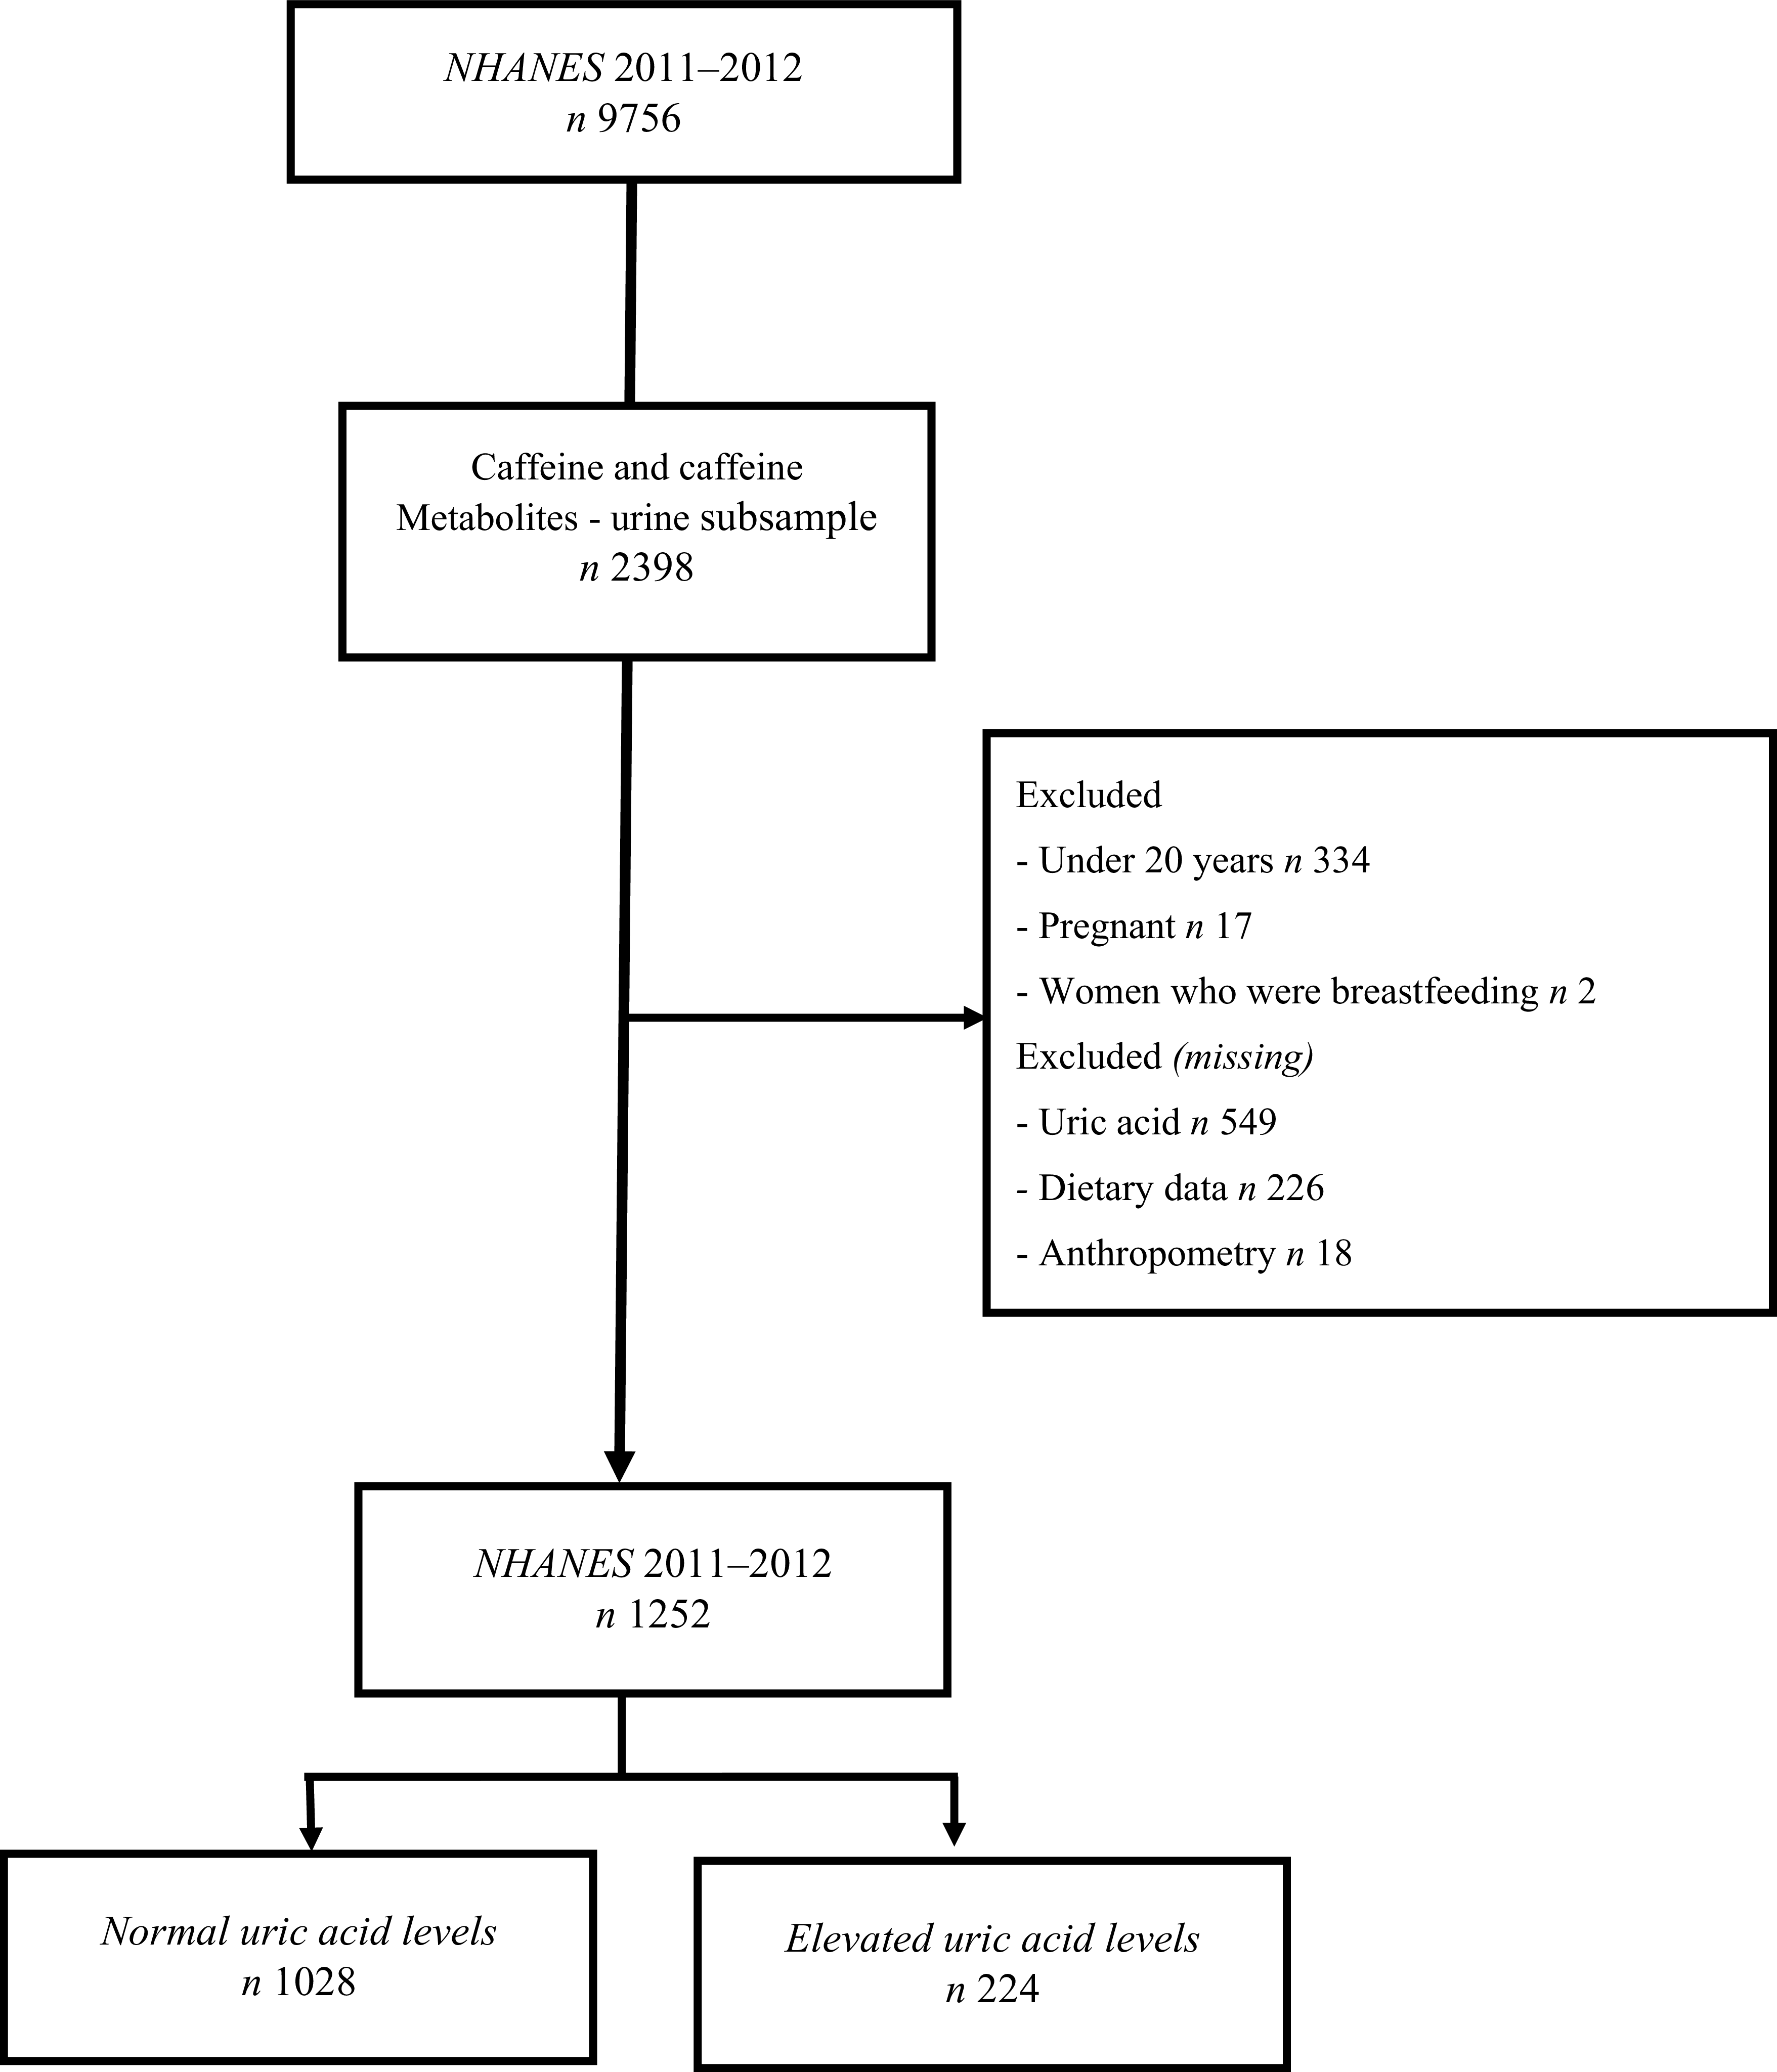
This cross-sectional study utilised data from the National Health and Nutrition Examination Survey (NHANES), conducted by The National Center for Health Statistics of the Centers for Disease Control and Prevention. NHANES employs a multistage, probability and stratified sampling design to evaluate the nutritional status and health of a nationally representative sample of the noninstitutionalised USA population. Participants underwent in-home interviews, physical examinations, biochemical tests, dietary interviews and other assessments(33). Out of the 9756 individuals evaluated in NHANES 2011–2012, we selected a subsample of 2398 individuals with available data on caffeine and its metabolites in urine. The study focused on adults aged over 20 years from NHANES 2011 to 2012. The analysis included individuals with available demographic information, health conditions (such as diabetes, hypertension, arthritis, menopause, gout and allopurinol use), behaviour (physical activity and smoking status), anthropometric measurements, biochemical parameters, urine data on caffeine and its metabolites, and dietary information. However, participants without serum UA data assessment, missing dietary and anthropometric data, as well as pregnant and breastfeeding women, were excluded from the study. Consequently, the analysis was conducted on a sample of 1252 individuals (Figure 1). NHANES is a publicly available dataset, and all participants provided written informed consent, in accordance with approval from the National Center for Health Statistics Research Ethics Review Board (NCHS ERB) under Protocol #2011–17 for NHANES cycle 2011–2012.
Flowchart of sample selection based on caffeine and caffeine metabolite data in the urinary subsample of NHANES 2011–2012.

Demographic data, health conditions and behaviour
The demographic characteristics evaluated included age (in years), sex (men or women), race/ethnicity (non-Hispanic white or other), marital status (single/divorced/widowed/never married or married/living as married), annual family income (categorised as 0 to $19 999, $20 000 to $54 999, $55 000 to $74 999 and over $75 000) and educational level (categorised as under/high school graduate and some college or over). The evaluation of diabetes, hypertension, arthritis and gout presence was based on the question: ‘Have you ever been told by a doctor or other health professional that you have diabetes/high blood pressure/arthritis/gout?’. For assessing menopause status (only for women), the question asked was: ‘Have you had at least one menstrual period in the past 12 months?’, with responses categorised as ‘no’ or ‘yes’. Physical activity levels were assessed using the Global Physical Activity Questionnaire, which comprises sixteen questions related to daily tasks, recreational activities and sedentary behaviour, with metabolic equivalent scores calculated accordingly. This questionnaire evaluated physical activity over the previous 7 d, categorising it as either moderate (activities lasting over 10 min continuously, involving moderate physical exertion and resulting in slight increases in breathing or heart rate) or vigorous (activities lasting longer than 10 min continuously, involving significant physical effort and resulting in substantial increases in breathing or heart rate)(Reference Beard, Officer and de Carvalho34). A binary variable for physical activity (yes or no) was created based on engagement in any form of physical activity (moderate or vigorous). The use of allopurinol and prednisone was evaluated based on the question: ‘Have you taken prescription medicine in the past month?’ and responses were categorised as ‘no’ or ‘yes’. Smoking status was determined using the questions: ‘Have you smoked at least 100 cigarettes in your entire life?’ and ‘Do you currently smoke cigarettes?’. For annual family income (n 52), diabetes (n 2), arthritis (n 2) and smoking status (n 1), a missing variable was created.
Anthropometric measurements
Body weight and height were assessed following Lohman’s protocol(Reference Lohman, Roche and Martorell35), and Body Mass Index (BMI) was subsequently calculated. Waist circumference was measured using a retractable steel measuring tape, starting from the point marked above the upper lateral border of the right ilium, extending vertically to the midaxillary line and then wrapping around the participant’s waist(36).
Uric acid and biochemical analysis
Serum UA levels and plasma triglyceride levels were determined using the colorimetric method(37). Hyperuricaemia was defined as > 7·0 mg/dl for men and > 6·0 mg/dl for women(Reference Johnson, Kang and Feig38). Urea was measured via the enzymatic conductivity rate method, while creatinine was assessed using the Jaffe rate method(37). Estimated glomerular filtration rate (eGFR) was calculated using the chronic kidney disease epidemiology collaboration equation(Reference Levey, Stevens and Schmid39). Glucose levels were determined using the glucose oxidase method. Cholesterol and HDL-cholesterol were measured via the timed-endpoint method, with HDL-cholesterol specifically reacting(37). LDL-cholesterol was derived using the Friedewald equation(Reference Friedewald, Levy and Fredrickson40).
Caffeine metabolites in urine
Spot urine specimens were collected from NHANES participants during the 2011–2012 survey who were able to provide a specimen, typically during their visit to the mobile examination centre. Upon entry to the mobile examination centre, each participant was instructed to provide a urine sample promptly and empty their bladder during the collection process. Urine samples were then analyzed for caffeine and its fourteen metabolites using LC-tandem MS with electrospray ionisation(Reference Rybak, Pao and Pfeiffer41). The analysis covered various compounds, including caffeine (1,3,7-trimethylxanthine), paraxanthine (1,7-dimethylxanthine), theobromine (3,7-dimethylxanthine), theophylline (1,3-dimethylxanthine), 1,3,7-trimethyluric acid, 1,3-dimethyluric acid, 1,7-dimethyluric acid, 3,7-dimethyluric acid, 1-methyluric acid, 3-methyluric acid, 7-methyluric acid, 1-methylxanthine, 3-methylxanthine, 7-methylxanthine and 5-acetylamino-6-amino-3-methyluracil. The limits of detection for these compounds in urine were 0·05 μmol/l. Results were reported for the participants that met the requirements of a multirule quality control system employing three quality control pool concentrations for each analyte(Reference Caudill, Schleicher and Pirkle42). The coefficient of variation was ≤ 5 % at analyte concentrations ≥ 1 μmol/l(43).
Dietary intake
Dietary intake was assessed through two 24-hour food recalls for each participant. The first recall was conducted in person, while the second was completed via phone call 3–10 d later. Participants with data from one day of 24-hour food recall were also included to estimate their usual dietary intake(Reference Prentice, Mossavar-Rahmani and Huang44). The 24-hour dietary recalls followed the 5-step multiple pass method, which involves five sequential steps: quick list, forgotten foods, time and occasion, detail cycle and final probe(Reference Blanton, Moshfegh and Baer45). To process the dietary intake data, the USDA’s Food and Nutrient Database for Dietary Studies 2011–2012 was utilised (https://www.ars.usda.gov/ba/bhnrc/fsrg). Various dietary components were evaluated, including energy (kcal), carbohydrate (g), protein (g), protein (g/kg/d), total fat (g), total fibre (g), alcohol (g), caffeine (mg), theobromine (mg), vitamin C (mg) and consumption of coffee and tea (ml) with additions such as milk, cream and sugar.
Statistical analysis
Socio-demographic data, health conditions and behaviour, anthropometric data, biochemical parameters, caffeine metabolites in urine, medication use and dietary intake characteristics were described for individuals with or without hyperuricaemia. Comparisons between individuals with and without hyperuricaemia were conducted using regression analysis. Age, anthropometric data, biochemical parameters, caffeine metabolites in urine and dietary intake were presented as mean and standard deviation, while sex, race/ethnicity, marital status, annual family income, educational level, health conditions and behaviour and medicines use were expressed as percentages and confidence intervals. Linear regression analysis was conducted to assess the association between serum UA levels and caffeine metabolites. In each statistical model, every caffeine metabolite (independent variable) was included along with the confounding variables to assess the prediction (R2 value) of UA variances (dependent variable). The R2 value of each statistical model was computed, followed by a secondary analysis (whether the caffeine metabolite was significantly associated with UA) by removing the caffeine metabolite variable from the model, calculating the R2 with only the confounders. The difference between the R2 values of the two models was utilised to estimate the contribution of the caffeine metabolite in isolation to the prediction of UA variances. Logistic regression analysis was employed to examine the association between the presence of hyperuricaemia and caffeine metabolites. Both unadjusted and adjusted analyses were performed, with adjustments made for various covariates including age, sex, race/ethnicity, education level, marital status, annual family income, diabetes, hypertension, physical activity, smoking status, BMI, estimated glomerular filtration rate, serum TAG levels, allopurinol use and energy intake. The ‘svy’ command in Stata software was utilised to incorporate information on the ‘two-year C subsample weights’ as sample weight, primary sampling units and strata for accurate variance estimation. Associations were considered statistically significant at P-value < 0·05. All analyses were carried out using Stata software version 14.0 (StataCorp).
Results
Characteristics of individuals with and without hyperuricaemia
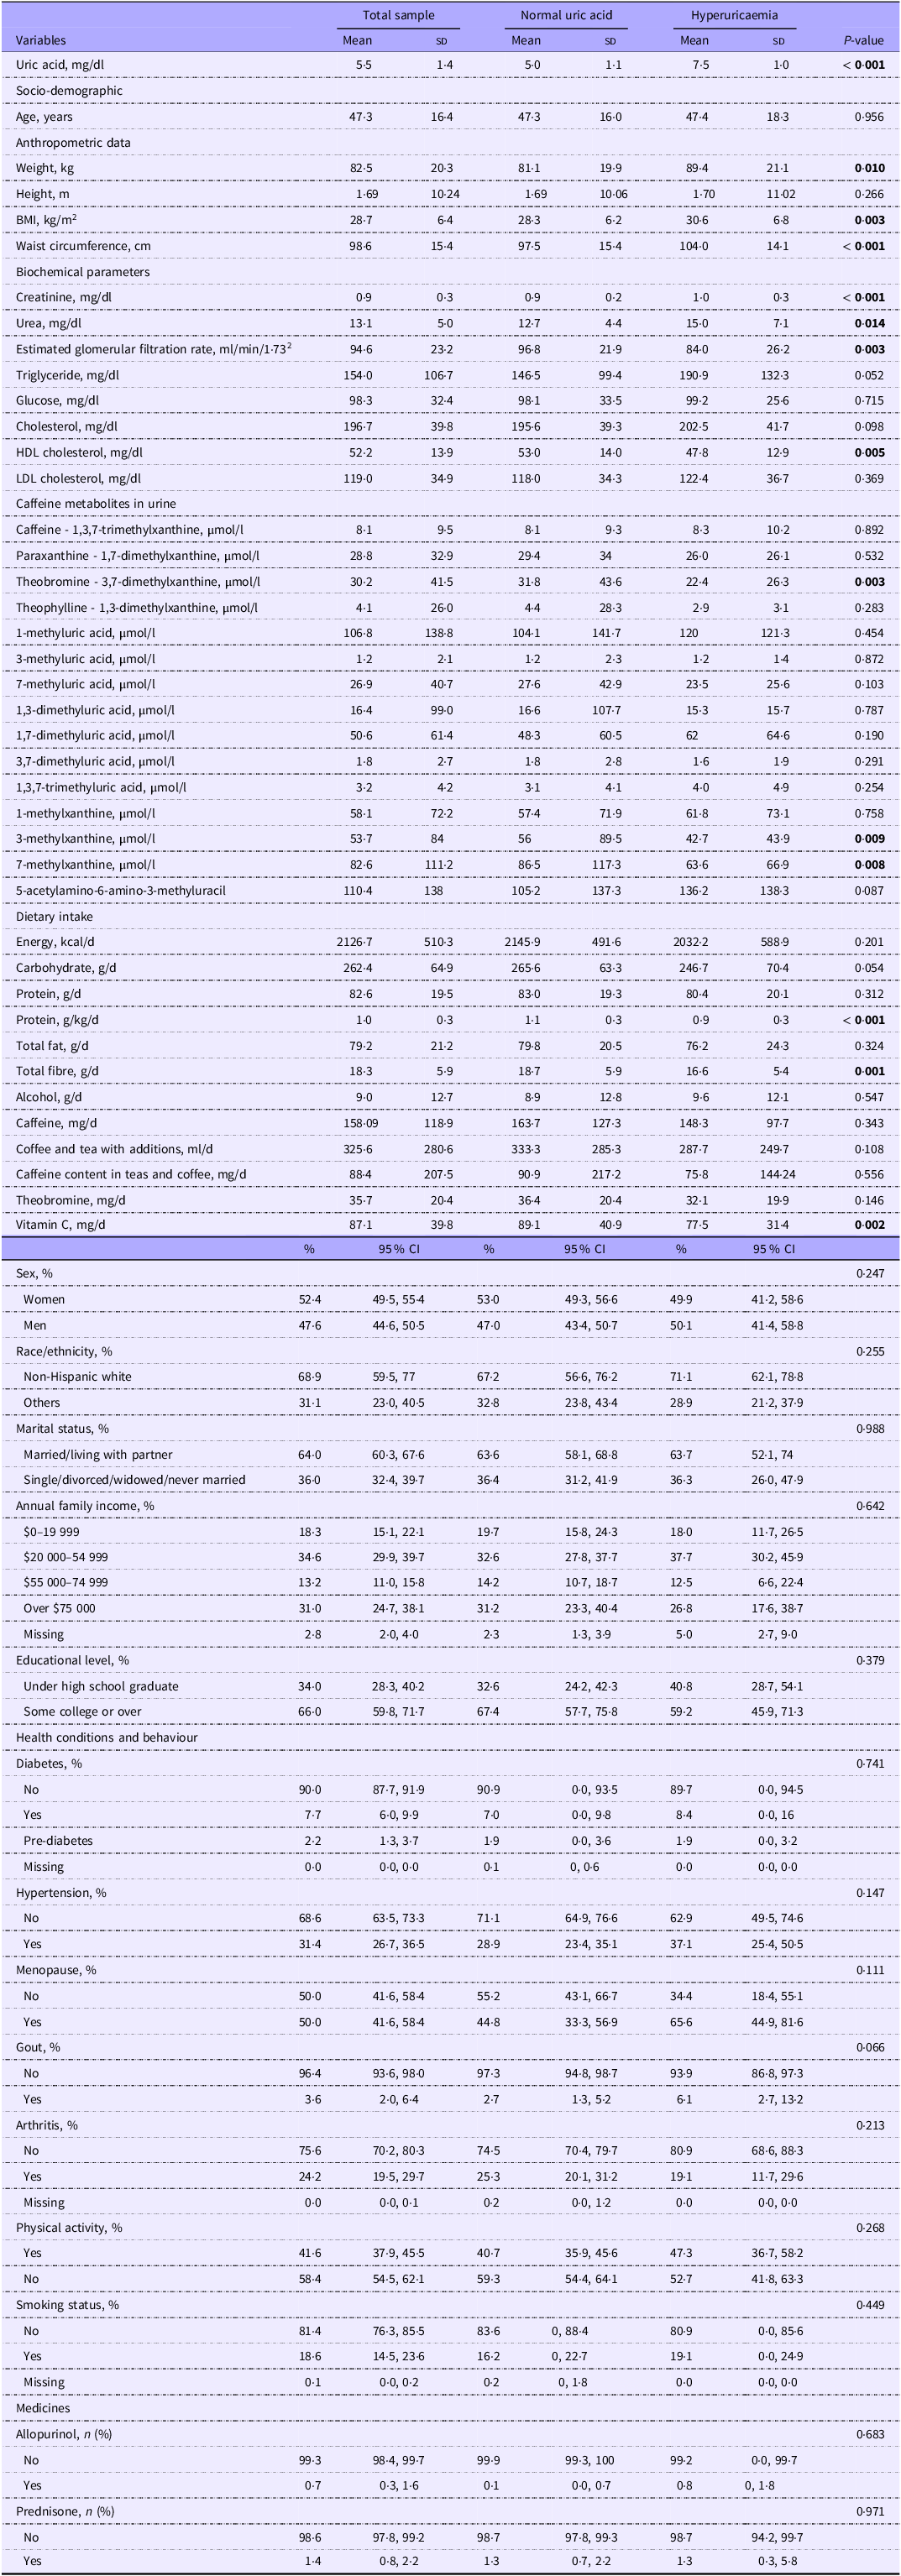
The characteristics of individuals with and without hyperuricaemia are summarised in Table 1. Those with hyperuricaemia displayed higher weight, BMI and waist circumference. Regarding biochemical parameters, individuals with hyperuricaemia exhibited higher levels of creatinine, urea and lower levels of HDL and eGFR. Furthermore, individuals with hyperuricaemia had lower levels of theobromine, 3-methylxanthine and 7-methylxanthine in their urine. Additionally, their dietary intake included lower amounts of protein (grams per kilogram of body weight), fibre and vitamin C.
Socio-demographic, health conditions and behaviours, anthropometric and biochemical parameters for the total sample and according to the presence or absence of hyperuricaemia. NHANES, 2011–2012

Data are described as mean (standard deviation) or percentage (confidence interval). Linear regression test was used for continuous variables and logistic regression test was used for categorical variables. Bold means that the P-value is statistically significant. Menopause was only analyzed for women.
Association between caffeine metabolites in urine, serum uric acid levels and hyperuricaemia
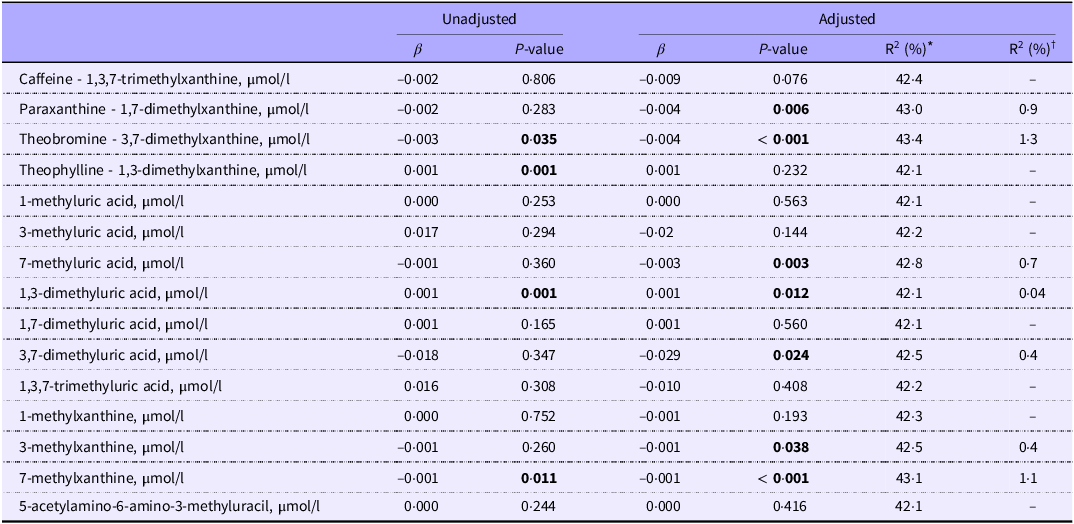
The results of linear regression analyses examining the association between serum UA and caffeine metabolites are presented in Table 2. In the unadjusted model, theobromine (β = −0·003, P = 0·035) and 7-methylxanthine (β = −0·001, P = 0·011) showed inverse associations with serum UA levels, while theophylline (β = 0·001, P = 0·001) and 1,3-dimethyluric acid (β = 0·001, P = 0·001) exhibited positive associations with serum UA. Following adjustments, paraxanthine (β = −0·004, P = 0·006), theobromine (β = −0·004, P < 0·001), 7-methyluric acid (β = −0·003, P = 0·003), 3,7-dimethyluric acid (β = −0·029, P = 0·024), 3-methylxanthine (β = −0·001, P = 0·038) and 7-methylxanthine (β = −0·001, P < 0·001) were inversely associated with serum UA levels. Notably, 1,3-dimethyluric acid remained positively associated with serum UA levels in the adjusted model (β = 0·001, P = 0·012). The metabolites inversely associated with serum UA levels explained between 0·4 % to 1·3 % of the variance in UA levels, whereas the positive association of 1,3-dimethyluric acid accounted for only 0·04 % of the variance in UA levels.
Linear regression analysis of serum uric acid with caffeine metabolites

Each variable was adjusted for age, sex, race/ethnicity, education level, marital status, annual family income, diabetes, hypertension, physical activity, smoking status, BMI, eGFR, serum triglyceride, allopurinol use and energy intake. Bold means that the P-value is statistically significant.
* R2 value: uric acid as a dependent variable. Independent variables were each caffeine metabolite in urine plus adjustments (age, sex, race/ethnicity, education level, marital status, annual family income, diabetes, hypertension, physical activity, smoking status, BMI (kg/m2), glomerular filtration rate (ml/min/1·73 m2), serum triglyceride (mg/dl), allopurinol use and energy intake (kcal)).
† R²: the difference between R² (caffeine metabolite plus adjustments) and R² (adjustments without caffeine metabolite).
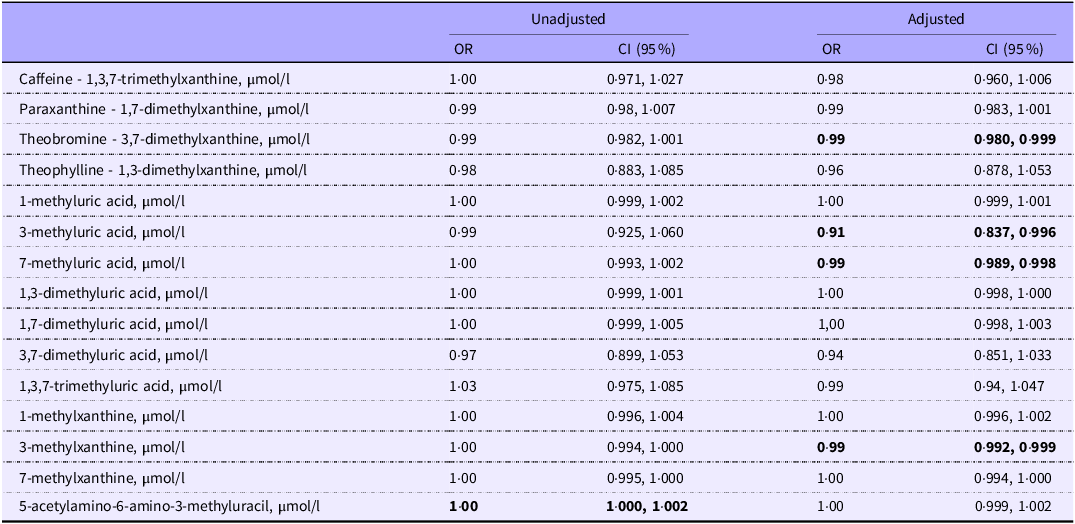
The results of logistic regression analyses, presented as odds ratios, are summarised in Table 3. In the unadjusted model, 5-acetylamino-6-amino-3-methyluracil (OR: 1·00, 95 % CI: 1·000, 1·002) showed an association with increased odds of hyperuricaemia. However, in the adjusted model, theobromine (OR: 0·99, 95 % CI: 0·980, 0·999), 3-methyluric acid (OR: 0·91, 95 % CI: 0·837, 0·996), 7-methyluric acid (OR: 0·99, 95 % CI: 0·989, 0·998) and 3-methylxanthine (OR: 0·99, 95 % CI: 0·992, 0·999) were associated with decreased odds of hyperuricaemia.
Logistic regression analysis of hyperuricaemia with caffeine metabolites

Each variable was adjusted for age, sex, race/ethnicity, education level, marital status, annual family income, diabetes, hypertension, physical activity, smoking status, BMI, eGFR, serum triglyceride, allopurinol use and energy intake. Bold means that the P-value is statistically significant.
Discussion
The main findings of the present study revealed an inverse association between several caffeine metabolites (paraxanthine, theobromine, 7-methyluric acid, 3,7-dimethyluric acid, 3-methylxanthine, 7-methylxanthine and 3-methyluric acid) and UA levels. In addition, theobromine, 3-methyluric acid, 7-methyluric acid and 3-methylxanthine levels were associated with decreased odds of hyperuricaemia. To the best of our knowledge, this is the first study to evaluate the association between caffeine metabolites in urine and both serum UA levels and the presence of hyperuricaemia. While the present study focused on caffeine metabolites, which are considered biomarkers of caffeine intake(Reference Rybak, Sternberg and Pao26), previous research has explored the relationship between caffeine intake – assessed through dietary questionnaires – and UA levels(Reference Choi and Curhan28,Reference Limirio, Santos and dos Reis30,Reference Kiyohara, Kono and Honjo46–Reference Park, Kim and Ahn48) . The results from these studies suggest that there is an inverse association between the consumption of coffee(Reference Choi and Curhan28,Reference Limirio, Santos and dos Reis30,Reference Kiyohara, Kono and Honjo46,Reference Park, Kim and Ahn48) , tea(Reference Limirio, Santos and dos Reis30,Reference Li, Song and Li47) and caffeine(Reference Limirio, Santos and dos Reis30) and UA levels. Thus, the current evidence indicates that caffeine intake, whether evaluated through urinary metabolites or dietary questionnaires(Reference Choi and Curhan28,Reference Limirio, Santos and dos Reis30,Reference Kiyohara, Kono and Honjo46–Reference Park, Kim and Ahn48) , is generally inversely associated with UA concentrations. Although these earlier studies(Reference Choi and Curhan28,Reference Limirio, Santos and dos Reis30,Reference Kiyohara, Kono and Honjo46–Reference Park, Kim and Ahn48) assessed caffeine sources rather than urinary metabolites, the results of the present study align with and reinforce these previous findings.
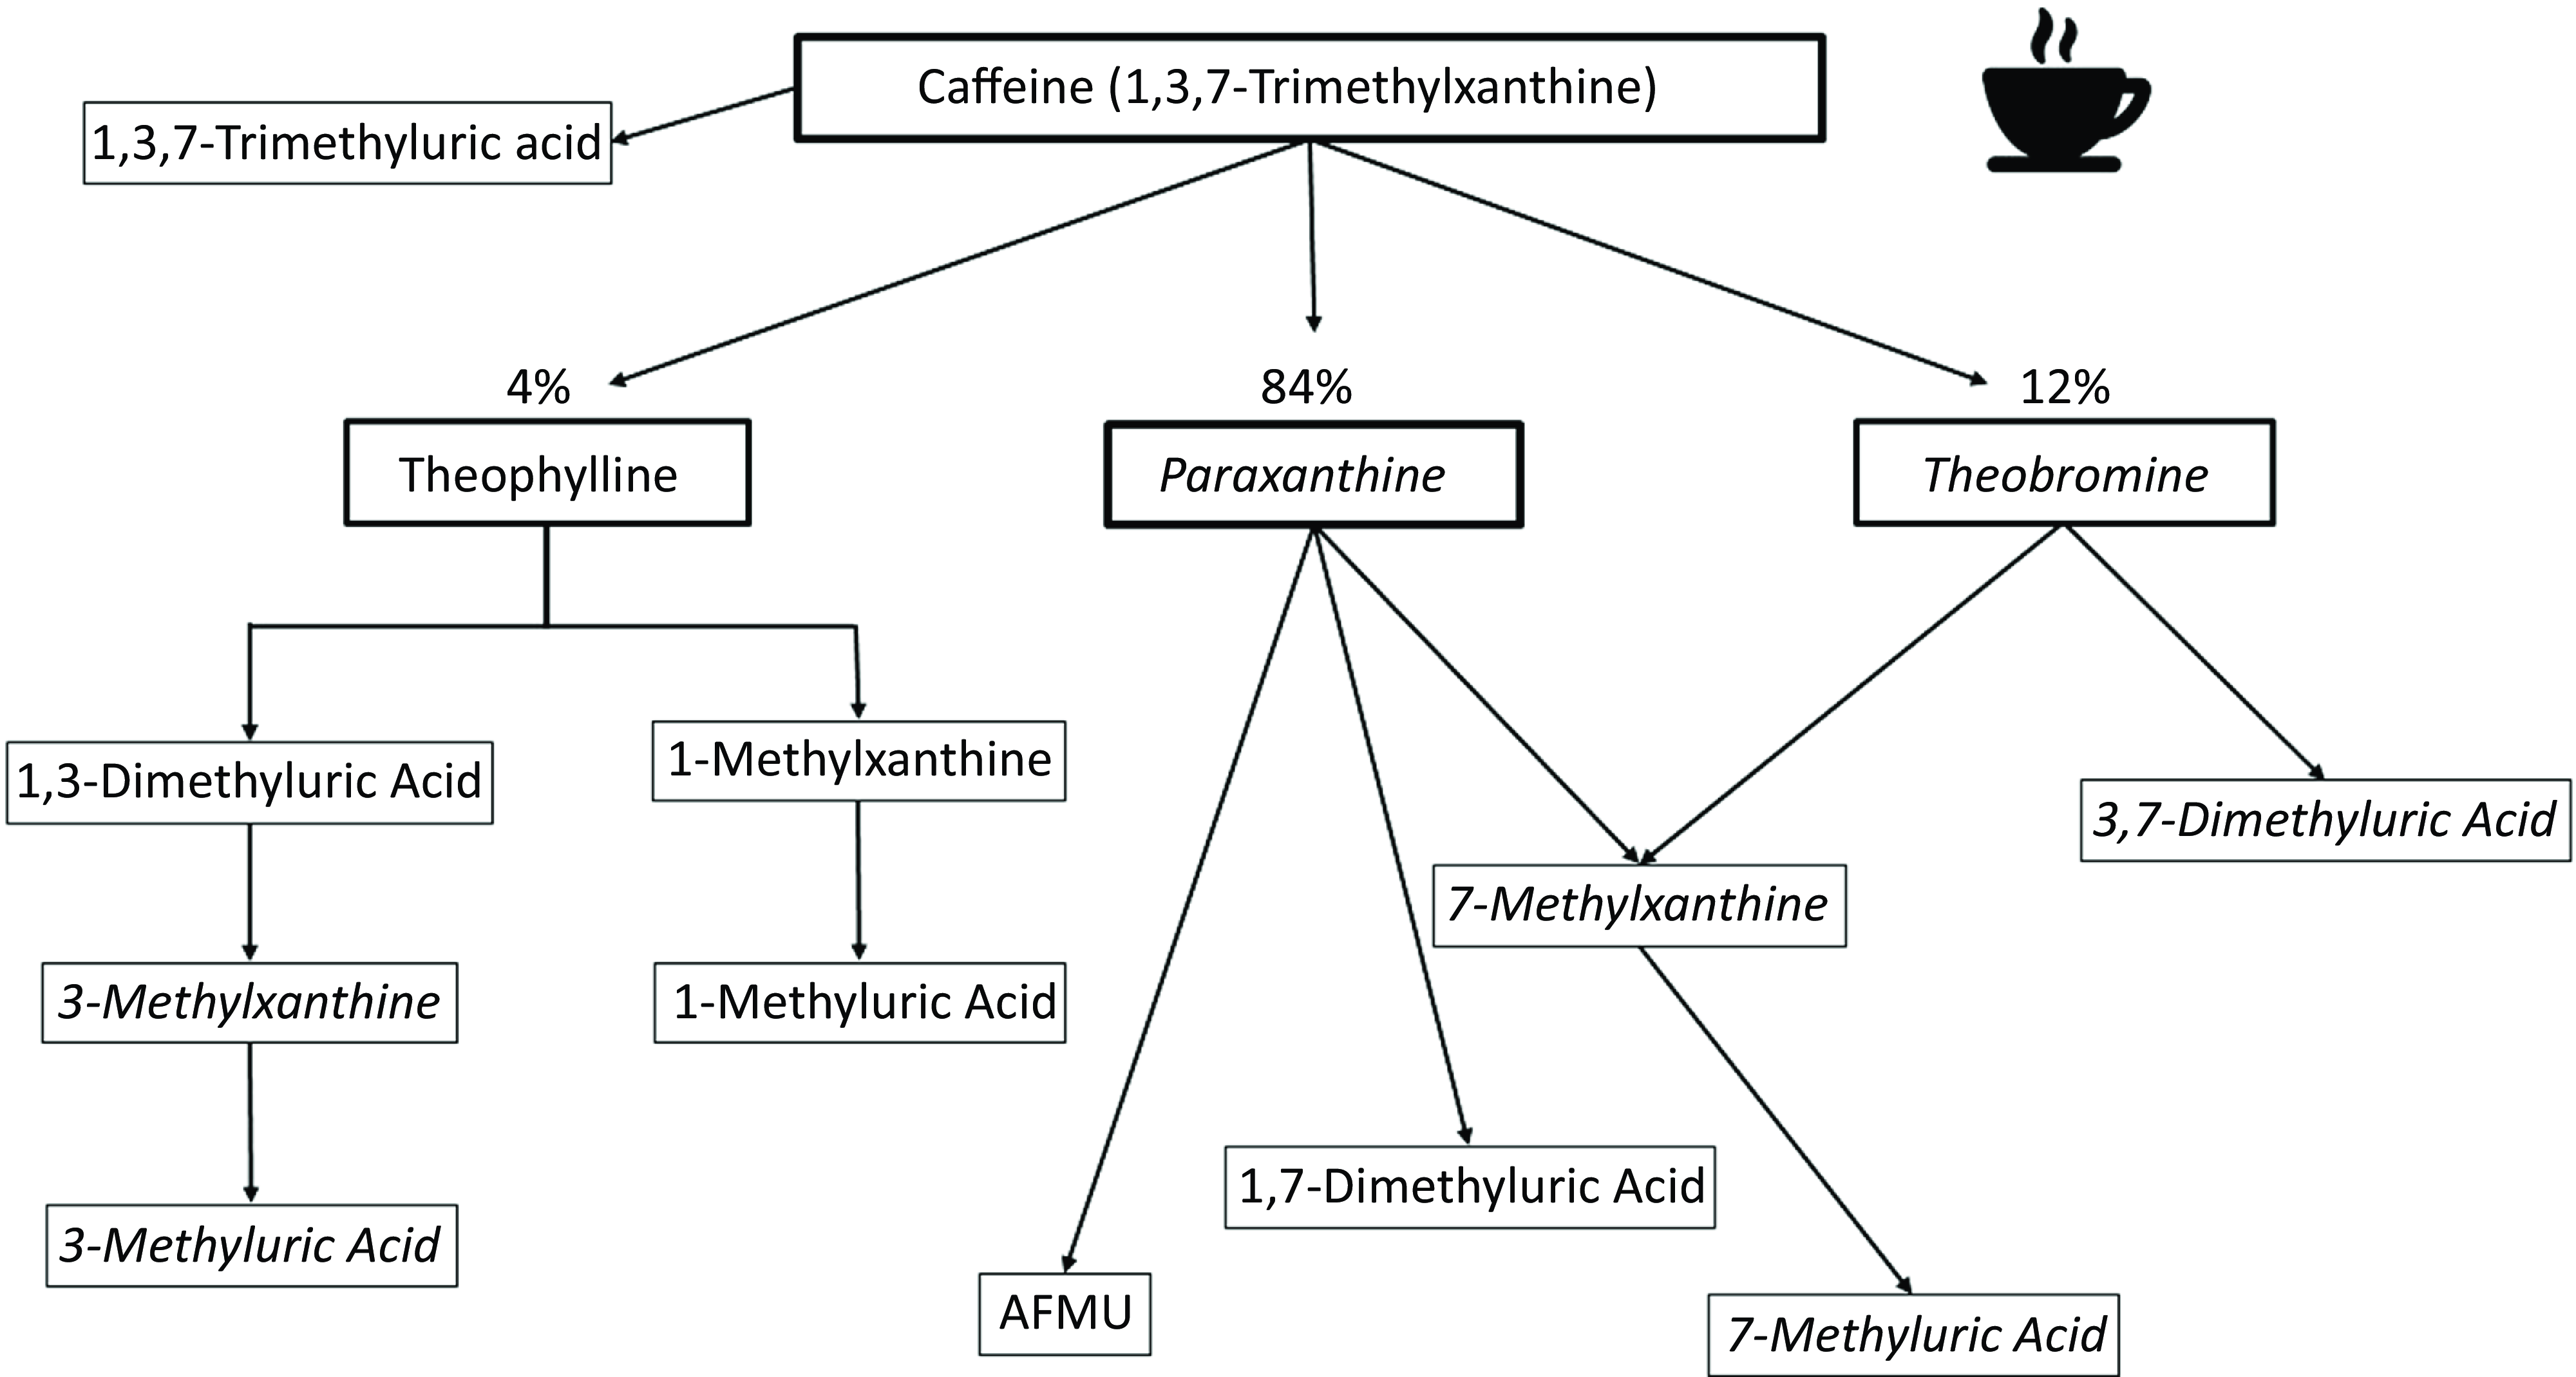
For a comprehensive understanding of the results of our study, it is crucial to consider the metabolism of caffeine. We observed an inverse association between UA levels and several caffeine metabolites, including paraxanthine, theobromine, 7-methylxanthine, 7-methyluric acid and 3,7-dimethyluric acid. These findings indicate a consistent relationship between caffeine metabolism and UA levels. When caffeine is ingested, approximately 84 % is metabolised into paraxanthine and 12 % into theobromine, making them the main metabolites of caffeine(Reference Arnaud and Fredholm2,Reference Cornish and Christman49) . Both paraxanthine and theobromine can further convert to 7-methylxanthine, which is then metabolised into 7-methyluric acid. Additionally, theobromine contributes to the generation of 3,7-dimethyluric acid (Figure 2)(Reference Arnaud and Fredholm2). Therefore, our results suggest that the main metabolites of caffeine intake were inversely associated with UA levels. Additionally, we observed an inverse association between UA levels and 3-methylxanthine and 3-methyluric acid in linear regression analysis, accompanied by decreased odds of hyperuricaemia. These metabolites are produced through theophylline metabolism, which accounts for approximately 4 % of caffeine conversion (Figure 2)(Reference Arnaud and Fredholm2). Overall, several key caffeine metabolites exhibited an inverse relationship with UA levels, indicating a consistent association between UA and caffeine metabolites. However, we also noted an unexpected positive association between 1,3-dimethyluric acid and UA levels. It is important to highlight that while this association was statistically significant, the contribution of 1,3-dimethyluric acid to the variance in UA levels was only 0·04 %. This suggests that this association may lack significant biological relevance.
Summary of associations of serum uric acid (linear regression) and hyperuricaemia (logistic regression, odds ratio) with caffeine and caffeine metabolites according to caffeine metabolism in humans. Italicised letters indicate negative associations with UA levels.

The mechanisms underlying the inverse association between several caffeine metabolites and UA levels are not fully understood. However, it is suggested that both paraxanthine and theobromine have an affinity for the xanthine oxidase enzyme, leading to a reduction in UA production by limiting the availability of xanthine oxidase for the UA synthesis pathway(Reference Ekpenyong and Daniel15,Reference Roddy and Doherty50) . Furthermore, Wu et al.(Reference Wu and Chen51) demonstrated a positive correlation between paraxanthine, theobromine and urinary flow rate, which could potentially contribute to the uricosuric action of these metabolites. However, it is worth noting that this hypothesis appears improbable as caffeine has not been observed to increase UA excretion(Reference Cornish and Christman49). Further studies are warranted to comprehensively elucidate the effects of caffeine and its metabolites on serum UA.
The present study has limitations that warrant acknowledgement. The cross-sectional design employed restricts the ability to establish causality. Since this is an observational study, there is a potential for observed associations to be influenced by unaccounted residual confounding variables. While efforts were made to adjust for significant confounders, the presence of residual confounding cannot be completely dismissed. Additionally, it is important to recognise that our results may not be readily applicable to other populations, as the NHANES survey focuses on a representative sample from the USA. Caution is advised when extrapolating our findings to populations with different demographics and lifestyles. Furthermore, establishing precise dosage recommendations for caffeine food sources based on our results proves challenging. Although our findings suggest potential benefits for individuals with elevated UA levels from consuming caffeine sources such as coffee, tea and other beverages, given that caffeine metabolites are correlated with caffeine intake(Reference Rybak, Sternberg and Pao26), further research is needed to establish clear guidelines on appropriate doses. Additionally, the assessment of caffeine metabolites in urine provides insights into short-term patterns of caffeine intake(Reference Alsabri, Mari and Younes52). Therefore, it is important to note that our results should not be extrapolated to long-term caffeine consumption behaviours. Urine specimens were obtained immediately preceding the examination, and 24-hour urine collections were not conducted. Consequently, the presence and concentrations of caffeine and its metabolites in urine might not fully represent caffeine intake. Additionally, a notable limitation of this study is the lack of information on the specific timing of urine sample collection. Given that caffeine metabolism may vary throughout the day due to circadian rhythms and individual differences in consumption patterns, the inability to stratify analyses by collection time may introduce variability in our findings. This constraint should be considered when interpreting the results, as it limits our ability to assess potential diurnal variations in caffeine metabolite levels(Reference Kalow and Tang53). Another limitation is the lack of genetic data related to both uric acid and caffeine metabolism. Given that our findings are based on a representative sample of the USA population, they may not be generalisable to individuals with specific genetic polymorphisms that influence caffeine or uric acid metabolism(Reference de Oliveira, Batista-da-Silva and Limirio54). Furthermore, given the non-normal distribution of caffeine metabolites in urine data, caution should be exercised when interpreting beta values. It is advisable to focus on the direction of associations rather than solely on the magnitude of beta values. Despite these limitations, our study is the first to demonstrate an inverse association between caffeine metabolites and UA in a representative USA sample.
Conclusion
In conclusion, our study showed a negative association between several caffeine metabolites in urine and UA levels. This suggests that the consumption of caffeine from dietary sources may be beneficial for individuals with elevated UA levels. However, these findings should be interpreted with caution due to the small magnitude of the observed associations.
Acknowledgement
EPO would like to thank The Brazilian National Council for Scientific and Technological Development (CNPq, Brazil, 307786/2022-6).
The article preparation did not receive financial support from any external sources.
L. S. L. contributed to data interpretation, conducted statistical analysis and wrote the manuscript; E. P. O. contributed to data interpretation, wrote and reviewed the manuscript. All authors reviewed and approved the final version of the manuscript.
The authors declare no conflicts of interest.
Data availability: Data from the National Health and Nutrition Examination Survey (NHANES) are publicly available and can be accessed directly at https://wwwn.cdc.gov/Nchs/Nhanes.
Ethical approval: NHANES data collection protocols are approved by the ethics review board of the National Center for Health Statistics. Informed consent was obtained from all participants.
Informed consent: Informed consent was obtained from all individual participants included in the study.