


Non-technical Summary
Athyridida are one of only two extinct groups of articulated brachiopods to survive the end-Permian mass extinction. The current classification of the order is structured, in part, from the results of older parsimony-based methods of phylogenetic analysis. We tested the phylogenetic affinities of named higher taxa with different Bayesian Mk methods to compare with the parsimony results. Although the four main groups of athyridide higher taxa appear to be (mostly) monophyletic, relationships among these groups vary considerably among methods. Our results support the commonly held assumption that features on the interior of the valves (e.g., mineralized lophophore supports) are more likely to be homologous than features on the valve exteriors (e.g., ornament, overall valve shape). Because named taxa are often used as clade proxies in studies of macroevolution, it is important to generate and compare the most robust hypotheses of phylogenetic relationship to evaluate character homology and taxonomic fidelity.
Introduction
The Athyridida (or Athyrida; see Copper and Jin, Reference Copper and Jin2017), currently recognized as an extinct order of Brachiopoda, have had a long and rather complicated history (Schuchert and LeVene, Reference Schuchert, LeVene and Pompeckj1929; MuirWood, Reference Muir-Wood1955; Boucot et al., Reference Boucot, Johnson and Staton1964, Reference Boucot, Johnson, Pitrat, Staton and Moore1965; Rudwick, Reference Rudwick1970; Modzalevskaya, Reference Modzalevskaya1979; Grunt, Reference Grunt1984, Reference Grunt1986, Reference Grunt2010; Rong et al., Reference Rong, Strusz, Boucot, Fu, Modzalevskaya and Su1994, Reference Rong, Alvarez, Modzalevskaya and Yan2004; Dagys, Reference Dagys, Copper and Jin1996; Alvarez and Carlson, Reference Alvarez and Carlson1998; Alvarez et al., Reference Alvarez, Rong and Boucot1998; Alvarez and Modzalevskaya, Reference Alvarez, Modzalevskaya, Brunton, Cocks and Long2001; Alvarez and Rong, Reference Alvarez, Rong and Kaesler2002; Alvarez, Reference Alvarez and Selden2007). Several morphologically distinct and previously disparate groups of taxa are now classified together in this order. All possess a spiral brachidium, and nearly all with laterally directed cones that supported the lophophore (Fig. 1), but their relationship to each other and to other spire-bearers is not clear. Most, but not all athyridides have spiralial blades bent sharply posterodorsally from the crura; most, but not all, have a curved, astrophic hinge line. Some, but not the majority, have an endopunctate shell structure. They first appear in the fossil record in the Ordovician (Katian) and survive the severe end-Permian mass extinction event, only to become extinct in the Jurassic (Fig. 2). Why?
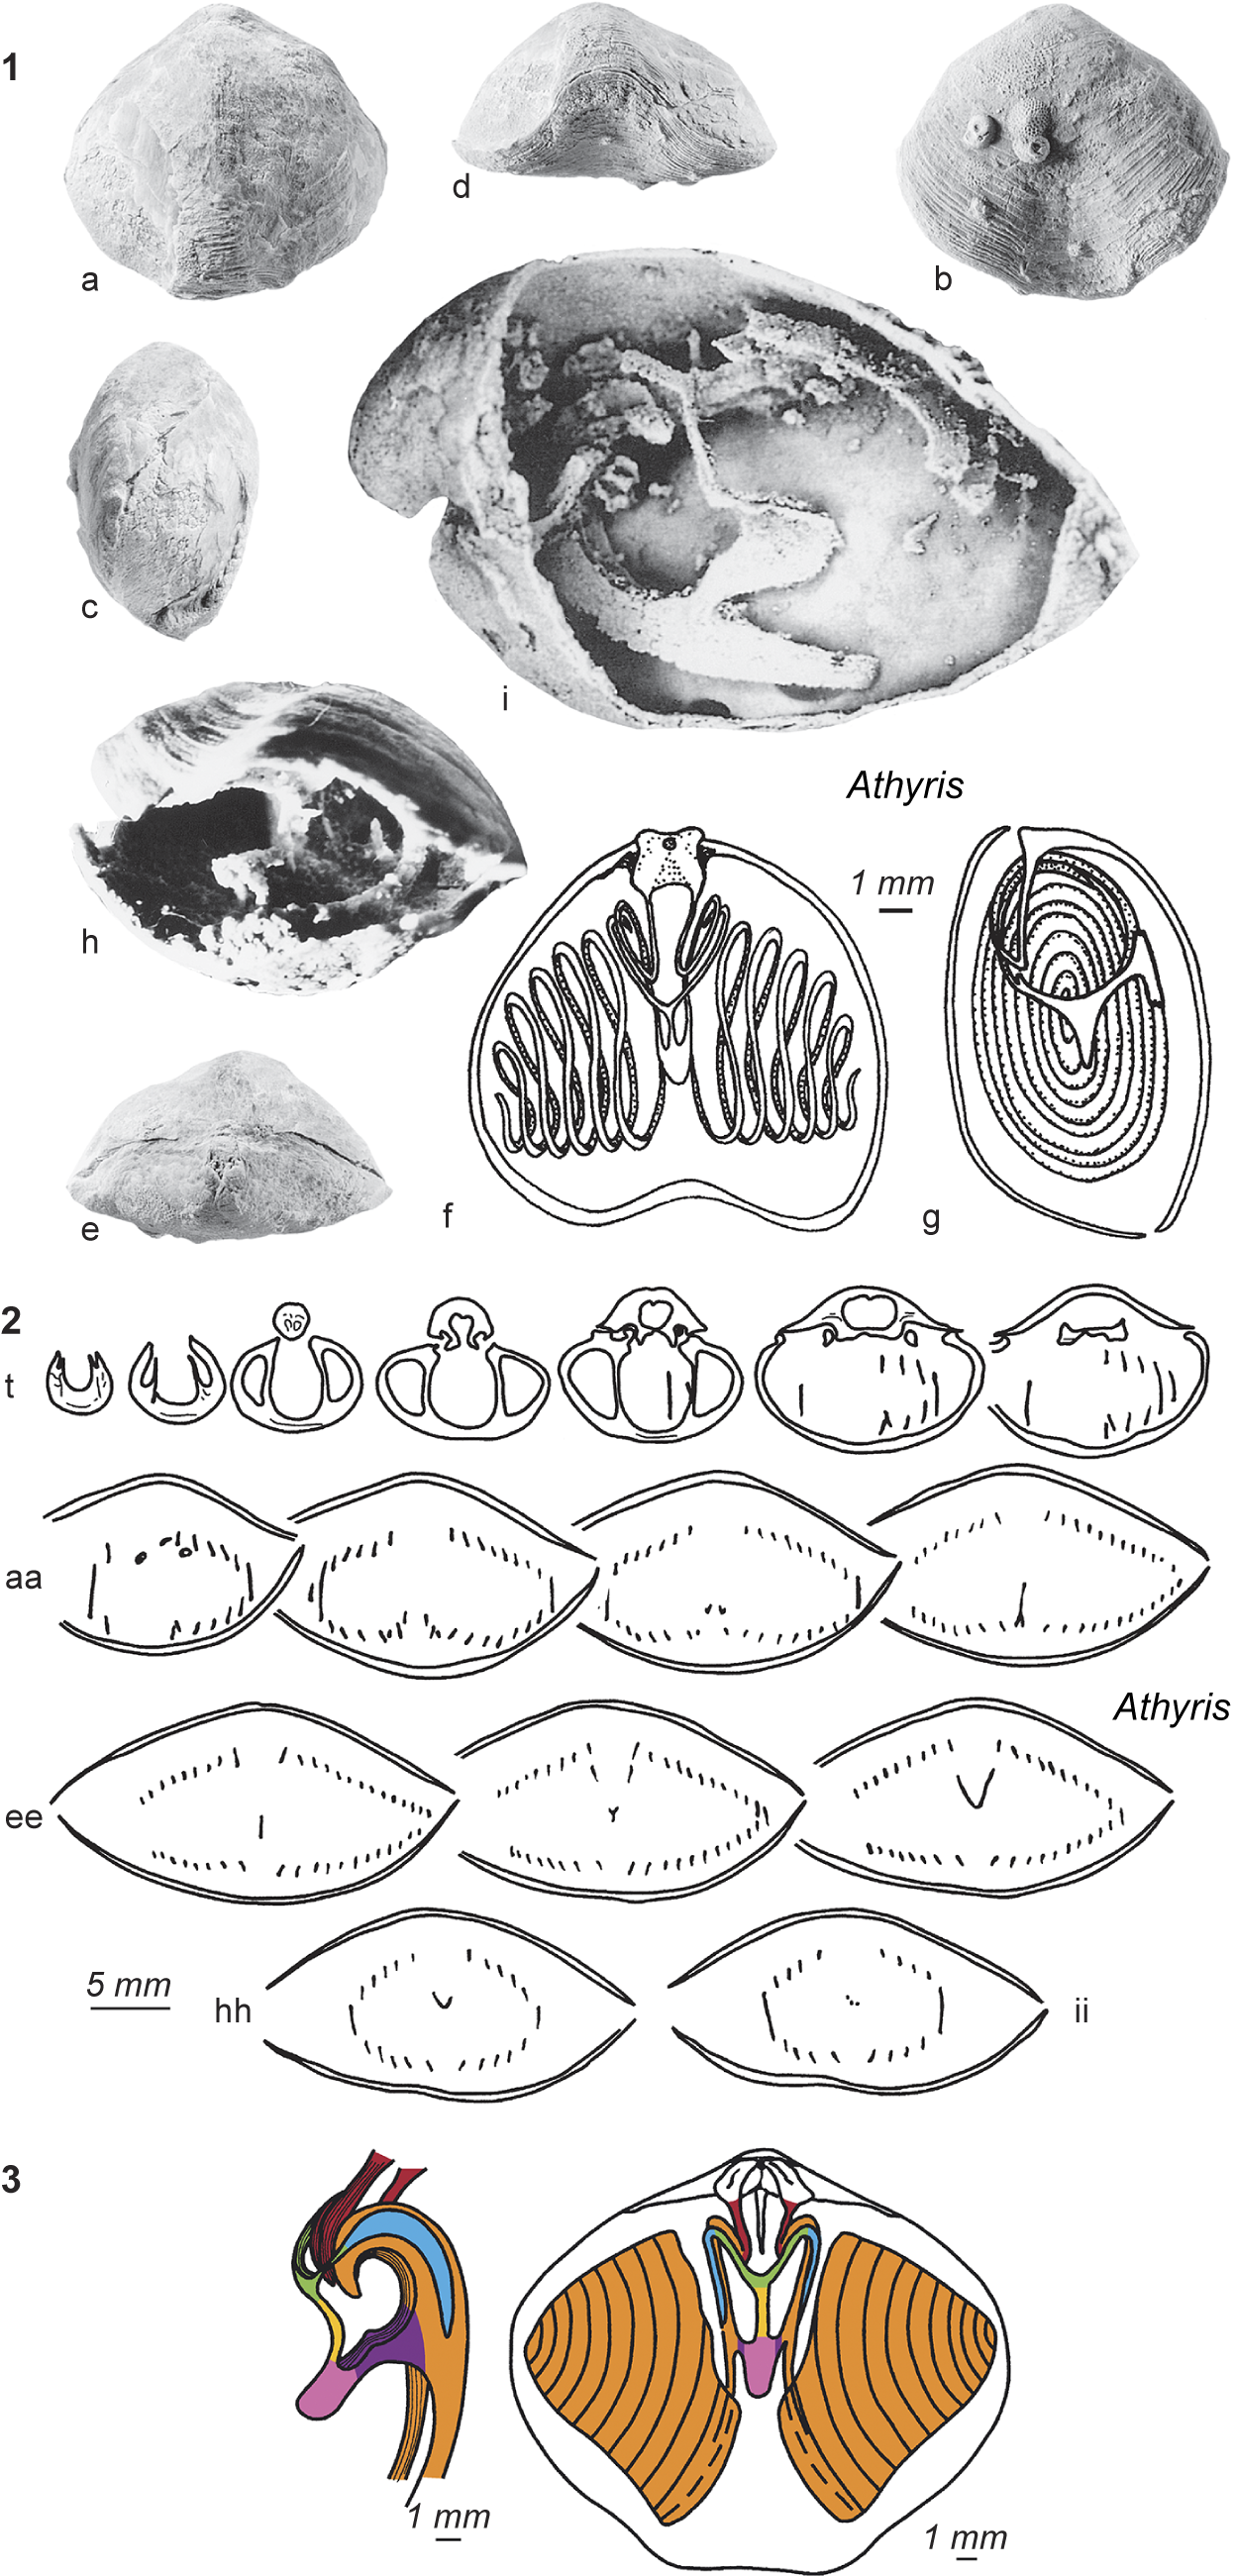
Morphology of Athyris, name-bearer of Athyridida (Alvarez and Rong, Reference Alvarez, Rong and Kaesler2002). (1) Alvarez and Rong, Reference Alvarez, Rong and Kaesler2002, fig. 1013a–g, *Athyris concentrica (von Buch, Reference von Buch1834), Eifelian, Eifel, Germany, neotype (a–e) dorsal, ventral, lateral, anterior, and posterior views, ventral valve below, SMF 5480; (f, g) ventral and lateral views showing reconstructed jugum (Alvarez et al., Reference Alvarez, Brunton and Struve1996). Alvarez and Rong, Reference Alvarez, Rong and Kaesler2002, fig. 1013h, Athyris spiriferoides (Eaton, Reference Eaton1832), Givetian, Michigan, USA; posterolateral view of open shell showing jugum, ventral up, I1106, Hall collection (Alvarez and Rong, Reference Alvarez, Rong and Kaesler2002). Alvarez and Rong, Reference Alvarez, Rong and Kaesler2002, fig. 1013i, Buchanathyris waratahensis (Talent, Reference Talent1956), Lower Devonian, New South Wales, Australia; lateral view of broken specimen showing jugum, ventral up, ANU 18998, (Alvarez, Reference Alvarez1999; photograph courtesy of B.D.E. Chatterton). Astrophic hinge line; smooth exterior lacking ornament; uniplicate commissure; distinctive cardinalia in dorsal valve; reconstructed spiralial cones pointing laterally, largely filling the mantle cavity, and coiling clockwise (from view into dorsal interior, on left side) as they grow; elaborate jugum uniting the coils posterior to the crura; scale bar = 1 mm. (2) Serial sections of Athyris perpendicular to the plane of symmetry, from valve posterior to anterior; ventral valve below, dorsal valve above, reveals undisturbed spiralium (Alvarez and Rong, Reference Alvarez, Rong and Kaesler2002). Alvarez and Rong, Reference Alvarez, Rong and Kaesler2002, Fig. 1014t–ii. Athyris concentrica murchisoni Brice, Reference Brice1988, Upper Devonian, Ferques, France; transverse serial sections 0.6, 1.1, 2.0, 2.8, 3.3, 3.9, 4.2, 5.0, 6.2, 6.9, 7.8, 8.3, 8.8, 9.3, 11.3, 11.5 mm from ventral umbo, BMNH BD12052 (Alvarez et al., Reference Alvarez, Brunton and Struve1996); scale bar = 5 mm. (3) Actinoconchus reconstruction of jugum and dorsal valve interior (Alvarez and Rong, Reference Alvarez, Rong and Kaesler2002). Alvarez and Rong, Reference Alvarez, Rong and Kaesler2002, fig. 1015.1c, d. Athyris planosulcata (Phillips, Reference Phillips1836), lower Carboniferous, Yorkshire, England; ventral and lateral views showing jugum (Glass in Davidson, Reference Glass and in Davidson1882); scale bar = 1 mm. Key to colors indicating crural, spiralial, and jugal features: red = crura; orange = primary lamellae of spiralium; purple = lateral branch of jugum; pink = jugal saddle; (pink and purple together = jugal arch); yellow = jugal stem; green = jugal arm bifurcation; blue = accessory lamellae of jugum. Repositories: SMF: Senckenbergische Museum, Frankfurt, Germany; ANU: Australian National University, Canberra, Australia; BMNH: The Natural History Museum, London, United Kingdom (formerly British Museum [Natural History]); Hall collection is housed in the Paleontological Collections of the New York State Geological Survey, Albany, with specimen numbers prefixed I. This figure is reprinted with permission (open access license CC BY 4.0; color was added by authors to 3) from the Treatise on Invertebrate Paleontology Part H Revised, Brachiopoda, Volume 4 (Alvarez and Rong, Reference Alvarez, Rong and Kaesler2002).
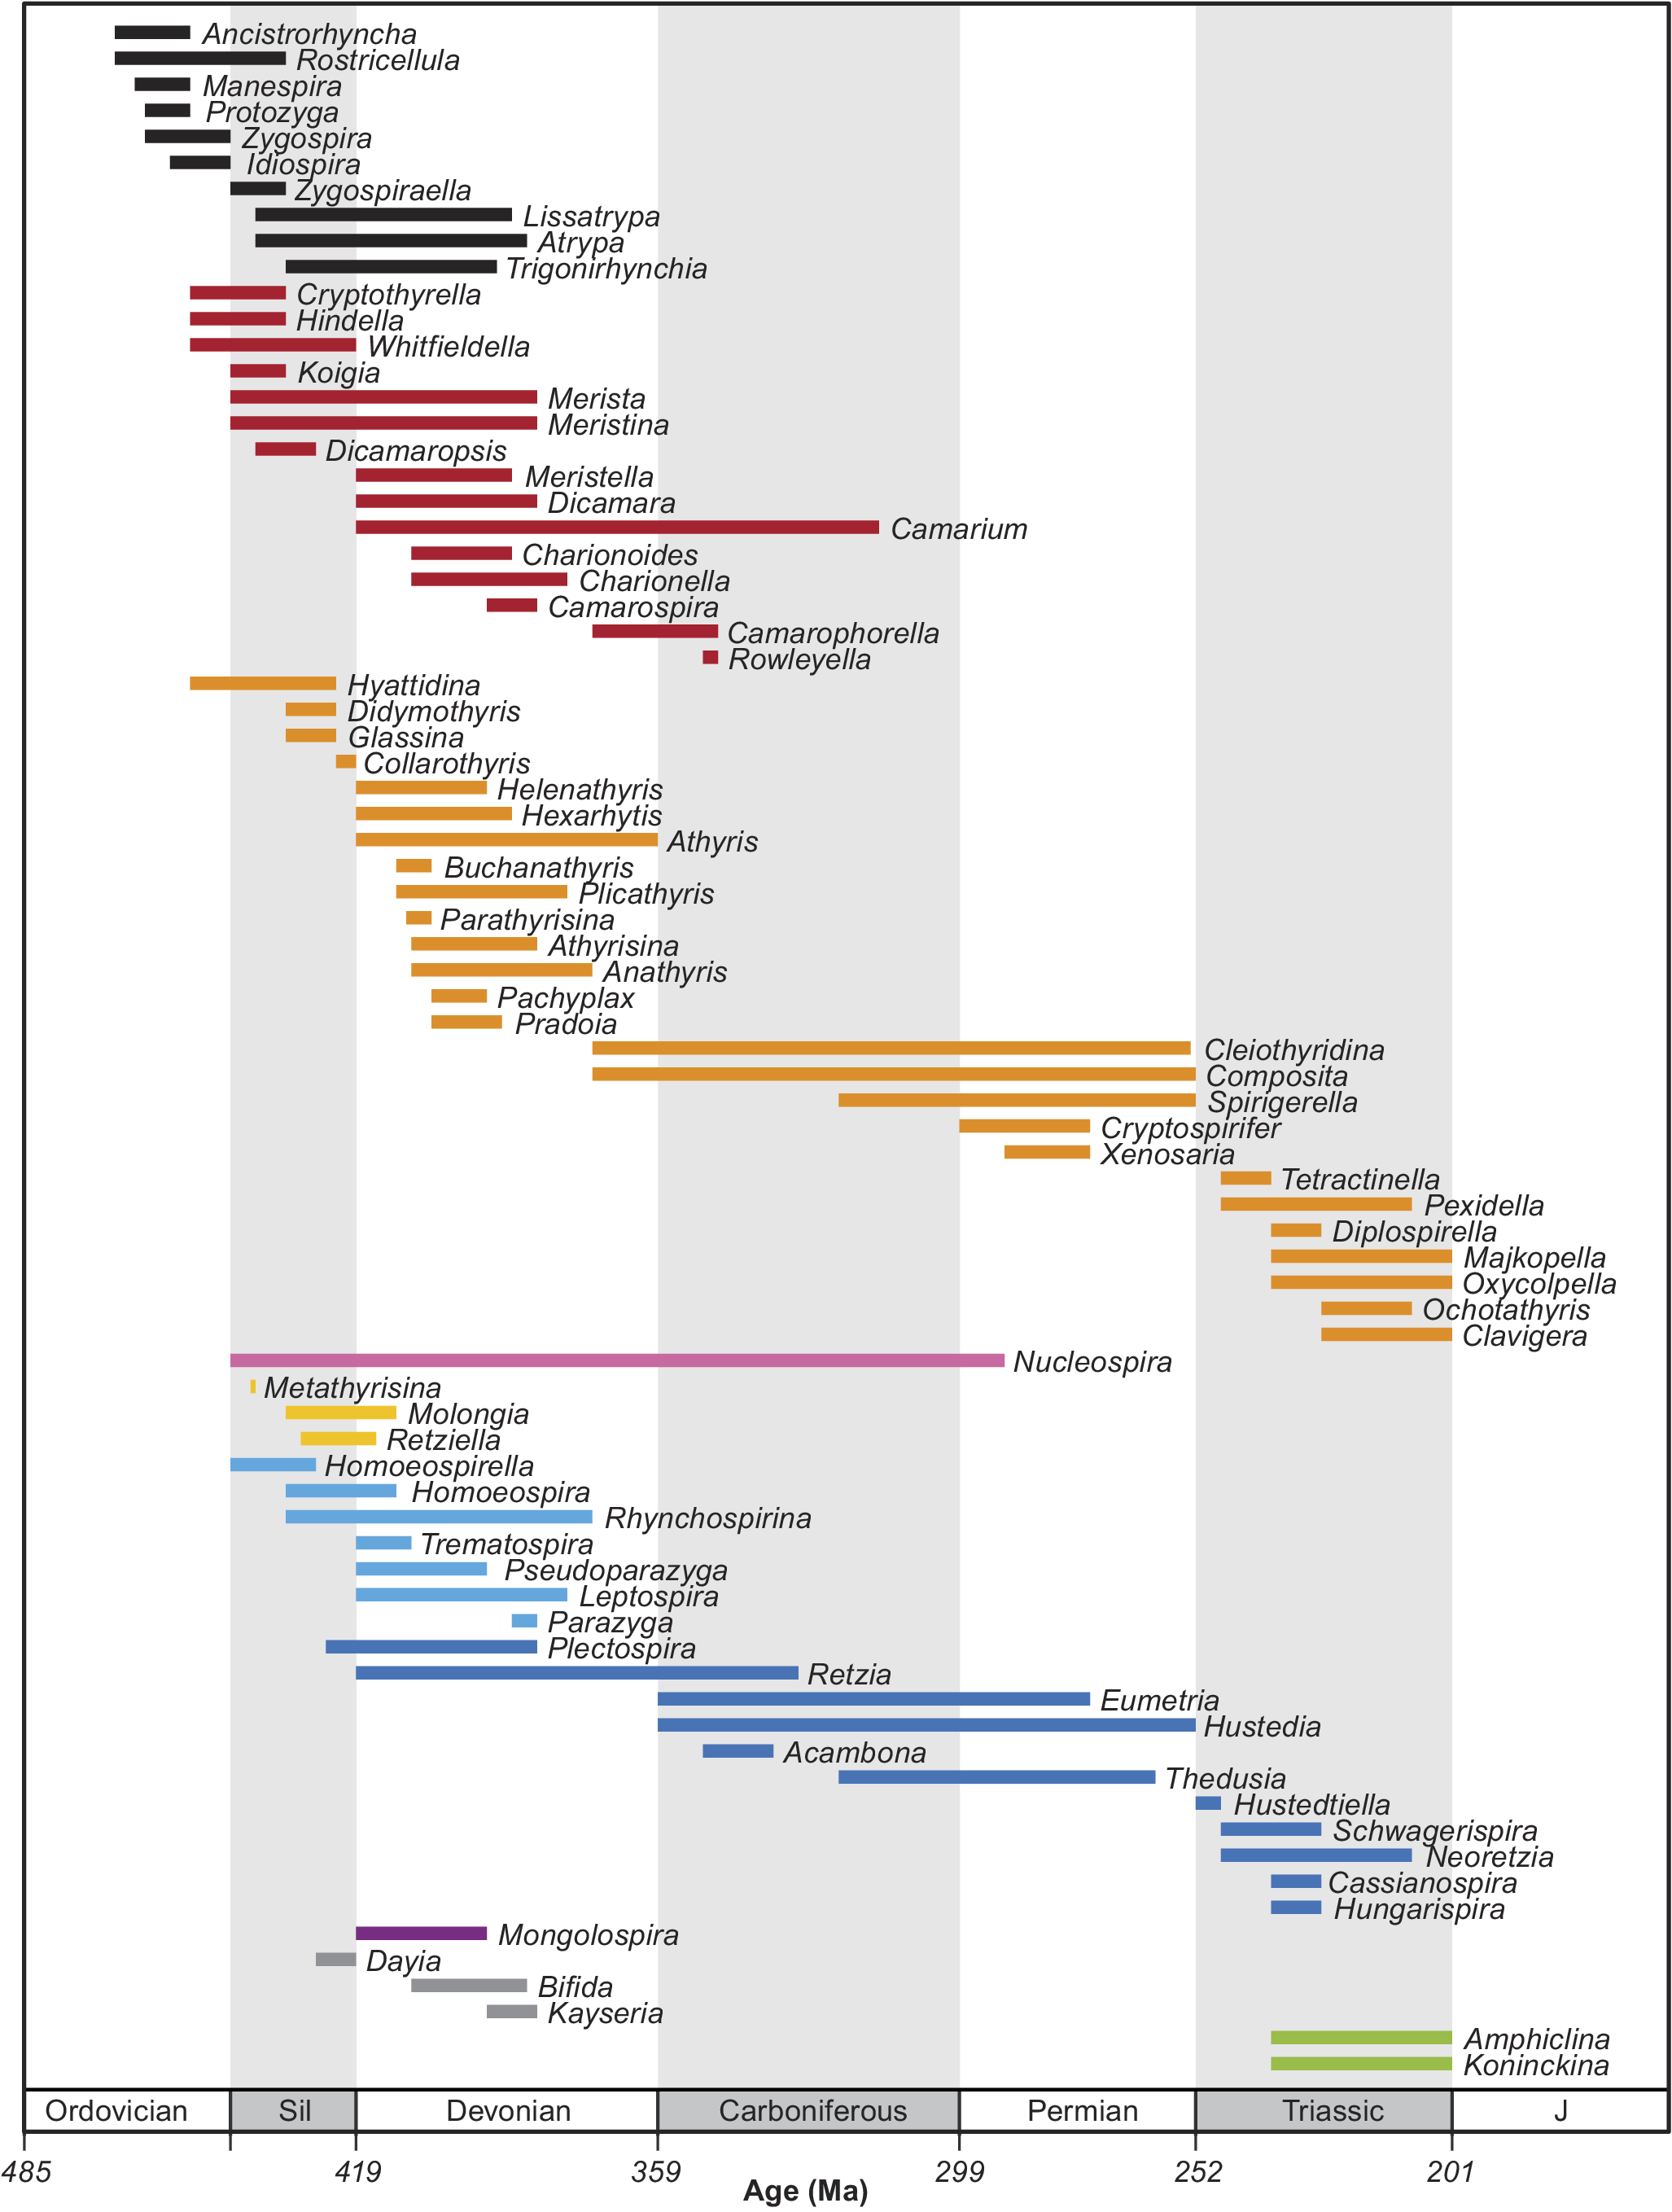
Stratigraphic ranges of athyridide genera included in these analyses, arranged by current classification, from oldest to youngest first appearance, left to right. Taxon colors here as in trees in all subsequent figures. Black = rhynchonellide and atrypide outgroups; red = meristelloids; orange = athyridoids; dark pink = nucleospiroid; yellow = retzielloids; turquoise = rhynchospirinoids; dark blue = retzioids; purple = mongolospiroid; dark gray = Uncertain athyridides; green = koninckinidines.
Their status as a monophyletic group has been debated, as have the relationships among several distinctive groups classified currently in the order. Much of the confusion surrounding the evolutionary status of these groups, and their relationships to one another, concerns the perceived relative significance of different types of anatomical features and their relative first appearance in the stratigraphic record. Which are the more trustworthy homologues: internal or external morphological traits (e.g., Rudwick, Reference Rudwick1970) or shell microstructural traits (e.g., Williams, Reference Williams1956, Reference Williams1968)? In this extinct group, how can we distinguish instances of character convergence from common ancestry in the most effective and compelling manner?
In order to address a range of macroevolutionary questions about morphological evolution, diversity patterns, and extinction selectivity, it is necessary to have a phylogenetic framework within which to test and evaluate hypotheses of relationship. Evolutionary patterns, not merely taxonomic patterns, cannot be studied without such a framework. Although several studies have performed phylogenetic analyses of selected athyridide taxa using parsimony methods (Alvarez and Carlson, Reference Alvarez and Carlson1998; Alvarez et al., Reference Alvarez, Rong and Boucot1998; Alvarez and Rong, Reference Alvarez, Rong and Kaesler2002; Guo et al., Reference Guo, Sun and Balinski2014), the current classification was established to be explicitly “based more on grades of evolution than clades” (Alvarez et al., Reference Alvarez, Rong and Boucot1998, p. 833). This protocol conflates monophyletic groups, which may be nested within paraphyletic groups, obscuring the relationships among them. In order to establish with confidence which groups of taxa are clades and which are grades, a robust and detailed phylogenetic hypothesis is required, with support values and shared derived characters made explicit at each node. Developing a well-supported phylogenetic hypothesis for an empirical data set requires testing the behavior of different analytical models on a single robust data matrix.
In this study, we re-evaluate the athyridide character-taxon matrix analyzed with parsimony methods in Alvarez and Carlson (Reference Alvarez and Carlson1998) using Bayesian methods of phylogenetic inference. Parsimony methods have been criticized for, among other things, making too many overly simplistic assumptions of low and similar rates of evolution among all traits over time (Revell and Harmon, Reference Revell and Harmon2022), for statistical inconsistency that can introduce problems of long-branch attraction (Felsenstein, Reference Felsenstein1978, Reference Felsenstein2004), and for having less power overall in the inference of tree topology than do methods of Bayesian inference (Puttick et al., Reference Puttick, O’Reilly, Tanner, Fleming and Clark2017; but see also Schrago et al., Reference Schrago, Aguiar and Mello2018, and Smith, Reference Smith2019, for a different perspective). In order to test earlier parsimony-based results, we reanalyzed the original Alvarez and Carlson (Reference Alvarez and Carlson1998) athyridide matrix in several ways (described more thoroughly in Methods), established a second, revised matrix, and then compared the topology of trees that resulted.
Our goal is to use Athyridida as an empirical example to test current parsimony-based phylogenetic hypotheses of relationship, to examine the relationship between the various phylogenetic hypotheses obtained with different, Bayesian models (Lewis, Reference Lewis2001; Nylander et al., Reference Nylander, Ronquist, Huelsenbeck and Nieves-Aldrey2004; Wright et al., Reference Wright, Lloyd and Hillis2016; Swofford, Reference Swofford2021) and the current classification of the order, to evaluate the resulting phylogenetic patterns in a stratigraphic context using fossilized birth–death process models (Stadler, Reference Stadler2010; Heath et al., Reference Heath, Huelsenbeck and Stadler2014; Stadler et al., Reference Stadler, Gavryushkina, Warnock, Drummond and Heath2018), and thus more clearly characterize evolutionary trends in several specific athyridide morphological traits, including shell microstructure and body size.
Wright et al. (Reference Wright, Lloyd and Hillis2016) included the Alvarez et al. (Reference Alvarez, Rong and Boucot1998) dataset in analyses that tested models relaxing the assumption that characters evolve symmetrically (referred to as mixture models; Nylander et al., Reference Nylander, Ronquist, Huelsenbeck and Nieves-Aldrey2004), meaning that transition rates between two states are equal. In other words, these models would assign the same probability to transitions from absent to present and present to absent. To relax this assumption, Wright et al. (Reference Wright, Lloyd and Hillis2016) used an additional parameter to model varying degrees of asymmetry between complete symmetry, where transitions are reversible, and near-complete asymmetry in which character transitions are unidirectional and rarely reversible (i.e., Dollo characters; Dollo, Reference Dollo1893). The athyridide dataset was noted as an extreme outlier in this study of 206 morphological datasets because it exhibited the largest difference in topology between the best and worst fitting models (66%) (Wright et al., Reference Wright, Lloyd and Hillis2016). This topological difference motivated our use of an asymmetrical rates mixture model to incorporate rate heterogeneity and asymmetry.
Further motivation for testing different models was provided by the desire to test the assumption that internal and external characters on brachiopod valves evolve at different rates. Partitioned Bayesian models provide a framework for incorporating this independence and for testing it through the comparison of posterior probability distributions. All partitions have different evolutionary rates; however, the distribution of relative rates among characters can vary greatly within each partition. We can examine variation in the evolution of internal and external features both within and between each character set using partitioned models.
Specifically, we ask five questions. (1) How do different methods (models) of analyses compare in the topology of the trees they produce, and in the strength of support for those trees? (2) In this empirical example, is Athyridida monophyletic, and if so, what is its sister group? (3) How are athyridide genera (particularly koninckinidines) related to one another? (4) What is the evolutionary polarity of the coiling direction of spiralia, characteristics of the jugum connecting spiralial arms, endopunctate shell structure, hinge line length, and body size in athyridides? (5) How does the current classification relate to the more robust phylogenetic hypotheses obtained here?
Background
Classification
Muir-Wood (Reference Muir-Wood1955) recognized the Superfamily Rostrospiracea Schuchert and LeVene, Reference Schuchert, LeVene and Pompeckj1929, in the Suborder Spiriferoidea, to include most of the impunctate athyridides. The Treatise on Invertebrate Paleontology (Boucot et al., Reference Boucot, Johnson, Pitrat, Staton and Moore1965) recognized Athyrididina (including Koninckinacea), Retziidina, and Atrypidina as three suborders in the Order Spiriferida, which included endopunctate and impunctate suborders within the order. In the revision of the Treatise on Invertebrate Paleontology, the atrypides were recognized as a separate order (see Copper, Reference Copper and Kaesler2002) based largely on the spiralial coiling direction in the mantle cavity. Alvarez and Rong (Reference Alvarez, Rong and Kaesler2002) recognized three suborders (Athyrididina, Retziidina, and Koninckinidina, two impunctate and one endopunctate) in Athyridida Boucot, Johnson, and Staton, Reference Boucot, Johnson and Staton1964, including 14 genera that were unassigned, with uncertain status. This 2002 classification is widely utilized and referenced today (Table 1). More details on the history of the classification and perceptions of ancestry can be found in Alvarez et al. (Reference Alvarez, Rong and Boucot1998; see also Billings, Reference Billings1867).
Classification of the order, as in Treatise on Invertebrate Paleontology (Alvarez and Rong, Reference Alvarez, Rong and Kaesler2002). Three suborders (plus 1 Uncertain), 11 superfamilies (plus 1 Uncertain), and 18 families (6 monogeneric) named. Numbers in parentheses indicate the number of unquestionable genera assigned to each family
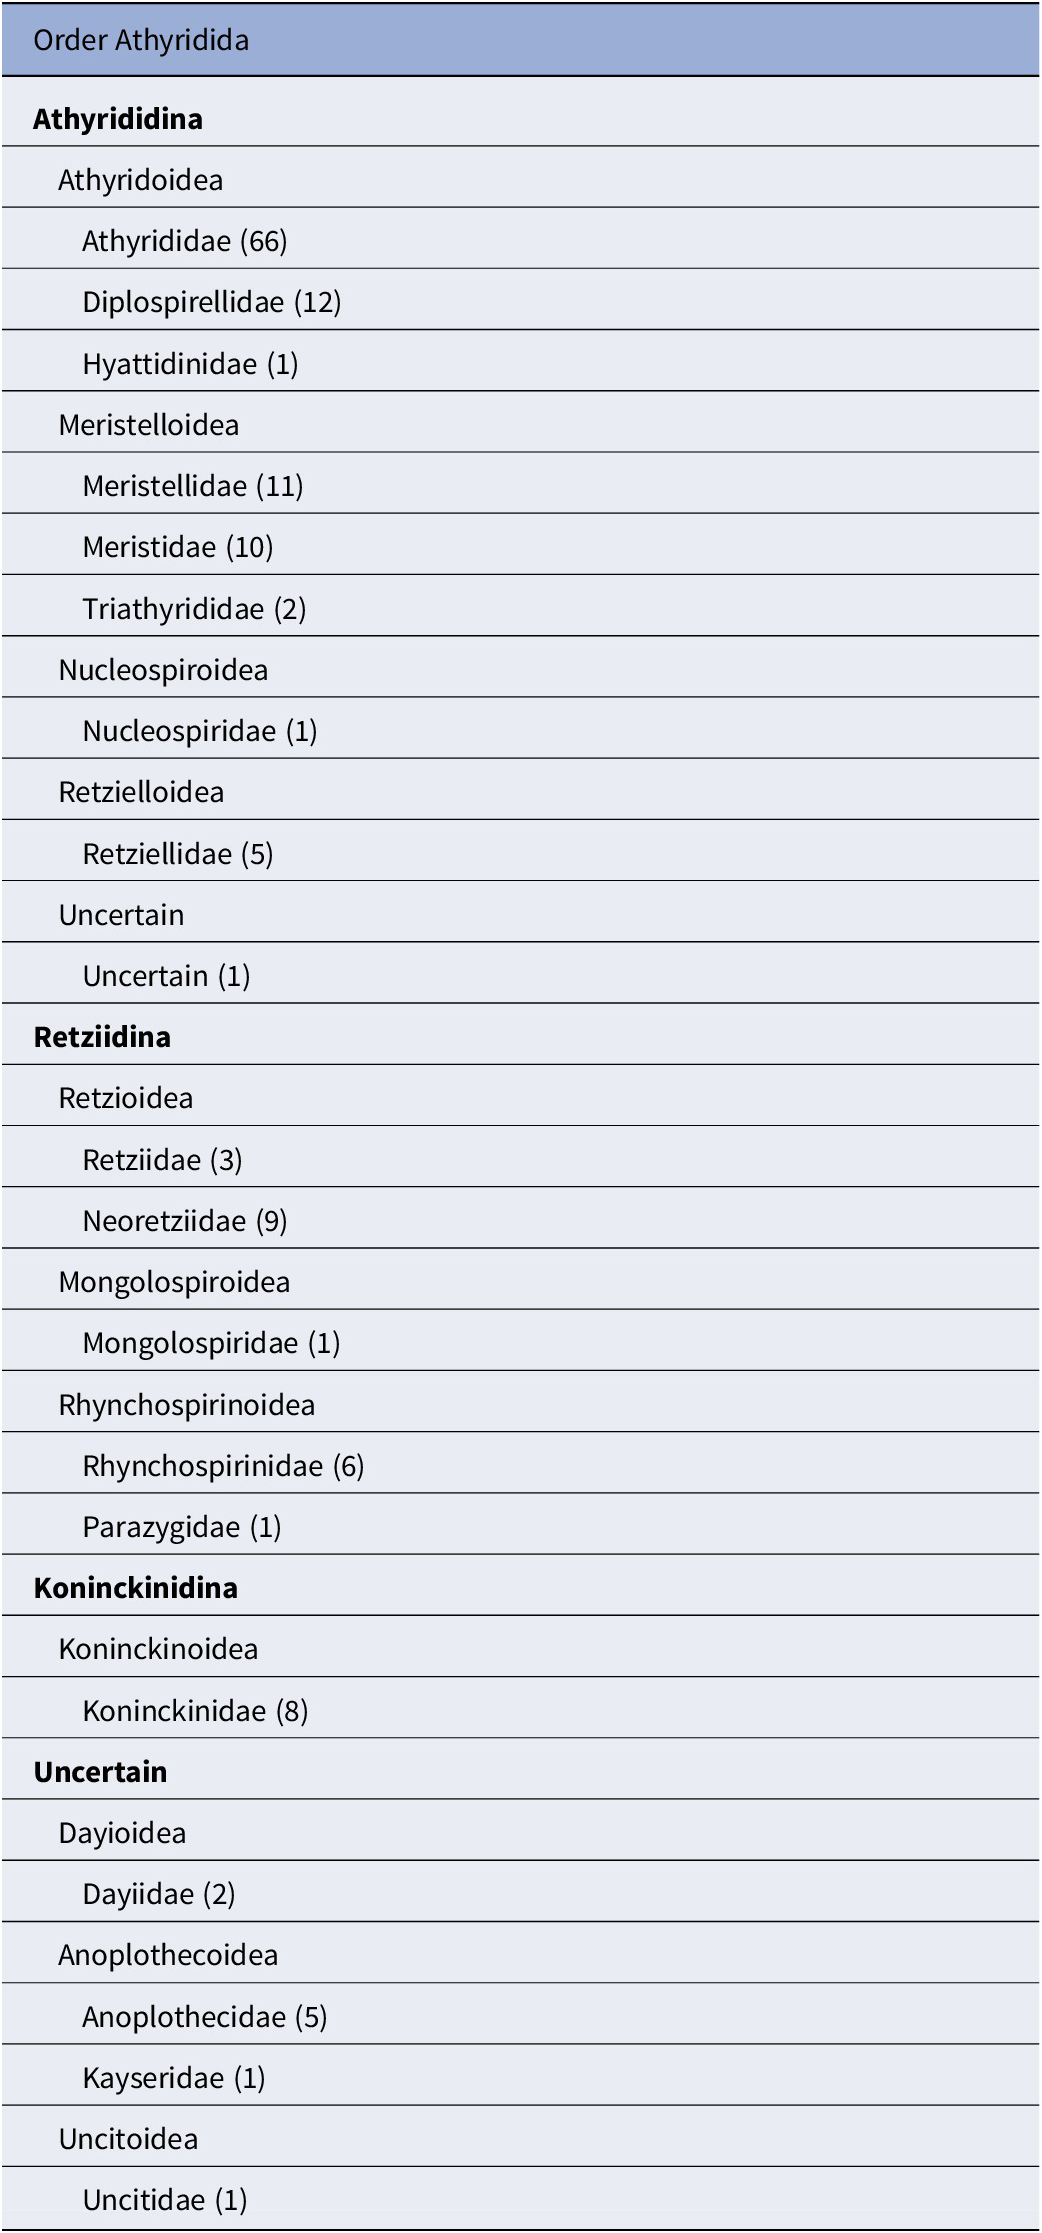
Boucot et al. (Reference Boucot, Johnson and Staton1964) established Athyridoidea as a suborder of Spiriferida to replace Rostrospiracea (Schuchert, Reference Schuchert, Schuchert, LeVene and Pompeckj1929). Alvarez et al. (Reference Alvarez, Rong and Boucot1998) emended the name to ordinal status, and Alvarez and Rong (Reference Alvarez, Rong and Kaesler2002) followed suit. Approximately 175 genera were eventually classified in this order, in 29 subfamilies, 14 families, and eight superfamilies; 28 of these genera (16%) were noted as questionable, requiring revision (Alvarez and Rong, Reference Alvarez, Rong and Kaesler2002). As a group, they were distinguished from the Atrypida by their biconvex, astrophic shells, with laterally directed spiralia connected by a “complex” jugum (emerging ventrally rather abruptly from the primary lamellae of the spiralium), commonly with a uniplicate commissure, circular pedicle foramen, and dorsal cardinal plate or septalium (Fig. 1). Previous classifications of lower-ranked taxa within Athyridida tended to emphasize one of these morphological characters over the others, but seldom considered them all together, relying at least as much on stratigraphic position and paleobiogeographic location to establish higher taxa.
With regard to nomenclature, we retain the name Athyridida for the order (Alvarez and Brunton, Reference Alvarez and Brunton1993), for more direct comparison with the previous work of Alvarez and Carlson (Reference Alvarez and Carlson1998) and Alvarez and Rong (Reference Alvarez, Rong and Kaesler2002). We also acknowledge the argument presented by Copper and Jin (Reference Copper and Jin2017) for use of the earlier name Athyrida (and Athyridina, Athyridoidea, Athyridae, Athyrinae) as used by Phillips (Reference Phillips1841) and Davidson (Reference Davidson1881). Both versions of the name are in circulation; Athyridida is used more commonly and reflects the latinized genitive stem of Athyris M’Coy, Reference M’Coy1844, as recommended by the International Code of Zoological Nomenclature (Ride et al., Reference Ride, Cogger, Dupuis, Kraus, Minelli, Thompson and Tubbs2000, Article 29) (Alvarez et al., Reference Alvarez, Brime and Brunton1980; Alvarez and Brunton, Reference Alvarez and Brunton1993).
Phylogeny
The parsimony analysis by Alvarez and Carlson (Reference Alvarez and Carlson1998) was the first attempt to construct a computer-aided phylogenetic hypothesis for a significant number (>40%) of unquestioned athyridide genera. The original matrix in Alvarez and Carlson (Reference Alvarez and Carlson1998) included 94 genera coded for 83 morphological characters, binary or multistate. For those characters with inapplicable states, 14 of the 83 characters were coded as composite characters (Maddison, Reference Maddison1993; Wilkinson, Reference Wilkinson1995), while eight were coded as contingent characters (Forey and Kitching, Reference Forey, Kitching, Scotland and Pennington2000; Hopkins and St. John, Reference Hopkins and John2021). Sixty-eight ingroup athyridide genera were included, by selecting one or two representative genera from each previously recognized subfamily (Alvarez et al., Reference Alvarez, Rong and Boucot1998). Twenty-six outgroup genera were included because of considerable uncertainty at that time in the likely sister group to the Athyridida: two Orthida, two Pentamerida, four Rhynchonellida, five Spiriferida, eleven Atrypida, and two Terebratulida. It was not possible in 1998 for the authors to analyze the entire matrix with the limited computing power available to them at that time, particularly with such an unbalanced character/taxon ratio, so the matrix was trimmed to retain all 26 outgroups, but only 30 (plus Dayia) of the more completely known (and >67% coded) athyridide genera.
Subsequent analyses (Alvarez et al., Reference Alvarez, Rong and Boucot1998; Alvarez and Rong, Reference Alvarez, Rong and Kaesler2002) reduced the number of taxa to 37 composite representatives per named higher taxon (subfamily, family, or superfamily) and characters (to 37 multistate, 17 of which were composite characters), ordered the states in four of these characters, and arbitrarily weighted eight characters, using two rhynchonellide genera only as outgroups, which appeared to be more distantly related to the athyridides than did the atrypides (Alvarez and Carlson, Reference Alvarez and Carlson1998). Reviewing these previous analyses and the decisions that were made to obtain results, we decided that it would be instructive to revisit the original matrix and compare results obtained from Bayesian analyses with those obtained from earlier, parsimony-based analyses.
Materials and methods
Taxa and characters
In our study, we include 68 athyridide genera plus Dayia, which had been classified (Alexander, Reference Alexander1947; Tucker, Reference Tucker1968) in Atrypida (as an outgroup taxon) in the original Alvarez and Carlson (Reference Alvarez and Carlson1998) matrix. This sampling represents 47% of the 147 genera not noted as questionable (Fig. 3; 28 genera were indicated by a question mark, as needing revision). Unless monotypic, all but two of the 33 athyridide subfamilies were represented by at least two genera, including when possible, the type genus, genera with intact spiralia preserved (47 of 69 ingroup genera), and genera known from their greater abundance at a greater number of localities. Given the goal of analyzing the entire extinct order of 175 genera phylogenetically, we opted to retain the sampling of a few genera in subfamilies, rather than reworking the Alvarez and Carlson (Reference Alvarez and Carlson1998) matrix to sample at the species level from a larger number of representative genera. Based on the results from that study, we removed 16 of the more distantly related original outgroup taxa, leaving three rhynchonellide and seven atrypide genera as outgroups. This revised matrix of 79 taxa (Matrix 1: 83 characters) included a combination of characters coded as either composite or contingent characters, as noted above. Fourteen multistate composite characters were included in which one of the states was coded as “absent,” and the other states were coded as different states of “present.”
Generic standing diversity (Alvarez and Rong, Reference Alvarez, Rong and Kaesler2002; blue) and sampled diversity (orange) in this study, plotted by geological stage. Each genus (other than singletons) ranges over more than one stage, and so is counted in each stage in which it occurs. Each data point per stage represents any genus that occurs in that stage: singletons, boundary crossers, and taxa that originate or become extinct. The highest peak in the Emsian includes six genera requiring revision, tentatively classified in Athyridida (Alvarez and Rong, Reference Alvarez, Rong and Kaesler2002); they may or may not be closely related to the other athyridide taxa.

We constructed a second matrix (Matrix 2: 79 taxa, 98 characters; Appendices 1, 2) in which only sets of contingent characters were recognized; this is the matrix we probed more thoroughly with several additional phylogenetic models (because of the ability to save all trees obtained in initial analyses). Of the 14 multistate characters that originally included an “absent” state with other types of “present” states (#s 11, 14, 16, 18, 19, 41, 51, 56, 65, 71, 76, 77, 80, 83), we established a separate binary “absent” or “present” character, and then retained the various other “present” states in a companion character, contingent upon being coded as “present” in the binary character (see character #s 11 and 12, or 81 and 82, for example). We added one additional character (#25) but did not code and add three new athyridide taxa named since 2002 (Baliqliqia, Tarimathyris, Transcaucasathyris) and five more genera (Comelicothyris, Kintathyris, Mayangella, Nikolaispira, Kellerella) that were not listed in Alvarez and Rong (Reference Alvarez, Rong and Kaesler2002) for more direct comparison of results with Alvarez and Carlson (Reference Alvarez and Carlson1998).
The very delicate nature of the calcified spiralia in all spire-bearers, including the athyridides, leads to their limited preservation in many individuals (Fig. 1). Clear examination in three dimensions of several aspects of the cardinalia and jugum can be quite challenging to achieve, particularly in a broad spectrum of species. Fortunately, the interlocking cyrtomatodont hinge teeth and sockets preserve many individuals in an articulated condition, and reconstructions from serial sections can sometimes yield undisturbed spiralia, encased in matrix infilling the mantle cavity. Cardinalial morphology can be reconstructed with the help of imaging software from these serial sections but is not an ideal way to capture this information.
Computed tomography (CT) scans can sometimes provide excellent recovery in three dimensions, but they can be expensive, risky (if spiralia hidden inside turn out to be broken or displaced), and low resolution, given the similarity in density of the sedimentary matrix and the calcitic valves and spiralia themselves.
For this reason, we opted to code discrete, not continuous, characters and states only (Appendices 1, 2). Any character other than valve length, width, and height measurements can be too difficult to obtain accurately and can provide a false sense of precision and accuracy that can be more easily captured with discrete character states, particularly in an extinct group for which populational and species-level variation is not available in the sample of fossils in hand. For comparison with these discrete size codes, we analyzed quantitative athyridide body volume data from the Heim et al. (Reference Heim, Knope, Schaal, Wang and Payne2015) study, which they generously shared with us (P. Monarrez, personal communication, 2022).
Methods of analysis
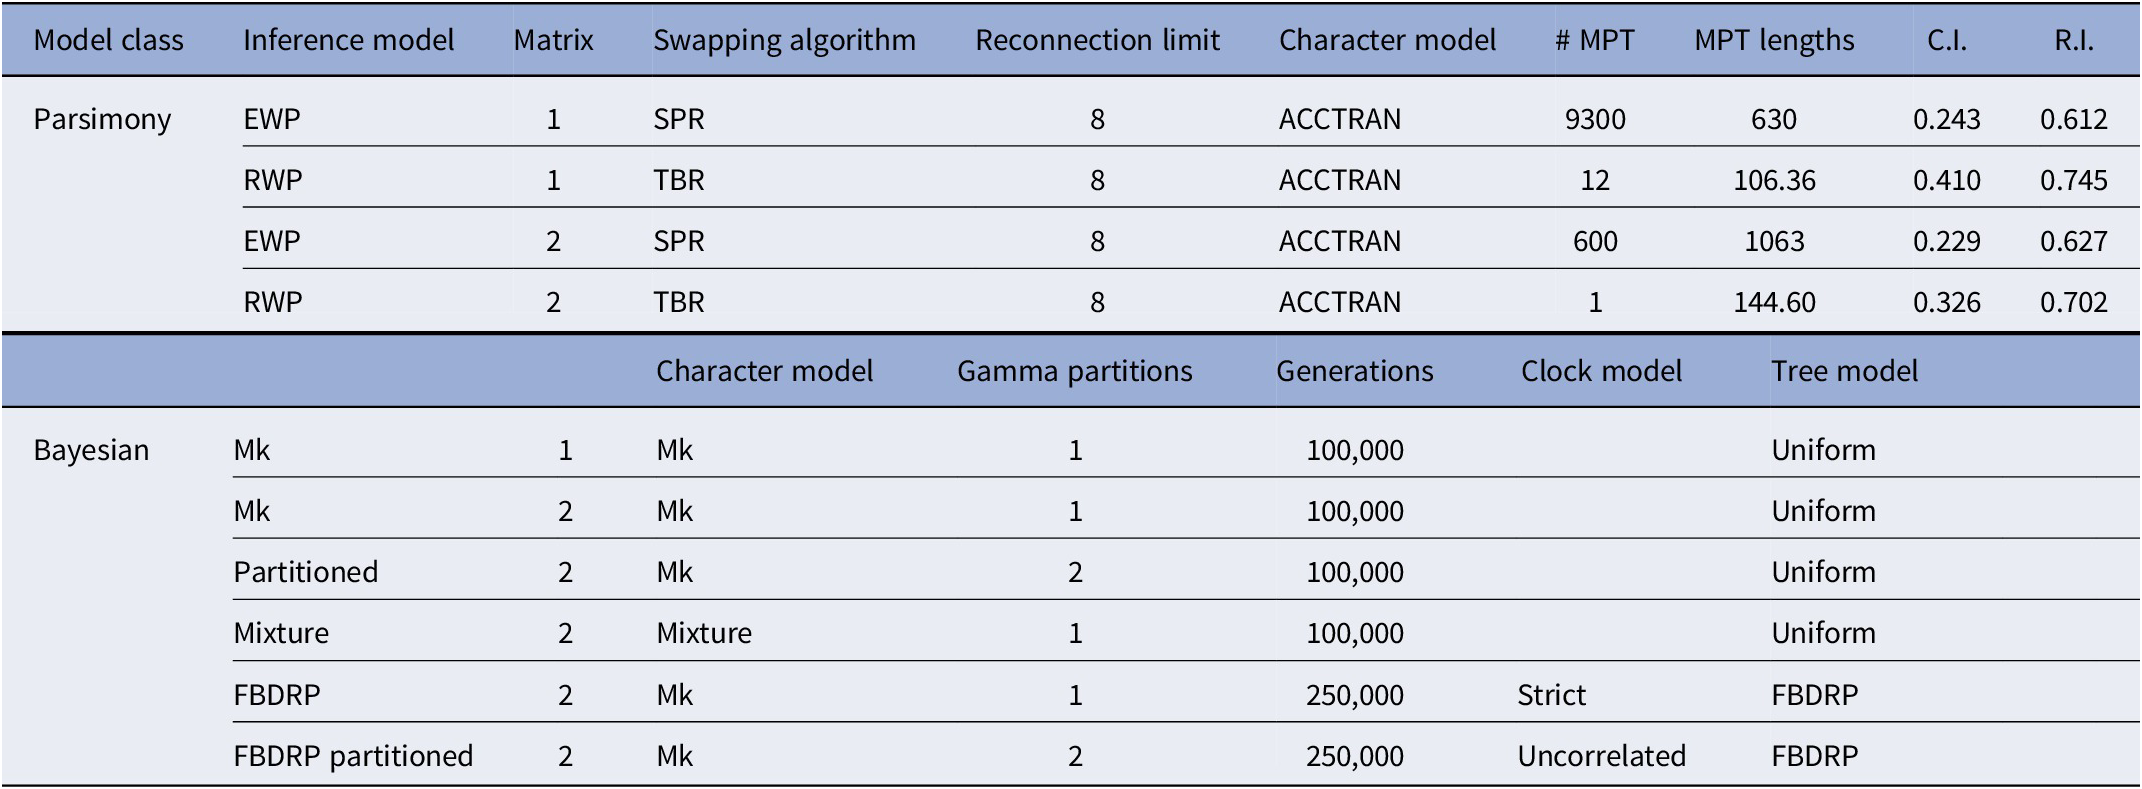
Phylogenetic analyses of morphological data, which are necessarily required for extinct taxa, are notoriously challenging in character coding methods and the evaluation of homology; in the models of evolution utilized in the analyses (Puttick et al., Reference Puttick, O’Reilly, Tanner, Fleming and Clark2017; Wright et al., Reference Wright, Wagner and Wright2021); and in the variable preservation of fossils and our ability to observe characters consistently among the taxa of interest. We wanted to compare our results obtained from several different methods of analysis that exist today, including models that incorporate stratigraphic range data into the analyses (Stadler, Reference Stadler2010; Heath et al., Reference Heath, Huelsenbeck and Stadler2014). Each model carries different sets of assumptions about the nature of evolution and different metrics for evaluating topological and model support. Here we focused not only on parsimony models, which rely on fewer assumptions, but also on likelihood models in a Bayesian context. Our study includes two parsimony experiments and six Bayesian phylogenetic experiments (Table 2), which incorporate different assumptions about character evolution. Bayesian phylogenetic models are informative and powerful tools that allow for greater flexibility in modelling evolutionary assumptions and provide a probabilistic framework for evaluating support for clades and for the models themselves.
Model parameters and search methods used for each experiment. All parsimony experiments were performed in PAUP* 4.0 (Swofford, 2003) using the Heuristic search option. All Bayesian simulations were run in RevBayes 1.1.1 (Höhna et al., Reference Höhna, Landis, Heath, Boussau, Lartillot, Moore, Huelsenbeck and Ronquist2016) using two independent runs with one cold chain and three heated chains. EWP = equally weighted characters; RWP = reweighted characters by rescaled consistency index; SPR = subtree pruning and regrafting; TBR = tree bisection and reconnection; ACCTRAN = accelerated transformation; MPT = most parsimonious tree; C.I. = Consistency Index; R.I. = Retention Index; Mk = continuous-time, discrete k-state Markov process model (Lewis, Reference Lewis2001); Mixture = asymmetrical rates model (Nylander et al., Reference Nylander, Ronquist, Huelsenbeck and Nieves-Aldrey2004); FBDRP = fossilized birth death range process model
Maximum parsimony methods minimize the number of changes of each discrete character on a tree, and aim to minimize hypotheses of character homoplasy, thus maximizing hypotheses of homology. If homology hypotheses are relatively robustly supported by ancillary information on organismal development, positional information, and structure (Rieger and Tyler, Reference Rieger and Tyler1979; Roth, Reference Roth1991), this method can produce more interpretable results. In brachiopods, in which morphological homoplasy has been assumed to be quite common, challenging to perceive, and recognized mainly from relative stratigraphic position (Buckman, Reference Buckman1906; George, Reference George1962; Ager, Reference Ager1965; Cooper, Reference Cooper1972), these assumptions may be less robust. In addition, parsimony is not a statistical method and assumes that the overall rate of evolution of each character is more or less similar to other characters and is relatively slow overall (Revell and Harmon, Reference Revell and Harmon2022). Greater undetected rate heterogeneity in character evolution that might exist can lead to less confident or even misleading results under a model of parsimony.
Methods of analysis that describe a continuous-time, discrete k-state Markov process (known as Mk methods; Lewis, Reference Lewis2001) somewhat relax the strict assumption of minimum homoplasy in tree construction and use likelihood as an optimality criterion. In this context, morphological evolution is modeled by rate-matrices that assign likelihoods to each state transition relative to branch length. The Mk model (Lewis, Reference Lewis2001) is a powerful tool because it allows morphological evolution to be incorporated into a Bayesian framework through a likelihood function. Bayesian methods further expand on earlier methods by parameterizing assumptions that are defined by prior distributions (a-priori assumptions; Wright, Reference Wright2019). Prior distributions provide the probability of sampling a specific parameter value (Wright, Reference Wright2019), which in a phylogenetic context are typically transition-rate probabilities and probability-curves (Lewis, Reference Lewis2001; Harrison and Larsson, Reference Harrison and Larsson2015). This parameterization opens phylogenetic analysis to a broader range of specified models and assumptions, particularly those of interest to phylogeneticists, such as evolutionary assumptions modeled by rate matrices. These specified models include asymmetrical matrices (Nylander et al., Reference Nylander, Ronquist, Huelsenbeck and Nieves-Aldrey2004) and data partitioning (Nylander et al., Reference Nylander, Ronquist, Huelsenbeck and Nieves-Aldrey2004).
Combining the likelihood of the data with the model probability (as defined by prior values) produces a posterior probability, which is the total probability of the data, the priors, and the fit of the priors (model) to the data (Wright, Reference Wright2019). Markov chain Monte Carlo (MCMC) (Metropolis et al., Reference Metropolis, Rosenbluth, Rosenbluth, Teller and Teller1953; Hastings, Reference Hastings1970; Mau et al., Reference Mau, Newton and Larget1999) methods are used to iteratively and pseudo-randomly sample parameter/tree space and generate a posterior sample of topologies and prior values of fit to the data. Thus, clade support can be determined statistically by how often it is sampled across all sampled topologies and prior values. Metropolis-Coupled MCMC (MCMCMC) enhances sampling of tree/model space using parallel cold and hot chains (Altekar et al., Reference Altekar, Dwarkadas, Huelsenbeck and Ronquist2004). Hot chains ‘smooth/melt’ tree/model space by lowering probability maxima and raising minima to prevent the MCMC algorithm from becoming ‘stuck’ at a local optimum (Altekar et al., Reference Altekar, Dwarkadas, Huelsenbeck and Ronquist2004). Our study used RevBayes v.1.1.1 (Höhna et al., Reference Höhna, Landis, Heath, Boussau, Lartillot, Moore, Huelsenbeck and Ronquist2016) to run all MCMCMC simulations.
Comparing the results from methods that utilize different assumptions can therefore be informative about the nature of the data used to construct a taxon–character matrix for analysis as well as the nature of the models used for tree inference. Because model-testing can continue with little end in sight, we decided to stop analyzing these matrices before testing either the marginal acquisition bias approach (mMkv model; Capobianco and Höhna, Reference Capobianco and Höhna2025) or the reversible jump MCMC approach (rjMCMC; Wright and Wynd, Reference Wright and Wynd2024) and leave them for a later study.
Parsimony methods
Matrix 1 and Matrix 2 were each analyzed with PAUP* (version 4.0b10; Swofford, Reference Swofford2021) using the Heuristic search option, ACCTRAN optimization (which accelerates changes in traits toward the root of the tree, maximizing early gains and forcing early subsequent reversals), and SPR (subtree pruning and regrafting) swapping (first equal-weights pass) in 1000 replicates, retaining only the most parsimonious tree at each step. We first analyzed the matrices by equally weighting all characters, in which states were unordered. We then employed implied weighting (see Farris, Reference Farris1969; Goloboff, Reference Goloboff1993) and re-weighted each character by the value of the rescaled consistency index obtained from the initial analysis. The reweighted analysis utilized the same search settings except that we used TBR (tree bisection and reconnection) instead of SPR.
Bayesian Mk methods
We first used the Lewis (Reference Lewis2001) Mk model that, unlike parsimony, uses likelihood as the optimality criterion. We chose to analyze both matrices using the Mk model (Lewis, Reference Lewis2001) in order to test the statement that this model often produces different results from parsimony (Goloboff et al., Reference Goloboff, Pittman, Pol and Xu2018). The Mk model “differs from parsimony in that the probability of change in different tree branches varies simultaneously [at the same rate] for all characters” (Goloboff et al., Reference Goloboff, Pittman, Pol and Xu2018, p. 494). Among-site rate variation (ASRV; Yang, Reference Yang1994) extends the Mk model to allow rate variation among sites in DNA sequences; it can be used to model rate variation among character states in morphological analyses (Harrison and Larsson, Reference Harrison and Larsson2015). Parsimony differs in seeking to minimize overall the amount of evolutionary change required to explain a set of data, and implicitly assumes that that rate of change is slow (Revell and Harmon, Reference Revell and Harmon2022); it produces results consistent with the Mk model results when rates of evolution are low. Here we modeled ASRV with a discretized (k = 4) gamma distribution prior, which allows each character to evolve at one of four different rates. Each rate has a different probability of transitioning for a fixed branch length, thus fast rates are more likely to transition on short branches while slow rates require a longer branch to make transitions likely. Some characters evolve ‘faster’ (more frequently) and others ‘slower’ (less frequently). Thus the slow rate characters require longer branches. The shape of the gamma distribution was determined by the deterministic model node gamma alpha, which was sampled from a uniform hyperprior distribution (0, 1e6).
Mk partitioned analyses
Some brachiopod workers (e.g., Cooper, Reference Cooper1972) assert that internal characters, such as those visible only in disarticulated valves or through reconstructed serial sections (Fig. 1), are more likely to be reliable homologues than are external characters (although they can be quite variable as well). Internal characters are thought to be controlled more consistently by genetic, developmental, and physiological processes, and thus less subject to homoplasy. External characters, or those that can be observed more easily in articulated individuals, are thought to be more variable in general and more likely to reflect external environmental processes (ecophenotypic homoplasy) related to the nature of substrate association (Richardson, Reference Richardson1981; Alvarez, Reference Alvarez2003), current strength of ambient flow (Alexander, Reference Alexander1984), or spatial crowding in clusters of individuals (Doherty, Reference Doherty1979).
Homeomorphy (homoplasy) among brachiopods is commonly asserted (Cloud, Reference Cloud1941; Cooper, Reference Cooper1972; Zezina, Reference Zezina1994, Reference Zezina2003; Alvarez, Reference Alvarez2003; Afanasjeva, Reference Afanasjeva2016), largely because of external morphological similarity occurring in species classified in different higher taxa (often for possession of one “key” character) and different geological time periods (in relative stratigraphic position). Is some particular morphological feature similar in different species due to the effects of similar functional/environmental factors or is it actually due to common ancestry? Before completing a phylogenetic analysis with comprehensive morphological character data, it is not possible to test these two alternative hypotheses. Mosaic evolution within a clade ensures that some of these characters will turn out to be homologous and some homoplastic, and that important distinction can be documented clearly only with reference to a robust phylogenetic hypothesis.
With respect to athyridides, external resemblance has been noted commonly and attributed to some type of homoplasy. Modzalevskaya (Reference Modzalevskaya, Copper and Jin1996, p. 179, 180) stated that “Athyrids are characterized by … a comparatively monotonous external, normally astrophic shell” and “In athyrid evolution, parallelism was especially striking, perhaps due to specialization in early forms.” Alvarez (Reference Alvarez2003, p. 189) stated “processes of evolutionary convergence are common in the athyrid record.” Copper and Jin (Reference Copper and Jin2017, p. 1127) stated that “Externally, it is difficult to distinguish many athyride taxa with smooth or capillate shells, due to their strong homeomorphy.” And yet, Alvarez and Rong (Reference Alvarez, Rong and Kaesler2002, p. 1475) stated “The shells of athyrididines display great external morphological variability,” which they explained is due largely to variation in overall shell shape and ornament.
We tested these competing hypotheses explicitly in two ways. First, we partitioned Mk analysis of Matrix 2 (Appendix 2) by external (#s 1–43) and internal (#s 44–98) characters. Partitioning sets of characters in a Bayesian Mk analysis can reveal differences in relative rates of change per character partition by assigning each partition a different ASRV distribution. Partitioned models assume that different sets evolve through different processes that accommodate the assumption that the distribution of transition rates differs between internal and external characters. The ASRV of each partition was modeled with a discretized gamma distribution (k = 4) as in the first Mk analysis. Second, we compared consistency indices (“which assess homoplasy as a fraction of the character change on a tree, and when applied to single characters, are particularly useful in character weighting;” Farris, Reference Farris1989, p. 407) per character (character index; c.i.) from the topology obtained from a reweighted parsimony analysis with those from the Mk MCC (maximum clade compatibility) topology and the FBD MCC topology, read into PAUP* to obtain character change lists (Appendix 3). This enabled us to document, on a character-by-character basis, not only which characters were playing a larger role in structuring the topology (with higher c.i. values overall), but which particular characters appear to be changing more (at a higher rate, and are more homoplastic, with lower c.i. values) or less (with higher c.i. values), depending on the method of analysis.
Asymmetrical rates analyses
We chose to analyze Matrix 2 with an asymmetrical rates mixture model (Nylander et al., Reference Nylander, Ronquist, Huelsenbeck and Nieves-Aldrey2004; Wright et al., Reference Wright, Lloyd and Hillis2016) as well, to incorporate asymmetrical character evolution. Asymmetrical rates mixture models use modified transition matrices, which make the transition from one state more (or less) likely than a reversal. The purpose of this experiment is to model directionally biased character evolution (as with Dollo characters; Dollo, Reference Dollo1893) in a Bayesian context, which is analogous to ACCTRAN and DELTRAN optimization when inferring evolutionary relationships using parsimony (Swofford, Reference Swofford2021). This model accommodates the assumption that some characters, such as endopunctae or a jugum, are unlikely to be lost after they originate (Fig. 1). Our asymmetrical rates experiment used a Dirichlet prior distribution to generate conjugate pairs of asymmetrical rate matrices.
Bayesian fossilized birth–death range process models
Adding stratigraphic range data to Bayesian analyses allows the incorporation of non-heritable, but still relevant information from known preservation and fossil discovery in the reconstruction of phylogenetic patterns in fossils and extinct taxa (Stadler, Reference Stadler2010). We modeled the fossilized birth–death range process using the dnFBDRP function in RevBayes v.1.1.1. (Höhna et al., Reference Höhna, Landis, Heath, Boussau, Lartillot, Moore, Huelsenbeck and Ronquist2016). The FBDRP distribution is typically generated through three additional priors: birth (speciation) rate, death (extinction) rate, and sampling rate. Because this analysis uses both stratigraphic and morphological data, we used an uncorrelated clock model (Drummond et al., Reference Drummond, Ho, Phillips and Rambaut2006), which uses branch rates to model rates of morphological character evolution relative to time. In the uncorrelated clock model applied here, branch rates are drawn from a logarithmic prior distribution and randomly distributed across the tree (i.e., the branch rate is independent of the rate of its neighboring branches). Because the rate of character evolution is a product of branch rate and length, fast but short branches can then represent the same amount of morphological change as longer, slower branches. We compared results from FBD models partitioned by internal and external characters with those left unpartitioned.
Consensus trees
Consensus trees are used post-hoc to summarize the thousands of trees generated via MCMCMC methods. There are multiple methods of constructing a consensus tree, each with a set of benefits and drawbacks. Majority rule consensus (MRC) trees combine multiple trees to construct a consensus that may or may not actually exist in the sample of individual trees. MRC trees are quite conservative and often more poorly resolved than other consensus trees but are more likely to recover a lower proportion of incorrect nodes (O’Reilly and Donoghue, Reference O’Reilly and Donoghue2018). Maximum a posteriori (MAP) consensus trees are point estimates of the most likely tree based on the interactions between the priors and the data. MAP consensus trees provide more information on the effect of the model because they are calculated using the most frequently sampled (average) prior values. Maximum clade compatibility (MCC) consensus trees illustrate the clades that are most likely and thus appear most often across variations in the model across a broader range of priors. MCC consensus trees can approximate MRC trees, but represent an individual tree drawn from the sample of trees that has the highest clade score.
Despite difficulties acknowledged with both of these latter two consensus methods (O’Reilly and Donoghue, Reference O’Reilly and Donoghue2018; Wright et al., Reference Wright, Bapst, Barido-Sottani and Warnock2022), if the goal of an empirical study is to obtain estimates of patterns of relationship where none exists beyond those inferred indirectly (and possibly incorrectly) from existing classifications, it is instructive to compare all of these consensus trees, and then evaluate empirically which clades are likely to be more or less supported by the existing data, and on what basis. This process requires considerable organismal expertise and evaluation in addition to statistical evaluation.
Body volume over time
Many morphological and functional features of organisms clearly vary with body size (e.g., Smith et al., Reference Smith, Payne, Heim, Balk and Finnegan2016; Ohtsu et al., Reference Ohtsu, Chikami, Umino and Gotoh2022; Valenzuela-Toro et al., Reference Valenzuela-Toro, Mehta, Pyenson, Costa and Koch2023). We examined possible phylogenetic patterns in athyridide body size while acknowledging that variation among conspecific and congeneric adults can be considerable. Given the difficulties of measuring large samples of individuals of all sampled genera, we opted to utilize body-volume measurements from the published literature. Heim et al. (Reference Heim, Knope, Schaal, Wang and Payne2015) measured the three major axes of body size (valve length, width, height) of all brachiopod genera figured in the Treatise on Invertebrate Paleontology Part H, Brachiopoda, Revised, typically one fossil per genus, then calculated body volume and plotted its variation over the Phanerozoic. We extracted these measurements of body volume for all athyridides, and plotted their logarithms over time. Mean volume was calculated in 10-million-year time bins, first for all athyridides and then binned separately by the four higher taxa we have focused on (Fig. 13). We recognize that generalizing body volume per genus from a single image is greatly oversimplified but decided that this could be a useful first step to discerning the possible polarity of small or large body size within clades.
Results
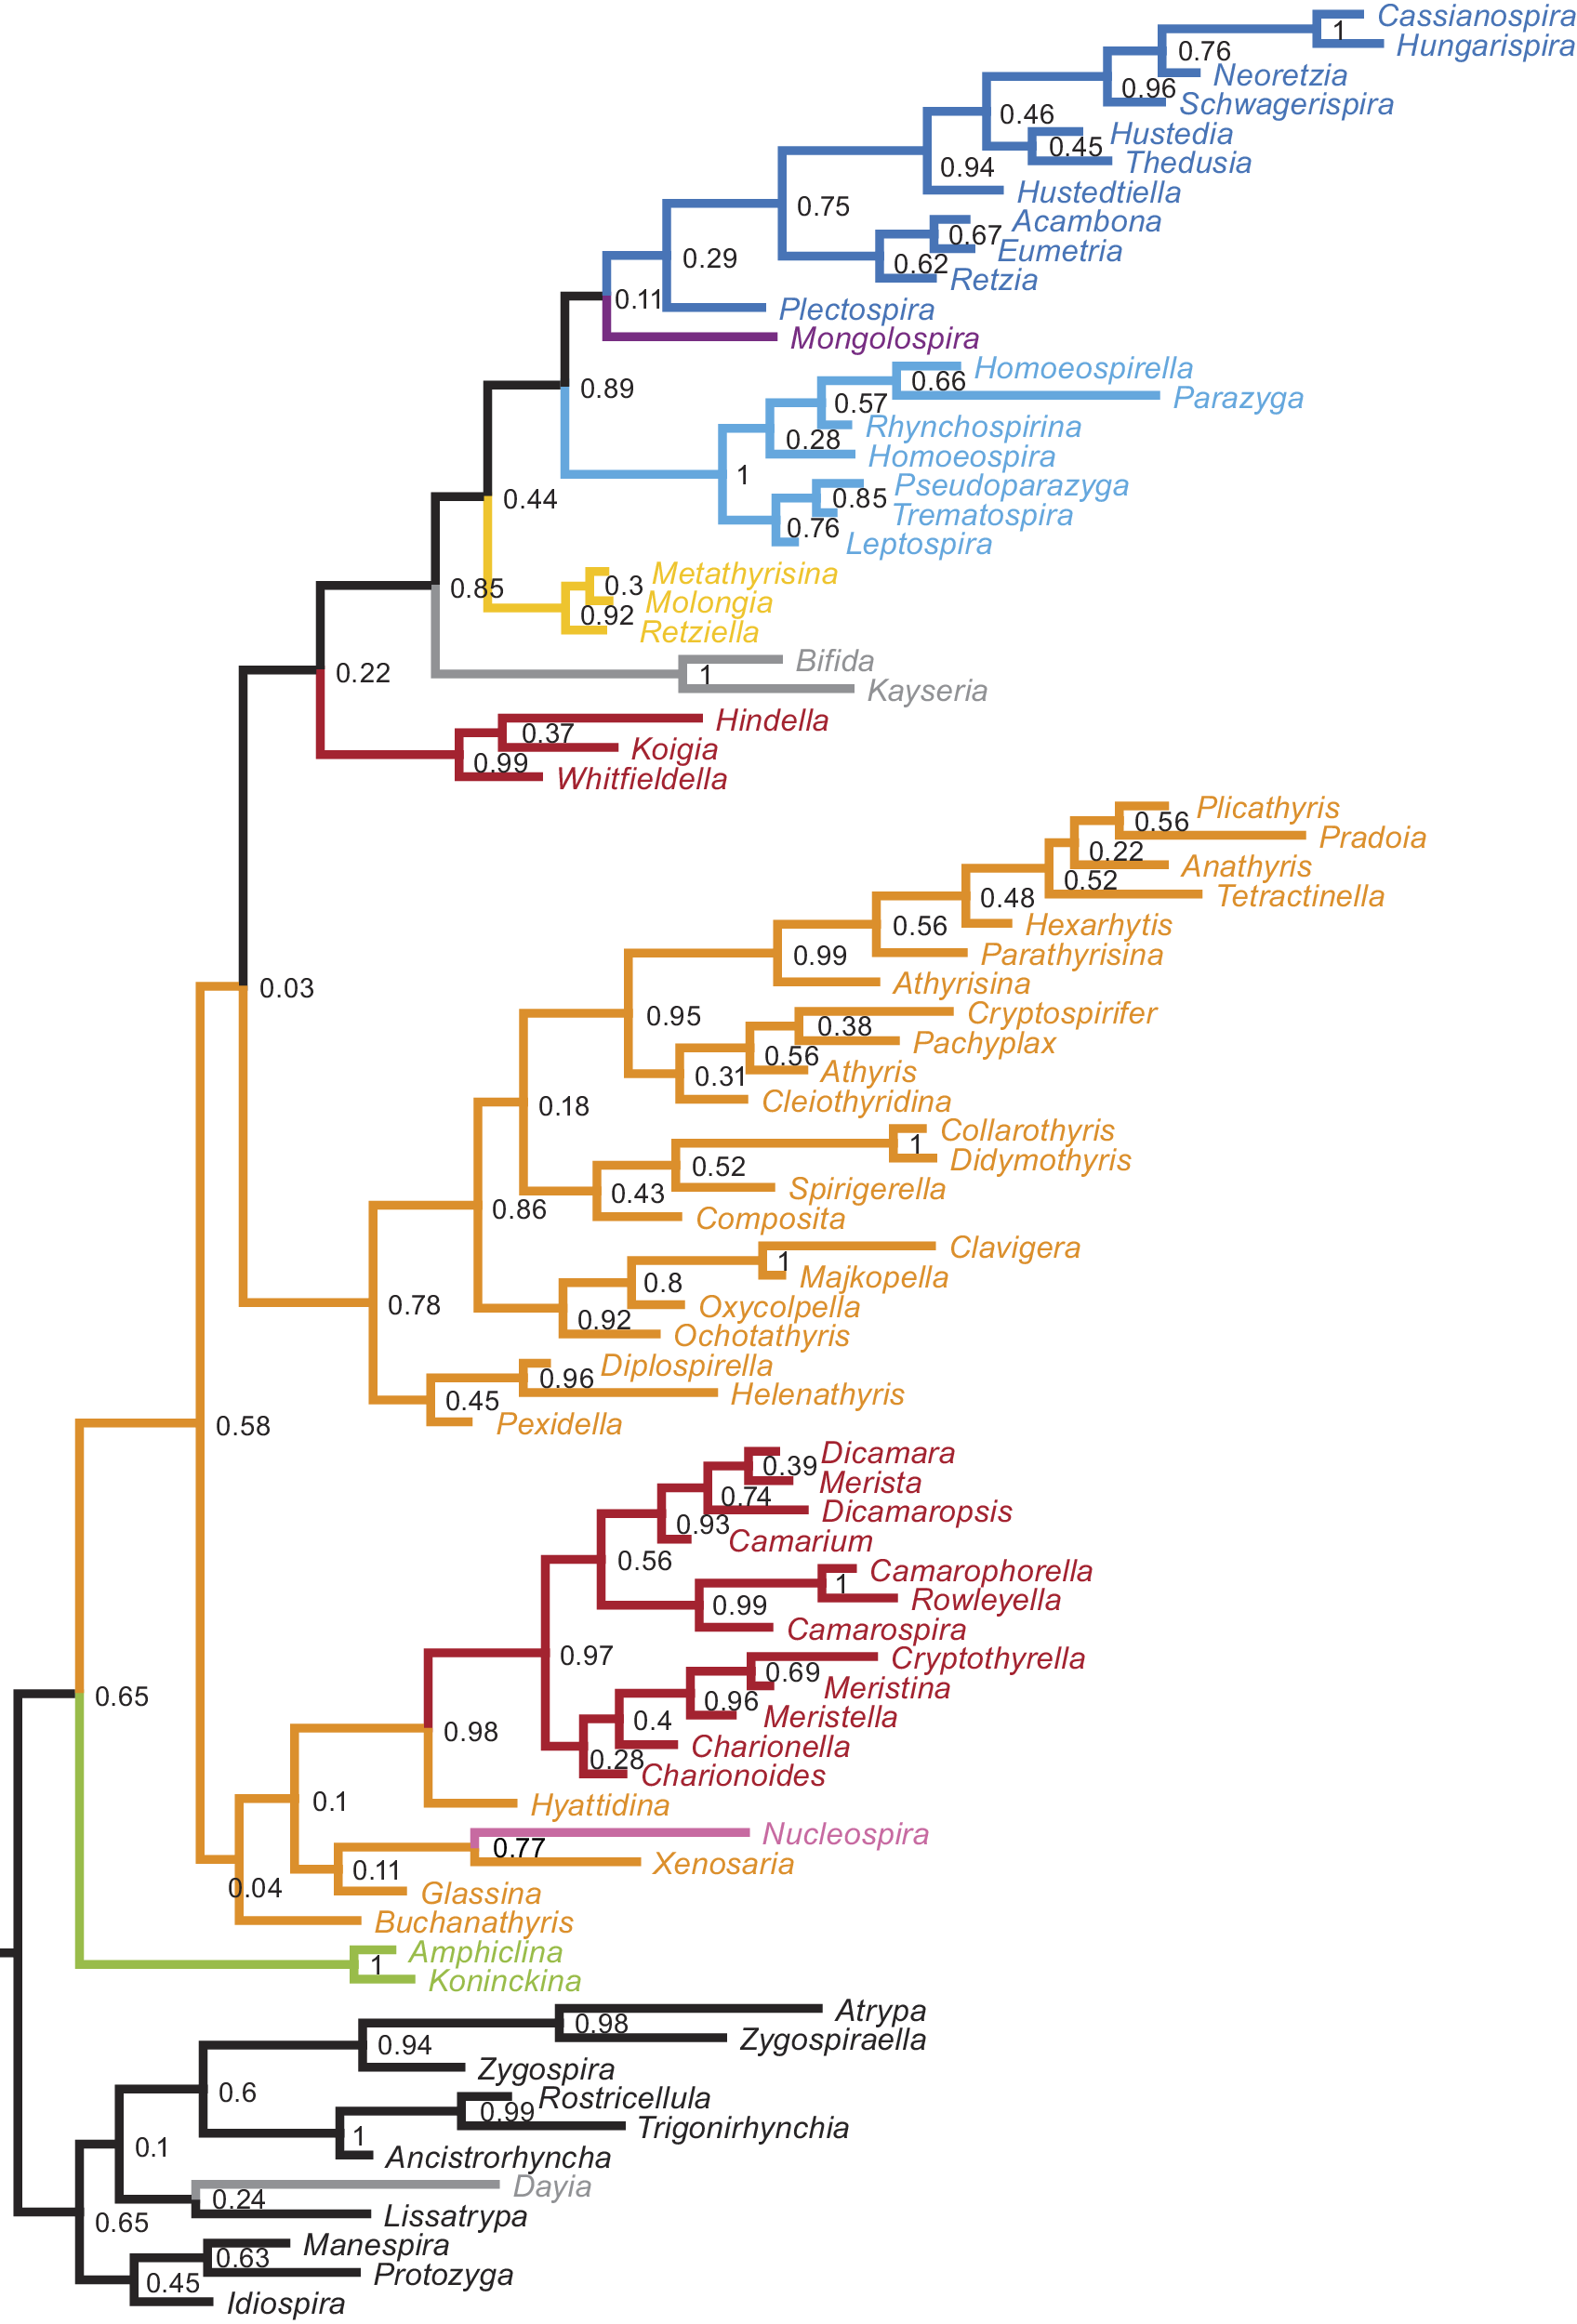
We summarize the major observations in topology from the parsimony and Bayesian analyses performed on each matrix, described with reference to higher taxon names in the current classification (Table 1, as outlined in Alvarez and Rong, Reference Alvarez, Rong and Kaesler2002). Data on each analysis are summarized in Table 2. We chose to illustrate and discuss the MCC consensus trees obtained but included MAP consensus trees for comparison in the Supplemental Materials (SM1–9) because they can differ, sometimes significantly, in topology from the MCC trees (e.g., compare SM5 and SM8). We focused our observations primarily on four groups of athyridides, named as higher taxa: the Athyrididina superfamilies Athyridoidea (orange) and Meristelloidea (red), and the suborders Retziidina (blues; endopunctate) and Koninckinidina (green), with both rhynchonellide and atrypide outgroups (black).
Matrix 1, both composite and contingent characters included
All 12 trees equal to the shortest (length 106.36) were saved from the reweighted parsimony analysis. A 50% majority rule consensus tree results in outgroups split by order, with the rhynchonellides within a non-monophyletic ingroup; koninckinidines basal; meristelloids and the retziidines (with the rhynchonellide outgroups and three other small clades) as sisters; athyridoids and three meristelloids as sister to this more derived clade (Figs. 4, 5).
Matrix 1 results. Fifty percent majority rule consensus tree of all 12 equally most parsimonious cladograms saved after reweighting by the rescaled consistency index from the initial unweighted analysis (RWP). Support values listed at each node; unlabeled nodes have 100% (1.0) support. Black = rhynchonellide and atrypide outgroups; red = meristelloids; orange = athyridoids; dark pink = nucleospiroid; yellow = retzielloids; turquoise = rhynchospirinoids; dark blue = retzioids; purple = mongolospiroid; dark gray = Uncertain athyridides; green = koninckinidines.

Matrix 1 Bayesian Mk analysis maximum clade compatibility consensus tree (MCC), which illustrates the clades that are most likely and thus appear most often across variations in the model, ignoring the priors. Support values listed at each node; search parameters, settings, and indices in Table 2. Black = rhynchonellide and atrypide outgroups; red = meristelloids; orange = athyridoids; dark pink = nucleospiroid; yellow = retzielloids; turquoise = rhynchospirinoids; dark blue = retzioids; purple = mongolospiroid; dark gray = Uncertain athyridides; green = koninckinidines.
In the Bayesian Mk MCC consensus tree, the ingroup is monophyletic; koninckinidines basal. The impunctate Uncertain (see Copper, Reference Copper1973) and retzielloid genera are sister to the endopunctate retziidines, and both are sister to some meristelloids; this clade is sister to most of the athyridoids. Sister to this large clade has some athyridoids basal to most meristelloids. Mk model analysis changed the relationships of three of the four major groups to one another relative to the parsimony analysis.
Matrix 2, contingent characters only
Parsimony
A single tree resulted from the reweighted parsimony analysis, (length 144.60); rhynchonellide outgroups basal, atrypide outgroups are split with some retziidines also split at the base of the tree; koninckinidines are nested within athyridoids, with most atrypides at base; all meristelloids are sister to this clade, with the remaining retziidines (and three other small clades) as sister to this larger, derived clade (Figs. 6, 7).
Matrix 2 parsimony results. Single most parsimonious tree after reweighting by the rescaled consistency index from the initial unweighted analysis (RWP). Black = rhynchonellide and atrypide outgroups; red = meristelloids; orange = athyridoids; dark pink = nucleospiroid; yellow = retzielloids; turquoise = rhynchospirinoids; dark blue = retzioids; purple = mongolospiroid; dark gray = Uncertain athyridides; green = koninckinidines.

Matrix 2 Bayesian Mk analysis, MCC consensus tree. Support values listed at each node; search parameters, settings, and indices in Table 2. Black = rhynchonellide and atrypide outgroups; red = meristelloids; orange = athyridoids; dark pink = nucleospiroid; yellow = retzielloids; turquoise = rhynchospirinoids; dark blue = retzioids; purple = mongolospiroid; dark gray = Uncertain athyridides; green = koninckinidines.

Bayesian Mk MCC consensus tree
Ingroup is monophyletic; koninckinidines basal. The impunctate Uncertain and retzielloid genera are sister to the endopunctate retziidines, and both are sister to most athyridoids; this clade is sister to most of the meristelloids. Sister to this large clade is a small clade of meristelloids (Figs. 6, 7).
Bayesian Mk MCC consensus tree, characters partitioned
Ingroup is monophyletic; koninckinidines basal. The impunctate Uncertain and retzielloid genera are sister to the endopunctate retziidines, and this clade is sister to a clade of most meristelloids and most athyridoids. A small clade of meristelloids and three athyridoids are basal to this large clade (Fig. 8).
Matrix 2 Bayesian Mk results, partitioned by internal versus external characters; MCC consensus tree; Gamma distribution for each partition, external in red, internal in blue. The Gamma distribution from the unpartitioned analysis is in purple. Support values listed at each node. The area under each curve is proportional to the probability of sampling a specific transition rate. Black = rhynchonellide and atrypide outgroups; red = meristelloids; orange = athyridoids; dark pink = nucleospiroid; yellow = retzielloids; turquoise = rhynchospirinoids; dark blue = retzioids; purple = mongolospiroid; dark gray = Uncertain athyridides; green = koninckinidines.

Bayesian asymmetrical rates MCC consensus tree, characters not partitioned
The outgroups are split in two, with the atrypides in a more derived position as sister to the koninckinidines. This clade is sister to nearly all the athyridoids, with the meristelloids in a paraphyletic group basal to this clade and the Uncertain genera sister to the entire clade. The retziidines are sister to the retzielloids, which sit at the base next to the rhynchonelide outgroups (Fig. 9).
Matrix 2 Bayesian asymmetrical rates model results, not partitioned. MCC consensus tree. Support values listed at each node. Black = rhynchonellide and atrypide outgroups; red = meristelloids; orange = athyridoids; dark pink = nucleospiroid; yellow = retzielloids; turquoise = rhynchospirinoids; dark blue = retzioids; purple = mongolospiroid; dark gray = Uncertain athyridides; green = koninckinidines.

Bayesian FBD MCC consensus tree
With characters not partitioned by external and internal, the ingroup is monophyletic; koninckinidines and most meristelloids emerge separately from within the athyridoids, which is a clade sister to the retziidines, with retzielloids at the base (Figs. 10, 11). Small clade of meristelloids and Uncertain genera at base next to the outgroups. Tree branch tips represent the last appearance datum for the genus.
Matrix 2 Fossilized birth–death process model results. Consensus trees estimated jointly from fossilized birth–death process model (FBD) and Bayesian Mk model; unpartitioned data, MCC tree. Support values listed at each node; lineage tips at last appearance datum per genus. Black = rhynchonellide and atrypide outgroups; red = meristelloids; orange = athyridoids; dark pink = nucleospiroid; yellow = retzielloids; turquoise = rhynchospirinoids; dark blue = retzioids; purple = mongolospiroid; dark gray = Uncertain athyridides; green = koninckinidines.

Matrix 2 partitioned by internal versus external characters, MCC tree. Support values listed at each node; lineage tips at last appearance datum per genus. Black = rhynchonellide and atrypide outgroups; red = meristelloids; orange = athyridoids; dark pink = nucleospiroid; yellow = retzielloids; turquoise = rhynchospirinoids; dark blue = retzioids; purple = mongolospiroid; dark gray = Uncertain athyridides; green = koninckinidines.

With characters partitioned, the ingroup is monophyletic; athyrididines are basal and paraphyletic; koninckinidines emerge from within the athyridoids, which is a clade sister to a clade of the endopunctate retziidines, with impunctate retzielloids at the base, and most meristelloids as sister to this clade. The small Hindella clade is distinct from other meristelloids and clusters with the Uncertain taxa at the base of all other taxa.
We mapped three characters (body size #1, radial ornament #12, jugal accessory lamellae #93) on the FBD MCC consensus tree, with characters not partitioned (Fig. 12). The four body-size states recognized initially by Alvarez and Carlson (Reference Alvarez and Carlson1998) are semi-quantitative (approximately 1–10, 11–20, 21–30, and >30 mm) assessments of valve length and based on relatively small sample sizes per genus. Size varies considerably across the FBD MCC unpartitioned tree, although very large and small body sizes both originate in the most derived (impunctate) athyridoid genera post-Paleozoic, while small body size originates in the most derived retziidine genera and Koninckina, post-Paleozoic. Radial ornament is consistently absent in most Athyrididina, including the Hindella clade, with smooth exteriors, but present as costae or plicae in most retziidines. Jugal accessory lamellae are extensions from the primary jugal lamellae that bifurcate as they emerge from the jugal stem and recurve dorsally quite dramatically to parallel the primary lamellae (Fig. 1); in some taxa, they create a diplospire. Jugal accessory lamellae are present in nearly all Athyridoidea, some Triassic retzioids, and rarely in a few meristelloids.
Matrix 2 FBD MCC consensus tree, unpartitioned characters. Body size (Character #1); radial ornament (Character #12); jugal accessory lamellae (Character #93); states indicated on top. Colors indicate character states per character as in the legend.

Other external features of athyridides do not appear to vary phylogenetically in a clear pattern or trend over time, consistent with our conclusion that external characters in general are more homoplastic than internal. The fold and sulcus vary in length, width, and depth among taxa; the unisulcate condition is the most common and the bisulcate condition evolved several times independently as did the rectimarginate condition.
Body volume over time
Apart from the stages with very small sample sizes, meristelloids appear early and increase in size relatively rapidly; they plateau later in the Devonian and are not known past the Carboniferous. Mean log volume for Athyridoidea is 7.45; for Meristelloidea is 6.91; for Retziidina is 6.56; and for Koninckinidina is 5.21, varying over two orders of magnitude in actual body volume. Athyridoids appear at a small size, also increase rapidly but at a consistently smaller size than the meristelloids, continue to increase until the end-Permian, when they decrease and then increase rapidly, persisting into the Jurassic. Endopunctate retziidines appear at a somewhat larger size than the meristelloids, plateau through the Mississippian, then decrease steadily in size into the post-Paleozoic. Small koninckinidines, all post-Paleozoic, are comparable in size to the youngest retziidines.
Discussion
We compared consensus topologies obtained from parsimony, Bayesian Mk MCC and MAP, Bayesian asymmetrical rates, and Bayesian FBD methods, both partitioned and unpartitioned. It is not surprising that both similarities and differences can be seen among the results; interpreting those differences in the context of the evolutionary biology of athyridide brachiopods can be challenging, however.
How do different methods of analysis compare in the resulting tree topologies?
Different assumptions about relative rates of character change and maximizing or relaxing hypotheses about homology do not appear to make a significant difference in the relative coherence of each of the major taxa named in the current classification. However, their status as monophyletic or paraphyletic groups does differ among methods and now can be compared in greater detail, as can the patterns of relationship among the major taxa, among specific genera classified in each and of all athyridides to the outgroup taxa. Sometimes most meristelloids and the athyridoids are sister taxa in a clade; sometimes they form a paraphyletic group basal to the remaining athyridides (Figs. 10, 11). Sometimes the rhynchonellides and atrypides both remain outside the ingroup (all Bayesian analyses except with asymmetrical rates), and sometimes they are split by order (both parsimony analyses).
Differences between the MCC and MAP (SM1–9) consensus topologies are also clear, particularly in the partitioned Mk and FBD results and the asymmetrical rates results. They differ in the relative position of the outgroups and the sister group relationships among the major taxa, as discussed previously. Each consensus tree method applies a different criterion to select a best point estimate of the entire sample, which results in topological differences between methods. Further, each method attempts to summarize the entire sample by drawing a single tree rather than combining all trees to form a composite topology. Criticism of MAP and MCC trees (O’Reilly and Donoghue, Reference O’Reilly and Donoghue2018) has led to multiple proposed alternative strategies for summarizing the posterior sample into a single resolved tree, including conditional clade distribution (Höhna and Drummond, Reference Höhna and Drummond2012; Berling et al., Reference Berling, Klawitter, Bouckaert, Xie, Gavryushkin and Drummond2025), majority rule consensus (O’Reilly and Donoghue, Reference O’Reilly and Donoghue2018), and highest independent posterior subtree reconstruction (Baele et al., Reference Baele, Carvalho, Brusselmans, Dudas, Ji, McCrone, Lemey, Suchard and Rambaut2024). However, here we focus on MCC and MAP because they are broadly used and integrated within RevBayes (Höhna et al., Reference Höhna, Landis, Heath, Boussau, Lartillot, Moore, Huelsenbeck and Ronquist2016).
Maximum clade credibility consensus trees illustrate the most likely clades that appear most often across variations in the model, ignoring the priors. They are often (but not always; Figs. 6–8) more similar to majority-rule consensus trees obtained by parsimony and are preferred when comparing patterns of character evolution because they summarize the clades that are most frequently recovered throughout the posterior sample. Maximum a posteriori consensus trees reflect the most likely topology, given the priors and the likelihood of the data, and better reflect a comparison of the models themselves. The MAP trees generated from our analyses typically have low posterior support scores at the nodes. This is expected because the MAP tree focuses on the maximum a posteriori tree from the sample, which is the most probable tree given the combination of sampled prior values and topological likelihoods. Thus, MAP trees represent the best model fit to the data rather than the most likely clades across all sampled variation in model parameters.
Our initial test, to see if coding characters as contingent (Matrix 2) rather than composite (Matrix 1) would result in different topologies yielded interesting differences in the parsimony analyses utilizing implied weighting (Figs. 4, 6). Both failed to recover a monophyletic Athyridida. Initial heuristic searches using parsimony were completed more efficiently in the matrix with all contingent, rather than composite, characters (Table 2). The arbitrary weighting and ordering of some characters (Alvarez and Rong, Reference Alvarez, Rong and Kaesler2002) is neither necessary nor recommended. Many fewer differences in topology resulted between the two Bayesian Mk analyses (Figs. 5, 7) than between the parsimony analyses.
Partitioning the data by internal and external characters (Fig. 8) illustrates that most internal characters change extremely slowly (are more stable and consistent), with a few changing more rapidly, while most external characters change somewhat slowly (are somewhat less stable and consistent). Internal characters play a somewhat more significant role in structuring tree topology than do external characters. Partitioning also reveals differences in tree topology but maintains athyridide monophyly (Figs. 7, 8).
Comparing the consistency indices per character from the FBD partitioned analyses examined in PAUP* with those from the implied weighting parsimony analyses (Appendix 3) also demonstrates that different blocks of characters evolve at different rates. The mean values of 54 internal characters (0.368) and 43 external characters (0.274) in the reweighted parsimony analysis are higher than those in the FBD partitioned analysis, with mean values of internal characters at 0.331 and external characters at 0.249. Twelve of the 43 external characters (28%) had higher consistency indices in the FBD analysis than in the parsimony topology; 15 (35%) were lower. Only 11 of the 54 internal characters (20%) had higher consistency indices in the FBD analysis than in the parsimony topology; 33 (61%) were lower. Lower values for the characters overall in the FBD partitioned analysis than the parsimony analysis are consistent with the relaxed Mk assumption minimizing homoplasy; internal characters are affected more negatively in the FBD analysis than are the external characters.
Are strict homology or relaxed homology assumptions more defensible? It would seem to depend, at least in part, on the strength of the evidence supporting the initial homology hypotheses. Empirically, we can observe the differences in tree topology and in each character individually in the differences in c.i. values. The pattern of difference reveals that in this athyridide case study, decreased variability (potential homology) among internal characters and increased variability among external characters exists, consistent with the partitioning results. This suggests that, even though athyridides are considered by some to be “monotonous” in their external morphology, these features do vary more (at a slightly higher rate) than do internal features, consistent with statements by Alvarez and Rong (Reference Alvarez, Rong and Kaesler2002).
The Bayesian asymmetrical rates model produces results that differ more from the Mk results than the parsimony results (Figs. 6, 7, 9). This corroborates the results of Wright et al. (Reference Wright, Lloyd and Hillis2016), which indicated that rate-matrix asymmetry can drastically influence recovered topologies.
Adding stratigraphic information to the Bayesian analyses affects the koninkinidines the most, as the latest first-appearing group among the athyridides, with a distinctively different morphology. Fossilized birth–death process models primarily move the Triassic koninckinidines to a derived position within the athyridoids, no longer basal and sister to the rest of the athyridides (Fig. 8), as they were in nearly all other analyses. Despite their late appearance in the fossil record, a more comprehensive analysis of all spire-bearing brachiopods may support the koninckinidines as the sister group to the athyridides (Fig. 6), or possibly to another spire-bearing group, rather than from within the athyridoids. We are testing this hypothesis currently.
Given the various models and analyses compared here, we support Bayesian Mk models to analyze matrices of discrete morphology, coding them as contingent characters rather than composite characters. Although combining heritable and non-heritable data in phylogenetic inference can be problematic, using Fossilized Birth–Death process models to incorporate information on stratigraphic range can be informative, if the data to support FAD and LAD dates are robust, and the stratigraphic ranges of the sampled taxa are not exceedingly different from one another. The long branches in the trees in Figures 10 and 11 illustrate the effects of lower athyridide diversity and thus necessarily lower sampling (Fig. 3) in the Pennsylvanian and early Permian.
One could (pessimistically) conclude from the different topologies obtained here that our results demonstrate that there is simply insufficient data in the matrix to resolve a pattern of phylogenetic relationships among the extinct athyridides—homoplasy is too pervasive (e.g., Puttick et al., Reference Puttick, O’Reilly, Tanner, Fleming and Clark2017). This may well be true, with limited sampling of named taxa (Smith et al., Reference Smith, Puttick, O’Reilly, Pisani and Donoghue2021), limited preservation of all relevant features, and limited data on ontogenetic transformations to test hypotheses of homology. Yet, paleontological experts (e.g., Alvarez, Reference Alvarez1990) on these extinct taxa have constructed a matrix that includes every variable character observed, in a typically very well-preserved group of long-lived, calcitic brachiopods. It is difficult to predict where additional informative morphological data can be obtained to resolve further these patterns of relationship. Despite this, there are consistencies in topology that emerge no matter what model is employed; yet, relationships among the four major groups of taxa are still unclear, even when stratigraphic data are added to the FBD analyses. Is it possible to resolve this issue further at this time? Perhaps not, which is why comparing results on a single matrix from a range of methods can reveal consistencies and inconsistencies to be evaluated and re-revaluated as additional paleontological data become available.
Together with the various tree topologies obtained by these various methods, we can evaluate more clearly which characters are homoplastic and which are homologues, at what levels, at what positions on the trees, and how they change over geological time. For example, the Mk results suggest that external characters might well be more similar due to ecophenotypy than to ancestry. This approach provides a much richer landscape of comparisons of character evolution than can be obtained from classification and stratigraphy alone, or from parsimony analysis alone. Further, it is then possible to compare quantitatively the rate values and tree patterns and how they differ from one group of brachiopods to the next. Similar kinds of analyses of the other spire-bearing orders (Atrypida, Spiriferida, Spiriferinida) are in progress now, and will be compared with these analyses of Athyridida.
All phylogenetic models make assumptions that can result in differences in the analysis of the data in hand, and the results obtained (Wright et al., Reference Wright, Bapst, Barido-Sottani and Warnock2022). Many have noted that models developed to analyze molecular sequence data, for example, may make assumptions that can be inappropriate when analyzing morphological data. Comparing results from different methods can reveal useful information about what might be learned, qualitatively and quantitively, from how a given dataset responds. For this reason, it is necessary to learn as much as possible about the assumptions and models underlying the computational methods used.
Is Athyridida a clade?
Atrypida traditionally has been identified as the sister group to Athyridida (Rudwick, Reference Rudwick1970; Copper in Copper and Gourvennec, Reference Copper, Gourvennec, Copper and Jin1996; Rong and Zhan, Reference Rong and Zhan1996; Williams et al., Reference Williams, Carlson, Brunton, Holmer and Popov1996, 1997–Reference Williams, Brunton, Carlson and Kaesler2007; Alvarez and Carlson, Reference Alvarez and Carlson1998; Carlson and Leighton, Reference Carlson, Leighton, Brunton, Cocks and Long2001; Williams and Carlson, Reference Williams, Carlson and Selden2007; Carlson, Reference Carlson2016). Our Bayesian Mk analyses support this conclusion and indicate that the athyridides evolved from among the lissatrypoid Atrypida (Figs. 6, 7, 10, 11) and appear to be monophyletic. Only the asymmetrical rates model (Fig. 9) analysis results in some koninckinidines and athyridoids more closely related to the atrypides, with the rhynchonellides as outgroups to all. Parsimony analyses of both Matrix 1 and Matrix 2 do not recover a monophyletic Athyridida, in conflict with these commonly held views. Grunt (Reference Grunt2010) proposed that Athyridida and Atrypida each arose directly from a paraphyletic Rhynchonellida by a process of successive budding, but this hypothesis is not consistently supported by our results. More extensive taxon sampling of both atrypides and rhynchonellides is needed to test these hypotheses further, though.
How are athyridide genera related to one another?
The two topologies in which we have the greatest confidence are illustrated in Figure 8 (with support values at each node): the maximum clade compatibility consensus trees generated with the fossilized birth–death process model without and with partitions of internal and external characters. Support values per node are higher overall in the unpartitioned MCC FBD tree (mean = 0.609) than in the partitioned MCC FBD tree (mean = 0.528) at the three more basal nodes that identify sister groups among the major clades (SM5). Unpartitioned, athyridides are monophyletic, as are athyrididines; koninckinidines evolve from within the derived athyridoids; the endopunctate retziidines are monophyletic and evolve from impunctate athyridides; most meristelloids, with the athyridoid Hyattidina at the base, are sister to all other athyridoids; the small Hindella clade is distinct from other meristelloids and clusters with the Uncertain taxa at the base of all other taxa. Punctate retziidines and impunctate retzielloids do not appear to have evolved independently from different rhynchonellide ancestors as Alvarez et al. (Reference Alvarez, Rong and Boucot1998) suggested, but this must be tested further with additional rhynchonellide outgroups.
Koninckinidina Harper, Reference Harper and Benton1993 (see also MacKinnon, Reference MacKinnon and Kaesler2002) appears in our analyses as either a sister to the rest of the athyridides (Alvarez and Rong, Reference Alvarez, Rong and Kaesler2002) or as a highly derived member of the athyridoids. This unusual group has been classified with several different higher taxa in the past, including Spiriferida (Davidson, Reference Davidson1853; Williams, Reference Williams1968; Brunton and MacKinnon, Reference Brunton and MacKinnon1972) and Strophomenida (Cowen and Rudwick, Reference Cowen and Rudwick1966; Dagys, Reference Dagys1973). With a typically strophic hinge line, concavoconvex valves, and planispiral spiralia, their morphology is distinct from most other athyridides. Their Triassic to Jurassic stratigraphic range is also much later than most, but not all, athyridides. Further analysis with a larger group of spire-bearing brachiopods will be necessary to evaluate these possibilities more thoroughly.
Choosing among different topologies to use one (or more) as a phylogenetic foundation for future studies in macroevolution, paleoecology, or paleobiogeography will depend upon the evaluation of experts on the taxa of interest. It is important to compare not only the support values per node, but also the characters themselves that appear as apomorphies in the different results obtained (SM5). Evaluating these from the perspective of ontogeny and development, functional morphology, and biogeography is necessary to choose one hypothesis over another, as is evaluating the relative ease or difficulty of the evolutionary loss or gain of features. These inferences can be difficult to extract unambiguously from extinct brachiopods.
What is the evolutionary polarity of certain specific athyridide morphological features?
Coiling direction of spiralial and jugal characteristics
Except for the slight ventral or ventro-lateral coiling orientation of spiralia in the koninckinidines, athyridide spiralia cones always coil medially to laterally (Fig. 1). Looking into the interior of a dorsal valve at the left spiralial arm, the coiling direction in spiralial growth is clockwise, following the complex, distinctive, and highly variable geometry of the crura near the posterior of the valves. However, from this perspective, spiralial growth in koninckinidines is counter-clockwise.
Hindellines (and some atrypides and possibly other athyridides) have been claimed to lack a mineralized connection between crura and spiralia and the two structures are thus thought to have been connected only by soft tissues when alive (Copper, Reference Copper and Kaesler2002; Copper and Jin, Reference Copper and Jin2017). Given the absence of preserved evidence it is difficult to test this conclusion (Alvarez, Reference Alvarez1999), but one could predict that, for this reason, the spiralia are more likely to be preserved “out of place” or broken in the interior of these fossils, more so than in other athyridides (as in Fig. 1.2). Sectioning samples of individuals of both taxa and comparing the preservation of the spiralia relative to the crura could test this assertion. Hindellines are one of the earliest groups to appear in the fossil record, and form a small clade separate from the other meristelloids in most of our analyses; this test could identify other characteristics that separate the hindellines from the other meristelloids, placing them closer to the atrypide outgroups.
The jugum, a mineralized structure that connects the two primary lamellae of the spiralial arms, is located near the midline of the valve interior (Fig. 1). Both Atrypida (Copper, Reference Copper and Kaesler2002) and Athyridida possess a jugum. Athyridide jugal characteristics, like the crural features, can be highly variable and complex geometrically. Interestingly, the transverse band in many terebratulide brachiopod loops might be homologous with the jugum in these spire-bearers (or not, see Samtleben, Reference Samtleben1972; Copper, Reference Copper1986); further testing will be necessary to determine this.
Some athyridides have jugal accessory lamellae (Fig. 1.3) that extend dorsally from the jugum stem bifurcation and closely follow the primary spiralial lamellae, some extend to the apex of the cone. This feature has clearly evolved multiple times independently; three times, as documented by Alvarez and Rong (Reference Alvarez, Rong and Kaesler2002), at least five times as documented by Guo et al. (Reference Guo, Sun and Balinski2014), and possibly six times or more in our analyses (Fig. 1.3), often, but not always, associated with small body size. These “double spiralia” or diplospires (Balinski, Reference Balinski1977, Reference Balinski1995; Benigni and Ferliga, Reference Benigni and Ferliga1990); are curious features and difficult to explain in terms of both growth and function during the life of these brachiopods (Campbell and Chatterton, Reference Campbell and Chatterton1979), and merit further study even beyond the careful study of Guo et al. (Reference Guo, Sun and Balinski2014).
Endopunctate shell structure
Endopunctae evolved from an impunctate shell structure apparently just once within Athyridida (Figs. 10, 11). Punctae evolved similarly in Dalmanellidina from impunctate Orthida, and in Spiriferinida (from Spiriferida), in Terebratulida (from impunctate spire-bearers or Rhynchonellida), and in Thecideida (from as yet uncertain ancestors). Some type of shell perforation also evolved in a few rhynchonellide species, but their homology with endopunctae is doubtful (Williams et al., Reference Williams, Brunton, Carlson and Kaesler1997; Savage, Reference Savage and Kaesler2002). Homology among all these different punctate shell structures has not yet been determined definitively, but once evolved, an endopunctate shell structure is only extremely rarely lost evolutionarily. The multiple originations and rare loss of an endopunctate shell structure across all brachiopods suggest a significant, but as yet unknown functional role (or roles) for punctae (Owen and Williams, Reference Owen and Williams1969; Shumway, Reference Shumway1982; Curry, Reference Curry1983; Thayer, Reference Thayer1986).
Athyridides are one of only two major rhynchonellate groups now extinct to survive the end-Permian mass extinction event: Spiriferinida are endopunctate, but the post-Paleozoic athyridide taxa are both impunctate, with large body sizes (e.g., Clavigera), and endopunctate, with typically small body sizes (e.g., Neoretzia) (Figs. 2, 13). The significance of a punctate shell structure in brachiopods during times of extinction remains to be explored further.
Athyridida body size through time (from Heim et al., Reference Heim, Knope, Schaal, Wang and Payne2015); body volume data in (log) mm3. Top plot: stratigraphic ranges of each genus in the order in gray; thick black line connects mean values per 10-my bins. Bottom plot: four higher ingroup taxa plotted separately, colored as follows: red = meristelloids; orange = athyridoids; blue = endopunctate rhynchospirinoids and retzioids; green = koninckinidines. Thin black vertical lines indicate timing of major extinction events.

Hinge line length
Most Athyridida have curved, astrophic hinge lines as adults, but strophic (straight, or near straight) hinge lines evolved several times from astrophic ancestors (e.g., in Anathyris, Clavigera, or the koninckinidines). Ontogenetically, first-formed shells in extant rhynchonellate brachiopods are typically astrophic (Stricker and Reed, Reference Stricker and Reed1985; Lee et al., Reference Lee, MacKinnon, Smirnova, Baker, Jin, Sun and Kaesler2006) or with very short hingelines and remain so through adulthood. Thus, the presence of an astrophic hinge line in adults can be thought to represent a paedomorphic retention. Thecideides are the only extant brachiopods that grow to become strophic (in most taxa) as adults, a feature that was very common in the extinct strophomenates and more basal rhynchonellates (e.g., Orthida).
Body size
Adult body size in all named athyridides changes by over 10-fold through its entire range. The impunctate athyridides increase in size initially then stabilize later in the Paleozoic, with a major size reduction following the end-Permian extinction event, and even more major increases in the Triassic (with a necessarily small sample size in the Jurassic) (Fig. 13). However, this temporal pattern in the major taxonomic groups is without clear size-selectivity except among the athyridoids, which are more diverse and larger overall post-Devonian. At the same time, the endopunctate taxa first show a stable temporal pattern of relatively large size, and then a consistent trend to smaller size, barely affected by the end-Permian mass extinction event. Phylogenetically, moderate to large size characterizes most athyridides and varies considerably in each of the two main clades (Fig. 12). It is interesting to note that very large and small body size each originate in the more derived (impunctate) athyridoid and koninckinidine genera post-Paleozoic (Baeza-Carratalá et al., Reference Baeza-Carratalá, García Joral, Giannetti and Tent-Manclús2015), while even smaller body size originates in the most derived (endopunctate) retziidine genera post-Paleozoic, suggesting a possible macroevolutionary character displacement in body size from the mid-Carboniferous on.
How does the current classification relate to these phylogenetic hypotheses?
The four main higher taxa that we focused on (Athyridoidea, Meristelloidea, Retziidina, and Koninckinidina) maintained their coherence in most of the analyses, with a few exceptions: the small Hindella group consistently separated from the rest of the meristelloids; athyridoids were usually paraphyletic; Dayia consistently clustered with the atrypides, not in a Suborder Uncertain in Athyridida. Bifida and Kayseria both cluster together, typically with Nucleospira and the retziellids, and with the endopunctate taxa. Many unquestionable athyridide genera (66 of 146, or 45%) are classified in a single family (Athyrididae). Endopunctate (Retziidina) and other genera with unusual morphologies (Koninckinidina and Uncertain) have been classified in separate suborders. Many monogeneric families (33%) and two monogeneric superfamilies exist. In most of our analyses, Koninckinidina appears to be sister to all other athyridides, which raises questions about the classification of the koninckinidines in Athyridida. The genera that are consistently distinct from the others in the superfamily in which they have been classified are now more easily identified, and paraphyletic higher taxa can be more clearly identified as such.
The structure of a classification can give some insights into thoughts about possible relationships based on possible homologies, as established initially and then as emended over time. Higher taxa are often named based on features present in genera that appear later (and that may be more derived) stratigraphically. Athyris, for example, is Devonian in age, which is about the middle of the total temporal distribution of the athyridides. Athyris lacks some features present in the earliest athyridides that have been lost by the Devonian and does not possess some features that originate in later athyridides. Robust phylogenetic hypotheses enable the evaluation of the homology of morphological characters that are important in establishing higher taxa, analyzed in the context of geological time.
Conclusions
We chose to explore the effects of different models of phylogenetic inference with a morphological data matrix of extinct brachiopods that includes nearly 50% of all the named athyridide genera; 90% of which are coded for at least 67% of their characters. We hope that others wishing to explore the effects of different models on their own data will find our results from this example helpful and instructive. Depending on the research question one wants to answer, using a single model may be sufficient, but it can be difficult to discern which model is most relevant, prior to completing exploratory, comparative analyses. Given the differences that emerge here from the different evolutionary models employed, we think it is advisable to compare more than one, particularly with extinct groups (Mulvey et al., Reference Mulvey, Nikolic, Allen, Heath and Warnock2025). The available morphological data alone, even with the addition of stratigraphic range data, may not be sufficiently comprehensive to determine a truly definitive pattern of phylogenetic relationships among extinct brachiopods. Nevertheless, it is only by using morphology that hypotheses of function and deep-time evolution can be pursued in extinct groups. Extant descendants are likely to have lost or transformed morphological features present in their ancestors through the process of evolution itself.
From this case study, we can investigate the phylogenetic fidelity of named higher taxa in greater detail, identify close relatives of any particular (sampled) genus of interest, trace the evolution of a certain character or character complex within robust phylogenetic frameworks, investigate whether certain sets of characters evolve at different rates than other sets, and examine these changes in the context of geological time. The trees obtained can be used to further investigate the function, ecology, biogeography, behavior, and other characteristics of athyridide brachiopods, on a foundation of more robust, comparative, tested hypotheses of homology, homoplasy, and common ancestry.
Acknowledgments
We thank the expert Curators and Collections Staff in the Department of Paleobiology at the Smithsonian Institution’s National Museum of Natural History for assistance during our research visits. We also thank N. Heim and co-authors for giving us full access to their comprehensive brachiopod body volume data (Heim et al., Reference Heim, Knope, Schaal, Wang and Payne2015). We particularly thank J.C. Fong for her invaluable assistance in creating the figures. RKVD and SEM thank the UC Davis Department of Earth and Planetary Sciences for support from Durrell Fellowships. JAS thanks the National Science Foundation for support from an NSF Earth Sciences Postdoctoral Fellowship NSF-EAR-PF 2053086. The authors thank the reviewers, whose comments have greatly improved the quality of this manuscript.
Competing interests
The authors have no competing interests to declare.
Data availability statement
Supplemental Materials are available from the Dryad Digital Repository: https://doi.org/10.5061/dryad.6m905qgcp.
Appendix 1
Matrix 2 taxa and characters, with 69 ingroup genera and 10 outgroup genera coded for 98 morphological characters. The following characters here were added from Matrix 1: 11, 15, 18, 21, 23, 25, 47, 58, 64, 74, 81, 87, 89, 93, 97. Dashes in the matrix indicate unknown or unpreserved features in the genus, or features that are not applicable (i.e., a state in a character that is absent in that genus).

Appendix 2
Matrix 2, list of all 98 characters and character states.
-
1 Size_in_mm / small<10 moderate_10to20 large_21to30 very_large>30,
-
2 Form / L=W L>W L<W L=W_or_L>W L=W_or_L<W L=W_or_L>W_or_L<W,
-
3 Outline_dorsal_view / subtriangular subpentagonal subcircular subelliptical,
-
4 Anterior_margin / not_lobed lobed,
-
5 Outline_side_view / compressed_posteriorly elliptical compressed_anteriorly,
-
6 Lateral_profile / biconvex plano_or_concavoconvex ventribiconvex convexoconcave,
-
7 Degree_of_convexity_adult_shell / weak moderate strong very_strong,
-
8 Convexity_adult_shell / VD>VV VD<VV VD=VV,
-
9 Prominent_hook_ventral_VV / not_beaked moderately strongly very_strongly_beaked,
-
10 Ventral_umbo_curvature / straight moderate strong very_strong,
-
11 Radial_ornamentation / absent present,
-
12 Radial_ornamentation_type / NA plicae costae,
-
13 If_ribs_costae / 15_or_<15 >_15,
-
14 If_other_ornament / bifurcating_lines in_herring_bone,
-
15 Spines / absent present,
-
16 Spines_type / NA solid_rounded solid_tabular hollow very_small_fimbriae,
-
17 Distribution_radial_ornament / entire_shell twothirds_anterior,
-
18 Growth_lines / absent present,
-
19 Growth_lines_strength / NA weak strong,
-
20 Growth_lines_spacing / close_together wide_distant,
-
21 Lamellae_frills / absent present,
-
22 Lamellae_frills_type / NA short long very_long very_thick,
-
23 Medial_fold_sulcus / absent_rectimarginate present,
-
24 Medial_fold_and_sulcus_type / NA weak strong fold_in_both_valves sulcus_in_both_valves,
-
25 Medial_fold_sulcus_p_or_s / uniplicate_dorsal_fold unisulcate_dorsal_sulcus,
-
26 Medial_fold_and_sulcus_ornamentation / smooth costate radial_thin_costellae fine_lines_bifurcating,
-
27 If_costae / Similar_to_ornamentation_on_flanks different,
-
28 Width_of_fold_and_sulcus / wide narrow very_wide,
-
29 Length_of_fold_and_sulcus / entire_shell posterior_twothirds posterior_onethird,
-
30 Adult_folding / alternate opposite mixed,
-
31 If_mixed / well_developed moderate,
-
32 Ventral_cardinal_area_palintrope / rudimentary reduced moderate extensive,
-
33 Orientation_of_ventral_dorsal_area / cata_apsacline apsacline apsa_orthocline orthocline ortho_anacline,
-
34 Dorsal_cardinal_area / rudimentary reduced extensive,
-
35 Orientation_of_dorsal_area / apsacline anacline orthocline,
-
36 Hingeline / strophic astrophic,
-
37 If_astrophic / almost_strophic clearly_astrophic,
-
38 Width_of_hingeline / short average_<_maxwidth_shell large_=_maxwidth_shell,
-
39 Pedicle_opening / unknown delthyrium foramen foramen_and_delthyrium,
-
40 If_delthyrium / open partially_covered fully_covered,
-
41 If_foramen / submesothyrid mesopermesothyrid epithyrid,
-
42 If_foramen_and_delthyrium / delthyrium_open partially_covered fully_covered,
-
43 If_foramen_and_delthyrium / foramen_submesothyrid mesopermesothyrid epithyrid permesothyrid
-
44 Pedicle_support / absent present,
-
45 If_pedicle_support / simple_pedicle_collar complex fulcrum deltidial_plate collar_fused_with_deltidial_plates,
-
46 Size_of_teeth / small medium large,
-
47 Dental_plates / absent present,
-
48 Dental_plates_type / indistinct distinct NA,
-
49 Dental_plate_thickness / thin moderate coarse,
-
50 Dental_plate_length / short average long,
-
51 If_long / extending_to_length_of_muscle_scars not_extending
-
52 Orientation_of_dental_plates / subparallel converge_dorsally diverge_dorsally concave,
-
53 Mystrochial_plates / absent present,
-
54 Ventral_shoelifter / absent present,
-
55 Position_of_ventral_shoelifter / between_dental_plates supporting_dental_plates,
-
56 Spondylium_ventral_valve / absent present,
-
57 Spondylium_supported_by / no_septum_sessile low_broad_septum septum_low_small septum_high,
-
58 Ventral_median_septum / absent present,
-
59 Ventral_median_septum_length / NA short long_supporting_spondylium_entire_length long_not_related_to_spondylium,
-
60 If_long_and_associated_with_spondylium / extends_anteriorly_beyond_spondylium does_not,
-
61 Ventral_muscle_field / deeply_impressed_on_valve moderately weakly,
-
62 Cardinal_platform / absent present,
-
63 If_present_as_cardinal_plate / disjunct_bifurcate apically_perforated not_perforated,
-
64 Cardinal_process / absent present,
-
65 Cardinal_process_type / NA rudimentary moderate highly_developed weak_notch,
-
66 Dorsal_myophragm / absent present,
-
67 Dorsal_median_septum / absent present,
-
68 Length_of_dorsal_median_septum / short long,
-
69 Height_of_dorsal_median_septum / moderate very_high,
-
70 Septalium_dorsal_valve / absent present,
-
71 If_septalium_present / shallow deep_and_narrow deep_and_wide,
-
72 Length_of_septalium / short long,
-
73 Septalium_type / no_support supported_by_median_septum sessile,
-
74 Plates_covering_septalium / absent present,
-
75 If_plates_covering_septalium / NA partially_covered fully_covered,
-
76 Cruralium / absent present,
-
77 Dorsal_shoelifter / absent present,
-
78 Brachidium / absent present_as_spiralium,
-
79 If_spiralia_apices_directed / laterally medially dorsally ventrally dorsomedially ventrolaterally,
-
80 Primary_lamella / extend_directly_from_crura curve_laterally_from_crura curve_posterodorsally_from_crura,
-
81 Jugum / absent present,
-
82 Jugum_type / NA present incomplete,
-
83 If_present_or_incomplete / located_dorsally ventrally_located,
-
84 Lateral_processes_of_jugum_begin_at / midlength_VD posterior_to_midlength anterior,
-
85 Lateral_processes_orientation / vertical anteriorly_inclined posteriorly near_parallel_to_commissural plane not_applicable,
-
86 Jugal_arch / acute rounded broad_concave,
-
87 Jugal_saddle / absent present,
-
88 Jugal_saddle_location / NA anterior posterior,
-
89 Jugal_stem / absent present,
-
90 Jugal_stem_length / NA short long,
-
91 Jugal_stem_orientation / vertical modinclined_posteriorly heavily_posterior horizontal anteriorly_inclined,
-
92 Jugal_bifurcation_arms / absent present,
-
93 Jugal_accessory_lamellae / absent present,
-
94 Jugal_accessory_lamellae_type / NA free turns_to_unite_with_shaft connected_to_branch_side_of_jugum attached_secondarily_to_spiralia,
-
95 Jugal_accessory_lamellae_if_free / short ending_in_vicinity_of_beginning_of_lateral_branches interspersing_with_main_cones_up_to_apex,
-
96 Structure_of_shell / impunctate punctate,
-
97 Prismatic_layer_tertiary / absent present,
-
98 Prismatic_layer / always_present sometimes_present,
Appendix 3
Matrix 2, plot of consistency indices per character (c.i. = 0.0 to 1.0), comparing two topologies: reweighted by the rescaled consistency index from the initial unweighted analysis (RWP) in blue, and fossilized birth death range process model (FBDRP MCC) with characters partitioned in orange.


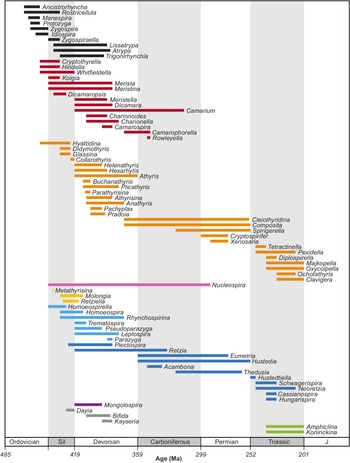
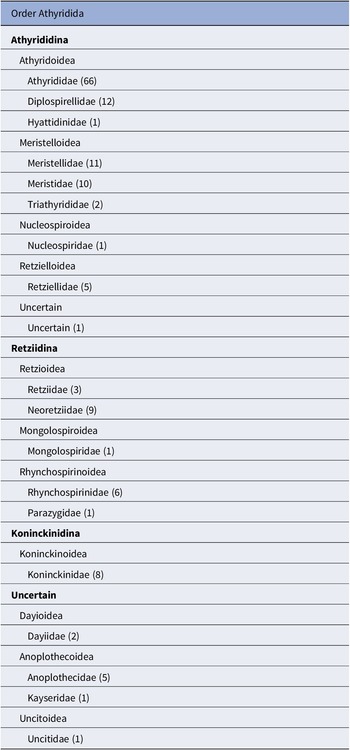
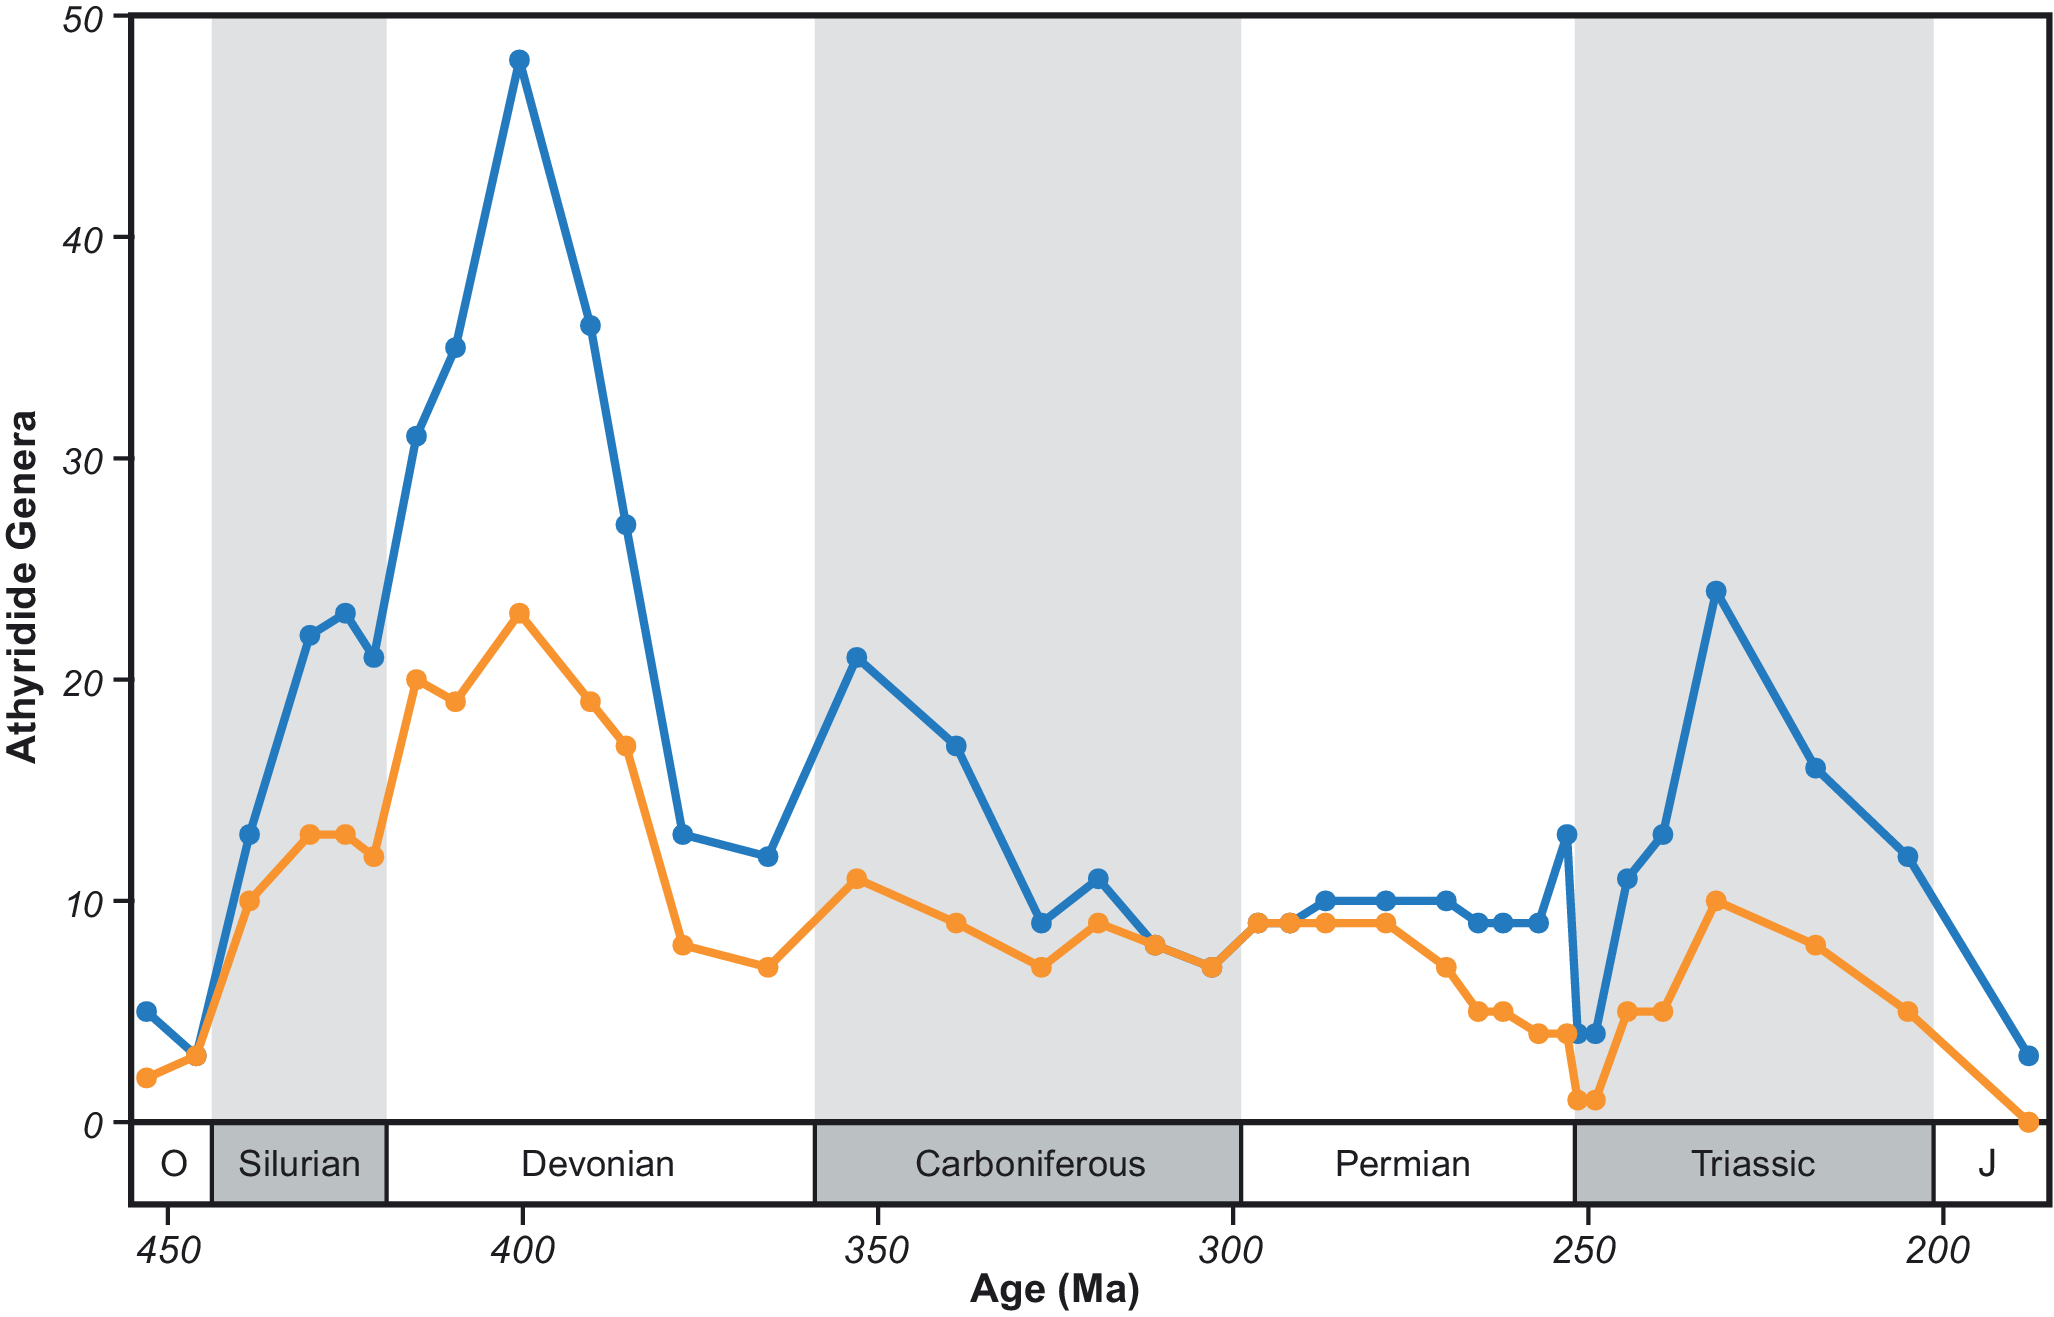
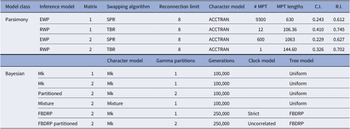
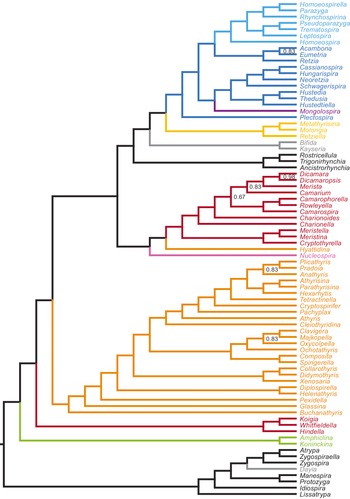
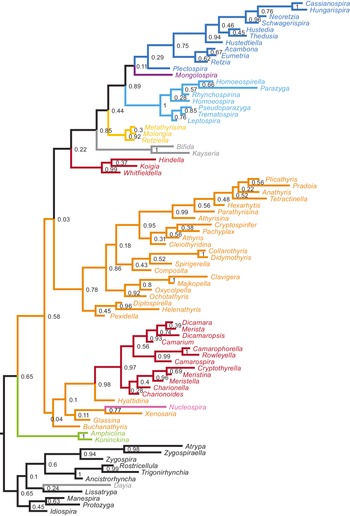
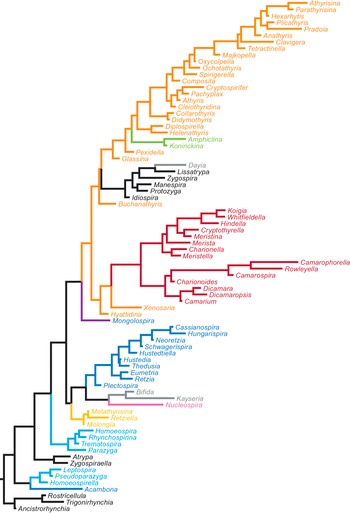


 Open access