


Introduction
As a consequence of increasing human populations and the resulting demand for agricultural land and pressure on natural resources, the ranges of most large carnivores have contracted substantially (Di Minin et al., Reference Di Minin, Slotow, Hunter, Montesino Pouzols, Toivonen and Verburg2016). Maintaining viable populations of large carnivores requires large connected habitat networks (Di Minin et al., Reference Di Minin, Slotow, Hunter, Montesino Pouzols, Toivonen and Verburg2016). However, such networks are often inhabited by people, who degrade carnivore habitat and persecute large carnivores because of actual or perceived livestock losses, confining them to isolated patches of land (Di Minin et al., Reference Di Minin, Slotow, Hunter, Montesino Pouzols, Toivonen and Verburg2016).
Translocation is regularly used to mitigate conflict, secure viability of isolated populations and reintroduce populations in former or new range (Linnell et al., Reference Linnell, Aanes and Swenson1997; Fischer & Lindenmayer, Reference Fischer and Lindenmayer2000). Success depends on the aim of the translocation, the source of the translocated individuals, the number of individuals released and the cause of the original decline (Fischer & Lindenmayer, Reference Fischer and Lindenmayer2000). Translocations generally fail to reduce human–carnivore conflict and it is now widely accepted that such negative interactions are best mitigated by promoting coexistence (Linnell et al., Reference Linnell, Aanes and Swenson1997; Fischer & Lindenmayer, Reference Fischer and Lindenmayer2000; Boast et al., Reference Boast, Chelysheva, van der Merwe, Schmidt- Küntzel, Walker, Cilliers, Boast and Schmidt-Küntzel2018a). However, translocations to establish or re-establish and augment populations of native, non-vulnerable, wildlife species seem more successful (Griffith et al., Reference Griffith, Scott, Carpenter and Reed1989). Translocation success increases when the source population is wild, the founder population is large (Griffith et al., Reference Griffith, Scott, Carpenter and Reed1989; Fischer & Lindenmayer, Reference Fischer and Lindenmayer2000) and the original cause of the population decline has been eliminated (Fischer & Lindenmayer, Reference Fischer and Lindenmayer2000). Although it is recognized that monitoring is crucial to improve the success of translocations (IUCN/SSC, 2013), there has been little follow-up of translocated animals to determine success (Linnell et al., Reference Linnell, Aanes and Swenson1997) and long-term evaluation of introduced or reintroduced populations is often lacking (Fischer & Lindenmayer, Reference Fischer and Lindenmayer2000).
The cheetah is a large carnivore species regularly translocated for conservation purposes (Boast et al., Reference Boast, Chelysheva, van der Merwe, Schmidt- Küntzel, Walker, Cilliers, Boast and Schmidt-Küntzel2018a). A relatively well-documented translocation is the 1993–1994 translocation of alleged problem cheetahs from commercial farmland into Matusadona National Park, Zimbabwe, an unfenced protected area without resident cheetahs (Zank, Reference Zank1995; Pitman, Reference Pitman2007). Although it was initially thought the introduced cheetah population would not be viable without intensive management (Zank, Reference Zank1995), it persisted without intervention and, with the establishment of a breeding population, the introduction was cautiously deemed a success (Purchase & Vhurumuku, Reference Purchase and Vhurumuku2005). Whether the translocation reduced human–cheetah conflict on commercial farmland is unknown (Purchase, Reference Purchase1998). In this study, we used citizen science, questionnaire-based information, camera-trap and spoor surveys to reassess the status of Matusadona's cheetah population and model current cheetah occupancy in relation to densities of competing carnivores and terrain elevation. Our follow-up highlights the importance of thorough planning and standardized long-term monitoring of translocated populations to understand the factors affecting translocation success and to improve future translocation programmes.
Study area and species
The 1,370 km2 unfenced Matusadona National Park, utilized for photographic safaris, lies in northern Zimbabwe on the shore of Lake Kariba. Depending on the lake level, the Park comprises a valley of c. 400 km2 and an escarpment of c. 1,000 km2 (Fig. 1). During 1993–1994, 21 alleged problem cheetahs were opportunistically removed from commercial farmland in southern Zimbabwe; six died shortly after capture, and 15 were kept in a captive enclosure (boma) for 6 weeks and then soft released into the Park, which held no resident cheetahs at the time (Zank, Reference Zank1995; Pitman, Reference Pitman2007). Although it was assumed cheetahs were once resident in Matusadona, there are no records to support this (Zank, Reference Zank1995) and it remains unknown whether cheetahs had become extinct or had never been present at all (Purchase, Reference Purchase1998). The introduced cheetahs utilized only the valley floor (Purchase, Reference Purchase1998), which has a grassland foreshore but largely consists of woodland with Colophospermum mopane, Combretum spp. and Terminalia spp. The escarpment is dominated by miombo woodland and is characterized by steep valleys with limited water availability in the dry season (Zank, Reference Zank1995; Purchase, Reference Purchase1998). The cheetah's competitors, lion Panthera leo, leopard Panthera pardus and spotted hyaena Crocuta crocuta, occur in the Park. For Matusadona's large carnivores, buffalo Syncerus caffer and impala Aepyceros melampus have historically been the most abundant prey species (Zank, Reference Zank1995; Purchase, Reference Purchase2004). The Park is bordered by the Sanyati and Ume rivers and surrounded by communal land used for subsistence farming and trophy hunting under the Communal Areas Management Programme for Indigenous Resources (CAMPFIRE; Fig. 1).
Matusadona National Park with positions of camera-trap stations and spoor survey transects for the cheetah Acinonyx jubatus, and the contours of the shoreline at high (487 m) and low (470 m) lake levels (shoreline contours from Purchase, Reference Purchase2004).

Methods
Data collection
As part of a nationwide survey (van der Meer, Reference van der Meer2018), we launched a citizen science programme (2012–present) to collect cheetah sightings and photographs from tourists, safari operators and others. In addition, we interviewed 49 respondents (August–September 2013) about cheetah presence in Matusadona and surrounding areas: 23 Zimbabwe Parks and Wildlife Management Authority rangers, seven CAMPFIRE rangers, six safari guides, five hunters and eight hunting scouts (van der Meer, Reference van der Meer2018). If respondents had seen cheetahs, we recorded sighting date and location, number of individuals, age, sex and size. We only included sightings from respondents who could identify the cheetah from carnivore pictures and clearly recalled sighting details. Some respondents provided photographs with their sightings. We also asked respondents about human–cheetah conflict and anthropogenic cheetah mortality, and checked reports at the Zimbabwe Parks and Wildlife Management Authority and CAMPFIRE offices for records of conflict and mortality.
During June–August 2016 we carried out a camera-trap survey using a pre-planned grid of 49 traps set up 4–5 km apart on the valley floor and part of the escarpment (Fig. 1). Each trap station consisted of two Cuddeback (Cuddeback, Wisconsin, USA) or Panthera V2 (Panthera, New York, USA) cameras, c. 6 m apart, facing each other but slightly offset, to limit interference from the flash. The cameras were attached to trees or metal standards c. 60 cm above ground level. Following establishment, the survey was run for 40 days, after which traps were removed within the same time frame and order in which they were deployed.
In June 2013 we drove three road transects on the valley floor (total length 59.8 km), and in July–August 2016 we drove four road transects on the valley floor (total length 68.2 km), all of which were driven three times in the early morning, on different days, and three of which repeated routes surveyed in 2013. Transects were driven at 10–20 km/h, with an experienced tracker on a seat mounted at the front of the vehicle. When large mammal spoor was located the vehicle stopped and spoor was identified and date, location (with a GPS) and the number of animals recorded. To avoid double counting, transects were never surveyed on consecutive days and we only recorded tracks < 24 hours old.
We consulted expert authorities and literature to gain insight into historical cheetah population trends in Matusadona and possible underlying causes of changes in cheetah numbers; e.g. fluctuations in lake levels, which affect the area of valley floor foreshore exposed and therefore prey and predator densities. After 2005 there have been no prey surveys other than aerial counts. Therefore to facilitate a comparison between studies we used dry season aerial count data with comparable transects as an indication of impala and buffalo densities. Although aerial counts have limited detection ability, they provide an indication of population trends (Dunham et al., Reference Dunham, Mackie, Nyaguse and Zhuwau2015). From 2005 lion and spotted hyaena densities were based on spoor surveys rather than on direct sightings or call-ups (playback recordings of vocalizations).
Analyses
From the photographs collected via sightings (n = 64, 38% with photographs) and the camera-trap survey (n = 9), we identified individual cheetahs based on coat markings (Zank, Reference Zank1995). Sightings of known individuals (n = 33) were used in a presence–absence model and to determine space use based on minimum convex polygons (MCPs). Although MCPs create unpredictable bias when sampling is not systematic, as with opportunistic sightings, (Börger et al., Reference Börger, Franconi, De Michele, Gantz, Meschi and Manica2006), we nevertheless decided to use this method, to facilitate comparison between studies.
Substrate and cheetah density in Matusadona were sufficient to use the calibration model of Winterbach et al. (Reference Winterbach, Ferreira, Funston and Somers2016), in which observed spoor density = 3.26 × carnivore density. In the absence of a species-specific equation based on a number of populations, this is the recommended calibration equation for the cheetah (Boast et al., Reference Boast, van Bommel, Andresen, Fabiano, Boast and Schmidt-Küntzel2018b). For each transect we calculated spoor density (individuals per 100 km). Mean spoor density, standard deviation and 95% confidence intervals were calculated across all transects driven. Based on these calculations we determined mean, minimum and maximum cheetah numbers for the valley floor.
For the camera-trap survey, the MCP encompassing all traps buffered by 5 km was gridded at 500 × 500 m resolution. This gridded habitat mask was used to extract the spatially explicit recapture modelled densities for sympatric carnivores and altitude (GLOBE Task Team, 1999). In addition, total numbers of cheetah sightings were calculated per grid cell by counting the presences (1) and absences (0) of identified individuals. Given the number of zeros in the data, a zero-inflated Poisson generalised additive model was applied to model the probability of occurrence of cheetahs in relation to altitude and densities of competing carnivore species using zipGAM in package mgcv in R 3.3.1 (Wood, Reference Wood2011; R Core Team, 2017).
Results
Population estimate, movement and range
Based on photographic identification, the cheetah population of Matusadona comprised three adult cheetahs: a female (first sighting September 2010, last sighting May 2014) and a coalition of two males (first sighting December 2009, last sighting May 2018). We did not receive photographs of other individuals, nor did sightings without photographs indicate the existence of additional cheetahs or breeding. The analyses of spoor survey data indicated a mean population size of 2–3 cheetahs (Supplementary Table 1). We only encountered spoor of adult cheetahs, on their own or in a group of two individuals. Cheetahs predominantly utilized the north-eastern part of the valley floor; they were not sighted on the escarpment or in the neighbouring communal lands. Home ranges overlapped by 63–66% (c. 46.4 km2) and were 70.5 km2 for the cheetah female and 74.3 km2 for the male coalition (Fig. 2), which is larger than the 11.3–53.8 km2 home ranges in 1998 (Purchase, Reference Purchase1998). The cheetah female was last seen in May 2014 and is presumed dead.
Home ranges of the three identified cheetahs in Matusadona National Park.

Factors affecting current occurrence
The presence–absence model indicated that terrain is the strongest explanatory variable for cheetah occurrence. Cheetah presence was restricted to below 800 m altitude (Fig. 3). Cheetah presence was also related to the occurrence of competitors: although spotted hyaena densities did not significantly influence cheetah presence, both lion and leopard densities did. As lion and leopard (> 0.2 individuals/100 km2) densities increased, the likelihood of cheetah occurrence decreased (Fig. 3; Supplementary Table 2, Supplementary Fig. 1). The model explained 93% of the deviance in cheetah presence/absence and, based on altitude and densities of competing predators, predicted cheetah occurrence to be higher along the foreshore of the valley floor (Fig. 4).
Estimated smooth functions (s) for the selected covariates (a) lion density; (b) leopard density; (c) altitude and (d) hyaena density, in the occurrence model for cheetahs in Matusadona National Park. The solid line is the estimated smooth function, shaded regions are the approximate 95% confidence intervals and on the y-axis is the smoothed function of the number of cheetah individuals and respective estimated degrees of freedom for the model terms. Cheetah numbers’ distribution is displayed as the rug plot (small lines) along the x-axis.

Fitted model predictions of the probability of cheetah occurrence based on the significant covariates in the model (altitude and densities of competing carnivores) for the whole of Matusadona National Park.

Population trends and mortality
Our estimate of the cheetah population from spoor surveys corresponded well with the estimate from sightings, but in the study of Purchase & Vhurumuku (Reference Purchase and Vhurumuku2005) the estimate based on spoor density was substantially higher than the estimate based on sightings. To facilitate comparison we therefore only present estimates based on sightings. During 1995–2005 Matusadona's cheetah population reproduced and remained relatively stable at a mean of 13.6 ± SE 1.2 individuals (Table 1). However, the proportion of subadult cheetahs increased, indicating lower juvenile mortality but possible higher adult mortality (Table 1). Data on survival rates of cubs and adults are scarce: in 1998 mean litter size was 2.8 cubs (n = 8) and cub survival at 3–24 months was 60% (Purchase, Reference Purchase1998). In this same study, it was confirmed that two cheetahs of the founder population were still alive. Matusadona is surrounded by communal land and opportunities for cheetahs to disperse are limited (Zank, Reference Zank1995). Although human–cheetah conflict in the communal land surrounding Matusadona has historically been minimal (one report in 1998; Purchase & Vhurumuku, Reference Purchase and Vhurumuku2005), cheetahs ranging into this communal land have suffered from anthropogenic mortality (Zank, Reference Zank1995). We did not record any cases of human–cheetah conflict or reports of anthropogenic mortality.
Overview of the historical and current size and demography of Matusadona's introduced cheetah Acinonyx jubatus population.

1 Zank (Reference Zank1995).
2 Purchase (Reference Purchase1998); 28 citizen science sightings (12 identified cheetahs, 5 non-identified cheetahs).
3 Purchase & Vhurumuku (Reference Purchase and Vhurumuku2005); 34 citizen science sightings in 1999 and 22 citizen science sightings in 2000 (some identified cheetahs, some non-identified cheetahs); 27 citizen science sightings during April 2004–April 2005.
4 Present study: 33 camera-trap and citizen science sightings accompanied by photographs (identified cheetahs).
Ecological factors affecting population trends
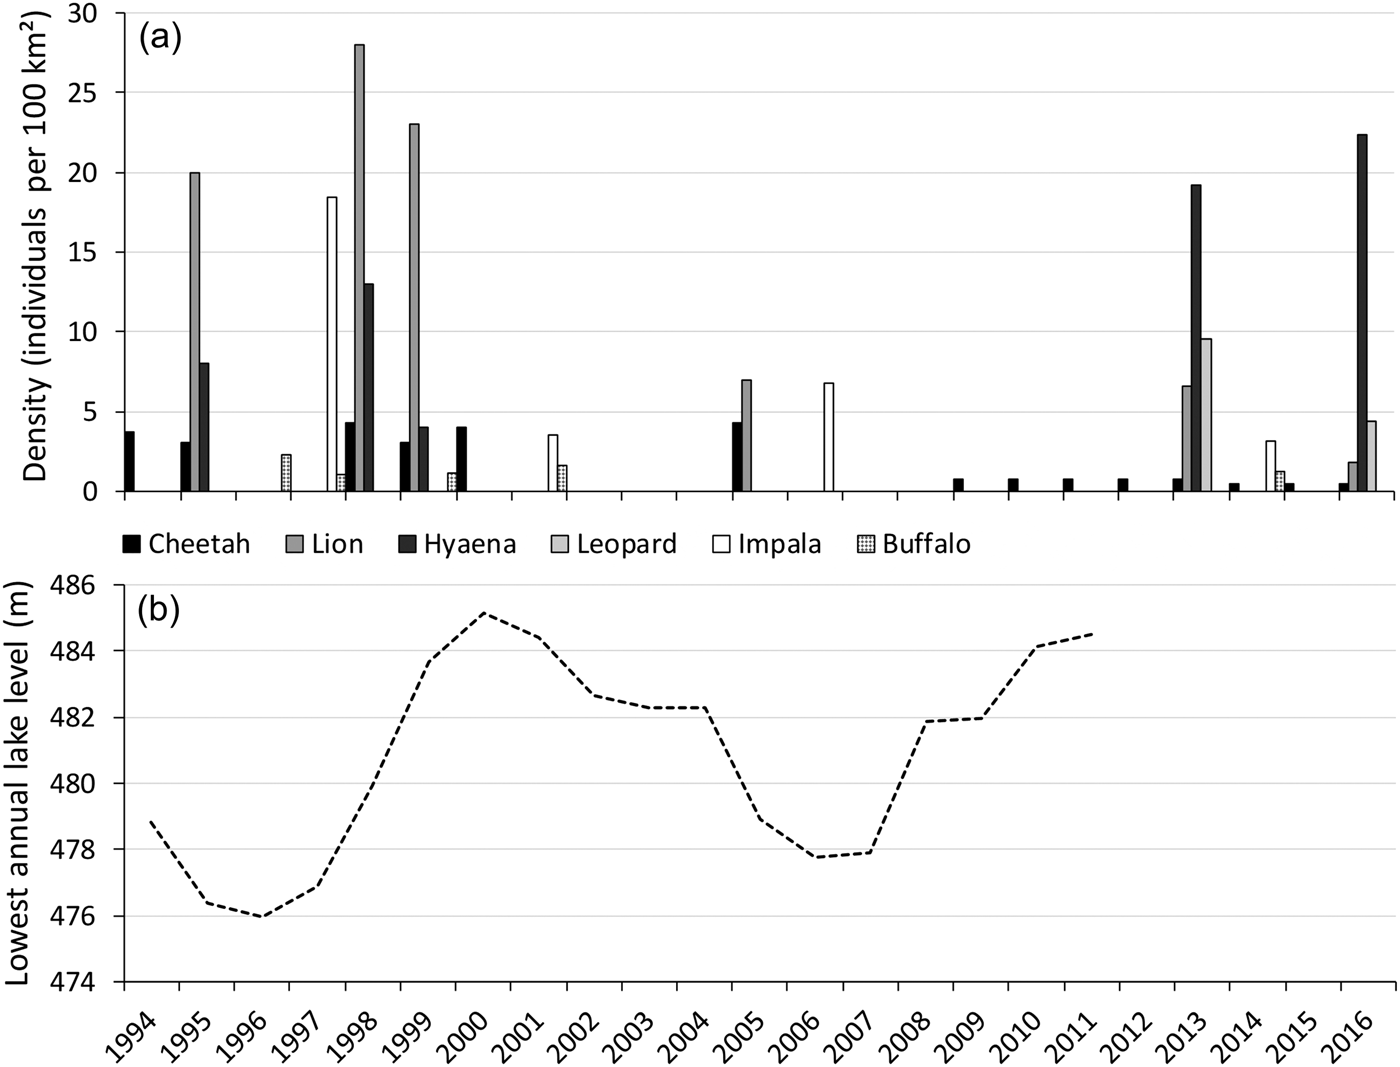
Shortly after the cheetah introduction, the lake level increased, with a peak in 2000 and high levels until 2004 (Fig. 5), decreasing the area of foreshore exposed. Aerial surveys suggest this negatively affected the impala population, but this did not seem to impact the cheetah population. Within this period the cheetah population fared well, which was attributed to a decline in lion numbers (Purchase & Vhurumuku, Reference Purchase and Vhurumuku2005). However, despite lion numbers remaining low (Fig. 5), during 2005–2009 the cheetah population decreased dramatically (Table 1). Within this period the lake level decreased, reaching its lowest point in 2006 (Fig. 5), exposing a larger area of foreshore, which coincided with high impala numbers (Fig. 5). Disease-related mortality of wild cheetahs is minimal, but cheetahs are susceptible to anthrax (Terio et al., Reference Terio, Mitchell, Walzer, Schmidt-Küntzel, Marker, Citino, Boast and Schmidt-Küntzel2018). Since 2005 there have been no records of anthrax outbreaks (Department of Livestock and Veterinary Services, pers. comm.), nor did we come across records of sudden simultaneous die-offs of cheetahs or other carnivores in Matusadona.
(a) Densities of the cheetah (based on the total number of cheetahs), lion Panthera leo, spotted hyaena Crocuta crocuta, leopard Panthera pardus, impala Aepyceros melampus and buffalo Syncerus caffer on the valley floor of Matusadona National Park, from 1994 to 2016, and (b) lowest annual level of Lake Kariba, from 1994 to 2011. Data sources: Zank (Reference Zank1995); Mackie (Reference Mackie1997); Mackie (Reference Mackie1998); Purchase (Reference Purchase1998); Mackie (Reference Mackie2002); Purchase & Vhurumuku (Reference Purchase and Vhurumuku2005); Purchase (Reference Purchase2004); Dunham et al. (Reference Dunham, Mackie, Musemburi, Chipesi, Chiwishe and Taylor2006, Reference Dunham, Mackie, Nyaguse and Zhuwau2015); A.J. Loveridge (unpubl. data); Zambezi River Authority (unpubl. data).
Discussion
Based on our survey and recent citizen science sightings, the Matusadona cheetah population currently comprises a coalition of two male cheetahs. This population is considered isolated (see also Zank, Reference Zank1995; Purchase, Reference Purchase1998) and, with only two males > 9 years old remaining, is functionally extirpated. The reasons for the drastic decline of this cheetah population remain unclear. Aerial surveys suggest that a reduction in productive habitat as a result of high lake levels negatively affected prey availability, which may have resulted in a decrease in cheetah numbers. However, prey estimates based on road transects and block counts do not support this hypothesis (Purchase & Vhurumuku, Reference Purchase and Vhurumuku2005). Post-release population viability analyses showed a viable cheetah population could be established if cub mortality was ≤ 60% (Zank, Reference Zank1995). It was initially expected that cub mortality would be higher (95%) and that intensive metapopulation management would be necessary to maintain the population, but later studies showed cub mortality was 60% and the population would be viable at a carrying capacity of ≥ 25 cheetahs (Purchase, Reference Purchase1998).
Whether Matusadona could ever sustain this number of cheetahs is questionable. Cheetahs select home ranges based on prey availability and vegetation characteristics, and within these home ranges they preferably utilize open savannah habitat (Caro, Reference Caro1994; Broomhall et al., Reference Broomhall, Mills and du Toit2003). Matusadona's cheetahs only utilized the flat valley floor, within which they made extensive use of a small core area of open habitat along the north-eastern lake shore. Regardless of lake level, this area has the largest foreshore (Fig. 1; Purchase & Vhurumuku, Reference Purchase and Vhurumuku2005), highest impala density (Zank, Reference Zank1995; Dunham et al., Reference Dunham, Mackie, Musemburi, Chipesi, Chiwishe and Taylor2006, Reference Dunham, Mackie, Nyaguse and Zhuwau2015) and optimal habitat to hunt and rest (Purchase, Reference Purchase1998). Although cheetah females tolerate each other, males actively defend territories (Caro, Reference Caro1994). Even though the territories of Matusadona's male cheetahs overlapped considerably (Zank, Reference Zank1995; Purchase, Reference Purchase1998), territorial behaviour in combination with limited availability of preferred habitat is likely to restrict the number of cheetahs that can successfully utilize the 400 km2 valley floor (see also Purchase, Reference Purchase1998). This limits the carrying capacity of the Park which, based on historical sighting-based population sizes, is likely to be < 25 cheetahs.
Intraspecific competition with larger carnivores affects cheetah densities (Lindsey et al., Reference Lindsey, Tambling, Brummer, Davies-Mostert, Hayward and Marnewick2011) and, apart from the availability of optimal habitat and prey, impacts cheetah occurrence on the valley floor. Our presence–absence model showed no significant effect of spotted hyaena densities but a negative relationship with lion and leopard densities. Despite signs of leopard predation of cheetahs (Purchase, Reference Purchase1998), previous studies in Matusadona focused on competition with lions and spotted hyaenas; the potential impact of leopards was not taken into account. Although lions and spotted hyaenas are considered the main competitors of cheetahs (Caro, Reference Caro1994), leopards have considerable dietary overlap with cheetahs (Lindsey et al., Reference Lindsey, Tambling, Brummer, Davies-Mostert, Hayward and Marnewick2011) and cause cheetah mortality (Caro, Reference Caro1994; Broekhuis, Reference Broekhuis2015). Consequently, cheetahs actively avoid interactions with leopards (Vanak et al., Reference Vanak, Fortin, Thaker, Ogden, Owen and Greatwood2013) and the presence of leopards increases the cheetah's space requirements (Lindsey et al., Reference Lindsey, Tambling, Brummer, Davies-Mostert, Hayward and Marnewick2011).
For free-ranging mammal populations in which individuals mature late and have few offspring per year, adult and juvenile survival rates contribute more to population growth than fecundity (Heppell et al., Reference Heppell, Caswell and Crowder2000). Although Matusadona's 20.5% adult and subadult mortality rate was considered low (Purchase, Reference Purchase1998), the mortality rate of dispersers is likely to be considerably higher. Cheetahs that moved into neighbouring communal land were not resighted (Zank, Reference Zank1995) and there are no indications that Matusadona's cheetahs colonized nearby wildlife areas or connected to other resident cheetah populations (van der Meer, Reference van der Meer2018). Since the release, human population density (ZPWMA, 2015) and numbers of livestock in the region have increased, and numbers of wild prey decreased (Dunham et al., Reference Dunham, Mackie, Nyaguse and Zhuwau2015), thereby further reducing dispersal potential for cheetahs (Winterbach et al., Reference Winterbach, Winterbach, Boast, Klein and Somers2015). As suggested by Purchase (Reference Purchase1998), the viability of Matusadona's cheetah population is likely to have been impaired by high mortality rates of subadults, which were forced to disperse into suboptimal habitat by already established cheetahs.
The Matusadona cheetah introduction was based on assumptions rather than a feasibility study to assess whether the cheetah's ecological needs could be fulfilled (Zank, Reference Zank1995; Pitman, Reference Pitman2007). Twenty-one cheetahs were captured opportunistically without considering factors such as relatedness and ideal age and sex-ratio for introduction (IUCN/SSC, 1987). In addition, this number of removals and translocations was unlikely to significantly reduce human–cheetah conflict at the capture site (Purchase, Reference Purchase1998) nor was it sufficient to establish a viable population at the release site (Zank, Reference Zank1995). If international guidelines had been followed (IUCN/SSC, 1987), the translocation should not have proceeded, especially as without any attempt to identify and mitigate factors causing low cheetah densities inside protected areas and declining cheetah numbers outside protected areas, the translocation was unlikely to significantly contribute to cheetah conservation in Zimbabwe (Zank, Reference Zank1995).
Long-term protocols in which key parameters are monitored at previously specified time intervals are crucial to understand the factors affecting translocation success and improve future translocations (Fischer & Lindenmayer, Reference Fischer and Lindenmayer2000; IUCN/SSC, 2013). Compared to other translocated populations (Boast et al., Reference Boast, Chelysheva, van der Merwe, Schmidt- Küntzel, Walker, Cilliers, Boast and Schmidt-Küntzel2018a), the Matusadona cheetah population is relatively well studied but, nevertheless, a lack of standardized long-term monitoring prevents us from determining the exact causes of the population's extirpation. Translocation success largely depends on habitat quality and quantity at the release site and, in the case of translocations in unfenced environments, the surrounding areas (Griffith et al., Reference Griffith, Scott, Carpenter and Reed1989; Fischer & Lindenmayer, Reference Fischer and Lindenmayer2000; Boast et al., Reference Boast, Chelysheva, van der Merwe, Schmidt- Küntzel, Walker, Cilliers, Boast and Schmidt-Küntzel2018a). Although the Matusadona cheetah population persisted for over a decade, the limited availability of optimal cheetah habitat in combination with interspecific competition and minimal dispersal abilities appear to make the area unsuitable to harbour a viable cheetah population. Unless the exact causes for the extirpation of Matusadona's cheetah population can be clearly understood and properly addressed, further reintroductions (IUCN/SSC, 2013) of cheetahs into the area are not advisable.
Acknowledgement
The Zimbabwe Research Council, Zimbabwe Parks and Wildlife Management Authority and the Ministry of Local Government, Urban and Rural Development provided the necessary permits. We thank H. Dullemont, H. Ndlovu, J. Seymour-Smith and the Zambezi Society for assisting with the fieldwork, the respondents, citizen scientists, the Zambezi River Authority and the Department of Livestock and Veterinary Services for providing sightings and information, and two anonymous reviewers for their critiques. This work was supported by grants from Columbus Zoo and Aquarium, INNO Fund, National Geographic's Big Cats Initiative, Panthera, Stichting SPOTS, Stichting Wildlife, The Rufford Foundation, Van Tienhoven Foundation, Wilderness Wildlife Trust, Darwin Initiative for Biodiversity, the Robertson Foundation and the Zambezi Society.
Author contributions
Data collection and analysis, writing: EvdM, with input from LLS, AJL; presence–absence modelling: LLS; coordination of spoor and camera-trap surveys, data analyses: AJL.
Conflict of interest
None.
Ethical standards
This research abided by the Oryx guidelines on ethical standards. No animal experiments or handling were undertaken. Clearance for the questionnaire survey was provided by the Zimbabwe Research Council, the Zimbabwe Parks and Wildlife Management Authority and the Ministry of Local Government, Urban and Rural Development under permit numbers 01392, 23(1) (c) (ll) 21/2013, ADM/23/8.


 Open access