


Social competence is a key aspect of children’s development. It involves initiating, building, and sustaining meaningful relationships with others (Rubin & Rose-Krasnor, Reference Rubin, Rose-Krasnor, van Hasselt and Hersen1992). The development of social competence begins in early life, continues throughout childhood and adolescence (Huber et al., Reference Huber, Plötner and Schmitz2019; Padilla-Walker et al., Reference Padilla-Walker, Memmott-Elison and Coyne2018), and is critical to child and adolescent adaptive functioning (Jones et al., Reference Jones, Greenberg and Crowley2015). Those who are socially competent are capable of interacting effectively with their environment in a manner that satisfies their own needs and goals without interfering with the needs and goals of others. Social competence is therefore an important topic of scientific inquiry.
Social competence generally includes two facets: the presence of adaptive features, often conceptualized and operationalized as prosocial behavior, i.e., voluntary behavior intended to benefit others, (Eisenberg et al., Reference Eisenberg, Spinrad, Knafo-Noam, Lamb and Lerner2015), and the absence of multidimensional psychopathology, i.e., emotional, peer, conduct, and hyperactivity and inattention problems (Huber et al., Reference Huber, Plötner and Schmitz2019). These facets of social competence are regarded as interconnected. Specifically, earlier prosocial behavior is negatively associated with later psychopathology (Memmott-Elison, Holmgren, et al., Reference Memmott-Elison, Holmgren, Padilla-Walker and Hawkins2020; Padilla-Walker et al., Reference Padilla-Walker, Carlo and Nielson2015) and earlier psychopathological experiences are negatively associated with later engagement in prosocial behavior (Haselager et al., Reference Haselager, Cillessen, Van Lieshout, Riksen-Walraven and Hartup2002; Hay et al., Reference Hay, Hudson and Liang2010). Despite this general understanding, questions remain regarding whether engagement in prosocial behavior reduces multidimensional psychopathology or multidimensional psychopathology reduces prosocial behavior at an interindividual, between-person level, or whether individuals who are more prosocial tend to experience fewer psychopathological symptoms at an intraindividual, within-person level. Additionally, research is needed to determine the strength and consistency of relations between prosocial behavior and multidimensional psychopathology from early childhood through adolescence, to map the long-term longitudinal development of social competence. In order to strengthen the literature and advance the field, inform future intervention work, and provide needed information to parents, teachers, and other individuals involved with children and adolescents, the current study sought to address these gaps by exploring long-term longitudinal, possibly bidirectional, inter- and intraindividual associations between prosocial behavior and multidimensional psychopathology.
Prosocial behavior
Prosocial behaviors are diverse. They can include donating, sharing, caring, providing emotional support, providing physical help, and fostering harmonious relationships with others (Padilla-Walker & Carlo, Reference Padilla-Walker and Carlo2015). Engaging in prosocial behaviors necessitates a number of psychological and social processes. For example, being prosocial requires the ability to recognize that someone else is experiencing difficulties, the capacity to determine what is causing the difficulties and if one is capable of helping, and the motivation to help (Dunfield, Reference Dunfield2014). Therefore, engagement in prosocial behavior is considered as an indicator of social competence during childhood and adolescence because it is an effective strategy for forming, strengthening, and repairing relationships with others.
Psychopathology
Psychopathology is characterized by deficits or disturbances in mental, physical, emotional, and social well-being (Achenbach, Reference Achenbach, Blaney, Krueger and Millon2015). An underlying general psychopathology factor reflects common features among mental health disorders during childhood and adolescence (Patalay et al., Reference Patalay, Fonagy, Deighton, Belsky, Vostanis and Wolpert2018). Though distinct, these features occur across a range of different types of mental health disorders. The four features of psychopathology most commonly studied include emotional, peer, conduct, and hyperactivity and inattention problems. Emotional problems might include anxiety and somatic symptomology. Peer problems often manifest as having few or no friends, feeling lonely, and or experiencing peer rejection. Such problems can be thought of as nonspecific features of psychopathology as they are likely to occur across a number of different mental health disorders. Disruptive behavior and engagement in physical aggression, as well as delinquent actions, are considered conduct problems. Hyperactivity and inattention problems include difficulty regulating one’s self in in-the-moment contexts, resulting in impulsive or inappropriate behavior (Goodman, Reference Goodman1997). Therefore, a transdiagnostic symptom-based approach allows for an investigation of how specific features of psychopathology affect functioning.
Developmental relevance of prosocial behavior and psychopathology
Significant neurocognitive advancements, physical growth, and social and emotional development occur across childhood and adolescence, marking these as formative years that set the stage for adulthood. As a result, the development of children’s and adolescents’ social competence is malleable and directly influences their long-term trajectories. There is considerable individual diversity in engagement in prosocial behavior (Toseeb & St Clair, Reference Toseeb and St Clair2020) and in the manifestation of multidimensional psychopathology in childhood and adolescence. That being said, prosocial behavior is generally early emerging (i.e., as early as 12 months; Brownell, Reference Brownell2013), increases across childhood, and follows increasingly diverse trajectories during adolescence and beyond (e.g., might increase, decrease, or remain stable; Nantel-Vivier et al., Reference Nantel-Vivier, Kokko, Caprara, Pastorelli, Gerbino, Paciello, Cote, Pihl, Vitaro and Tremblay2009; Padilla-Walker et al. Reference Padilla-Walker, Carlo, Christensen and Yorgason2012, Reference Padilla-Walker, Memmott-Elison and Coyne2018). Further, half of all diagnosable mental health disorders are onset before age 14 years (Kessler et al., Reference Kessler, Berglund, Demler, Jin, Merikangas and Walters2005), and behavioral and social problems often emerge during this same period. From childhood through adolescence, internalizing symptoms increase and externalizing problems decrease (Wong et al., Reference Wong, Francesconi and Flouri2021). It is important to understand the long-term relations between prosocial behavior and multidimensional psychopathology because these relations are not currently clear, prosocial behavior and psychopathology are present and relevant throughout childhood and adolescence, could change across these periods given developmentally normative transitions, and both have long-term implications for health and well-being. Therefore, the first Research Goal of this study was to map long-term relations between prosocial behavior and multidimensional psychopathology.
The developmental cascades framework
Understanding the complex interplay between individual features of development that contribute to children’s and adolescents’ social competence is rooted in, and has implications for, psychological theory. The developmental cascades framework suggests that aggregate lived experiences, including bidirectional associations between individual developmental features (e.g., prosocial behavior, psychopathology), exist and have cumulative and identifiable consequences on individuals’ long-term adjustment (Masten & Cicchetti, Reference Masten and Cicchetti2010). In other words, individual developmental features, such as the tendency to engage in prosocial behavior or to experience psychopathological symptoms, hypothetically “cascade” or spill-over into other individual developmental features as time progresses. Developmental cascades of individual developmental features occur as a function of automatic interindividual processes. The second Research Goal of this study was to explore bidirectional associations between prosocial behavior and multidimensional psychopathology.
Negative developmental cascades
There is long-standing interest among the research community regarding negative developmental cascades. This includes the contribution of negative or maladaptive individual features to the development of further maladjustment (e.g., increased problematic outcomes, decreased positive adjustment). For example, externalizing problems are commonly associated with prosocial behavior deficits in typical and atypical populations (Jambon et al., Reference Jambon, Madigan, Plamondon and Jenkins2019; Obsuth et al., Reference Obsuth, Eisner, Malti and Ribeaud2015; Toseeb et al., Reference Toseeb, McChesney, Oldfield and Wolke2020; Toseeb & St Clair, Reference Toseeb and St Clair2020). In fact, the majority of children and adolescents (10–12 years; 14 years) do not experience high levels of both prosocial behavior and psychopathology (Berger et al., Reference Berger, Batanova and Cance2015; Hawley, Reference Hawley2003). It could be that those who experience psychopathology create maladaptive emotional and behavioral patterns that do not align with positive behaviors, such as prosocial behavior (Jessor, Reference Jessor1987). Alternatively, children and adolescents who demonstrate increasing psychopathological symptoms gradually become less socially competent and may be unable or unwilling to engage in the prosocial behaviors necessary to initiate and maintain relationships with others (Haselager et al., Reference Haselager, Cillessen, Van Lieshout, Riksen-Walraven and Hartup2002; Huber et al., Reference Huber, Plötner and Schmitz2019; Oh et al., Reference Oh, Rubin, Bowker, Booth-LaForce, Rose-Krasnor and Laursen2008). Therefore, children and adolescents who experience emotional, peer, conduct, and or hyperactivity and inattention problems may come to view themselves as pathological beings who are unable to be prosocial (Caprara et al., Reference Caprara, Barbaranelli and Pastorelli2001). Taken together, negative cascades from psychopathology to prosocial behavior during childhood and adolescence are well-documented (though may depend on the specific dimension of psychopathology being investigated, which we discuss later).
Positive developmental cascades
Empirical work investigating positive developmental cascades during childhood and adolescence is becoming more common. That is, there is an increasing interest in whether adaptive individual features, such as the tendency to engage in prosocial behavior, promote adjustment and/or reduce the development of multidimensional psychopathology (Memmott-Elison, Holmgren, et al., Reference Memmott-Elison, Holmgren, Padilla-Walker and Hawkins2020; Padilla-Walker et al., Reference Padilla-Walker, Memmott-Elison and Coyne2018; Wang & Saudino, Reference Wang and Saudino2015). Such investigations are rooted in the increasingly popular strengths-based approach, which suggests that all youth have individual, adaptive characteristics that can be leveraged within their social contexts to enable healthy development over time (Lerner et al., Reference Lerner, Phelps, Forman and Bowers2009; Zimmerman, Reference Zimmerman2013).
There are several reasons why prosocial behaviors might initiate positive developmental cascades that are incompatible with psychopathology. First, engaging in prosocial behavior may help young people effectively cope with stress and regulate negative thoughts and behaviors, which reduces the likelihood of psychopathology developing (Memmott-Elison, Yu, et al., Reference Memmott-Elison, Yu, Maiva, Dicus and Carlo2020; Padilla-Walker et al., Reference Padilla-Walker, Carlo and Nielson2015). Second, acting prosocially might strengthen friendships and support networks with prosocial individuals, which are known to reduce subsequent depressive symptoms (van Harmelen et al., Reference van Harmelen, Kievit, Ioannidis, Neufeld, Jones, Bullmore, Dolan, Fonagy and Goodyer2017). Third, engagement in prosocial behavior may be indicative of the presence of moral reasoning and the associated development of prosocial self-perceptions during childhood and adolescence, which both counter externalizing problems (von Grundherr et al., Reference von Grundherr, Geisler, Stoiber and Schäfer2017). Therefore, evidence is being established regarding the presence of positive developmental cascades from prosocial behavior to multidimensional psychopathology in childhood and adolescence.
Potential bidirectional associations between prosocial behavior and psychopathology
Consistent with the ideas of negative and positive developmental cascades, many empirical investigations investigate unidirectional associations between prosocial behavior and various dimensions of psychopathology (e.g., Haselager et al., Reference Haselager, Cillessen, Van Lieshout, Riksen-Walraven and Hartup2002; Hay et al., Reference Hay, Hudson and Liang2010; Memmott-Elison et al., Reference Memmott-Elison, Holmgren, Padilla-Walker and Hawkins2020; Padilla-Walker et al., Reference Padilla-Walker, Carlo and Nielson2015). However, only a paucity of studies test the fullness of the developmental cascades framework by examining bidirectional relations between individuals’ prosocial behavior and psychopathology. These suggest that small-to-moderate bidirectional relations between these constructs exist. However, each of these bidirectional investigations are limited in terms of sample size and representativeness (Burt et al., Reference Burt, Obradović, Long and Masten2008), developmental scope (i.e., focuses on development during adolescence only, Padilla-Walker et al., Reference Padilla-Walker, Memmott-Elison and Coyne2018), the implementation of short-term longitudinal designs (Zimmer-Gembeck et al., Reference Zimmer-Gembeck, Geiger and Crick2005), a focus on a single aspect of psychopathology (Obsuth et al., Reference Obsuth, Eisner, Malti and Ribeaud2015), or a combination of these.
Moreover, bidirectional investigations are limited because they do not sufficiently distinguish between interindividual and intraindividual variability. Practically, this means results do not clearly explain whether (a) individuals who are more prosocial are less likely to experience psychopathological symptoms (or vice versa), or whether (b) engaging in prosocial behavior at earlier time points reduces psychopathology at later time points (or vice versa). This is problematic because prosocial behavior and psychopathology are considered combinations of stable traits and dynamic states, meaning they may be related, perhaps differentially, at inter- and intraindividual levels. Not distinguishing between the two may lead to interpretive errors (Hamaker et al., Reference Hamaker, Kuiper and Grasman2015) and/or misguided applied approaches. Distinguishing between inter- and intraindividual effects, which is the third Research Goal of this study, will allow for a fuller understanding of the development of social competence from early childhood through mid-adolescence, and which components may be amenable to intervention.
Therefore, empirical work is needed to explain inter- and intraindividual, possibly bidirectional, long-term longitudinal relations among prosocial behavior and multidimensional psychopathology using large, representative samples. The current study directly addresses each of these needs.
Expected nuances in relations between prosocial behavior and psychopathology
It is commonplace for researchers to investigate relations between prosocial behavior and unidimensional psychopathology, rather than exploring multiple components of psychopathology. This may be problematic because the strength of relations between prosocial behavior and psychopathology may differ depending on the dimension(s) of psychopathology under investigation, perhaps due to varying underlying mechanisms (e.g., peer rejection for externalizing problems; social isolation for internalizing symptoms). For example, in a recent meta-analysis by Memmott-Elison, Yu, et al. (Reference Memmott-Elison, Yu, Maiva, Dicus and Carlo2020), the effect sizes representing relations between prosocial behavior and externalizing problems such as aggression and delinquency were the strongest (r+ = −.23), followed by risky sexual behavior (r+ = −.15), deviant peer association (r+ = −.12), and substance use (r+ = −.11). Prosocial behavior was less strongly negatively associated with internalizing problems such as depression (r+ = −.10) and emotional problems (r+ = −.07), and was not significantly related to anxiety. More broadly, prosocial behavior appears to be more strongly negatively associated with externalizing problems than internalizing problems (e.g., Berger et al., Reference Berger, Batanova and Cance2015; Haselager et al., Reference Haselager, Cillessen, Van Lieshout, Riksen-Walraven and Hartup2002; Hay et al., Reference Hay, Hudson and Liang2010; Huber et al., Reference Huber, Plötner and Schmitz2019). Specific inter- and intraindividual relations between prosocial behavior and emotional problems, peer problems, conduct problems, and hyperactivity and inattention problems, respectively, have yet to be examined. The current study will provide this information to the field preliminarily, providing future opportunities for replication studies and more advanced investigations.
Additional considerations
Several demographic characteristics of young people and their families may be related to engagement in prosocial behavior and risk for psychopathology. Generally girls and females engage in more prosocial behavior (Xiao et al., Reference Xiao, Hashi, Korous and Eisenberg2019) and may experience emotional problems like anxiety and depression (Alloy et al., Reference Alloy, Hamilton, Hamlat and Abramson2016) more frequently and intensely than boys and males. Boys and males are disproportionately more likely than girls and females to experience peer, conduct, and hyperactivity and inattention problems (Murray et al., Reference Murray, Booth, Eisner, Auyeung, Murray and Ribeaud2019; Newsome et al., Reference Newsome, Vaske, Gehring and Boisvert2016). Ethnoracial background may also relate to children’s and adolescents’ prosocial behavior and psychopathology due to differing prevalence and acceptance of these behaviors within each ethnoracial-cultural group, though current research does not provide clear expectations in this regard (Hall et al., Reference Hall, Bansal and Lopez1999; Spivak et al., Reference Spivak, White, Juvonen and Graham2015). Parent characteristics are associated with prosocial behavior and psychopathology. Children and adolescents from households where mothers earn higher levels of education tend to demonstrate healthier socioemotional outcomes than those with less educated mothers (Amone-P’Olak et al., Reference Amone-P'Olak, Burger, Huisman, Oldehinkel and Ormel2011; Augustine, Reference Augustine2014). Additionally, maternal depression is a consistent negative correlate of youths’ prosocial behavior (Koutra et al., Reference Koutra, Roumeliotaki, Kyriklaki, Kampouri, Sarri, Vassilaki, Bitsios, Kogevinas and Chatzi2017) and a consistent positive correlate of youths’ emotional, peer, conduct, and or hyperactivity and inattention problems (Priel et al., Reference Priel, Djalovski, Zagoory-Sharon and Feldman2019). Taken together, young people’s gender and ethnoracial background, and parental education and depression were included as covariates.
The current study and hypotheses
Informed by past research and with the purpose of strengthening the literature, the purpose of the current investigation was to map long-term longitudinal (Research Goal 1), possibly bidirectional (Research Goal 2), intra- and interindividual associations (Research Goal 3) between prosocial behavior and multidimensional psychopathology (emotional problems, peer problems, conduct problems, and hyperactivity and inattention problems) from early childhood through adolescence (i.e., from age 3 to 14 years). Two primary hypotheses were generated that align with these Research Goals. In terms of intraindividual associations, we expected that prosocial behavior and each dimension of psychopathology would be negatively bidirectionally associated over time (Hypothesis 1). Regarding interindividual effects, we expected moderate stability in the negative association between prosocial behavior and each dimension of psychopathology (Hypothesis 2).
Method
Participants
Child and adolescent participants for the current analysis (N = 16,984, 51% male) were taken from the MCS. As is typical of studies that use data from the MCS, families with multiple children in the study were excluded from analyses (<.5% of the overall sample). Participants with missing data on primary study variables across time points were also excluded. That is, participants for whom prosocial behavior and psychopathology data were missing at all time points were excluded. Those for whom data were available during at least one time point were retained. Participants were drawn from all nations of the UK (64% from England, 10% from Northern Ireland, 12% from Scotland, and 14% from Wales). At the initial wave of data collection (when the child was 9 months old), a number of socio-demographic measures were taken. Nineteen percent of mothers in the current study sample reported no educational qualification, 45% reported earning their Graduate Certificate of Secondary Education (GCSE) Level, 19% reported earning their Advanced (A-) Level, 13% earned their Degree Level (which is equivalent to a Bachelor’s degree in the United States), and 3% earned a Higher Degree (i.e., Master’s or Doctorate). The majority of the sample (64%) belonged to a household with an income above the UK 60% median income and the remaining minority (26%) had a household of lower than UK 60% median. Additionally, 83% of the sample was White, while the remaining 17% was South Asian (9%), Black (4%), Mixed (3%), or “Other” (1%). Eighty-three percent of the sample came from two-parent households, while 17% of the sample came from single parent households.
Procedures
The MCS is an ongoing, multi-disciplinary study that follows the lives of approximately 19,000 children born in the United Kingdom between 2000 and 2002. See (Plewis, Reference Plewis2007) and https://cls.ucl.ac.uk/cls-studies/millennium-cohort-study/ for full sampling details. These details are described here in brief. Families were identified as eligible for participation in the MCS using child benefit records, which were universal social security payments made to all families with children. Stratification was applied during participant recruitment to ensure that all of the UK nations were represented, in order to include highly concentrated areas of ethnoracial minoritized families and areas of deprivation. Families were recruited to the study when child participants were 9 months of age (n = 19,243), and were subsequently followed-up at 3 years (n = 15,590), 5 years (n = 15,246), 7 years (n = 13,857), 11 years (n = 13,287), and 14 years of age (n = 11,726). Trained researchers administered surveys and conducted interviews in family homes at each wave of data collection. Parents answered questions about demographic characteristics (e.g., socioeconomic status indicators) and indicators of child health and well-being (e.g., physical activity, cognitive development, socioemotional well-being).
Measures
The prosocial behavior, emotional problems, peer problems, conduct problems, and hyperactivity and inattention problems subscales of the SDQ (Goodman, Reference Goodman1997) were completed by parents when the young person was 3 (96% by mothers), 5 (95% by mothers), 7 (95% by mothers), 11 (92% by mothers), and 14 (90% by mothers) years old. Responses were coded on a three-point scale (0 = Not true, 1 = Somewhat true, 2 = Certainly true). Scores were summed together (theoretical range = 0–10) so that higher scores indicated higher levels of prosocial behavior and psychopathology.
The items on the SDQ can be used to generate three subscales (internalizing problems, externalizing problems, and prosocial behavior) or five subscales (emotional problems, peer problems, conduct problems, hyperactivity and inattention problems, and prosocial behavior). To determine whether a three- or five-factor structure of the SDQ should be used in primary analyses, both structures were assessed across all five time points using two separate CFA in Mplus v. 8.2 (Muthén & Muthén, Reference Muthén and Muthén2018). The “MODEL = configural” analysis command was used. The SDQ items were treated as ordinal variables using the weighted least-squares means and variances-adjusted estimator, which calculates robust standard errors and is flexible for use with non-continuous variables. For both three- and five-factor models, the respective factor structure was imposed without any constraints on the factor loadings or means using scoring guidelines provided by the creators of the measure (http://www.sdqinfo.org/). The five-factor model fit the data better, χ2(1325) = 42,779.12, CFI = .901, RMSEA = .049 [.048, .049], than the three-factor model, χ2(1368) = 58,898.67, CFI = .864, RMSEA = .056 [.056, .057]. The three-factor model did not have acceptable model fit (i.e., CFI < .90), thus the five-factor model was chosen for subsequent analyses.
Prosocial behavior
The five-item prosocial subscale included items such as “[My child] is helpful if someone is hurt” and “[My child] is considerate of other people’s feelings”.
Psychopathology
Four five-item subscales were created for each dimension of psychopathology (based on cofirmatory factor analyses detailed in Appendix A). The emotional problems subscale included items like, “[My child] often complains of headaches”. The peer problems subscale included items such as, “[My child] is rather solitary, tends to play alone”. The conduct problems subscale included items like, “[My child] often has temper tantrums or hot tempers”. The hyperactivity and inattention problems subscale included items such as, “[My child] is easily distracted, concentration wonders”.
Covariates
All covariates were measured at the initial sampling point of the MCS (i.e., when children were 9 months old).
Sex
Parents reported their child’s biological sex as Female (coded as “0”) or Male (coded as “1”).
Ethnoracial background
Parents reported their child’s ethnoracial background from a list of provided options. For sample demographic estimates, these included the categories of South Asian (Bangladeshi, Indian, Pakistani), Black (Black African, Black Caribbean), Mixed, White, or Other (including Arab, East Asian). For the analyses of the current study, a dichotomized ethnoracial background variable was created where ethnoracially minoritized children were assigned coded values of “0” and White children were assigned coded values of “1.”
Maternal education (academic qualification)
Mothers self-reported their highest academic qualification level. Response options included no educational qualification (coded as “0”), GCSE Level earned (coded as “1”), A-Level earned (coded as “2”), Degree Level earned (coded as “3”), and Higher Degree earned (coded as 4). Higher scores indicated more earned education.
Maternal depression
The Malaise Inventory (Rutter et al., Reference Rutter, Tizard and Whitemore1970) was used to measure mothers’ depressive symptoms. Mothers self-reported on nine items such as “Do you feel tired most of the time?” and “Are you easily upset of irritated?” on a two-point scale (0 = no, 1 = yes). Responses across the nine items were summed together so that higher scores indicated greater depressive symptoms.
Statistical Analyses
Data were cleaned and prepared using STATA/MP version 17.0 (StataCorp, 2021). All statistical models were estimated using Mplus version 8.2 (Muthén & Muthén, Reference Muthén and Muthén2018).
Measurement invariance
As is requisite to estimating and accurately interpreting longitudinal models, measurement invariance was established. Metric and scalar invariance was tested using the “MODEL = configural metric scalar” analysis command in Mplus v. 8.2 (Muthén & Muthén, Reference Muthén and Muthén2018). The SDQ was assumed to be noninvariant over time if the change in CFI ≥ −.010 and the change in RMSEA ≥ .030 (Chen, Reference Chen2007). These criteria were not met and so the SDQ was assumed to be invariant (see Appendix A in supplementary materials).
Missing data
As expected with any longitudinal study, there was some attrition over time. Participants from ethnoracially minoritized groups were more likely to drop out of the study compared to those with a White ethnoracial background (Mostafa & Ploubidis, Reference Mostafa and Ploubidis2017). Additionally, as expected with survey research, there were some missing data. We took a two-step process to carefully diagnose the missingness in our data (reported in full in Appendix B). First, Little’s (Reference Little1988) MCAR test was conducted and revealed data were not MCAR. Follow-up analyses using Rubin’s (Reference Rubin1976) approach revealed participants with some missing data reported slightly lower levels of prosocial behavior and higher levels of emotional, peer, conduct, and hyperactivity and inattention problems compared to those with complete data. To deal with these missing data appropriately, primary analyses were conducted using full information maximum-likelihood estimation (Muthén et al., Reference Muthén, Kaplan and Hollis1987).
Preliminary analyses
Bivariate correlations between and descriptive statistics for study variables were estimated and reviewed to assess preliminary relations among variables.
Random intercepts cross lagged panel models
Four random intercepts cross-lagged panel models (RI-CLPMs) were estimated (one to assess relations between prosocial behavior and each dimension of psychopathology). A model examining bidirectional relations between prosocial behavior and all four indicators of psychopathology in a single model was attempted, but was unreliable due to issues related to extreme multicollinearity between psychopathology dimensions; as such, this was abandoned in favor of four separate models. Random intercepts account for interindividual, between-person variability. A covariance between random intercepts can be interpreted as representing time-invariant stability in the relation between two constructs. Cross-lagged paths account for intraindividual, within-person variability. These can be interpreted as the degree to which earlier deviation from one’s expected score on one construct predicts later deviation from one’s expected score on another construct. Put simply, cross-lagged paths represent the degree to which constructs influence each other. Autoregressive paths also account for intraindividual, within-person variability. Hamaker et al. (Reference Hamaker, Kuiper and Grasman2015) and Hamaker (Reference Hamaker2018) can be reviewed for further details regarding the specification and interpretation of RI-CLPMs. Orth et al. (Reference Orth, Clark, Donnellan and Robins2021) should be reviewed for the weaknesses of the RI-CLPM. In order to prioritize parsimony, autoregressive paths, cross-lagged paths, and covariances, respectively, were constrained to be equal across time when doing so did not significantly decrease model fit. The Wald test statistic in Mplus, which is comparable to the Chi square difference test, was used to assess whether these equality constraints significantly decreased model fit. Good model fit includes a nonsignificant chi-square test, a CFI value greater than or equal to .95 (Bentler, Reference Bentler1990), and a RMSEA value smaller than or equal to .08 (Little, Reference Little2013). Cohen’s (Reference Cohen1988) d and r effect size conventions were loosely used to interpret the magnitude of covariances and regression paths (i.e., .20 or less is small or weak, .21–.40 is moderate, and .41 or larger is large or strong).
Results
Preliminary analyses
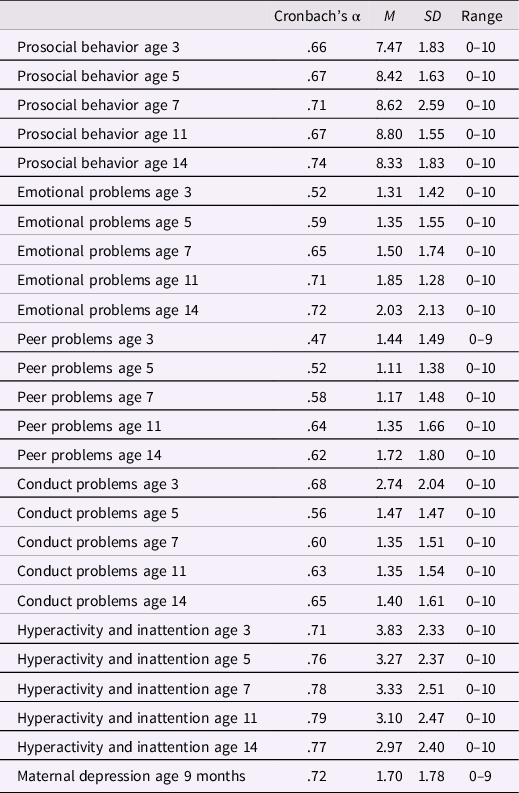
Bivariate correlations between and descriptive statistics for study variables were estimated (see Tables 1 and 2). Generally speaking, prosocial behavior was negatively associated with emotional, peer, conduct, and hyperactivity and inattention problems cross-sectionally and longitudinally. Correlation coefficients between prosocial behavior and indicators of psychopathology were generally larger the closer the measurement points, and smaller the more distal the measurement points.
Descriptive statistics for study variables
Standardized bivariate correlations between study variables
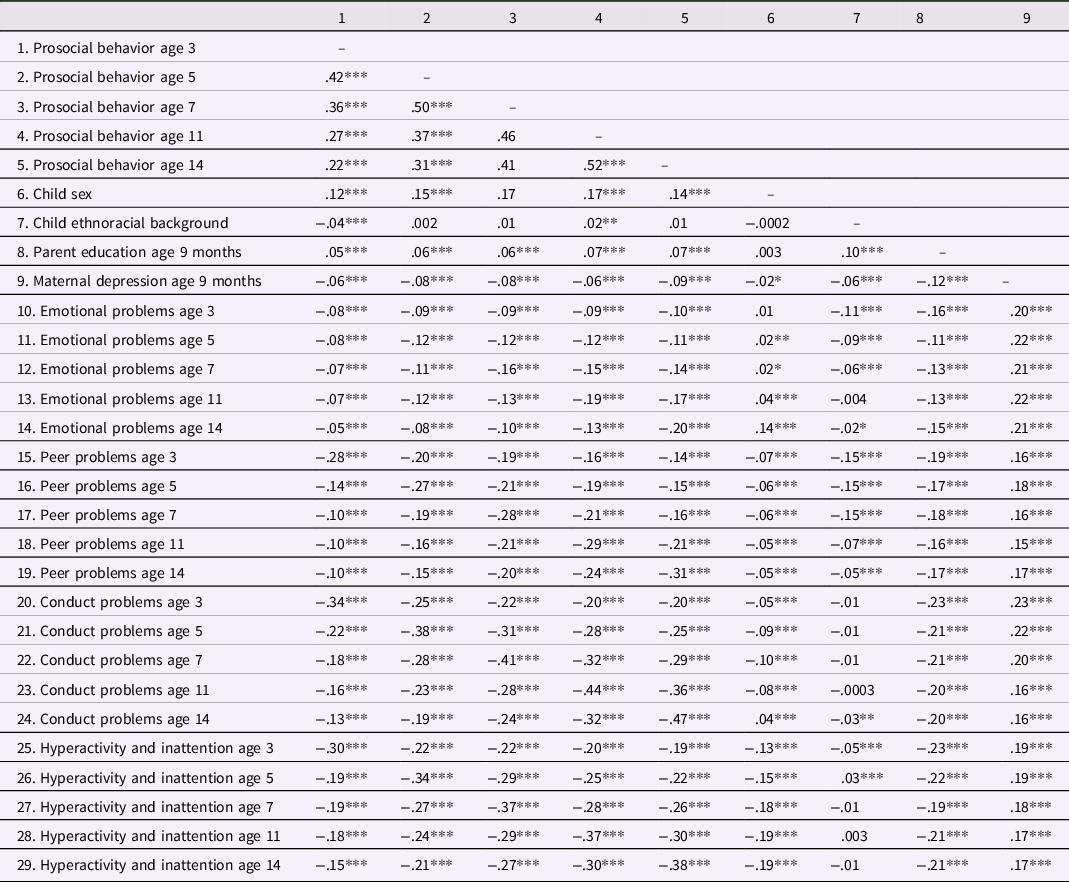
Note. For child sex, 0 = female, 1 = male. For ethnoracial background, 0 = Minoritized, 1 = White. ***p < .001, **p < .01, *p < .05.
Random intercepts cross-lagged panel models
Standardized autoregressive and cross-lagged regression coefficients along with accompanying 95% confidence intervals and relations between primary study variables and covariates are presented in Table 3. The proportion of variability accounted for in prosocial behavior and dimensions of psychopathology across each of the four models is presented in Appendix C in the online Supplemental Materials.
Standardized coefficients and associated [95% confidence intervals] of the four RI-CLPMs
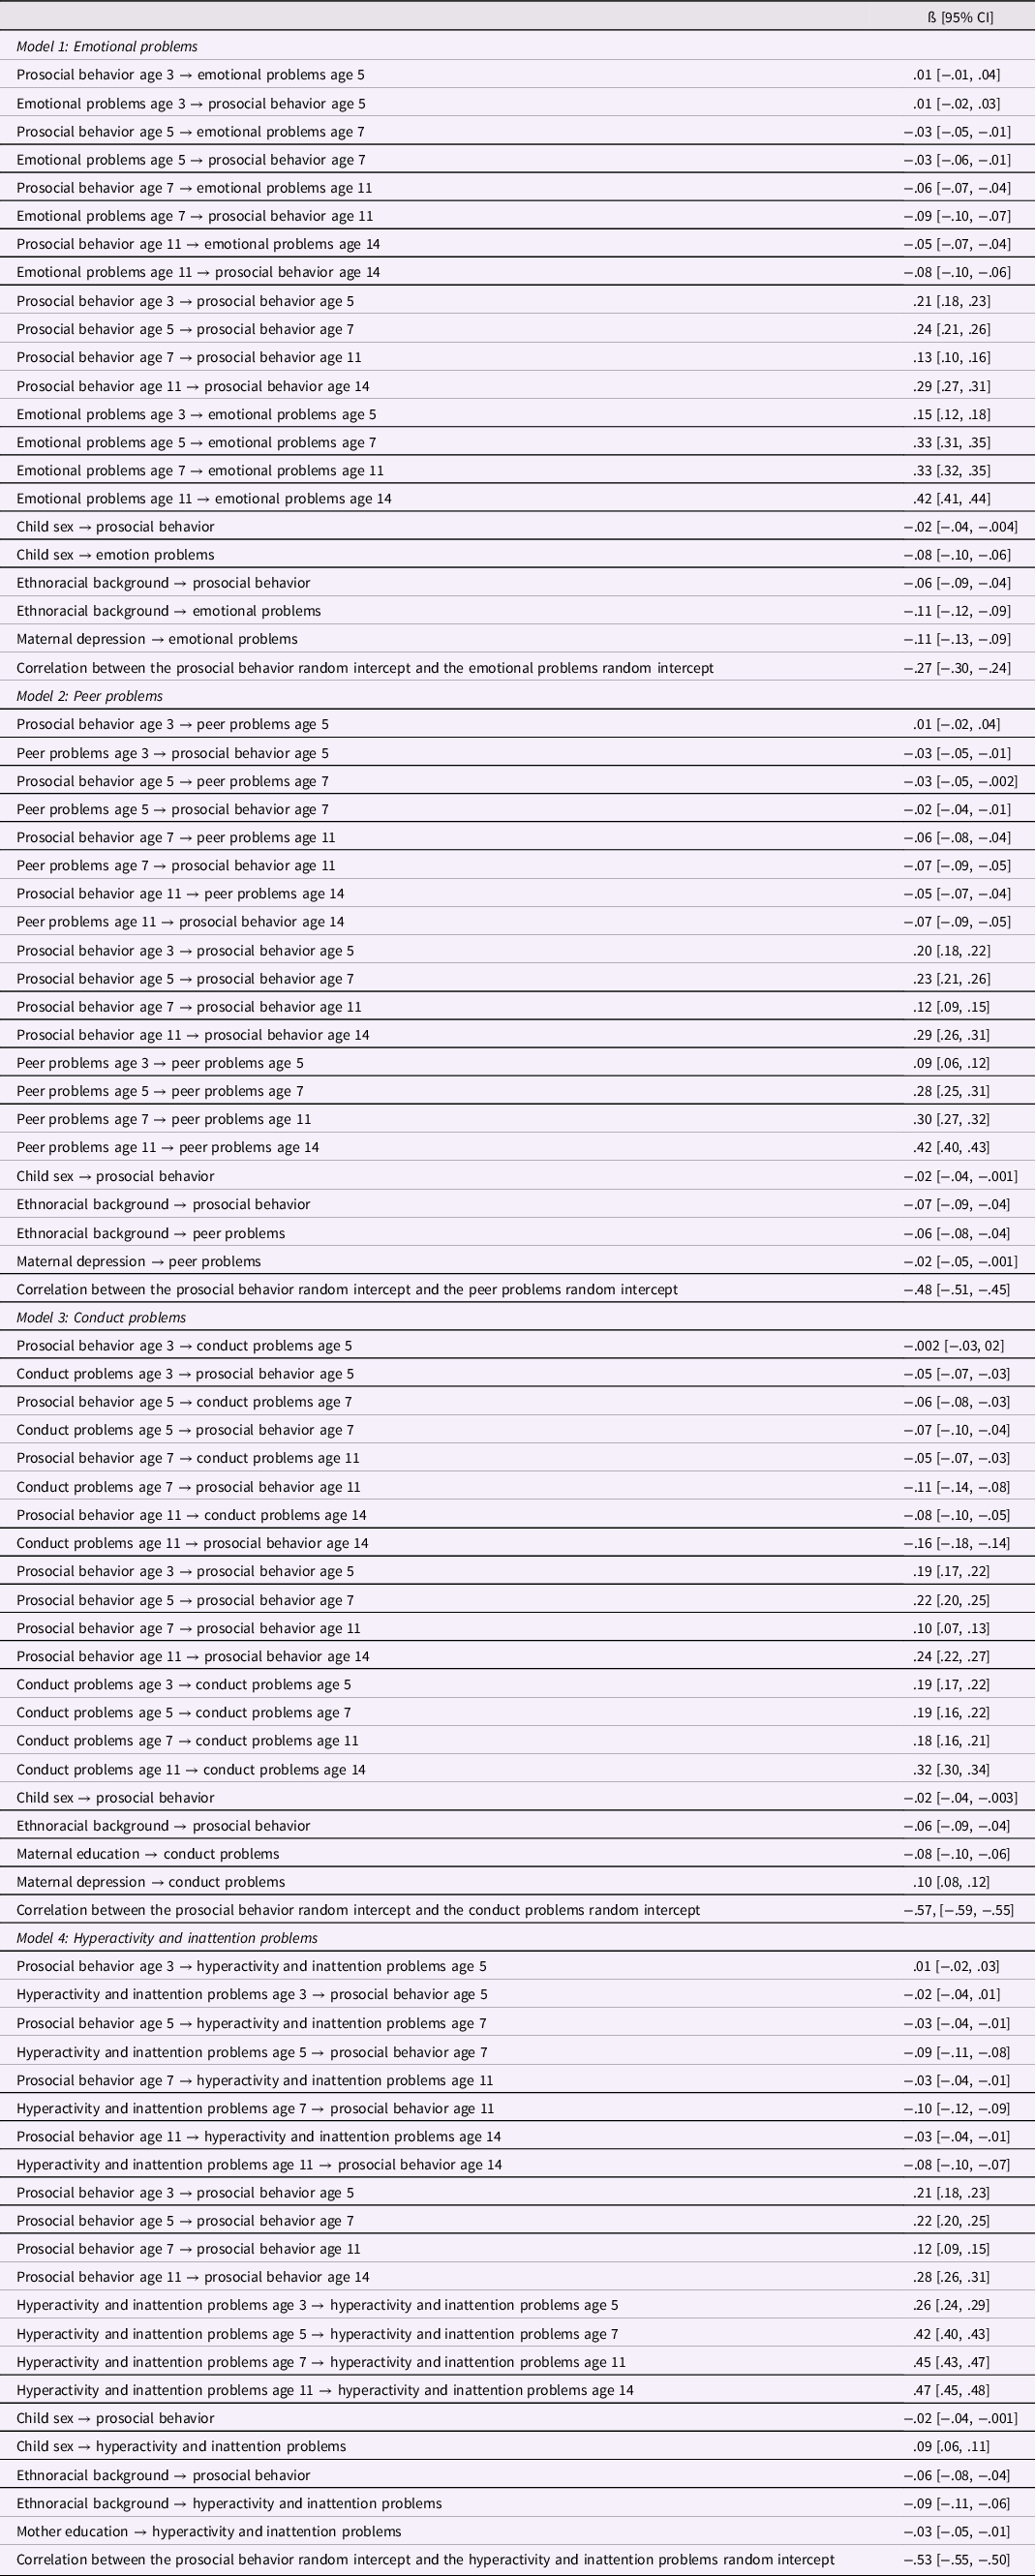
Note. Reported coefficients containing a “→” correspond to regression parameters; all other reported coefficients correspond to covariance parameters. For child sex, 0 = female, 1 = male. For ethnoracial background, 0 = Minoritized, 1 = White. Only statistically significant relations between covariates and study variables are reported.
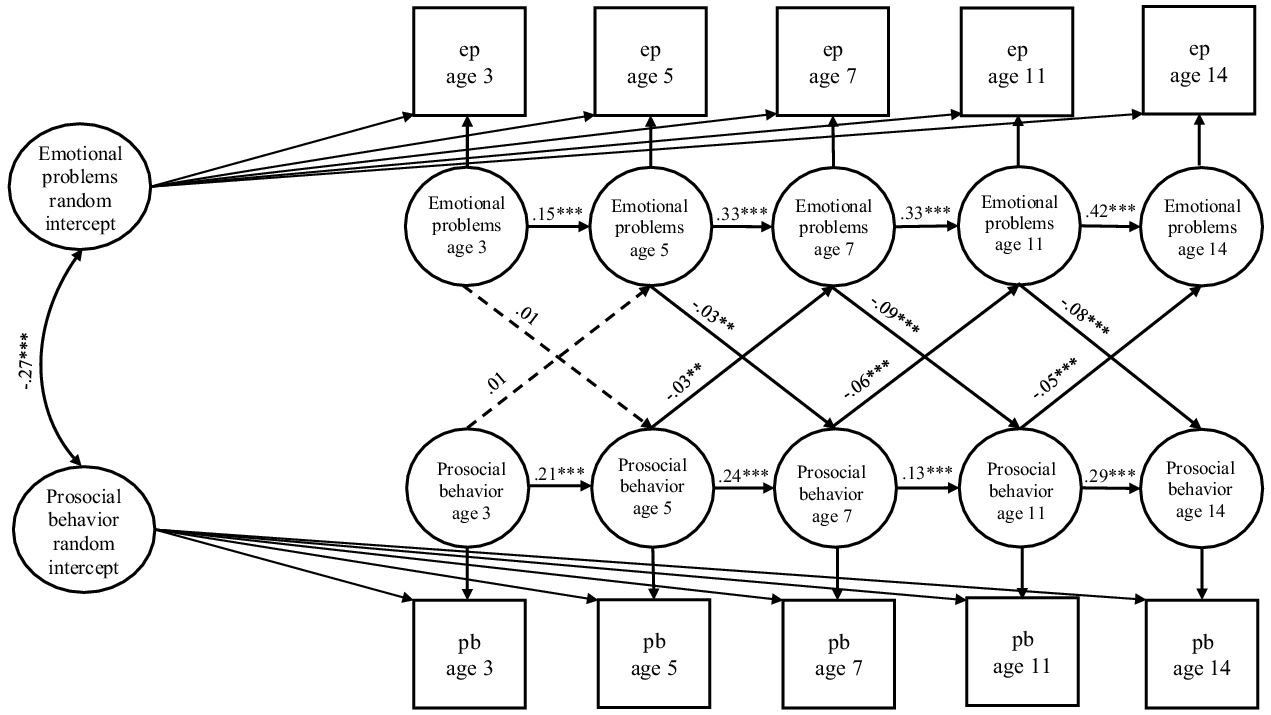
Emotional problems and prosocial behavior
The model fit the data well, χ2(49) = 690.44, p < .001, CFI = .979, RMSEA = .028 [.026, .030]. Regarding intraindividual effects, from age 5 to age 7, age 7 to age 11, and age 11 to age 14, higher levels of earlier-reported emotional problems were associated with lower later-reported prosocial behavior. From age 5 to age 7, age 7 to age 11, and age 11 to age 14, higher levels of earlier-reported prosocial behavior were associated with lower later-reported emotional problems. Associations between prosocial behavior and emotional problems were not significantly associated from age 3 to age 5. Prosocial behavior was weakly to moderately stable across time points and emotional problems were weakly to strongly stable across time points. Regarding interindividual effects, the prosocial behavior random intercept was significantly negatively associated with the emotional problems random intercept. See Figure 1.
Standardized relations between prosocial behavior and emotional problems from age 3 to 14.Note. ep = observed emotional problems; pb = observed prosocial behavior. Relations between control variables and primary study variables are not depicted and are reported in text. Covariances between single-item latent variables at age 3 years, covariances between innovation terms at age 3 years, endogenous error correlations between constructs at ages 5, 7, 11, and 14 years, and latent error variances at all time points are also not depicted. Dashed lines represent nonsignificant paths. *p < .05, **p < .01, ***p < .001.
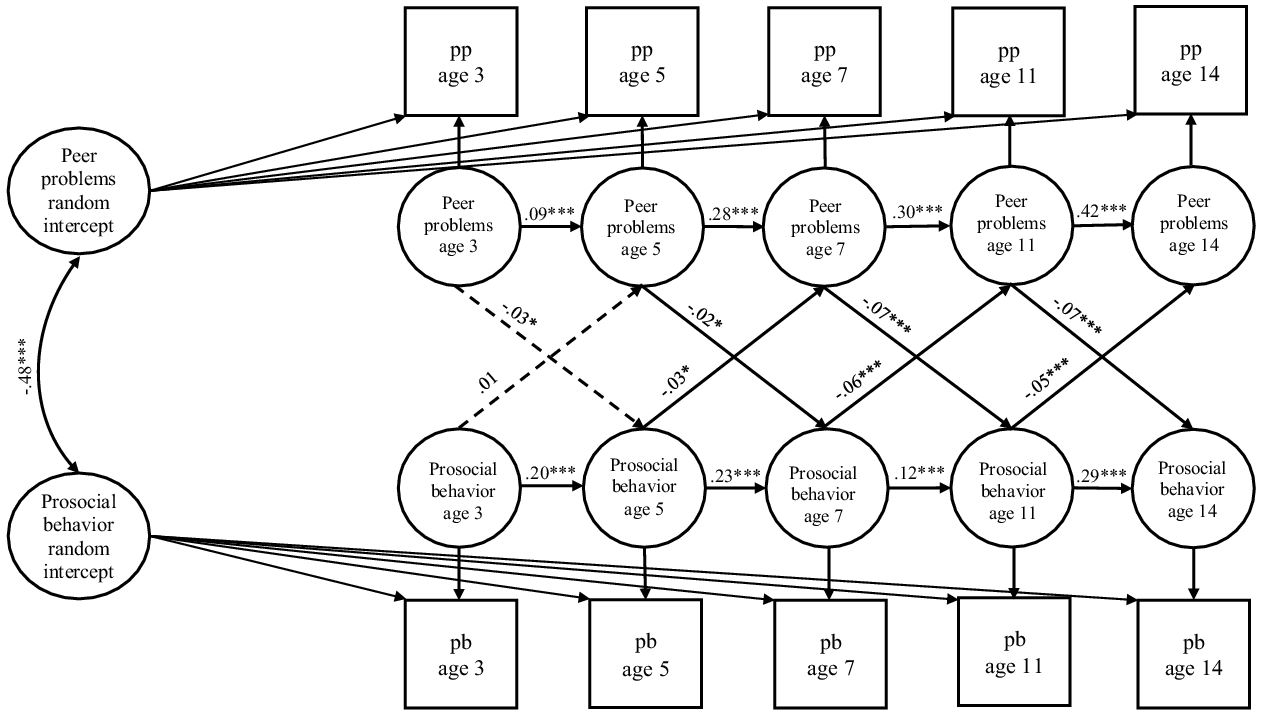
Peer problems and prosocial behavior
The model fit the data well, χ2(51) = 421.54, p < .001, CFI = .989, RMSEA = .021 [.019, .023]. Regarding intraindividual effects, from age 5 to age 7, age 7 to age 11, and age 11 to age 14, higher levels of earlier-reported prosocial behavior were associated with lower later-reported peer problems. Across all measurement points, higher levels of earlier-reported peer problems were associated with lower later-reported prosocial behavior. Prosocial behavior was weakly to moderately stable across time points and peer problems were weakly to strongly stable across time points. Regarding interindividual effects, the prosocial behavior random intercept was significantly negatively associated with the peer problems random intercept. See Figure 2.
Standardized relations between prosocial behavior and peer problems from age 3 to 14.Note. pp = observed peer problems; pb = observed prosocial behavior. Relations between control variables and primary study variables are not depicted and are reported in text. Covariances between single-item latent variables at age 3 years, covariances between innovation terms at age 3 years, endogenous error correlations between constructs at ages 5, 7, 11, and 14 years, and latent error variances at all time points are also not depicted. Dashed lines represent nonsignificant paths. *p < .05, **p < .01, ***p < .001.
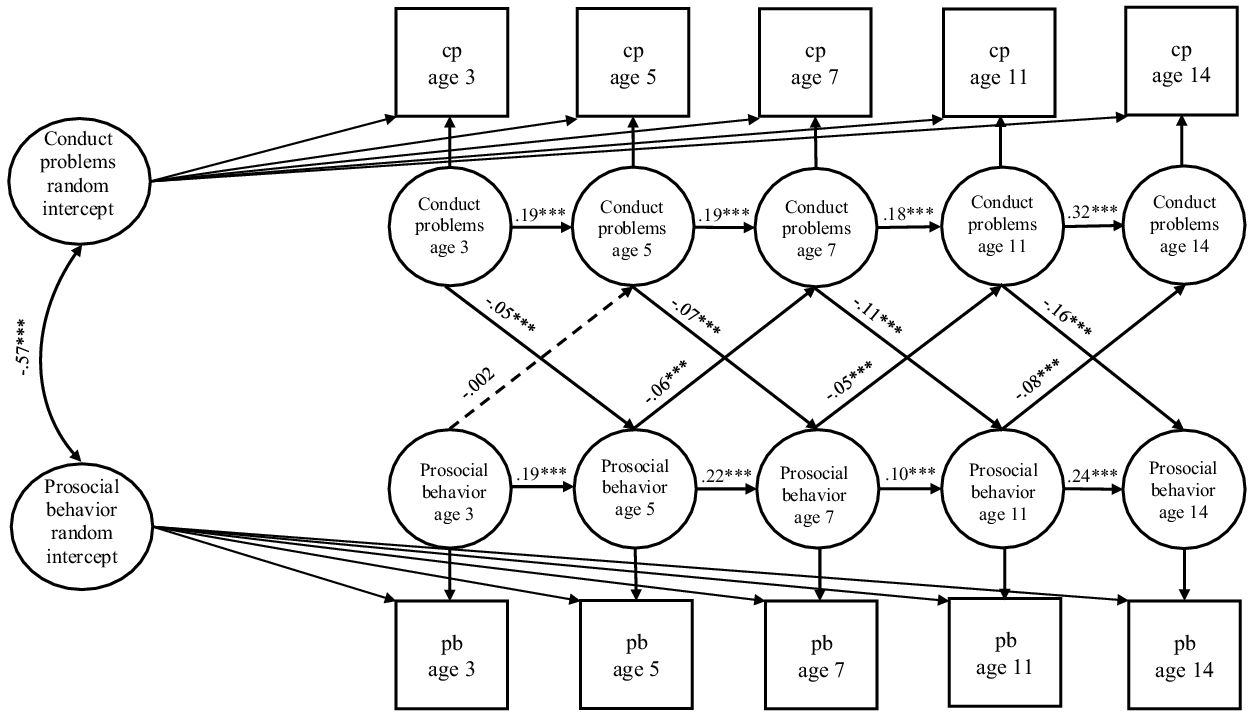
Conduct problems and prosocial behavior
The model fit the data well, χ2(48) = 416.55, p < .001, CFI = .992, RMSEA = .021 [.019, .023]. Regarding intraindividual effects, from age 5 to age 7, age 7 to age 11, and age 11 to age 14, higher levels of earlier-reported prosocial behavior were associated with lower later-reported conduct problems. From age 5 to age 7, age 7 to age 11, and age 11 to age 14, higher levels of earlier-reported conduct problems were associated with lower later-reported prosocial behavior. Associations between prosocial behavior and conduct problems were not significantly associated from age 3 to age 5. Prosocial behavior and conduct problems were each weakly to moderately stable across time points. Regarding interindividual effects, the prosocial behavior random intercept was significantly negatively associated with the hyperactivity and inattention problems random intercept. See Figure 3.
Standardized relations between prosocial behavior and conduct problems from age 3 to 14. Note. cp = observed conduct problems; pb = observed prosocial behavior. Relations between control variables and primary study variables are not depicted and are reported in text. Covariances between single-item latent variables at age 3 years, covariances between innovation terms at age 3 years, endogenous error correlations between constructs at ages 5, 7, 11, and 14 years, and latent error variances at all time points are also not depicted. Dashed lines represent nonsignificant paths. *p < .05, **p < .01, ***p < .001.
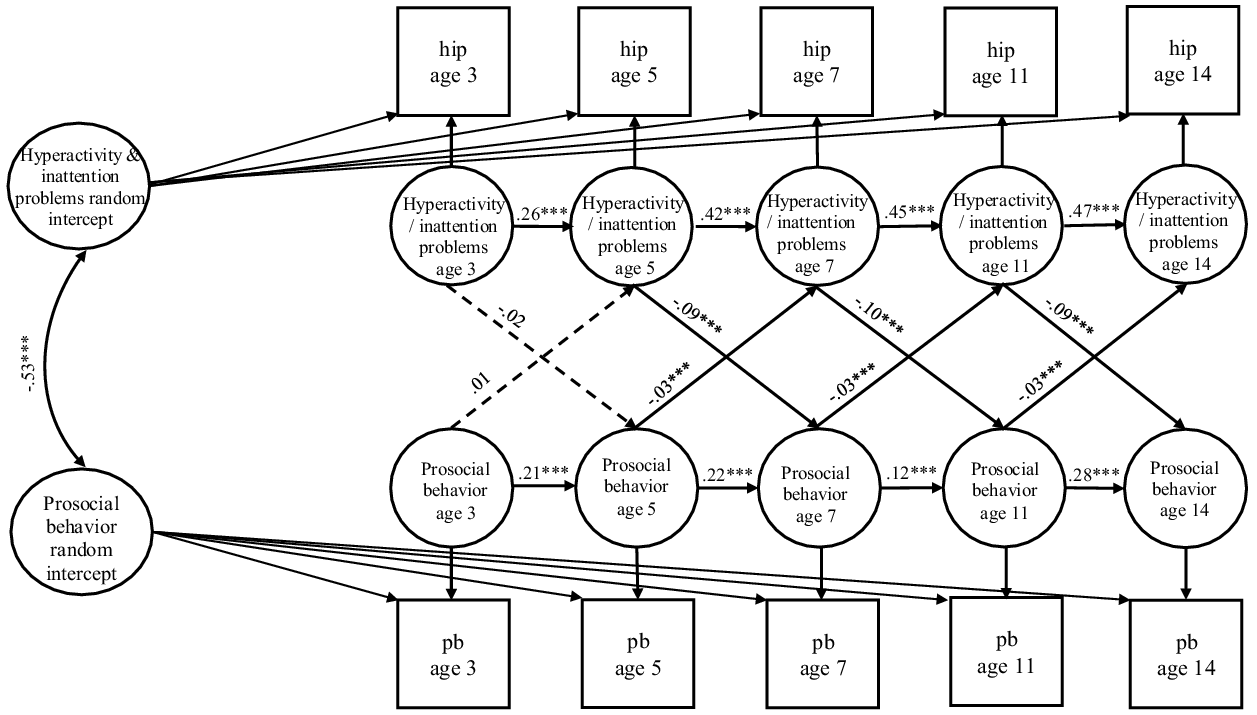
Hyperactivity and inattention problems and prosocial behavior
The model fit the data well, χ2(55) = 482.97, p < .001, CFI = .991, RMSEA = .021 [.020, .023]. Regarding intraindividual effects, from age 5 to age 7, age 7 to age 11, and age 11 to age 14, higher levels of earlier-reported prosocial behavior were associated with lower later-reported hyperactivity and inattention problems. From age 5 to age 7, age 7 to age 11, and age 11 to age 14, higher levels of earlier-reported hyperactivity and inattention problems were associated with lower later-reported prosocial behavior. Associations between prosocial behavior and hyperactivity and inattention problems were not significantly associated from age 3 to age 5. Prosocial behavior was weakly to moderately stable across time points and hyperactivity and inattention problems were moderately to strongly stable across time points. Regarding interindividual effects, the prosocial behavior random intercept was significantly negatively associated with the hyperactivity and inattention problems random intercept. See Figure 4.
Standardized relations between prosocial behavior and hyperactivity and inattention from age 3 to 14. Note. hip = observed hyperactivity and inattention problems; pb = observed prosocial behavior. Relations between control variables and primary study variables are not depicted and are reported in text. Covariances between single-item latent variables at age 3 years, covariances between innovation terms at age 3 years, endogenous error correlations between constructs at ages 5, 7, 11, and 14 years, and latent error variances at all time points are also not depicted. Dashed lines represent nonsignificant paths. *p < .05, **p < .01, ***p < .001.
Discussion
The current study investigated long-term longitudinal (Research Goal 1), bidirectional (Research Goal 2), intra- and interindividual associations (Research Goal 3) between prosocial behavior and emotional problems, peer problems, conduct problems, and hyperactivity and inattention problems, respectively, from early childhood through adolescence (i.e., from age 3 to 14 years) using a large, nationally representative sample. At an intraindividual, within-person level, prosocial behavior was negatively bidirectionally associated with peer, conduct, and hyperactivity and inattention problems. Also at an intraindividual, within-person level, prosocial behavior was unidirectionally protective against emotional problems. At an interindividual level, prosocial behavior and each dimension of psychopathology were negatively associated. Intraindividual associations were small while interindividual associations were moderate to large. The implications for theory, future research, and evidence-based interventions are discussed below.
Intraindividual relations between prosocial behavior and psychopathology
At an intraindividual, within-person level, prosocial behavior was bidirectionally associated with peer problems, conduct problems, and hyperactivity and inattention problems, and was unidirectionally protective against emotional problems, thereby supporting Hypothesis 1.
Positive cascades from prosocial behavior to multidimensional psychopathology
Supportive of previous research and the concept of positive developmental cascades (Eron & Huesmann, Reference Eron and Huesmann1984; Memmott-Elison, Yu, et al., Reference Memmott-Elison, Yu, Maiva, Dicus and Carlo2020; Padilla-Walker et al., Reference Padilla-Walker, Carlo and Nielson2015), higher levels of earlier prosocial behavior were associated with larger than expected decrements in emotional, peer, conduct, and hyperactivity and inattention problems from age 5 to age 14 years. These findings suggest that engaging in earlier prosocial behavior can slightly reduce later psychopathological experiences. Beginning in early-childhood and extending into mid-adolescence, children and adolescents who engage in prosocial behaviors likely create behavioral patterns and establish a climate of associations with peers and family members that are characterized by kindness and willing contribution (Busching & Krahé, Reference Busching and Krahé2020; Jessor, Reference Jessor1987). These developing prosocial behaviors and relationships probably do not encourage or support psychopathological symptoms or behaviors, thereby protecting against controllable issues with emotional, peer, conduct, and hyperactivity and inattention problems (Hofmann & Müller, Reference Hofmann and Müller2018). As children and adolescents engage in helpful actions, they become more socially competent and more capable of establishing and drawing from adaptive social relationships as needed (Padilla-Walker et al., Reference Padilla-Walker, Carlo, Christensen and Yorgason2012).
We must note that the intraindividual effects were weak. This may partly reflect the long duration between time points (Orth et al., Reference Orth, Clark, Donnellan and Robins2021). More specifically, the protective effects of prosocial behavior against psychopathology could be more significant in the shorter-term than in the longer-term, which might have caused diminished effect sizes in the current study. Future work should strengthen current findings by replicating current long-term longitudinal findings using additional samples.
Briefly, the findings regarding bidirectional intraindividual relations between prosocial behavior and multidimensional psychopathology have implications for the provision of support aimed at reducing the incidence of psychopathology during childhood and adolescence. Universal intervention approaches may mitigate psychopathological experiences by providing opportunities for children and adolescents to engage in prosocial behavior. However, there is a need to manage expectations regarding the extent to which prosocial behavior reduces subsequent psychopathology. For instance, the observed intraindividual effects from prosocial behavior to psychopathology were weak, indicating applied approaches that encourage prosocial behavior might have only small effects on children’s and adolescents’ psychopathology (however, a recent meta-analysis of prosocial interventions reported that the reduction in aggressive behavior could actually be substantial; Mesurado et al., Reference Mesurado, Guerra, Richaud and Rodriguez2019). Since youths’ prosocial behavior is intertwined with their personal traits and strengths, interventions that target prosocial behavior and additional factors contemporaneously could be more effective at reducing psychopathology than interventions that solely target prosocial behavior.
Negative cascades from multidimensional psychopathology to prosocial behavior
Beginning at age 5 years and extending to age 14 years, greater experienced multidimensional psychopathology at earlier time points had a detrimental effect on subsequent prosocial behavior. That is, experiencing emotional, peer, conduct, and hyperactivity and inattention problems reduced the likelihood that children and adolescents engaged in prosocial behavior. Experienced psychopathology symptoms likely inhibit or interrupt the developmental processes necessary for prosocial engagement (Haselager et al., Reference Haselager, Cillessen, Van Lieshout, Riksen-Walraven and Hartup2002; Hay et al., Reference Hay, Hudson and Liang2010), such as recognizing opportunities to help others or distinguishing adaptive forms of prosociality. Children and adolescents with psychopathological problems may therefore experience social information processing bias, whereby being prosocial is not perceived as a viable, worthwhile, or satisfactory behavior (Arsenio & Lemerise, Reference Arsenio and Lemerise2004). Children and adolescents with conduct problems may be perceived by socially competent peers as threatening (Obsuth et al., Reference Obsuth, Eisner, Malti and Ribeaud2015), leading to general peer rejection, subsequent association with accepting but similarly externalizing peers (Dishion & Tipsord, Reference Dishion and Tipsord2011), and engagement in environments where prosocial behavior is neither practiced nor cultivated. Therefore, externalizing forms of psychopathology reduce opportunities for young people’s prosocial behavior. Internalizing forms of psychopathology may lead children and adolescents to withdraw from others, also reducing opportunities for prosocial engagement.
It is interesting that prosocial behavior and emotional problems, peer problems, and hyperactivity and inattention problems were not associated from age 3 to 5 years, while greater reported conduct problems at age 3 predicted greater than expected decrements in prosocial behavior at age 5. Birth to age 5 years are considered formative developmental years, when development is especially plastic. It could be that from age 3 to 5 years, aspects of psychopathology and prosocial behavior are still emerging and patterns of behavior are still being established, so relations between facets of social competence are not as clear or consistent compared to such relations at older ages. However, because conduct problems are contrary to prosocial behavior in terms of intention, action, and consequence for the majority of youth (Berger et al., Reference Berger, Batanova and Cance2015; Padilla-Walker et al., Reference Padilla-Walker, Memmott-Elison and Coyne2018), it could be that these are detrimental to prosocial behaviors, even at early ages.
Interindividual relations between prosocial behavior and psychopathology
In addition to intraindividual associations, prosocial behavior was also related to multidimensional psychopathology at an interindividual, between-person level. More specifically, prosocial behavior was moderately negatively associated with emotional problems and was strongly negatively associated with peer, conduct, and hyperactivity and inattention problems. Practically, this means that children and adolescents with natural prosocial dispositions or established prosocial habits are also less likely to experience multidimensional psychopathology and or that children and adolescents who consistently struggle with multidimensional pathological symptoms tend to also have reduced engagement in prosocial behaviors. Prosocial behavior and psychopathology could co-occur in part because they have shared genetic and environmental factors. This should be tested by future researchers.
Study limitations and future directions
Despite the implementation of a large, long-term longitudinal design, the use of a socioeconomically diverse sample that is nationally representative of the UK, and the implementation of a cutting-edge statistical model that appropriately disaggregates intra- and interindividual effects (Hamaker et al., Reference Hamaker, Kuiper and Grasman2015), the current study was not without limitations. First, a general measure of prosocial behavior was used despite established nuances in relations between prosocial behaviors and other constructs based on the types (Carlo et al., Reference Carlo, Hausmann, Christiansen and Randall2003) and targets (Padilla-Walker & Christensen, Reference Padilla-Walker and Christensen2011) of prosocial behavior under investigation. Future research should therefore seek to establish whether taking a person-specific approach toward prosocial behavior explains greater nuance in relations between prosocial behavior and psychopathology. Second, our study relied on all parent-report measures. This measurement strategy leaves questions regarding the possible role of common method variance (Williams & Brown, Reference Williams and Brown1994) as well as the accuracy of parent reports of adolescents’ behavior during a period in which parents spend decreasing time with their adolescent offspring (Phares et al., Reference Phares, Fields and Kamboukos2009). Or, perhaps parents are more likely to hold an assumption of stability related to their children’s prosocial behavior and psychopathology, which could have led to overestimation of each construct’s stability as well as interindividual difference pathways. Future researchers should build on current findings by adopting a multi-informant approach. Third, many of the measures used in this study made use of a three-point scale, which might not capture the true variance in some of the measured constructs. Fourth, the four dimensions of psychopathology were tested in separate models due to issues of multicollinearity, so the analyses were unable to account for shared variance amongst the four dimensions, and results do not allow for direct comparisons in the strength of relations between prosocial behavior and each dimension of psychopathology. It may be that the observed effects represent overlapping portions of the four dimensions. Additionally, the literature on the strength of associations between prosocial behavior and multidimensional psychopathology, particularly internalizing problems, is in need of bolstering. These are important directions for future researchers interested in further informing basic science.
Conclusion
The current study provided clarity to the social competence literature by mapping intra- and interindividual, long-term longitudinal relations between prosocial behavior and multidimensional psychopathology from early childhood through mid-adolescence. Prosocial behavior and peer, conduct, and hyperactivity and inattention problems, respectively, are negatively bidirectionally associated at an intraindividual level, while prosocial behavior is protective against emotional problems at an intraindividual level. Prosocial behavior and each dimension of psychopathology are also negatively associated at an interindividual level. Thus, the developmental cascades framework has utility in explaining the interdependence of individual characteristics at within- and between-person levels, which dovetail to influence the long-term longitudinal development of children’s and adolescents’ social competence. Currently implemented interventions that aim to reduce the incidence of psychopathology by increasing engagement in prosocial behavior, or by reducing psychopathology to enable prosociality, may have small long-term effects. We hope the findings of this study will serve as a reference point and springboard for future bidirectional investigations of components of social competence and related topics.
Supplementary material
The supplementary material for this article can be found at https://doi.org/10.1017/S0954579422000657
Acknowledgements
We are grateful to the children and families who take part in the study. Data was accessed via the UK Data Service (http://www.ukdataservice.ac.uk/). The Centre for Longitudinal Studies, UCL Institute of Education, the UK Data Archive, and UK Data Service bear no responsibility for the analysis or interpretation of these data.
Funding statement
The research received no specific grant from any funding agency, commercial, or not-for-profit sectors.
Conflicts of interest
None.
Ethical standards
Ethical approval for data collection for Millennium Cohort Study (MCS) (Connelly & Platt, Reference Connelly and Platt2014) was sought from the National Health Service Research Ethics Committee. Full details of the ethical process for the MCS are available at https://cls.ucl.ac.uk/wp-content/uploads/2017/07/MCS-Ethical-Approval-and-Consent-2019.pdf. Primary caregivers provided informed consent on behalf of their child, and young people themselves provided verbal assent. This secondary analysis of the data reported here was approved by the Education Ethics Committee at the University of York, United Kingdom.


 Open access