

From the Arctic to the South Pacific, Indigenous Peoples have experienced a rapid nutrition transition( Reference Popkin 1 , Reference Popkin and Gordon-Larsen 2 ) characterized by the adoption of a ‘western’ diet (i.e. high in saturated fats, sugar and processed foods) and the decline of traditional/subsistence-based ways of life( Reference Albala, Vio and Kain 3 – Reference Hughes and Lawrence 6 ). Across the globe, this dietary shift has been paralleled by an increase in the prevalence of obesity, diabetes and other diet-related chronic diseases( Reference Albala, Vio and Kain 3 – Reference Hughes and Lawrence 6 ). Inuit are a traditionally semi-nomadic Indigenous Peoples residing across the circumpolar north( Reference Bonesteel and Anderson 7 ). In the latter half of the 20th century, Inuit endured significant lifestyle changes, involving the settlement into permanent communities, the development of a wage economy and the introduction of market foods to remote northern communities( Reference Akande, Hendriks and Ruiter 8 ). The diet transition among Inuit is characterized by the decreased consumption of ‘country foods’ (foods harvested from northern ecosystems, through cultural practices, traditions and detailed environmental knowledge) and the increased presence of ‘market foods’ (foods shipped to northern communities from the south and purchased in stores) in the diet( Reference Kuhnlein, Receveur and Soueida 5 , Reference Sharma, Cao and Roache 9 , Reference Egeland, Johnson-Down and Cao 10 ).
The harvest and consumption of country foods remain fundamental to Inuit cultural identity( Reference Borré 11 – Reference Pufall, Jones and McEwen 13 ), food security and dietary adequacy( Reference Schaefer, Erber and Trzaskos 14 – Reference Power 16 ). However, the transition towards higher intakes of market foods has led to excessive intakes of energy, carbohydrates and fat, coupled with inadequate intakes of several micronutrients (i.e. dietary fibre, Ca, folate and vitamins A, D and E)( Reference Kuhnlein, Receveur and Soueida 5 , Reference Sharma, Cao and Roache 9 , Reference Egeland, Johnson-Down and Cao 10 , Reference Sharma 17 , Reference Erber, Hopping and Beck 18 ). This transition is associated with high rates of food insecurity( Reference Egeland, Johnson-Down and Cao 10 ), has been linked to increasing incidence of obesity, and bears important risks for the development of diabetes and chronic disease( Reference Kuhnlein, Receveur and Soueida 5 , Reference Sheikh, Egeland and Johnson-Down 19 ). Inuit experience moderate and/or severe food insecurity at almost four times the rate of non-Aboriginal Canadians (27 % relative to 7 %, based on data from males aged 12 years or older)( Reference Gionet and Roshanafshar 20 ).
With few exceptions, research on the Inuit diet in Canada generally consists of community-level studies, involving small sample sizes. While there are unique qualities that define Inuit communities at the local level, food system disturbances (e.g. environmental change) are often expressed, and modelled by scientists, at larger scales( Reference Wesche and Chan 21 ). Likewise, strategies and interventions to improve food security and nutrition in Inuit communities may necessitate broader regional, territorial or federal support (see, for example, the federally administered Nutrition North Canada Program( 22 ) and the Nunavut Food Security Strategy and Action Plan( 23 )).
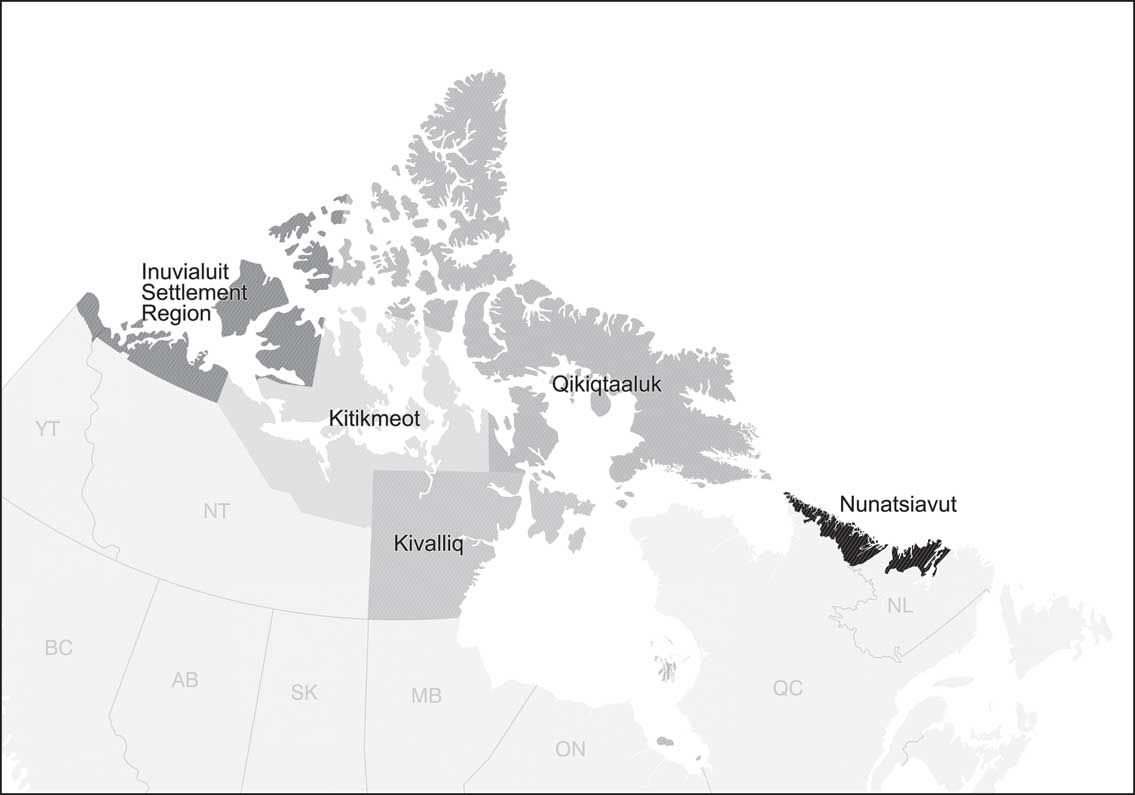
Kuhnlein et al. (2008) provide a comprehensive description of dietary adequacy in three populations of Arctic Indigenous adults (n 3329) across Canada between 1993 and 1999( Reference Kuhnlein, Receveur and Soueida 24 ). More recently, several authors have reported diet, nutrition and food security results from the 2007–08 International Polar Year Inuit Health Survey (IHS)( Reference Egeland, Johnson-Down and Cao 10 , Reference Sheikh, Egeland and Johnson-Down 19 , Reference Galloway, Johnson-Down and Egeland 25 – Reference Huet, Rosol and Egeland 27 ). The IHS was developed in response to the disparity in available information regarding the health status of Inuit residing across the Canadian Inuit Nunangat (homeland of Inuit of Canada). The IHS collected comprehensive baseline data for 2595 Inuit adults in thirty-six communities, spanning three jurisdictions of Inuit Nunangat (Nunatsiavut, Nunavut and the Inuvialuit Settlement Region (ISR); Fig. 1). Health status for Inuit in Nunavik (the fourth Inuit region in Canada) was assessed during the 2004 Qanuippitaa? How are we? Nunavik Health Survey( Reference Rochette and Blanchet 28 ).
Map of the participating Inuit regions* of the 2007–08 Inuit Health Survey. *Nunavut is comprised of the Kitikmeot, Kivalliq and Qikiqtaaluk regions
The purpose of the present study was to describe region-level population diets for a large sample of Inuit adults across the Canadian north. Specifically, our objectives were to: (i) identify principal dietary sources of energy and selected nutrients; and (ii) examine the relative contribution of country foods and market foods to energy and nutrient intakes.
Methods
Study design and sample
Dietary data were derived from the Canadian International Polar Year IHS. The IHS, conducted between the late summer/autumn of 2007 and 2008, collected comprehensive baseline data about the health and living conditions of Inuit adults across three Inuit regions (Nunatsiavut, Nunavut and the ISR) spanning the Canadian north (latitude of 54°10′N to 76°25′N). Complete methodology and design for the 2007–08 IHS have been published elsewhere( Reference Saudny, Leggee and Egeland 29 ).
The survey was cross-sectional, employing a stratified random sampling of households in thirty-three coastal communities and three inland communities (Fig. 1). A total of 2796 households were randomly selected to participate. From the households, non-pregnant Inuit adults aged 18 years or older were eligible to participate.
Dietary assessment
As described elsewhere( Reference Egeland, Johnson-Down and Cao 10 , Reference Jamieson, Weiler and Kuhnlein 15 ), dietary assessments were conducted in-person by trained interviewers in English and Inuit Languages. Diet was assessed by administering a single 24 h dietary recall (beginning at midnight and ending at midnight), based on an adapted form of the US Department of Agriculture’s (USDA) Automated Multiple-Pass method( Reference Blanton, Moshfegh and Baer 30 ). Three-dimensional graduated food model kits( 31 ) were available to aid participants in the estimation of portion sizes. Due to survey logistical constraints, a single 24 h recall was collected from each participant. While this method does not capture interindividual variations in dietary intake, it is appropriate for estimating population mean intakes( Reference Guenther, Kott and Carriquiry 32 ). Dietary data were entered using CANDAT Software (Godin London Inc.).
A total of 1591 (including ninety-three country foods) unique food and beverage (hereafter referred to as ‘food(s)’) items and/or preparations, corresponding to unique food codes in the Canadian Nutrient File (CNF), were reported in the dietary recalls. Alcoholic beverages (twelve unique items), which are legislatively prohibited in some Inuit communities, were excluded from all analyses. All foods and beverages reported as consumed in the IHS were coded hierarchically, by item similarity and food group (major and sub groups; see online supplementary material, Supplemental Tables 1 and 2). Similar food items in each recall were collapsed into a single item (e.g. ‘potato chips’ aggregated all potato chips of various seasonings) and compiled as a daily sum for the item (g/person per d). Food groups were based on the classification scheme of the USDA’s Food and Nutrient Database for Dietary Studies (FNDDS) 5.0( Reference Ahuja, Montville and Omolewa-Tomobi 33 ), with some exceptions to reflect culinary usage (e.g. butter was categorized as a ‘fat and oil’ as opposed to a dairy product) and the dietary habits of Inuit. Due to database limitations, foods reported as mixed dishes/recipes (e.g. pizza, sandwiches) could not be disaggregated into component ingredients. Thus, a ‘mixed dishes’ grouping was included and classified according to the dish’s primary ingredients (e.g. primarily meat dishes; primarily grain dishes). Potatoes were excluded from the vegetables grouping and included with ‘grains and starches’. Efforts were made to group market foods based on nutritional similarities (e.g. high-sugar beverages, such as fruit drinks and cola, were collectively grouped). However, food fortification practices in Canada( 34 ), such as the mandatory fortification of flour (with thiamin, riboflavin, niacin, folic acid and Fe), as well as the fortification of fruit-flavoured drinks with vitamin C (mandatory), folic acid (voluntary) and Fe (voluntary), can complicate these relationships.
Country foods were classified by species (e.g. caribou, beluga whale) and body part (e.g. meat, fats, organs). Bannock, a homemade biscuit (often considered traditional), was included with market grains and starches. The importance of food items/subgroups to total diet was characterized by: (i) mean population consumption (averaged for all participants, by region); and (ii) the percentage of recalls reporting consumption of a particular food.
Dietary sources of energy and nutrients
The CNF national food composition database( 35 ) was used to calculate energy and nutrient intakes. Nutrient composition information for foods not included in the CNF was available from an additional in-house food file (McGill School of Dietetics and Human Nutrition), as described elsewhere( Reference Egeland, Johnson-Down and Cao 10 ). Missing nutrient values for all foods were imputed following procedures described by Schakel et al. ( Reference Schakel, Buzzard and Gebhardt 36 ). The USDA FNDDS 5.0 was used to supplement missing nutrient information for market foods( Reference Ahuja, Montville and Omolewa-Tomobi 33 , Reference Montville, Ahuja and Martin 37 ). Missing nutrient values for country foods (not in the FNDDS) were imputed and/or calculated manually, based on similar food items (considering the species, body part and preparation method).
Analysis
Data management and statistical analyses were performed with SAS statistical software package version 9.4. The percentage contribution of each food subgroup to total energy and nutrient intakes was calculated for the entire population, according to the population proportion method( Reference Krebs-Smith, Kott and Guenther 38 , Reference Block, Dresser and Hartman 39 ). Nutrients analysed include energy, selected macronutrients (protein, fat, carbohydrates, total sugar, saturated fat), dietary fibre, vitamins (A, C, D, E, B12, thiamin, riboflavin) and minerals (Ca, Fe, Mg, Zn, Cu, Se, Na). Dietary supplements, which were consumed by <10 % of all IHS respondents (IHS, unpublished results), were not included in the calculation of total nutrient intakes.
Results
A total of 2595 Inuit adults (~1·3 participants per household) agreed to participate in the IHS. Complete 24h dietary recalls were available from a total of 2097 participants (1292 women and 805 men). Characteristics of the study sample are summarized in Table 1. The mean age of participants was 43 (sd 15) and 41 (sd 15) years for men and women, respectively. The mean BMI for men was 27·2 (sd 5·5) kg/m2 and 29·2 (sd 7·0) kg/m2 for women, both of which fall within the ‘overweight’ class (BMI=25–30 kg/m2) defined by WHO. The mean energy intake was 9837 (sd 5669) kJ/d (2351 (sd 1355) kcal/d) for men and 8209 (sd 4301) kJ/d (1962 (sd 1028) kcal/d) for women.
Characteristics of the study sample of Inuit adults (n 2095), by region; Inuit Health Survey, 2007–2008
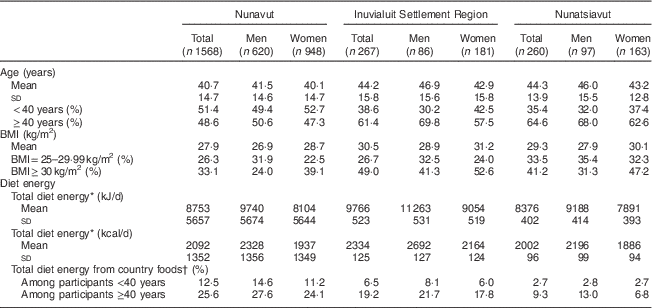
* Total diet energy excludes consumption of alcohol.
† Country foods are wild foods harvested locally through cultural practice, traditions and knowledge.
Top food items
Across all regions, the most frequently consumed country foods, in terms of percentage of recalls that reported the item, were caribou (18–39 %, by region) and fish (7–22 %, by region; Table 2). Consumption of country food meat was reported by nearly half (47·6 %) of all participants in Nunavut, about a third (34·8 %) of participants in the ISR and almost a quarter of all participants (24·6 %) in Nunatsiavut (Table 2). A notable difference in the consumption of country food fat was observed between regions (22 % of respondents in Nunavut and approximately 1 % of respondents in Nunatsiavut), coincident with the consumption of marine mammals (Table 2).
MeanFootnote * consumption (g/person per d) of country foods by adult Inuit respondents of the 24 h recall (n 2095), by region; Inuit Health Survey, 2007–2008
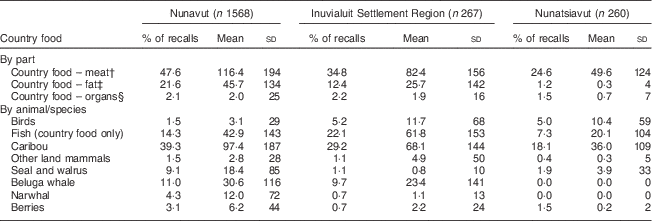
* Population mean (consumers and non-consumers), by region.
† Total meat does not include fish.
‡ Total fat includes muktuk (whale blubber and skin).
§ Total organs includes bone marrow and offal.
The most frequently reported market food items were coffee and tea (>85 % of recalls), (granulated) sugar (>65 % of recalls), sweetened beverages (44–64 % of recalls) and bread (50–80 % of recalls; Table 3). Consumption of dairy products was reported by the majority of participants (62–72 %, by region), but region-level differences were observed in the consumption of fluid milk v. powdered milk and non-dairy coffee whitener, with higher consumption of the former in Nunatsiavut. Store-bought meats (including other proteins) were reported by 68–90 % of participants, according to region. Solid fruits were consumed by less than 25 % of participants across all regions (Table 3), while solid vegetables (onions, carrots and other root vegetables) were reported by 38–59 % of respondents on the day prior to the interview.
MeanFootnote * consumption (g/person per d) of market foods by adult Inuit respondents of the 24 h recall (n 2095), by region; Inuit Health Survey, 2007–2008
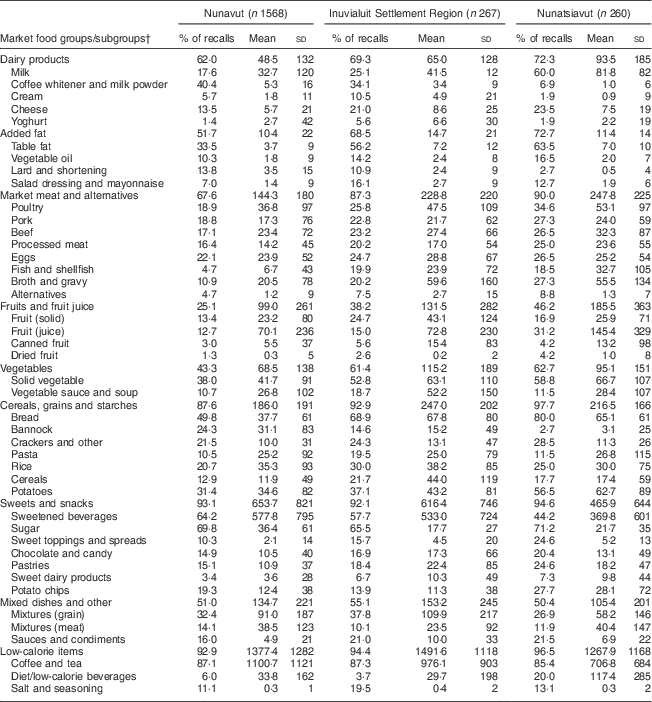
* Population mean (consumers and non-consumers), by region.
† The detailed categorization scheme for market foods is presented in the online supplementary material, Supplemental Table 2.
Top dietary sources of energy and nutrients
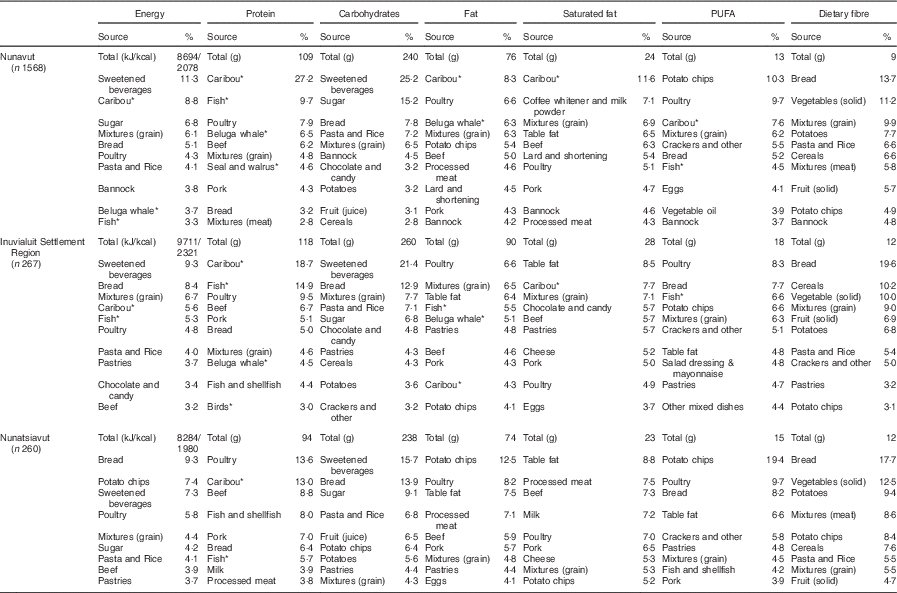
The top ten food sources of dietary energy and nutrients, including the percentage contribution of each food to total intake, are presented by region in Tables 4–6.
Percentage contribution to macronutrient and dietary fibre intakes from the top ten dietary sources among Inuit adults (n 2095), by region; Inuit Health Survey, 2007–2008
* Country food items.
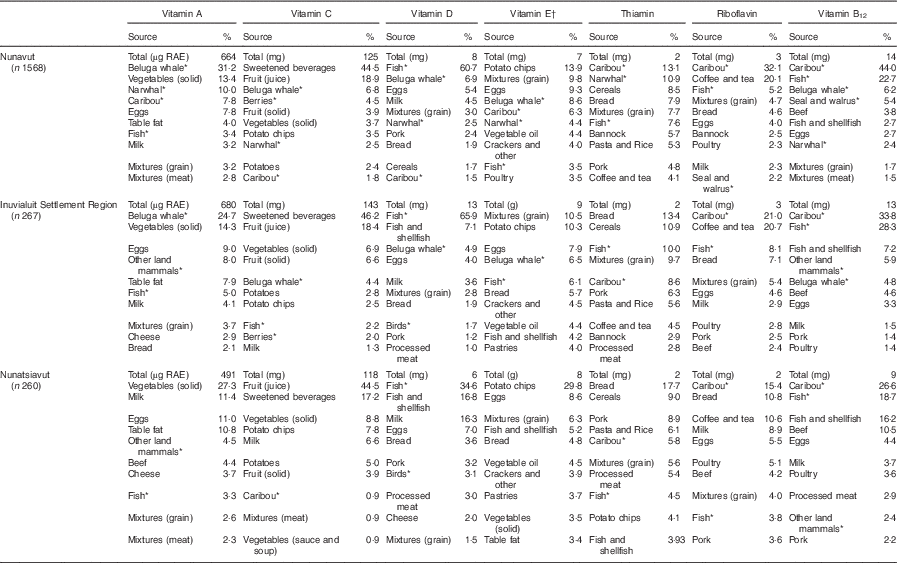
Percentage contribution to vitamin intakes from the top ten dietary sources among Inuit adults (n 2095), by region; Inuit Health Survey, 2007–2008
* Country food items.
† Vitamin E as α-tocopherol.
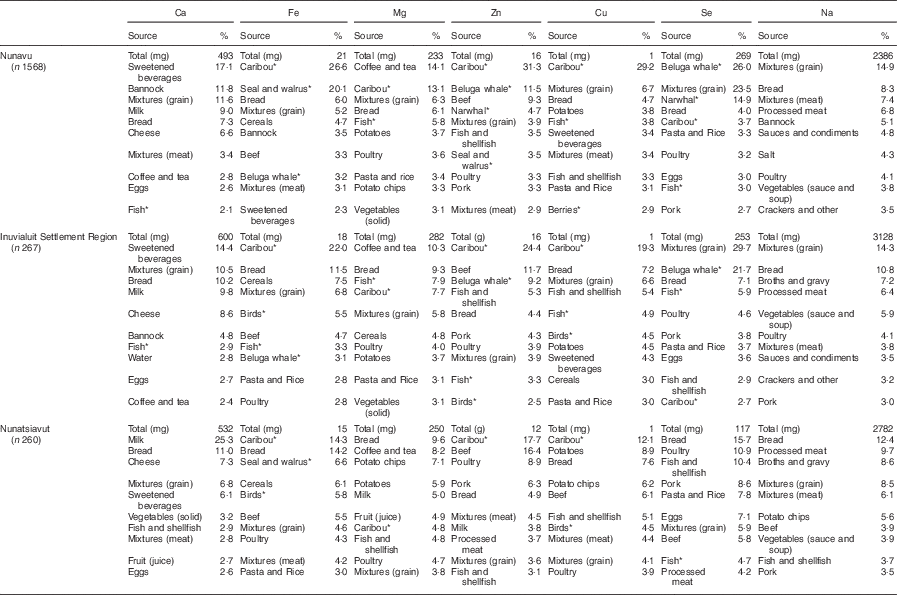
Percentage contribution to mineral intakes from the top ten dietary sources among Inuit adults (n 2095), by region; Inuit Health Survey, 2007–2008
* Country food items
Contribution of country foods to dietary intake
The contribution of country foods to total diet energy (TDE) for individuals ranged between 0 % TDE (43·5 % of all respondents) to over 50 % TDE (10·0 % of all respondents), with less than 1 % of respondents consuming 90 % or more of TDE from country foods (data not presented). The contribution of country foods to TDE for the population differed by region, and was stratified by sex and age (Table 1). In general, the contribution of country foods to TDE was lowest in Nunatsiavut, particularly among younger (<40 years) adults (2·7 %), and highest in Nunavut, particularly among older (≥40 years) adults (25·6 %).
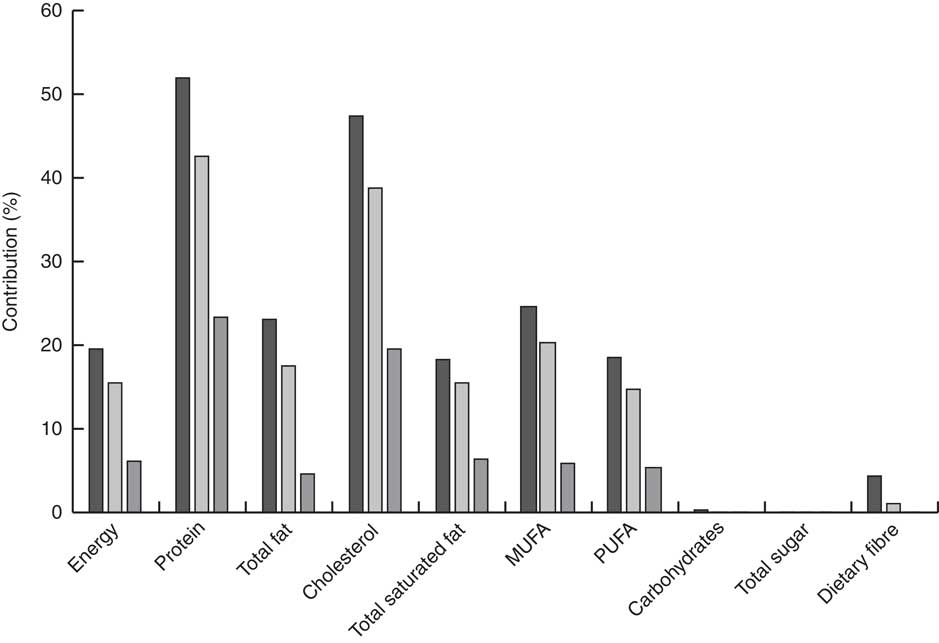
At the regional level, country foods represented a modest contribution to total diet (6·4–19·6 % TDE), but were a major source of many nutrients across all regions (Figs 2 and 3). Country foods contributed significantly to protein (23–52 %), with caribou ranking among the top two sources of protein in all regions (Table 4). Country foods were a principal source of many micronutrients (Fig. 3), namely Fe (28–54 %), niacin (24–52 %) and vitamins D (73 % in both Nunavut and the ISR), B6 (18–55 %) and B12 (50–82 %).
Percentage contribution of country foods to daily energy, macronutrient and dietary fibre intakes among Inuit adults (n 2095), by region (![]() , Nunavut;
, Nunavut; ![]() , Inuvialuit Settlement Region;
, Inuvialuit Settlement Region; ![]() , Nunatsiavut); Inuit Health Survey 2007–2008
, Nunatsiavut); Inuit Health Survey 2007–2008
Percentage contribution of country foods to micronutrient intakes among Inuit adults (n 2095), by region (![]() , Nunavut;
, Nunavut; ![]() , Inuvialuit Settlement Region;
, Inuvialuit Settlement Region; ![]() , Nunatsiavut); Inuit Health Survey 2007–2008 (RAE, retinol activity equivalents; NE, niacin equivalents)
, Nunatsiavut); Inuit Health Survey 2007–2008 (RAE, retinol activity equivalents; NE, niacin equivalents)
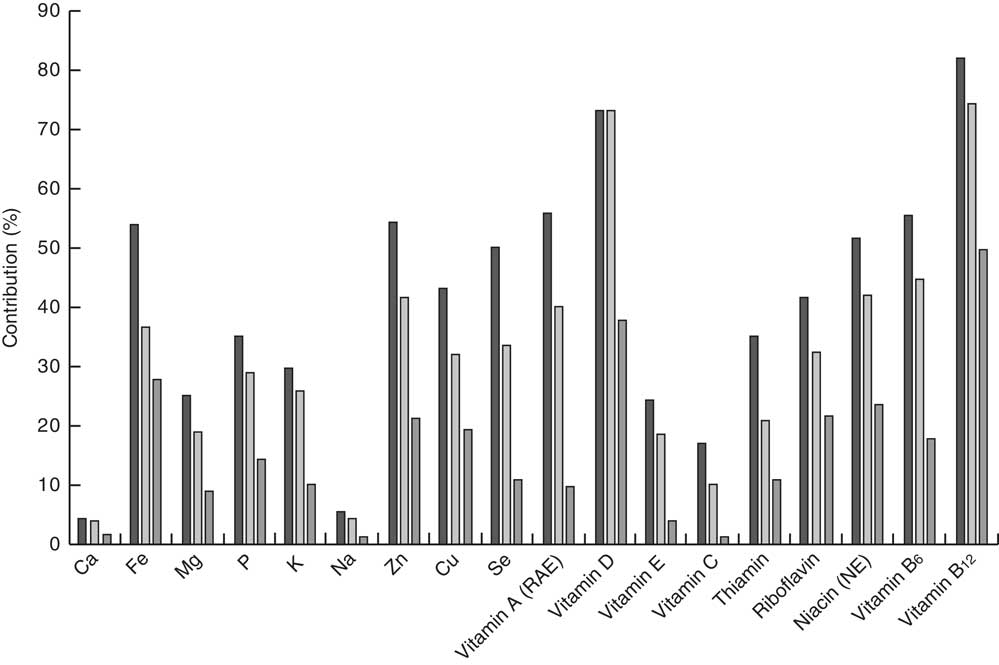
The majority of total fat (>75 %) and saturated fat (>80 %) was provided by market foods (Table 4); however, country foods were a major source of cholesterol (19·6–47·3 %; Fig. 2). Country foods collectively contributed less than 20–25 % of total MUFA in Nunavut and the ISR (Fig. 2), with beluga ranking as the principal source of MUFA in both regions (7–8 % of total intake; data not presented). Country foods contributed 18·5 % of PUFA in Nunavut and 13·6 % in the ISR (Fig. 2), which were derived principally from caribou and local fish. Country foods did not contribute significantly to carbohydrates (<0·5 %), total sugar (<0·5 %), dietary fibre (<5 %), Na (<6 %) or Ca (<5 %; Figs 2 and 3). Country foods, likewise, did not contribute significantly to vitamin C in both the ISR (10 %) and Nunatsiavut (<2 %). In Nunavut, however, country foods (beluga muktuk, arctic char and local berries) collectively contributed 17 % of total vitamin C intake (Fig. 3).
Contribution of market foods to dietary intake
Market foods accounted for the majority of TDE (80·4–93·7 %, by region). Sweetened beverages (excluding 100 % fruit juices) were the primary contributor to energy in both Nunavut (11·3 % TDE) and the ISR (9·3 % TDE), and ranked third in Nunatsiavut (7·3 % TDE), after bread and potato chips (Table 4). Collectively, sweetened beverages, added sugar and bread (the three most popular market foods, after coffee and tea) contributed approximately 20 % TDE (Table 4) while contributing minimally to most micronutrients. A notable exception was the contribution of these foods to Ca (13·2–21·4 %) and vitamins E (17–35 %) and C (as much as 50 %; Tables 5 and 6). Sweetened beverages were the number one source of Ca (14–17 %) in both Nunavut and the ISR, whereas milk was the major contributor to Ca in Nunatsiavut (25·3 %). Sweetened beverages (particularly powdered vitamin C-fortified drinks) were likewise the principal source of vitamin C in both Nunavut and the ISR, accounting for over 40 % of the population’s total intake (Table 5). In Nunatsiavut, vitamin C was derived principally from 100 % fruit juices (44·5 %), which were consumed by 30 % of the respondents on the day prior to the interview (Table 3).
Discussion
Market foods, although largely unavailable to Inuit during the first half of the 20th century, now constitute over 80 % of the total diet (based on energy). As recently as 1987, country foods provided nearly half (46·5 % TDE) of the total diet of Inuit men (based on September data from the Qikiqtaaluk region)( Reference Kuhnlein 40 ). By contrast, the highest contribution of country foods reported in the present study was just over a quarter (27·6 %) of TDE, based on older Inuit men in Nunavut. The attenuation of country food consumption has come at the expense of diet quality and nutrient adequacy, and bears important implications for the risk of obesity and chronic disease( Reference Kuhnlein, Receveur and Soueida 5 ). Consumption of sweets (including sweetened beverages, sugar added to coffee/tea, pastries, other desserts) and potato chips was reported by over 90 % of participants in the present study, while less than a quarter of participants reported consumption of solid fruits. Collectively, sweets and potato chips represented approximately a quarter of TDE (23–27 %), nearly half of total carbohydrates (42–50 %) and the vast majority of total sugar (65–79 %), while contributing less than 5–10 % of most vitamins and minerals. Notwithstanding this change, our results continue to show that country foods, despite their modest contribution to TDE, contribute substantively to the intakes of protein and many micronutrients, including Fe, vitamins D, B6 and B12, and niacin( Reference Sharma 17 , Reference Kuhnlein and Chan 41 – Reference Duhaime, Chabot and Gaudreault 45 ). These findings echo long-held local knowledge that country foods contribute importantly to nutritional well-being in Inuit communities( Reference Lambden, Receveur and Kuhnlein 46 ).
Previous research has identified dietary fibre, Ca, folate and vitamins A, D and E (and to a lesser extent, vitamin C) as nutrients of issue (i.e. consumed inadequately and/or low intakes) in the contemporary diet of Inuit in Canada( Reference Kuhnlein, Receveur and Soueida 5 , Reference Sharma, Cao and Roache 9 , Reference Egeland, Johnson-Down and Cao 10 , Reference Sharma 17 , Reference Erber, Hopping and Beck 18 , Reference Hopping, Mead and Erber 44 , Reference Johnson-Down and Egeland 47 , Reference Sharma, Hopping and Roache 48 ). Nutrients of issue, namely dietary fibre and Ca, tend to be those for which country foods are not generally considered a major contributor (<5 % of total intake). However, Ca and fibre are understudied in several country foods such as skins/muktuk (fibre) and broths (Ca). Sweetened beverages were the principal source of both Ca (up to 17 %) and vitamin C (up to 46 %) among Inuit in Nunavut and the ISR. Alternative sources of Ca and vitamin C should be identified, as sweetened beverages were the main source of total sugar across all regions (31–44 %) and consumption of high-sugar beverages in this population has been associated with an at-risk BMI( Reference Zienczuk, Young and Cao 49 ). Furthermore, nutrient intakes from fortified foods may be overestimated if the fortificant is prone to uneven dispersion in the food (e.g. settling of Ca to the bottom of carton in Ca-fortified beverages( Reference Heaney and Rafferty 50 )). Roughly half of the total Ca intake in the diet of Canadian adults is derived from milk and cheese( Reference Johnson-Down, Ritter and Starkey 51 ). By contrast, these foods contributed less than 20 % of total Ca intake in the diet of Inuit adults in Nunavut and the ISR. Country foods are an extremely rich source of Ca. Whereas one cup (250 ml) of semi-skimmed milk contains 309 mg Ca, a 100 g portion of baked whitefish, raw sculpin, raw fireweed leaves and raw arctic char skin contains 544, 429, 429 and 268 mg Ca, respectively( 35 ). Likewise, there are many vitamin C-rich country foods, including local berries, fish eggs, muktuk, caribou liver and ringed seal liver( Reference Fediuk, Hidiroglou and Madère 52 ).
Dietary recommendations based on the promotion of country foods must, however, judiciously evaluate the risks associated with the presence of environmental contaminants (e.g. Hg and persistent organic pollutants) in these foods( Reference Laird, Goncharov and Egeland 53 ). Furthermore, the diets of Indigenous Peoples, including the species/parts consumed, and the modes of food preparation (e.g. raw, cooked, fermented, dried) represent an articulation of culture and identity that embodies the multigenerational knowledge and experience of humans with local environments( Reference Kuhnlein, Receveur and Soueida 5 , Reference Kuhnlein and Receveur 54 ). For Inuit, diet selection, health and cultural identity are embedded in various facets of the food system, including the relationship between animals and humans; the relationship between the body and the soul; and life and health( Reference Borré 11 ). While traditional Arctic food systems are comprised of a rich micronutrient base, provided by a diversity of plant species and animal parts( Reference Kuhnlein, Receveur and Soueida 5 ), use of country food species’ organs in the current study, consistent with previous literature( Reference Kuhnlein, Receveur and Soueida 5 ), was very inadequate (less than 2 % of participants). The decreased use of micronutrient-rich animal parts, coupled with the broader pattern of substituting country foods with micronutrient-poor market foods, poses considerable risk of inadequate nutrition in Inuit communities( Reference Kuhnlein, Receveur and Soueida 5 ).
While dietary variations exist both between and within Inuit communities and regions, these results offer a broad perspective on Inuit dietary trends across the Canadian north. Results from our study are very similar to those reported in dietary assessments involving a more restricted community (or multiple-community) focus( Reference Hopping, Mead and Erber 44 , Reference Sharma, Hopping and Roache 48 , Reference Blanchet and Rochette 55 ). For example, our results are very similar to those previously reported by Sharma et al. (2010, 2013) for adults in Nunavut, whereby non-nutrient-dense foods contributed 30 % of energy, 73 % of sugars and 22 % of fat, while country foods contributed 56 % of protein and 49 % of Fe( Reference Sharma, Cao and Roache 9 , Reference Sharma, Hopping and Roache 48 ). While local knowledge is requisite to the development of health promotion programmes in the north( Reference Bjerregaard 56 ), programmes and policies aimed at mitigating food insecurity and promoting healthy diets may operate at broader scales (e.g. Nutrition North Canada retailer food subsidy). Likewise, external food system drivers, such as climate change, may occur and be modelled by scientists at broader scales( Reference Wesche and Chan 21 ). Targeted food security interventions are often implemented at local levels. They are often ad hoc and based on limited available data. Regional-level data are essential for informing the development of broader policies which are effectuated and administered at this scale.
Although the intent of the present study was not to compare region-level differences in diets, we observed variations in the consumption of a few market food items (i.e. fluid milk v. powdered milk and coffee whitener, as well as fruit juice v. sugar-sweetened beverages) and country foods (i.e. marine mammals) between the eastern and western Arctic. Given the differential access to marine mammals and marine fish between coastal and inland communities, results from the present study, aggregated by administrative region, may have confounded important geographic differences in dietary patterns. Marine foods are rich sources of highly unsaturated fatty acids, and Zhou et al. (2011) have previously reported pronounced regional differences in the fatty acid composition of erythrocyte membranes between coastal Inuit and inland Inuit, suggesting distinct dietary intake patterns across the north( Reference Zhou, Kubow and Egeland 26 ). While the present study suggests a modest contribution of country foods to PUFA (derived principally from caribou and local fish), given the seasonality of country food consumption, results from the study must be interpreted with caution. This highlights the importance of integrating results from dietary assessments, food composition analysis and biomarkers of human nutritional status/contaminant exposure within a sociocultural and ecological sampling framework.
Limitations
The many limitations inherent to the assessment of diet by 24 h recall must be acknowledged( Reference Shim, Oh and Kim 57 ). Validity of the 24 h recall is contingent upon the respondents’ ability to recall all foods consumed and to estimate portion sizes accurately( Reference Shim, Oh and Kim 57 ). Use of the USDA Automated Multiple-Pass Method in the present study is likely to have mitigated response bias and has been validated in other populations as an accurate measure of energy and nutrients at the group level( Reference Blanton, Moshfegh and Baer 30 ). As results from the present study are based on a single 24 h recall for each participant, results for the contribution of specific food groups to total energy intake must be interpreted with caution. The exclusion of alcohol and nutrient supplements in the present study may have resulted in an underestimation of total energy and nutrient intakes. Nevertheless, less than 10 % of participants of the IHS reported using vitamins and dietary supplements (IHS, unpublished results). As the 24 h recall was collected during a single season, results of country food consumption reflect species harvest and availability during the study period (late summer–autumn) and may differ through the year. The importance of recognizing the variability in seasonal food use in Indigenous Peoples’ food systems has been previously highlighted( Reference Kuhnlein 40 ). Finally, the strong cultural bias towards country foods may have affected reporting rates reported in the present study.
Conclusion
Consistent with long-held local knowledge, results from the present study highlight that country foods, given their rich nutrient profiles and cultural favourability, should be prioritized within strategies to promote nutrient adequacy among Inuit. Such strategies, however, must account for the human health risks of contaminant exposure and respect the ecological limits of harvest sustainability – as determined by both traditional/local knowledge and the strongest available science. Furthermore, promoting Inuit health and food security through the consumption of country foods necessitates broader ecological frameworks to support the environment and sensitive habitats of country food species. However, the present study also highlights the importance of market foods in the contemporary Inuit food system. Ultimately, policies and programmes aimed at fostering dietary adequacy and food security among Inuit should be predicated upon community-identified priorities and should affirm Indigenous food sovereignty and self-determination.
Acknowledgements
Acknowledgements: The authors wish to recognize and extend their appreciation to all participating community members, community and health organizations, nurses, technicians, Drs Grace Egeland and Kue Young, and the Steering Committees of the Canadian International Polar Year IHS. They gratefully acknowledge the National Inuit Health Survey Working Group for reviewing this manuscript and providing invaluable feedback; and extend thanks to Rita Kluktka (Health Canada) for assistance with the CNF. Financial support: The IHS was realized with funding from the Government of Canada Federal Program for International Polar Year, the Canadian Institutes of Health Research, Health Canada, the Northern Contaminant Program of the Government of Canada, ArcticNet, the Canada Research Chair Program and the Canadian Foundation for Innovation. The funders had no role in the design, analysis or writing of this article. Conflict of interest: None to declare. Authorship: T.-A.K. conducted the analyses, interpreted the data and drafted the manuscript. X.F.H. provided guidance on the interpretation of the results and input on the drafted manuscript. H.V.K. contributed to survey design and data collection, and interpretation of the study results. S.D.W. and H.M.C. guided the research and revised the drafted manuscript. Ethics of human subject participation: The survey was developed in a participatory manner, with steering committees representing the participating Inuit jurisdictions. A Certificate of Ethical Acceptability for the IHS was granted by the McGill Faculty of Medicine Institutional Review Board. Scientific Research Licences were obtained from relevant northern research granting institutions (Aurora Research Institute, Nunavut Research Institute). Ethical clearance for secondary analysis of data was granted by the University of Ottawa Health Sciences and Science Research Ethics Board (file number H05-15-16). Informed written consent was obtained from all participants.
Supplementary material
To view supplementary material for this article, please visit https://doi.org/10.1017/S1368980017003810


