


Impact Statement
Underestimation of dry regions due to drizzle bias remains a persistent limitation in statistical and deep learning-based precipitation downscaling, undermining the reliability of high-resolution products for drought assessment and hydrologic applications. This study addresses the problem by training convolutional encoder-decoder and WGAN models on both synthetic and radar-based datasets to predict high-resolution dry/wet classifications from coarse-resolution inputs under varying conditioning strategies. While convolutional encoder–decoders reproduced marginal dry/wet statistics reliably, WGAN with dry-region constraints yields more spatially coherent and physically consistent outputs, particularly regarding storm boundaries and spatial autocorrelation structure. We demonstrate that the predicted dry/wet masks offer an efficient correction mechanism for mitigating drizzle bias in existing downscaled outputs, enhancing their utility in water resource management, hydrologic modeling, and climate impact assessments.
1. Introduction
Precipitation is a fundamental driver of the hydrological cycle and underpins a wide range of applications in water resources, agriculture, flood risk assessment, and climate impact studies. However, global climate models and most reanalysis products represent precipitation at relatively coarse spatial resolutions, typically ranging from about ~0.25° to over 1°, which limits their ability to capture localized storm structure, the spatial intermittency of precipitation, and extremes (Maraun et al., Reference Maraun, Wetterhall, Ireson, Chandler, Kendon, Widmann, Brienen, Rust, Sauter, Themeßl, Venema, Chun, Goodess, Jones, Onof, Vrac and Thiele-Eich2010; Giorgi and Gutowski, Reference Giorgi and Gutowski2015; Dueben and Bauer, Reference Dueben and Bauer2018; Wang et al., Reference Wang, Tian, Lowe, Kalin and Lehrter2021; Kumar et al., Reference Kumar, Atey, Singh, Chattopadhyay, Acharya, Singh, Nanjundiah and Rao2023; Baghanam et al., Reference Baghanam, Nourani, Bejani, Pourali, Kantoush and Zhang2024; Lopez-Gomez et al., Reference Lopez-Gomez, Wan, Zepeda-Núñez, Schneider, Anderson and Sha2024). As a result, precipitation downscaling has become an essential tool for translating coarse-scale climate information into spatially refined precipitation fields suitable for hydrologic and impact-oriented applications. Dynamical downscaling based on regional climate models (RCMs) and convection-permitting models (CPMs) offers higher resolution but remains computationally expensive, making its use in long-term simulations or large ensembles prohibitive (Gao et al., Reference Gao, Shi, Zhang, Wu, Giorgi, Ji and Wang2012; Giorgi and Gutowski, Reference Giorgi and Gutowski2015; Gutowski et al., Reference Gutowski, Ullrich, Hall, Leung, O’Brien, Patricola, Arritt, Bukovsky, Calvin, Feng, Jones, Kooperman, Monier, Pritchard, Pryor, Qian, Rhoades, Roberts and Sakaguchi2020; Potter et al., Reference Potter, Chiew, Charles, Fu, Zheng and Zhang2020; Hobeichi et al., Reference Hobeichi, Nishant, Shao, Abramowitz, Pitman, Sherwood, Bishop and Green2023; Nishant et al., Reference Nishant, Hobeichi, Sherwood, Abramowitz, Shao, Bishop and Pitman2023; Rahimi et al., Reference Rahimi, Huang, Norris, Hall, Goldenson, Risser, Feldman, Lebo, Dennis and Thackeray2024). As a result, statistical and machine learning-based downscaling methods have gained momentum due to their efficiency, scalability, reduced computational demands, and rapid deployment capabilities in translating coarse-scale climate information into finer scales suitable for impact modeling (Vrac et al., Reference Vrac, Stein, Hayhoe and Liang2007; Liu et al., Reference Liu, Ganguly and Dy2020; Tabari et al., Reference Tabari, Paz, Buekenhout and Willems2021; Miralles et al., Reference Miralles, Steinfeld, Martius and Davison2022; Rampal et al., Reference Rampal, Hobeichi, Gibson, Baño-Medina, Abramowitz, Beucler, González-Abad, Chapman, Harder and Gutiérrez2024).
A vast majority of statistical downscaling efforts, however, focus primarily on correcting precipitation intensity and improving mean or variance estimates, often neglecting the characterization of dry and wet states (AghaKouchak et al., Reference AghaKouchak, Mehran, Norouzi and Behrangi2012; Mamalakis et al., Reference Mamalakis, Langousis, Deidda and Marrocu2017; Pan et al., Reference Pan, Anderson, Goncalves, Lucas, Bonfils, Lee, Tian and Ma2021; Chen et al., Reference Chen, Janke, Steinke and Lerch2024; Luo et al., Reference Luo, Zhang, Wang, Chen, Feng, Wang, Liu, Guo, Chen and Wang2025). This oversight introduces significant biases in climate risk assessments, as the misclassification of dry/wet regimes can significantly impact applications such as storm impact analysis, drought investigation, and agricultural planning, where the presence or absence of rainfall is more critical than marginal errors in precipitation amounts (Mendoza Paz and Willems, Reference Mendoza Paz and Willems2023; Vogel et al., Reference Vogel, Johnson, Marshall, Bende-Michl, Wilson, Peter, Wasko, Srikanthan, Sharples, Dowdy, Hope, Khan, Mehrotra, Sharma, Matic, Oke, Turner, Thomas, Donnelly and Duong2023; Rahimi et al., Reference Rahimi, Huang, Norris, Hall, Goldenson, Risser, Feldman, Lebo, Dennis and Thackeray2024). Particularly in arid and semi-arid regions, or during convective extremes, traditional downscaling methods often produce unrealistic drizzle or fail to preserve extended dry spells, due to treating precipitation as a purely continuous variable optimized for mean squared error rather than its intermittent nature (Maraun, Reference Maraun2016; Potter et al., Reference Potter, Chiew, Charles, Fu, Zheng and Zhang2020; Suliman et al., Reference Suliman, Awchi, Al-Mola and Shahid2020; Harder et al., Reference Harder, Hernandez-Garcia, Ramesh, Yang, Sattegeri, Szwarcman, Watson, Rolnick and Watson2023). Machine learning (ML) and deep learning (DL) approaches, especially generative adversarial networks (GANs), have recently emerged as promising tools for downscaling precipitation fields due to their capacity to learn complex, nonlinear patterns and replicate fine-scale spatial features (Leinonen et al., Reference Leinonen, Nerini and Berne2020; Scher and Peßenteiner, Reference Scher and Peßenteiner2021; Duncan et al., Reference Duncan, Subramanian and Harrington2022; González-Abad et al., Reference González-Abad, Baño-Medina and Cachá2023; Murukesh et al., Reference Murukesh, Golla and Kumar2024). GAN-based approaches have been shown to better preserve precipitation structures, spatial heterogeneity, and fine-scale variability compared to a range of conventional statistical and deterministic deep learning downscaling methods (Leinonen et al., Reference Leinonen, Nerini and Berne2020; Harris et al., Reference Harris, McRae, Chantry, Dueben and Palmer2022; Murukesh et al., Reference Murukesh, Golla and Kumar2024; Papalexiou and Mamalakis, Reference Papalexiou and Mamalakis2025).
However, even state-of-the-art GAN models tend to prioritize intensity reproduction, often failing to generate true dry regions and instead producing low-intensity spurious precipitation, especially near wet-dry boundaries (Harris et al., Reference Harris, McRae, Chantry, Dueben and Palmer2022; Papalexiou and Mamalakis, Papalexiou and Mamalakis, Reference Papalexiou and Mamalakis2025). This “drizzle bias” is not merely a technical artifact, it fundamentally distorts the representation of the hydrological cycle, compromises the reliability of precipitation patterns, and can mislead water resource assessments and climate impact analyses (Lazoglou et al., Reference Lazoglou, Economou, Anagnostopoulou, Zittis, Tzyrkalli, Georgiades and Lelieveld2024). Papalexiou and Mamalakis (Reference Papalexiou and Mamalakis2025) systematically demonstrate this challenge through a controlled experiment using synthetic storm fields. Their evaluation of multiple neural network architectures, including a Wasserstein GAN (WGAN), highlights that while WGAN outperforms conventional models in preserving spatial structure and variability in precipitation, they fail to accurately replicate the probability of zero precipitation (P 0) and produce biased representations of extreme events. Notably, none of the evaluated models, including WGAN, were able to naturally reproduce dry regions, instead producing light precipitation (drizzle bias) across all grid cells. This behavior highlights a persistent dry/wet misclassification problem that remains a fundamental challenge in precipitation downscaling research. Recent studies reinforce this observation, pointing to a general trend where downscaling efforts, whether based on deep learning, traditional statistical approaches, or hybrid models, struggle with accurately capturing precipitation intermittency and the discrete nature of rainfall occurrence (Banõ-Medina et al., Reference Banõ-Medina, Manzanas, Cimadevilla, Fernandez, Gonzalez-Abad, Cofinõ and Gutierrez2022; Nishant et al., Reference Nishant, Hobeichi, Sherwood, Abramowitz, Shao, Bishop and Pitman2023; Murukesh et al., Reference Murukesh, Golla and Kumar2024). For example, Chen et al. (Reference Chen, Janke, Steinke and Lerch2024) emphasize that despite improvements in spatial realism, many ML-based downscaling models underestimate dry days and overproduce light precipitation, failing to reproduce observed precipitation occurrence frequencies. Similarly, studies like those of Nishant et al. (Reference Nishant, Hobeichi, Sherwood, Abramowitz, Shao, Bishop and Pitman2023) and Luo et al. (Reference Luo, Zhang, Wang, Chen, Feng, Wang, Liu, Guo, Chen and Wang2025) highlight that statistical bias correction techniques often adjust mean values but do little to fix the structural misclassification between wet and dry states. Addressing this gap is critical, especially as climate change is expected to intensify precipitation extremes and alter dry spell dynamics (Berrang-Ford et al., Reference Berrang-Ford, Ford and Paterson2011; Stocker, Reference Stocker2014; Lesnikowski et al., Reference Lesnikowski, Ford, Berrang-Ford, Barrera and Heymann2015; Magnan, Reference Magnan2016; Yazdandoost et al., Reference Yazdandoost, Moradian, Izadi and Aghakouchak2021), making accurate dry/wet classification more consequential than ever. Incorporating classification-driven objectives within downscaling frameworks can substantially enhance the realism of downscaled datasets, ensuring that not only precipitation intensity but also the occurrence is accurately reproduced. Such an approach would improve hydrological model inputs, enhance the representation of precipitation occurrence and associated dry and wet conditions, and provide more actionable climate information for resource managers and policymakers.
This study proposes a generative adversarial network (GAN) framework designed to address dry/wet misclassification in precipitation downscaling. The framework incorporates explicit dry/wet classification objectives during model training to learn the spatial occurrence of precipitation, thereby reducing false wet and false dry predictions. The resulting dry/wet predictions explicitly represent the binary nature of precipitation occurrence (wet versus dry states) and can be applied as spatial masks to correct intensity-based downscaled precipitation fields. In convolutional and generative deep learning–based precipitation downscaling approaches, dry/wet corrections are often implemented using post-processing procedures based on fixed thresholds or rule-based criteria to suppress spurious low-intensity precipitation. In contrast, the proposed approach derives spatially coherent dry/wet masks directly from a data-trained generative model (WGAN), enabling the preservation of storm structure and spatial continuity. This data-driven masking strategy improves the physical consistency and interpretability of downscaled precipitation fields and reduces drizzle-related artifacts in hydrometeorological applications.
2. Data
2.1. Synthetic data
This study utilizes synthetic precipitation fields generated using the Complete Stochastic Modeling System (CoSMoS), as described in Papalexiou (Reference Papalexiou2022). CoSMoS is designed to simulate hydroclimatic fields with prescribed marginal distributions, spatiotemporal autocorrelation structures, advection velocities, and anisotropy (Papalexiou et al., Reference Papalexiou, Serinaldi and Porcu2021). Its flexibility enables the creation of synthetic precipitation fields with user-defined statistical properties, making it ideal for evaluating downscaling model performance under controlled conditions. The same dataset was used by Papalexiou and Mamalakis (Reference Papalexiou and Mamalakis2025) to assess the capability of deep learning models in precipitation downscaling tasks. In this study, synthetically generated precipitation fields at a fine spatial resolution, with a grid size of 60×60, are treated as a reference dataset, enabling controlled evaluation of downscaling models against a known ground truth. The corresponding low-resolution (6×6) synthetic fields are obtained by spatially aggregating the 60×60 fields using non-overlapping block averaging, consistent with the downscaling configuration adopted throughout the study. The grid dimensions describe the domain discretization of the synthetic fields and are not intended to represent a specific physical spatial resolution or to be spatially equivalent to radar-based datasets. Following aggregation, the 60×60 high-resolution precipitation fields were converted into binary dry/wet masks using the same thresholding procedure applied throughout the synthetic experiments, and these binary fields were used as the training targets. A total of 15,000 storm fields were used, comprising an equal mix of three distinct types: isotropic, anisotropic, and cyclonic storms. The dataset was randomly partitioned into 67% for training, 13% for validation, and 20% for testing, providing a balanced and robust approach for model development and assessment.
2.2. Radar data
To assess model performance on real-world precipitation, we utilized hourly accumulated precipitation fields from the NCEP Multi-Radar/Multi-Sensor (MRMS) system, accessed through the Iowa Environmental Mesonet (IEM). The MRMS dataset provides high-resolution precipitation measurements at $ 1\;\mathrm{km}\times 1\;\mathrm{km} $
spatial resolution, making it well-suited for evaluating the ability of the models to capture fine-scale storm structure and dry/wet boundaries. For this study, a subset of MRMS data was extracted over 600 × 600 km spatial domains from hourly precipitation fields during a three-month winter period (November–January 2023). This period was selected to capture a wide range of cold-season precipitation characteristics and spatial intermittency typical of winter storm systems, including stratiform precipitation, frontal systems, and embedded convective features, while keeping the dataset computationally manageable for analysis (Chen et al., Reference Chen, Leung, Gao, Liu and Wigmosta2023; Akinsanola et al., Reference Akinsanola, Chen, Kooperman and Bobde2024). To ensure geographical diversity and exposure to different climatic regimes, four distinct 600×600 km subregions were selected based on regional storm activity and hydroclimatic variability. The locations of these subregions are shown in Supplementary Figure S1, and their geographical details are summarized in Table 1.
$ 1\;\mathrm{km}\times 1\;\mathrm{km} $
spatial resolution, making it well-suited for evaluating the ability of the models to capture fine-scale storm structure and dry/wet boundaries. For this study, a subset of MRMS data was extracted over 600 × 600 km spatial domains from hourly precipitation fields during a three-month winter period (November–January 2023). This period was selected to capture a wide range of cold-season precipitation characteristics and spatial intermittency typical of winter storm systems, including stratiform precipitation, frontal systems, and embedded convective features, while keeping the dataset computationally manageable for analysis (Chen et al., Reference Chen, Leung, Gao, Liu and Wigmosta2023; Akinsanola et al., Reference Akinsanola, Chen, Kooperman and Bobde2024). To ensure geographical diversity and exposure to different climatic regimes, four distinct 600×600 km subregions were selected based on regional storm activity and hydroclimatic variability. The locations of these subregions are shown in Supplementary Figure S1, and their geographical details are summarized in Table 1.
Geographical locations of regions selected to extract high-resolution hourly precipitation with varied spatiotemporal patterns

Table 1. Long description
The table contains four columns: S dot No dot, Region, Latitude range, and Longitude range. Row one lists Western region, latitude 46 degrees North to 52 degrees North, longitude minus 126 degrees West to 120 degrees West. Row two lists Southeastern region, latitude 26 degrees North to 32 degrees North, longitude minus 86 degrees West to minus 80 degrees West. Row three lists Mid-South region, latitude 30 degrees North to 36 degrees North, longitude minus 100 degrees West to minus 94 degrees West. Row four lists Eastern region, latitude 40 degrees North to 46 degrees North, longitude minus 77 degrees West to minus 71 degrees West. Each region is associated with a distinct set of latitude and longitude boundaries for precipitation data extraction.
To ensure a consistent input-output configuration with the synthetic experiments, the MRMS data were subsequently preprocessed to match the same input–output configuration used during model training, consisting of 6×6 low-resolution (LR) inputs and 60×60 high-resolution (HR) targets. This was achieved through non-overlapping block aggregation of the native 1 km precipitation fields, yielding 60×60 grids at an effective resolution of 10 km and corresponding 6×6 grids at 100 km resolution. Following aggregation, the 60×60 HR precipitation fields were converted into binary dry/wet masks using the same thresholding procedure applied in the synthetic experiments as described in Section 2.1. This preprocessing ensures that the radar-based evaluation data structurally match the synthetic input–output configuration, without implying physical spatial-scale equivalence between the two datasets.
To focus performance assessment on nontrivial precipitation cases, samples exhibiting zero precipitation across the entire subregion at a given time step were excluded. This filtering step is necessary because one of the model configurations applies a hard constraint that preserves dry regions during training (Section 3.3). In that case, fully dry samples would therefore lead to trivial predictions and provide limited diagnostic value. Excluding these cases ensures that the analysis emphasizes situations requiring reconstruction of precipitation structure and accurate delineation of dry and wet areas. In total, 8,828 radar images were initially collected across the four regions. After filtering fully dry samples, 6,368 radar images remained. These samples were randomly shuffled using a fixed random seed to ensure reproducibility and then split into training, validation, and test sets containing 3,200, 1,248, and 1,920 samples, respectively. All splits were chosen to be exact multiples of the batch size (32) to ensure consistent batching during training and evaluation. The training set was used for model fitting, the validation set for hyperparameter tuning and early stopping, and the test set exclusively for performance assessment. This preprocessed radar dataset provides a rigorous benchmark for assessing the ability of the proposed models to reproduce fine-scale dry/wet precipitation occurrence and storm morphology in real-world conditions.
3. Methods
In this study, we present a deep learning-based framework that utilizes a convolutional encoder-decoder and WGAN to correct dry/wet classification bias and improve the representation of precipitation occurrence in downscaled fields. The methodology focuses on three main elements: (1) network architecture, which defines the core structure of the convolutional encoder-decoder and the WGAN, (2) training strategies incorporating different conditioning approaches, which guide the learning process to improve the representation of storm features, and (3) model evaluation using robust and interpretable performance metrics.
3.1. Convolutional encoder–decoder
We implement a convolutional encoder–decoder neural network to perform precipitation occurrence downscaling, with the objective of reconstructing high-resolution 60×60 dry/wet masks from coarse 6×6 low-resolution inputs. The network is designed to capture the spatial organization of precipitation and accurately delineate dry and wet regions. The model follows a standard encoder–decoder structure commonly used in image-to-image learning tasks (Badrinarayanan et al., Reference Badrinarayanan, Kendall and Cipolla2017; Meghani et al., Reference Meghani, Singh, Kumar and Goyal2023; Singh and Goyal, Reference Singh and Goyal2023; Abdelmoaty et al., Reference Abdelmoaty, Papalexiou, Mamalakis, Singh, Coia, Hairabedian, Szeftel and Grover2025). The encoder progressively extracts feature representations through convolutional layers with ReLU activation functions, capturing both local and large-scale spatial dependencies. Each convolutional layer is followed by a max-pooling operation that reduces the spatial resolution of the feature maps while retaining essential structural information, enabling the learning of hierarchical representations. The decoder reconstructs high-resolution binary precipitation occurrence fields using transposed convolutional layers that progressively increase spatial resolution. Feature reconstruction relies on the hierarchical representations learned by the encoder. The resulting network produces high-resolution dry/wet precipitation occurrence fields that capture the spatial organization of precipitation and accurately delineate dry and wet regions. To maintain architectural consistency with the WGAN-based generative framework, a Gaussian noise field is concatenated with the low-resolution input and provided to the encoder–decoder, although under binary cross-entropy training, the model behaves largely deterministically. A schematic of the network architecture is shown in Figure 2a.
3.2. Conditional Wasserstein GAN (WGAN)
While convolutional encoder–decoder networks can effectively capture the large-scale spatial organization of precipitation occurrence, training with deterministic loss functions often leads to overly smooth or repetitive binary patterns and limited representation of fine-scale spatial variability (Kalantar et al., Reference Kalantar, Messiou, Winfield, Renn, Latifoltojar, Downey, Sohaib, Lalondrelle, Koh and Blackledge2021; Choubey et al., Reference Choubey, Patil and Anand Kumar2024; Rampal et al., Reference Rampal, Hobeichi, Gibson, Baño-Medina, Abramowitz, Beucler, González-Abad, Chapman, Harder and Gutiérrez2024; Abdelmoaty et al., Reference Abdelmoaty, Papalexiou, Mamalakis, Singh, Coia, Hairabedian, Szeftel and Grover2025; Papalexiou and Mamalakis, Reference Papalexiou and Mamalakis2025). To address these limitations and improve the realism of downscaled dry/wet precipitation fields, we extend the encoder–decoder framework using a conditional WGAN. The WGAN consists of two components: (i) a generator (convolutional encoder–decoder) that performs precipitation occurrence downscaling and (ii) a critic network that evaluates the realism of the generated high-resolution binary outputs (Goodfellow, Reference Goodfellow2016). Unlike the original GAN formulation, which relies on an adversarial objective implemented via binary cross-entropy loss, the WGAN optimizes the Wasserstein distance, yielding improved training stability and more informative gradient signals (Arjovsky et al., Reference Arjovsky, Chintala and Bottou2017; Gulrajani et al., Reference Gulrajani, Ahmed, Arjovsky, Dumoulin and Courville2017; Creswell et al., Reference Creswell, White, Dumoulin, Arulkumaran, Sengupta and Bharath2018; Xu et al., Reference Xu, Jang-Jaccard, Liu, Sabrina and Kwak2022; Han and Guan, Reference Han and Guan2023). The inclusion of a gradient penalty (WGAN-GP) further stabilizes training and mitigates mode-collapse behavior (Gulrajani et al., Reference Gulrajani, Ahmed, Arjovsky, Dumoulin and Courville2017). The WGAN is formulated as a conditional generative model to ensure consistency between the generated high-resolution dry/wet occurrence fields and the corresponding low-resolution precipitation input. Conditioning is implemented at both components (generator and critic) of the WGAN. In the generator, the low-resolution precipitation field is provided explicitly as input and propagated through the encoder–decoder network. In the critic, the low-resolution field is concatenated with intermediate feature representations derived from the high-resolution binary field, allowing the critic to assess whether the generated dry/wet patterns are statistically consistent with the coarse-scale structure of the input (Leinonen et al., Reference Leinonen, Nerini and Berne2020; Glawion et al., Reference Glawion, Polz, Kunstmann, Fersch and Chwala2023).
As illustrated in Figure 1b, this conditioning is implemented at the feature-representation level rather than through strict pixel-wise alignment. Although these intermediate feature maps do not preserve exact spatial correspondence with either the low- or high-resolution grids, this design choice is intentional (Abdelmoaty et al., Reference Abdelmoaty, Papalexiou, Mamalakis, Singh, Coia, Hairabedian, Szeftel and Grover2025; Papalexiou and Mamalakis, Reference Papalexiou and Mamalakis2025). The aim is to enforce structural and statistical consistency across spatial scales rather than pixel-level correspondence, thereby allowing the critic to focus on large-scale coherence and the realistic spatial organization of dry/wet patterns. The generator is initialized using the pretrained encoder–decoder network (Section 3.1) and subsequently refined through adversarial training to minimize the Wasserstein distance between real and generated binary precipitation occurrence fields. This adversarial training enables the generator to learn complex spatial structures and sharper dry/wet boundaries than achievable under deterministic optimization alone. For the remainder of the study, this adversarially trained generator is referred to as the WGAN generator. The encoder–decoder generator and critic contain 121,633 and 382,729 trainable parameters, respectively (Figure 1).
The architectures of (a) convolutional encoder–decoder (Generator) and (b) critic used in this study as components of WGAN.

Figure 1. Long description
Panel a at the top outlines the generator as a convolutional encoder-decoder. The encoder starts with two parallel inputs: Coarse Image 6 by 6 and Noise distributed as N open parenthesis 0 comma 1 close parenthesis 6 by 6. These are concatenated to form 6 by 6 by 2, followed by a convolution layer 6 by 6 by 64, then max pooling 3 by 3 by 64. The decoder begins with transpose convolution 6 by 6 by 32, then convolution 14 by 14 by 32, transpose convolution 30 by 30 by 32, convolution 30 by 30 by 32, transpose convolution 60 by 60 by 32, convolution 60 by 60 by 1, and ends with a hard constraint 60 by 60. Panel b at the bottom shows the critic. The high resolution image 60 by 60 is processed by convolution 58 by 58 by 64, max pooling 29 by 29 by 64, convolution 13 by 13 by 32, max pooling 7 by 7 by 32, and convolution 6 by 6 by 8. In parallel, the coarse image 6 by 6 is concatenated, convolved to 6 by 6 by 9, then 6 by 6 by 32. Both branches are flattened and merged, followed by four dense layers with 1152, 256, 128, and 64 units, ending in the output node.
3.3. Training strategy
Models were trained using the Adam optimizer (Kingma and Ba, Reference Kingma and Ba2014) with a batch size of 32. Training was performed independently for the synthetic CoSMoS dataset and the MRMS radar dataset. For each dataset, samples were shuffled with a fixed random seed and divided into training, validation, and test sets. The validation set was used for hyperparameter selection, while the test set was reserved exclusively for performance evaluation.
To introduce stochastic variability in the generated outputs, the generator receives a stochastic noise input during both training and inference. Specifically, a noise field defined on the low-resolution grid is sampled from a standard normal distribution and concatenated channel-wise with the low-resolution precipitation input. Although the noise is sampled independently at each grid cell, the convolutional architecture of the generator transforms this input into spatially coherent variability, avoiding unphysical pixel-scale randomness and promoting realistic spatial structure. This stochastic input provides the primary source of variability in the generated dry/wet occurrence fields. When trained using a binary cross-entropy loss alone, the encoder–decoder network tends to suppress the influence of the noise input and converge toward a largely deterministic solution. In contrast, adversarial training within the WGAN framework encourages the generator to utilize the noise input to produce diverse yet realistic dry/wet spatial configurations. The critic does not generate variability itself, but instead constrains how stochastic variability is expressed by penalizing unrealistic spatial organization. As a result, the WGAN produces multiple plausible high-resolution dry/wet realizations conditioned on the same low-resolution input. For evaluation purposes, a fixed random seed is employed during inference to ensure reproducibility and consistent comparison across experiments. These models are trained and evaluated independently on the synthetic and MRMS datasets, and no transfer learning or cross-dataset generalization is assumed in this study.
To examine how different forms of low-resolution information influence precipitation occurrence reconstruction, three conditioning strategies were evaluated:
-
a) Binary input: The low-resolution input is provided as a binary dry/wet mask.
-
b) Intensity input: The low-resolution input consists of continuous precipitation intensity values.
-
c) Constrained input: In addition to intensity input, a hard dry constraint is imposed during training, which enforces that high-resolution pixels corresponding to dry low-resolution pixels remain dry.
For each conditioning strategy and model type (the convolutional encoder–decoder and the WGAN), models were trained using five independent training runs with different random initializations (seeds = [8889, 42, 100, 1025, 61]) to assess the robustness of the results with respect to stochastic training variability. This procedure is not intended as formal uncertainty quantification, but rather to evaluate the stability of model behavior across training realizations. The model output layer produces pixel-wise probabilities of wet occurrence. For evaluation, these probabilities were converted to binary dry/wet classifications using a threshold of 0.5, where values below 0.5 were classified as dry and values equal to or greater than 0.5 as wet.
3.3.1. Convolutional encoder–decoder network training
The convolutional encoder–decoder network was first trained independently as a binary precipitation occurrence downscaling model, with the objective of classifying each high-resolution pixel as dry or wet. Training was conducted for up to 500 epochs with early stopping based on validation loss, using a patience of 30 epochs to prevent overfitting. The network was optimized using the binary cross-entropy (BCE) loss, defined as
 $$ {\mathcal{L}}_{\mathrm{BCE}}=-\frac{1}{N}\sum \limits_{i=1}^N\left[{y}_i\mathit{\log}\left({\hat{y}}_i\right)+\left(1-{y}_i\right)\mathit{\log}\left(1-{\hat{y}}_i\right)\right] $$
where $ N $
is the number of pixels in a batch,
$ N $
is the number of pixels in a batch, $ {y}_i\in \left\{0,1\right\} $
is the true dry/wet label derived from precipitation values using a threshold of precipitation
$ {y}_i\in \left\{0,1\right\} $
is the true dry/wet label derived from precipitation values using a threshold of precipitation $ >0 $
, and
$ >0 $
, and $ {\hat{y}}_i\in \left[0,1\right] $
is the predicted probability of a wet pixel. The final binary prediction is obtained by applying a threshold of 0.5 to
$ {\hat{y}}_i\in \left[0,1\right] $
is the predicted probability of a wet pixel. The final binary prediction is obtained by applying a threshold of 0.5 to $ {\hat{y}}_i $
. This stage produces a deterministic encoder–decoder model trained using the binary cross-entropy loss for pixel-wise dry/wet classification.
$ {\hat{y}}_i $
. This stage produces a deterministic encoder–decoder model trained using the binary cross-entropy loss for pixel-wise dry/wet classification.
3.3.2. Conditional WGAN training
To improve the realism and spatial variability of the reconstructed dry/wet fields, the pretrained encoder–decoder network was subsequently used to initialize the generator in a conditional Wasserstein GAN with gradient penalty (WGAN-GP) framework. Under this conditional WGAN-GP formulation, the critic and generator are optimized using the following objectives. The critic loss is defined as
 $$ {\mathcal{L}}_{\mathrm{C}}={\unicode{x1D53C}}_{\overset{\sim }{x}\sim {P}_{\mathrm{g}}}\left[C\left(\overset{\sim }{x},{x}_{\mathrm{LR}}\right)\right]-{\unicode{x1D53C}}_{x\sim {P}_{\mathrm{r}}}\left[C\left(x,{x}_{\mathrm{LR}}\right)\right]+\lambda\;{\unicode{x1D53C}}_{\hat{x}}\left[{\left(\parallel {\nabla}_{\hat{x}}C\left(\hat{x},{x}_{\mathrm{LR}}\right){\parallel}_2-1\right)}^2\right] $$
where $ x\sim {P}_{\mathrm{r}} $
denotes real high-resolution binary precipitation fields drawn from the real data distribution
$ x\sim {P}_{\mathrm{r}} $
denotes real high-resolution binary precipitation fields drawn from the real data distribution $ {P}_r $
,
$ {P}_r $
, $ \overset{\sim }{x}=G\left(z,{x}_{\mathrm{LR}}\right) $
denotes generated high-resolution samples produced by the generator
$ \overset{\sim }{x}=G\left(z,{x}_{\mathrm{LR}}\right) $
denotes generated high-resolution samples produced by the generator $ G $
,
$ G $
, $ \hat{x}=\varepsilon x+\left(1-\varepsilon \right)\overset{\sim }{x} $
denotes samples interpolated between real and generated data, with
$ \hat{x}=\varepsilon x+\left(1-\varepsilon \right)\overset{\sim }{x} $
denotes samples interpolated between real and generated data, with $ \varepsilon \sim \mathrm{Uniform}\left(0,1\right) $
,
$ \varepsilon \sim \mathrm{Uniform}\left(0,1\right) $
, $ {x}_{\mathrm{LR}} $
denotes the corresponding low-resolution precipitation input used as conditioning information,
$ {x}_{\mathrm{LR}} $
denotes the corresponding low-resolution precipitation input used as conditioning information, $ {P}_{\mathrm{g}} $
denotes the distribution of generated samples,
$ {P}_{\mathrm{g}} $
denotes the distribution of generated samples,
 $$ C\left(\bullet \right)\; denotes\ the\ critic\ that\ assigns\;a\; scalar\ score\ to\ each\ sample\ conditioned\; on\;{x}_{\mathrm{LR}} $$ $ \lambda $
is the gradient penalty coefficient enforcing the Lipschitz constraint.
$ \lambda $
is the gradient penalty coefficient enforcing the Lipschitz constraint.
The generator loss is given by
 $$ {\mathcal{L}}_{\mathrm{G}}=-{\unicode{x1D53C}}_{\overset{\sim }{x}\sim {P}_{\mathrm{g}}}\left[C\left(\overset{\sim }{x},{x}_{\mathrm{LR}}\right)\right] $$
The critic was updated three times per generator update, following established practice (Gulrajani et al., Reference Gulrajani, Ahmed, Arjovsky, Dumoulin and Courville2017; Abdelmoaty et al., Reference Abdelmoaty, Papalexiou, Mamalakis, Singh, Coia, Hairabedian, Szeftel and Grover2025; Papalexiou and Mamalakis, Reference Papalexiou and Mamalakis2025). The Adam optimizer was used for both the generator and the critic, with momentum parameters $ {\beta}_1=0.5 $
and
$ {\beta}_1=0.5 $
and $ {\beta}_2=0.9 $
. The gradient penalty coefficient was fixed at
$ {\beta}_2=0.9 $
. The gradient penalty coefficient was fixed at $ \lambda =10 $
, following Gulrajani et al. (Reference Gulrajani, Ahmed, Arjovsky, Dumoulin and Courville2017). Models were trained up to 50 epochs and learning rates were selected empirically based on validation performance and training stability, with values of
$ \lambda =10 $
, following Gulrajani et al. (Reference Gulrajani, Ahmed, Arjovsky, Dumoulin and Courville2017). Models were trained up to 50 epochs and learning rates were selected empirically based on validation performance and training stability, with values of $ 1\times {10}^{-4} $
for the critic and
$ 1\times {10}^{-4} $
for the critic and $ 2\times {10}^{-4} $
for the generator.
$ 2\times {10}^{-4} $
for the generator.
4. Evaluation for dry/wet storm prediction
Evaluating the performance of deep learning models for dry/wet classification requires robust and interpretable metrics that can effectively capture both classification accuracy and spatial consistency. In this work, we focus on two key metrics: probability of zero (P₀) and spatial autocorrelation, both of which are particularly relevant in precipitation downscaling (Papalexiou and Mamalakis, Reference Papalexiou and Mamalakis2025).
4.1. Probability of zero
The probability of zero ( $ {P}_0 $
) is used to quantify the proportion of dry pixels (zero precipitation) in a given image. This metric is especially important in assessing the model’s ability to reproduce the percentage of dry/wet regions correctly (Baño-Medina et al., Reference Baño-Medina, Manzanas and Gutiérrez2020; Papalexiou, Reference Papalexiou2022; Papalexiou and Mamalakis, Reference Papalexiou and Mamalakis2025). Mathematically,
$ {P}_0 $
) is used to quantify the proportion of dry pixels (zero precipitation) in a given image. This metric is especially important in assessing the model’s ability to reproduce the percentage of dry/wet regions correctly (Baño-Medina et al., Reference Baño-Medina, Manzanas and Gutiérrez2020; Papalexiou, Reference Papalexiou2022; Papalexiou and Mamalakis, Reference Papalexiou and Mamalakis2025). Mathematically, $ {P}_0 $
is defined as the fraction of pixels with zero precipitation (dry) within an image, expressed as:
$ {P}_0 $
is defined as the fraction of pixels with zero precipitation (dry) within an image, expressed as:
 $$ {P}_0=\frac{\sum_{i=1}^N1\left({X}_i=0\right)}{N} $$
Here, N is the total number of pixels in the image, $ {X}_i $
is the binary value (0 for dry,1 for wet) at pixel i.
$ {X}_i $
is the binary value (0 for dry,1 for wet) at pixel i.
By comparing $ {P}_0 $
values between the ground truth (e.g., radar observations) and model predictions (e.g., from a convolutional encoder-decoder or WGAN), we can assess whether the model tends to overestimate wet areas or fails to capture dry zones. This is particularly critical in storm boundary detection. In addition to the mean P₀, we also evaluate the mean bias and mean root mean squared error (RMSE) between predicted and observed
$ {P}_0 $
values between the ground truth (e.g., radar observations) and model predictions (e.g., from a convolutional encoder-decoder or WGAN), we can assess whether the model tends to overestimate wet areas or fails to capture dry zones. This is particularly critical in storm boundary detection. In addition to the mean P₀, we also evaluate the mean bias and mean root mean squared error (RMSE) between predicted and observed $ {P}_0 $
values to assess systematic deviations in dryness representation.
$ {P}_0 $
values to assess systematic deviations in dryness representation.
4.2. Spatial autocorrelation
To complement the evaluation of model performance in predicting dry and wet regions, we also use lagged spatial autocorrelation to assess how well these models preserve the spatial structure of storm fields (Papalexiou and Mamalakis, Reference Papalexiou and Mamalakis2025). This metric computes the Pearson autocorrelation coefficient between the original binary storm field and its shifted version in both the horizontal (longitudinal) and vertical (latitudinal) directions, for spatial lags up to six pixels. The autocorrelation is expressed as:
 $$ r=\frac{\sum_{i=1}^N\left({X}_i-\overline{X}\right)\left({Z}_i-\overline{Z}\right)}{\sqrt{\sum_{i=1}^N{\left({X}_i-\overline{X}\right)}^2\;{\sum}_{i=1}^N{\left({Z}_i-\overline{Z}\right)}^2}} $$
Here, N denotes the total number of pixels in the field. $ {X}_i $
and
$ {X}_i $
and $ {Z}_i $
represent the binary values (0 for dry, 1 for wet) at the ith pixel in the original and spatially shifted (lagged) fields, respectively.
$ {Z}_i $
represent the binary values (0 for dry, 1 for wet) at the ith pixel in the original and spatially shifted (lagged) fields, respectively. $ \overline{X} $
and
$ \overline{X} $
and $ \overline{Z} $
are the mean values of the original and shifted fields across all pixels. Higher lagged spatial autocorrelations indicate stronger structural dependence as a function of spatial lags. Together, the probability of zero and lagged spatial autocorrelation metrics provide a comprehensive evaluation framework for dry–wet storm prediction models, combining pixel-level accuracy with structural realism across multiple spatial scales.
$ \overline{Z} $
are the mean values of the original and shifted fields across all pixels. Higher lagged spatial autocorrelations indicate stronger structural dependence as a function of spatial lags. Together, the probability of zero and lagged spatial autocorrelation metrics provide a comprehensive evaluation framework for dry–wet storm prediction models, combining pixel-level accuracy with structural realism across multiple spatial scales.
5. Results
5.1. Synthetic storm data
We evaluated the performance of the convolutional encoder–decoder and WGAN models on synthetic data using three conditioning settings: Binary input, intensity input, and constrained. For the convolutional encoder–decoder model, training and validation loss curves demonstrate distinct behaviors across the settings (Figure 2a). When training using a binary input setting, the training loss decreases steadily, but the validation loss begins to diverge after approximately 20 epochs, indicating signs of overfitting. In contrast, the intensity input setting yields better generalization, with flatter validation loss curves and reaching lower loss values, suggesting that the added precipitation intensity information helps the model learn more spatial context (Figure 2a). The most stable and lowest loss values are observed in the constrained input setting, where the inclusion of dry-region constraint leads to faster convergence and improved generalization, highlighting the benefit of incorporating physically meaningful constraints for bias correction.
Training and validation loss curves for convolutional encoder-decoder (top row, [a]) and WGAN (bottom row, [b]) models under three conditioning settings: binary input, intensity input, and constrained.

Figure 2. Long description
The top row contains three line graphs labeled a, each showing loss on the y axis and epochs on the x axis for a convolutional encoder-decoder model. From left to right: Binary Input, Intensity Input, and Constrained. In each, blue solid lines represent training loss and orange dashed lines represent validation loss. For Binary Input, both losses decrease initially, with training loss continuing to decrease and validation loss flattening and slightly increasing after 20 epochs. For Intensity Input and Constrained, both losses drop sharply in the first 10 epochs, then flatten, with training loss consistently lower than validation loss. The bottom row contains three line graphs labeled b, each showing loss on the y axis and epochs on the x axis for a W G A N model. From left to right: Binary Input, Intensity Input, and Constrained. In each, blue solid lines represent generator loss and orange dashed lines represent critic loss. For Binary Input, generator loss increases rapidly and fluctuates around 100, while critic loss remains near zero. For Intensity Input, generator loss fluctuates widely between 0 and 7000, while critic loss stays near zero. For Constrained, generator loss peaks early near 250, then decreases and fluctuates between 0 and 200, while critic loss remains near zero throughout.
For the WGAN model, the generator and critic losses exhibit the oscillatory behavior characteristic of adversarial training (Figure 2b). When conditioned on binary inputs, loss fluctuations remain within a moderate range, indicating relatively stable generator–critic dynamics. In contrast, intensity-only conditioning leads to pronounced instability, with large-amplitude oscillations in the generator loss, reflecting difficulty in maintaining adversarial balance when relying solely on intensity information. Notably, incorporating an explicit dry-region constraint substantially stabilizes training, reducing both generator and critic loss variability after the initial training phase. This behavior suggests that dry constraints act as an effective regularizer, anchoring the adversarial learning process toward physically plausible dry/wet spatial configurations and improving training stability. While WGAN-GP loss magnitudes are not absolute indicators of convergence, their relative behavior across conditioning strategies provides insight into adversarial balance and robustness. Training stability was further assessed using complementary diagnostics, including monitoring the gradient penalty term and visually inspecting the spatial coherence and diversity of generated dry/wet fields throughout training. The model did not collapse to trivial solutions (e.g., uniformly dry or wet fields), and the Constrained input configuration consistently preserved realistic dry/wet spatial structures.
The predictions by the convolutional encoder-decoder are provided in Figure 3. We observe that predictions based on the binary input setting tend to produce coarse and overly smoothed wet areas, with poor alignment to fine-scale features in the high-resolution ground truth. The model struggles to reconstruct intricate structures like spirals or narrow wet regions due to limited spatial information in the binary input setting.
Spatial representation of storm structures and dry/wet classification from synthetic test data. The first and second row displays the low-resolution and high-resolution storm fields whereas the third and fourth rows present their binary equivalents, respectively. The fifth to seventh rows illustrate the predicted high-resolution storm fields generated by a convolutional encoder-decoder model trained under the three distinct settings. The results presented here are obtained after classifying the predicted probabilities into dry (0) and wet (1) using a threshold of 0.5.

Figure 3. Long description
The layout consists of seven rows and eight columns of square panels. Each row is labeled on the left. The first row, labeled ‘Low-Resolution’, shows pixelated storm fields in pastel colors. The second row, ‘High-Resolution’, displays detailed storm structures with swirling patterns and a color bar below indicating intensity from 0 to 14. The third row, ‘Low-Res Binary’, and the fourth row, ‘High-Res Binary’, present binary versions of the first two rows, with dark blue for dry (0) and white for wet (1) regions. The fifth to seventh rows, labeled ‘Binary input’, ‘Intensity input’, and ‘Constrained’ under ‘Conv. Encoder-Decoder Predictions’, show predicted high-resolution binary storm fields from three different model settings. Each panel in these rows displays varying spatial patterns of dry and wet regions, with the most detailed structures in the ‘Intensity input’ and ‘Constrained’ rows. The bottom color bar maps binary values from 0 (dry) to 1 (wet).
The intensity input setting significantly improves the spatial accuracy and wet-region detection by the model. Fine-scale structures begin to emerge, although some noise and discontinuities persist. Similar results are produced when trained with a dry constraint. The WGAN model also exhibits similar behavior regarding the three different training settings, but the generated fields show sharper dry/wet boundaries compared to the smoother outputs produced by the convolutional encoder–decoder. The wet/dry fields show improved sharpness and are much more realistic (Figure 4). Using the binary input setting, WGAN predictions lack spatial detail, often failing to recover sub-grid storm patterns.
Spatial representation of storm structures and dry/wet classification from synthetic test data. The first and second rows display the low-resolution and high-resolution storm fields, whereas the third and fourth rows present their binary equivalents, respectively. The fifth to seventh rows illustrate the predicted high-resolution binary storm fields generated by the WGAN model trained under the three distinct settings. (The results presented here are obtained after classifying the predicted probabilities into dry (0) and wet (1) with a threshold of 0.5).

Figure 4. Long description
The grid contains seven rows and eight columns. The first row, labeled Low-Resolution, shows pixelated storm intensity maps with colors from pink to green. The second row, High-Resolution, displays detailed storm structures with a color bar below ranging from 0 to 14 millimeters per hour, colored from purple to green. The third row, Low-Res Binary, and fourth row, High-Res Binary, show corresponding binary maps where dark blue indicates wet (1) and white indicates dry (0). The fifth to seventh rows, labeled W G A N Predictions, present predicted high-resolution binary storm fields for three input types: Binary input (green), Intensity input (orange), and Constrained (green). Each prediction row visually matches the structure of the high-resolution binary row to varying degrees. The bottom color bar indicates binary classification, with 0 as dry and 1 as wet. All rows are aligned by storm sample across columns.
The intensity input setting improves the resolution and extent of wet regions, but the output contains fragmented structures and some overprediction in dry zones. The constrained input setting yields similar results to the Intensity input setting, but is more physically consistent (Figure 4). The constraint makes wet regions more continuous, and dry regions better preserved. This reflects the regularizing effect of the dry constraint, which helps the generator maintain realistic spatial distributions. Overall, these visual results confirm the effectiveness of using intensity and dry-region information as conditioning inputs, with the constrained input setting consistently yielding better predictions in terms of both structure and realism. This pattern holds across both model architectures, although the convolutional encoder-decoder tends to produce smoother and more interpretable outputs, while WGAN results exhibit more pixel-level noise but sometimes sharper boundaries.
The performance of the trained models was evaluated in terms of their ability to correctly classify dry regions, quantified by the predicted probability of zero $ \Big({P}_0 $
). With the binary input setting, the convolutional encoder–decoder model displays the most pronounced bias (Bias: −8.37%, RMSE: 13.31%), with consistent underprediction of
$ \Big({P}_0 $
). With the binary input setting, the convolutional encoder–decoder model displays the most pronounced bias (Bias: −8.37%, RMSE: 13.31%), with consistent underprediction of $ {P}_0 $
(i.e., overprediction of wet areas). This behavior stems from the limited information in the binary input, which lacks precipitation intensity information and makes the model prone to misclassifying uncertain regions as wet. A slight reversal occurs only in very dry scenes
$ {P}_0 $
(i.e., overprediction of wet areas). This behavior stems from the limited information in the binary input, which lacks precipitation intensity information and makes the model prone to misclassifying uncertain regions as wet. A slight reversal occurs only in very dry scenes $ \left({P}_0>90\%\right) $
, where the model slightly overpredicts dry conditions. With the intensity input setting, performance improves substantially (Bias: 0.56%, RMSE: 2.99%). Predictions are more tightly aligned with the 1:1 line, but a consistent trend is observed: the model underpredicts dry conditions in wetter scenes
$ \left({P}_0>90\%\right) $
, where the model slightly overpredicts dry conditions. With the intensity input setting, performance improves substantially (Bias: 0.56%, RMSE: 2.99%). Predictions are more tightly aligned with the 1:1 line, but a consistent trend is observed: the model underpredicts dry conditions in wetter scenes $ \left({P}_0<50\%\right) $
, while in drier scenes
$ \left({P}_0<50\%\right) $
, while in drier scenes $ \left({P}_0>50\%\right) $
, it slightly overpredicts dry conditions, as reflected by the shift of points above the diagonal (Figure 5a). This behavior indicates that while Intensity input setting helps anchor storm structure, the model still tends to slightly exaggerate coarse-resolution conditions—dry scenes are predicted drier and wet scenes are predicted wetter. When adding the dry constraint, the model predictions are similar to the ones with the intensity input (Bias: 0.66%, RMSE: 3.06%), but with a slightly more pronounced overprediction of dryness in the mid to high
$ \left({P}_0>50\%\right) $
, it slightly overpredicts dry conditions, as reflected by the shift of points above the diagonal (Figure 5a). This behavior indicates that while Intensity input setting helps anchor storm structure, the model still tends to slightly exaggerate coarse-resolution conditions—dry scenes are predicted drier and wet scenes are predicted wetter. When adding the dry constraint, the model predictions are similar to the ones with the intensity input (Bias: 0.66%, RMSE: 3.06%), but with a slightly more pronounced overprediction of dryness in the mid to high $ {P}_0 $
range. This shift likely results from the explicit enforcement of dry-region preservation, which encourages extrapolation of dry areas and reduces false positives in wet prediction. The result is a modest dry bias that enhances physical consistency, particularly in scenes with large-scale dry conditions.
$ {P}_0 $
range. This shift likely results from the explicit enforcement of dry-region preservation, which encourages extrapolation of dry areas and reduces false positives in wet prediction. The result is a modest dry bias that enhances physical consistency, particularly in scenes with large-scale dry conditions.
Comprehensive evaluation of model performance in predicting the Probability of Zero (P₀), defined as the percentage of dry pixels (i.e., pixels with zero precipitation) in each high-resolution output. The evaluation was conducted across five independently trained model runs for each of the three conditioning settings: Binary, Intensity, and Dry Constraint. (a) Convolutional encoder–decoder model. (b) WGAN model. Each scatter plot compares the predicted P₀ against the observed P₀ across the entire test set, providing insight into model calibration, bias, and consistency in preserving dry regions.

Figure 5. Long description
The grid contains six scatter plots arranged in two rows and three columns. The top row, labeled a, represents the convolutional encoder–decoder model. The bottom row, labeled b, represents the W G A N model. Each column corresponds to a different conditioning setting: left is Binary Input, center is Intensity Input, right is Constrained. All panels plot Predicted P sub 0 percent on the y-axis against Observed P sub 0 percent on the x-axis, both ranging from 0 to 100. Each plot includes a dashed red 1 to 1 line. In the top-left panel (a, Binary Input), points are widely scattered below the 1 to 1 line, with Bias negative 8.37 and R M S E 13.32. The top-center panel (a, Intensity Input) shows points closely aligned to the 1 to 1 line, Bias 0.56, R M S E 2.99. The top-right panel (a, Constrained) has points tightly clustered along the 1 to 1 line, Bias 0.65, R M S E 3.06. The bottom-left panel (b, Binary Input) shows moderate scatter, Bias 2.83, R M S E 9.90. The bottom-center panel (b, Intensity Input) shows points near the 1 to 1 line, Bias negative 0.76, R M S E 2.97. The bottom-right panel (b, Constrained) has the tightest clustering, Bias negative 0.38, R M S E 2.64. Color density indicates point concentration, with yellow for high density and purple for low.
For WGAN, predictions based on the binary input setting show reduced bias compared to the convolutional encoder-decoder (Bias: 2.83%, RMSE: 9.90%), but exhibit greater spread across samples. Using intensity input setting improves alignment with the 1:1 line (Bias: −0.76%, RMSE: 2.97%) and reduces spread, but the model still underpredicts dry conditions. The constrained input setting provides the most balanced performance for WGAN (Bias: −0.38%, RMSE: 2.64%), with predictions closely following the 1:1 line across the full range. The dry constraint appears to shift the model’s tendency by reducing a negative bias from −0.76% (in the Intensity input setting) to −0.38%, suggesting that the constraint helps correct underestimation of dry conditions and promotes more accurate dry-region reconstruction (Figure 5b).
Next, we evaluate the spatial structure of predicted high-resolution dry/wet fields using lagged spatial autocorrelation across pixel lags from 1 to 6 in both horizontal and vertical directions. For the convolutional encoder-decoder model (Supplementary Figure S2), the predicted lagged spatial autocorrelations using binary input setting are consistently higher than the ground truth across all lags and directions, indicating over-smoothing and exaggerated spatial persistence. This pattern is consistent in both horizontal and vertical directions and is observed across all five training runs. As the spatial lag increases, the interquartile spread widens, particularly beyond lag 3, reflecting greater variability and instability in preserving long-range spatial structure. Conditioning on intensity input improves both alignment with the ground truth and model consistency. Although the autocorrelations still slightly exceed those of the ground truth, the interquartile range becomes narrower, indicating reduced variability and improved generalization. The constrained convolutional encoder-decoder shows similar results to the Intensity input setting, showing improved structural stability and only marginal differences in lagged autocorrelation magnitude and spread across seeds. Both conditioning strategies help regularize spatial continuity while limiting excessive smoothing.
For the WGAN (Figure 6), the interquartile spread is generally narrower than in the convolutional encoder-decoder across all three training settings, indicating greater consistency across different seeds, even when using binary inputs. The WGAN trained in Intensity input setting most consistently follow the autocorrelation trend, with medians closely aligned to ground truth across all lags and directions. This suggests that intensity conditioning helps preserve both short- and long-range spatial structure. Predictions from the Binary input setting show wider variability across seeds and slightly lower correlations, particularly at higher lag (beyond lag 3), indicating limited spatial coherence when only binary dry/wet information is provided. The Constrained input setting, while maintaining high fidelity as of the intensity input setting and enhanced spatial realism, exhibits somewhat more inter-seed variability, possibly due to stricter regularization suppressing fine-scale features. Notably, in all three cases, WGAN predictions do not over-smooth the fields, as reflected by their ability to retain spatial correlation beyond short lags.
Lagged spatial autocorrelation of binary dry/wet precipitation fields for increasing spatial lags (1–6 pixels) in the horizontal (top row) and vertical (bottom row) directions. Results are shown for the synthetic test dataset under the three conditioning strategies (binary input, intensity input, and constrained). Boxplots summarize the distribution of lagged spatial autocorrelation values across five independent training runs of the WGAN models with different random initializations (teal), compared against the ground truth fields (purple). Model outputs were converted to binary dry/wet maps using a probability threshold of 0.5 prior to analysis.

Figure 6. Long description
The layout consists of two rows and three columns. The top row is labeled Horizontal Direction, the bottom row is labeled Vertical Direction. Columns from left to right are Binary Input, Intensity Input, and Constrained. Each panel plots lag (pixels) on the x-axis from 1 to 6, and correlation on the y-axis from 0 to 1. For each lag, two boxplots are shown: Ground Truth in purple and W G A N in teal. In all panels, correlation decreases as lag increases. For both directions, Ground Truth boxplots are generally higher and less variable at low lags, with W G A N distributions closely following but with greater spread, especially at higher lags. The Binary Input panels show the steepest decline in correlation with lag, while Intensity Input and Constrained panels show more gradual decreases. The legend at the bottom identifies Ground Truth and W G A N colors. All model outputs are thresholded at 0.5 probability before analysis.
Overall, the integration of intensity and dry-region constraint substantially improves the performance of both convolutional encoder-decoder and WGAN models in predicting high-resolution dry/wet fields. While intensity input settings enhance the spatial localization of wet regions, the dry constraint setting provides an additional regularizing effect, reinforcing physical consistency and enhanced spatial realism. The convolutional encoder–decoder exhibits similar or slightly better performance to the WGAN regarding the marginal statistics of the dry/wet fields (see probability of zero in Figure 5 and more statistics in the Supplementary Figures S5 and S6), but they tend to produce overly smooth outputs with inflated spatial coherence. In contrast, WGAN fields, though sometimes noisier, better align with targeted spatial structures and maintain stronger consistency across different initialization seeds.
5.2. Radar-based storm data
The training of both convolutional encoder–decoder and WGAN models on radar-based precipitation data reveals several important patterns, many of which align with what was observed during training on synthetic storm data (Supplementary Figure S3). For the convolutional encoder–decoder model, all three training settings (binary input, intensity input, and constrained input) demonstrate similar behavior to the training using synthetic data (Figure 2a) with steady reductions in training loss, while the validation loss reaches a plateau with the first 20 epochs (Supplementary Figure S3a). When using the dry constraint, the most favorable training is achieved, with both training and validation losses reaching consistently lower values than other settings and converging more smoothly, which reflects improved robustness and more physically consistent learning of dry/wet patterns. The WGAN also shows similar oscillatory training behavior to that observed on synthetic data (Supplementary Figure S3b). Generator loss exhibits large fluctuations under the Binary Input configuration, but these fluctuations become significantly narrower under the Intensity input and Constrained input settings. The difference in fluctuation range between synthetic and radar-based training may partly reflect differences in the scale of the conditioning inputs. In the synthetic experiments, the aggregated low-resolution intensity field can reach maximum values of approximately 1400 when the 60×60 synthetic precipitation fields are accumulated into 6×6 grids. In contrast, radar-based inputs correspond to hourly precipitation rates with maximum values on the order of several mm h−1, resulting in a substantially smaller input magnitude. The difference in scale likely produces smoother gradients during optimization and contributes to differences in the observed fluctuation ranges (Figure S3b). Additionally, while the critic loss appears relatively flat across configurations, its magnitude alone does not provide a direct indication of training stability in WGAN-GP. The generator loss curves show different fluctuation patterns across conditioning settings, which may reflect differences in adversarial training dynamics under the different conditioning strategies.
Prediction results on radar-based precipitation data, shown in Figures 7 and 8, demonstrate the significant differences in dry/wet classification accuracy across conditioning strategies and model architectures. As seen previously with synthetic data, using binary input setting yields the poorest fidelity in both convolutional encoder-decoder and WGAN models. The predictions under this setting are overly coarse and tend to underestimate wet regions, largely replicating the blocky structure of the low-resolution binary input rather than the nuanced patterns observed in the high-resolution target. This issue is especially apparent for smaller storm cells and isolated wet areas, which are either entirely missed or exaggerated in extent. The convolutional encoder-decoder predictions based on binary input setting produce relatively large contiguous wet regions that do not align well with the ground truth, while WGAN predictions are more textured but still misrepresent the exact shape and spatial extent of wet zones (Figures 7, 8).
Spatial representation of storm structures from the Radar dataset test sample and predictions from convolutional encoder–decoder models trained under the three conditioning settings. The first and second rows display the low-resolution and high-resolution precipitation fields, whereas the third and fourth rows show their corresponding binary fields. The fifth through seventh rows illustrate the predicted high-resolution fields generated under the binary, intensity, and constrained Input settings. The results presented here are obtained after converting predicted probabilities into dry (0) and wet (1) using a threshold of 0.5.

Figure 7. Long description
From the top left, the first row displays six low-resolution precipitation fields with blocky color patches, labeled Low-Resolution. The second row shows corresponding high-resolution precipitation fields with finer spatial detail, labeled High-Resolution. Both rows use a horizontal colorbar below the second row, ranging from 0 to 5 millimeters per hour, with colors from pink to green. The third row presents low-resolution binary fields, labeled Low-Res Binary, where dark blue indicates wet and white indicates dry. The fourth row shows high-resolution binary fields, labeled High-Res Binary, with more granular blue regions. The fifth to seventh rows are labeled Conv. Encoder-Decoder Predictions, with left-side labels for Binary Input, Intensity Input, and Constrained. Each of these rows contains six predicted high-resolution binary fields, with blue and white regions indicating wet and dry, respectively. The bottom colorbar, labeled Binary (0: Dry, 1: Wet), anchors the binary classification. The spatial evolution from top to bottom demonstrates increasing resolution and the effect of different model conditioning settings on predicted storm structure.
Spatial representation of storm structures from the Radar dataset test sample and predictions from the WGAN trained under the three conditioning settings. The first and second rows display the low-resolution and high-resolution precipitation fields, whereas the third and fourth rows show their corresponding binary fields. The fifth to seventh rows illustrate the predicted high-resolution fields generated under the binary, intensity, and constrained input settings. The results presented here are obtained after converting predicted probabilities into dry (0) and wet (1) using a threshold of 0.5.

Figure 8. Long description
From top to bottom, the first row shows low-resolution precipitation fields with coarse color blocks. The second row displays high-resolution precipitation fields with finer, more detailed color gradients. Both use a horizontal colorbar below the second row labeled Intensity in millimeters per hour, ranging from zero to five. The third row presents low-resolution binary fields, with dark blue for wet and white for dry, showing blocky patterns. The fourth row shows high-resolution binary fields with more intricate wet-dry boundaries. The fifth to seventh rows are labeled W G A N Predictions, with blue sidebars indicating Binary input, orange for Intensity input, and green for Constrained input. Each of these rows contains high-resolution binary fields predicted under the respective input setting, visually similar to the true high-resolution binary fields but with subtle differences in wet-dry spatial distribution. The bottom colorbar, labeled Binary zero for dry and one for wet, anchors the binary rows. All columns align spatially, allowing direct comparison across input and prediction types for each storm sample.
When using intensity as an input, both models exhibit some improvements. The added gradient and structure in the low-resolution intensity input may provide additional spatial information, which could help the networks to better localize precipitation regions. The convolutional encoder-decoder predictions become more confined, with the focus on the spatial extent of comparatively large contiguous wet zones matching the high-resolution target (Figure 7). The Intensity input setting improves spatial coherence, enabling more realistic storm patterns, but often overestimates wet area extent, especially in WGAN predictions. Notably, the constrained input setting consistently yields the most faithful reconstructions of high-resolution binary fields for both the convolutional encoder-decoder and the WGAN. It effectively suppresses false positives in dry regions and recovers sharper wet-dry boundaries, demonstrating that dry-region guidance significantly enhances physical realism in the generated outputs (Figure 8). Nevertheless, both models clearly benefit from the richer input, capturing small storm patches and distinguishing dry regions more accurately than in the binary input setting. The most accurate outputs are again achieved by the WGAN when it is constrained.
Regarding the overall predicted probability of zero ( $ {P}_0 $
; see Figure 9), for the convolutional encoder–decoder, the binary input setting shows the largest spread from the 1:1 line, with a near-zero bias (0.02%) and an RMSE of 7.67% (Figure 9a). The spread is particularly pronounced at mid-to-high observed
$ {P}_0 $
; see Figure 9), for the convolutional encoder–decoder, the binary input setting shows the largest spread from the 1:1 line, with a near-zero bias (0.02%) and an RMSE of 7.67% (Figure 9a). The spread is particularly pronounced at mid-to-high observed $ {P}_0 $
values, indicating greater variability in predicted dry fractions under this input configuration. Introducing Intensity input improves the agreement with observations: RMSE drops to 2.80% and predictions align more closely with the 1:1 line, though a slight positive bias of 1.07% is observed. Under the constrained input setting, predictions remain closely clustered around the diagonal with reduced outliers, yielding an RMSE of 3.06% and a bias of 1.48%.
$ {P}_0 $
values, indicating greater variability in predicted dry fractions under this input configuration. Introducing Intensity input improves the agreement with observations: RMSE drops to 2.80% and predictions align more closely with the 1:1 line, though a slight positive bias of 1.07% is observed. Under the constrained input setting, predictions remain closely clustered around the diagonal with reduced outliers, yielding an RMSE of 3.06% and a bias of 1.48%.
Comprehensive evaluation of model performance in predicting the Probability of Zero (P₀) from a test sample of radar data. The evaluation was conducted across five independently trained models for each of the three conditioning settings: Binary, Intensity, and Dry Constraint. (a) Convolutional encoder–decoder model. (b) WGAN model.

Figure 9. Long description
Top row panels correspond to the convolutional encoder–decoder model, labeled (a) on the left. Bottom row panels correspond to the W G A N model, labeled (b) on the left. Each panel plots predicted P sub 0 percent on the y axis against observed P sub 0 percent on the x axis, both ranging from 0 to 100 percent. The leftmost column is labeled Binary Input, the middle column Intensity Input, and the rightmost column Constrained. In the top left panel (a, Binary Input), bias is 0.02 and R M S E is 7.67. In the top middle panel (a, Intensity Input), bias is 1.07 and R M S E is 2.80. In the top right panel (a, Constrained), bias is 1.48 and R M S E is 3.06. In the bottom left panel (b, Binary Input), bias is negative 1.36 and R M S E is 6.13. In the bottom middle panel (b, Intensity Input), bias is negative 0.16 and R M S E is 1.80. In the bottom right panel (b, Constrained), bias is negative 0.49 and R M S E is 1.98. All panels show a dense cluster of points along the 1 to 1 line, with the tightest clustering and lowest R M S E in the intensity and constrained input conditions, especially for the W G A N model.
Across all input settings, the convolutional encoder–decoder tends to slightly overestimate dry region in cases with higher observed dryness ( $ {P}_0>50\% $
), indicating a tendency to underpredict wet conditions in relatively dry fields. The WGAN exhibits similar overall behavior but with smaller errors (Figure 9b). Under binary input setting, the WGAN predictions exhibit a negative bias of –1.36% and an RMSE of 6.13%, with a greater spread relative to the intensity-based setting. The performance improves significantly under intensity input setting, where RMSE decreases to 1.80% and the bias is reduced to –0.16%, with predictions closely aligned along the 1:1 line. The Constrained input setting achieves similar strong performance with an RMSE of 1.98% and a bias of –0.49%. While a slight underestimation of
$ {P}_0>50\% $
), indicating a tendency to underpredict wet conditions in relatively dry fields. The WGAN exhibits similar overall behavior but with smaller errors (Figure 9b). Under binary input setting, the WGAN predictions exhibit a negative bias of –1.36% and an RMSE of 6.13%, with a greater spread relative to the intensity-based setting. The performance improves significantly under intensity input setting, where RMSE decreases to 1.80% and the bias is reduced to –0.16%, with predictions closely aligned along the 1:1 line. The Constrained input setting achieves similar strong performance with an RMSE of 1.98% and a bias of –0.49%. While a slight underestimation of $ {P}_0 $
is observed for very dry cases (
$ {P}_0 $
is observed for very dry cases ( $ {P}_0>50\%\Big) $
, but overall the results indicate improved consistency in predicted dry-region fractions. In general, both models benefit from intensity-based inputs, while the addition of dry-region constraints provides further improvements in prediction consistency, particularly for the WGAN framework.
$ {P}_0>50\%\Big) $
, but overall the results indicate improved consistency in predicted dry-region fractions. In general, both models benefit from intensity-based inputs, while the addition of dry-region constraints provides further improvements in prediction consistency, particularly for the WGAN framework.
For the convolutional encoder–decoder, predicted fields consistently exhibit higher median correlations than the ground truth across all input settings and lag distances (Supplementary Figure S4). This is especially evident at mid-to-high lags, where the ground truth correlations naturally decay due to fine-scale variability, whereas convolutional encoder-decoder predictions maintain artificially elevated correlation. This behavior reflects the model’s tendency to produce overly smooth outputs, which suppress local noise and enhance spatial continuity beyond what is present in the actual data. Among input types, the Intensity input setting and the Constrained input setting yield slightly more controlled correlation trends compared to binary input setting, but the overall over-smoothing pattern persists. In all three settings, the convolutional encoder–decoder shows elevated interquartile variability, suggesting greater uncertainty and instability in capturing long-range spatial structures. The WGAN exhibit reduced interquartile variability compared to the convolutional encoder–decoder, in both directions, suggesting more stable spatial pattern learning (Figure 10). Notably, the intensity input and constrained input setting yield autocorrelation whose medians closely track the ground truth, across different lags. The dry constraint regularizes spatial features effectively but introduces slightly higher seed-to-seed variability. These observations highlight that while the convolutional encoder–decoder tends to over-persist spatial patterns, WGAN better capture the true spatial extent and variability of dry/wet zones.
Lagged spatial autocorrelation of binary dry/wet precipitation fields for increasing spatial lags (1–6 pixels) in the horizontal (top row) and vertical (bottom row) directions. Results are shown for the radar test dataset under the three conditioning strategies (binary input, intensity input, and constrained). Boxplots summarize the distribution of lagged spatial autocorrelation values across five independently trained WGAN with different random initializations (teal), compared against the ground truth fields (purple). Model outputs were converted to binary dry/wet maps using a probability threshold of 0.5 prior to analysis.

Figure 10. Long description
There are six panels in a two by three grid. The top row is labeled Horizontal Direction Correlation, the bottom row is Vertical Direction Correlation. Each row has three panels labeled left to right as Binary Input, Intensity Input, and Constrained. The x axis in all panels is Lag in pixels, ranging from 1 to 6. The y axis is Correlation, ranging from 0 to 1. Each panel contains boxplots for each lag value, with teal boxes representing W G A N results and purple boxes for ground truth. For both directions and all conditioning strategies, correlation decreases as lag increases. W G A N distributions generally overlap with ground truth but show greater spread, especially at higher lags. The legend at the bottom identifies Ground Truth in purple and W G A N in teal.
Similarly to the conclusions from the synthetic dataset, the constrained training leads to enhanced accuracy, physical realism, and structural alignment of dry/wet separations, especially for WGAN models. While predictions on radar data exhibit overall slightly lower performance due to real-world complexity, the relative gains introduced by using the intensity input setting and constrained input setting remain evident (see Supplementary Figures S7 and S8). Models trained with intensity input setting and constrained input setting not only achieve lower RMSE and reduced bias in terms of predicting the overall probability of dry conditions but also produce spatial patterns that better match the observed spatial autocorrelation structure. These results highlight the value of integrating a consistency constraint into data-driven downscaling frameworks to improve predictive performance, even in challenging real-world applications.
6. Discussion
To demonstrate the value of explicitly predicting dry/wet classification fields, we applied the dry/wet mask generated by the WGAN trained under the constrained input setting to post-process high-resolution precipitation intensity fields produced by separately trained intensity prediction models. These intensity models use the same architectures and training datasets described earlier for the dry/wet experiments, but are trained to predict continuous precipitation intensity rather than binary occurrence. The convolutional encoder–decoder is optimized using mean squared error (MSE) loss, while the WGAN retains the adversarial training framework with intensity fields as targets. Results for synthetic data are presented in Figures 11, 12, while corresponding results for radar data are provided in Supplementary Figures S10–S11. Both the convolutional encoder-decoder (trained with mean squared error loss) and the WGAN (trained using the Wasserstein loss with gradient penalty) were used for storm intensity prediction; however, these models commonly exhibit drizzle bias, producing low, non-zero precipitation values in regions that should be entirely dry (Lazoglou et al., Reference Lazoglou, Economou, Anagnostopoulou, Zittis, Tzyrkalli, Georgiades and Lelieveld2024). This behavior has been reported in previous studies of machine learning–based precipitation prediction and downscaling, where models trained with MSE or adversarial losses tend to underestimate the occurrence of truly dry events. To address this, we applied the binary dry/wet mask generated by the WGAN trained in the constrained input setting to the predicted intensity fields, effectively eliminating spurious low-intensity values and enforcing the spatial dryness constraint. This correction significantly improved the realism and accuracy of the downscaled precipitation fields. In the synthetic data use-case, the uncorrected WGAN outputs exhibited a pronounced drizzle bias, which is also reflected in the flat-line behavior in the probability of zero ( $ {P}_0 $
) plots, where predicted
$ {P}_0 $
) plots, where predicted $ {P}_0 $
values remained systematically lower than the observed values. Applying the dry/wet mask corrected this behavior. Specifically, the raw downscaled precipitation fields showed a substantial negative bias in
$ {P}_0 $
values remained systematically lower than the observed values. Applying the dry/wet mask corrected this behavior. Specifically, the raw downscaled precipitation fields showed a substantial negative bias in $ {P}_0 $
(−50.35%) and a high RMSE (58.45%), indicating a consistent overestimation of wet conditions (Figure 11a). After correction, the predicted P₀ values aligned closely with the 1:1 reference line, with the bias reduced to −0.54% and the RMSE to 2.93%. This substantial improvement demonstrates that integrating explicit dry-region awareness through classification masks meaningfully enhances the model’s ability to reproduce realistic dry/wet distributions in high-resolution downscaled precipitation fields.
$ {P}_0 $
(−50.35%) and a high RMSE (58.45%), indicating a consistent overestimation of wet conditions (Figure 11a). After correction, the predicted P₀ values aligned closely with the 1:1 reference line, with the bias reduced to −0.54% and the RMSE to 2.93%. This substantial improvement demonstrates that integrating explicit dry-region awareness through classification masks meaningfully enhances the model’s ability to reproduce realistic dry/wet distributions in high-resolution downscaled precipitation fields.
Improved dry/wet prediction and spatial structure following correction. (a) Applying a predicted dry/wet mask to WGAN-generated precipitation fields substantially reduces bias and RMSE in dry-pixel prediction (P₀). (b) Corrected outputs exhibit lagged spatial autocorrelations that more closely track the ground truth in both horizontal and vertical directions, indicating improved spatial coherence.

Figure 11. Long description
In the top row, the left scatterplot is titled ‘Observed vs W G A N’ with x-axis labeled Observed Po percent and y-axis labeled W G A N Po percent. The plot shows a dense cluster of points along the x-axis, with a dashed one-to-one line. Bias is minus 50.35 percent and R M S E is 58.45 percent. The right scatterplot is titled ‘Observed vs Corrected W G A N’ with x-axis labeled Observed Po percent and y-axis labeled Corrected Po percent. Points are tightly clustered along the one-to-one line. Bias is minus 0.54 percent and R M S E is 2.93 percent. In the bottom row, the left boxplot is titled ‘Horizontal Spatial Correlations’ with x-axis labeled Lag from 1 to 7 and y-axis labeled Correlation from 0 to 1. Three boxplot groups per lag represent Ground Truth (black), W G A N Prediction (cyan), and Corrected Prediction (magenta). The right boxplot is titled ‘Vertical Spatial Correlations’ with the same axes and color scheme. For both spatial correlation plots, corrected predictions closely track ground truth across lags, while W G A N predictions deviate more at higher lags.
Enhanced realism in corrected precipitation fields. Corrected images, generated by masking WGAN-predicted intensities using the dry/wet classification, show improved alignment with the ground truth, eliminating false wet areas and preserving sharper storm boundaries. (White space is represented as dry regions, whereas negative predictions from WGAN are represented with brown color).

Figure 12. Long description
From left to right, each row displays: Column one, Low-Res Input, with coarse pixelated color blocks; column two, High-Res Image, showing detailed storm spirals and gradients; column three, Predicted Intensity, with smoother but sometimes overextended wet regions, including negative values in brown; column four, Dry/Wet Mask, with binary green (wet) and white (dry) segmentation; column five, Corrected Image, where predicted intensities are masked by the dry/wet classification, resulting in sharper storm boundaries and elimination of spurious wet regions. The bottom colorbars define storm intensity from 0.0 (white) to 15.0 (magenta) and dry/wet mask from 0 (white) to 1 (green). Each row represents a different storm event, with spatial features preserved and false positives reduced in the final column.
The benefits of the dry/wet mask correction extend beyond pixel-wise accuracy to improvements in spatial structure, as assessed through spatial autocorrelation in both horizontal and vertical directions. The corrected fields exhibit more stable and realistic autocorrelation patterns across all spatial lags, closely tracking the ground truth (Figure 11b, Supplementary Figure S10b). This indicates that the correction not only enhances dry/wet classification but also helps preserve spatial coherence and the structural integrity of storm systems. These quantitative improvements are further supported by visual inspection of sample storm fields (Figure 12, Supplementary Figure S11). Uncorrected WGAN outputs tend to diffusely extend light rainfall into surrounding dry areas, a clear manifestation of drizzle bias. In contrast, applying the dry/wet mask effectively delineates dry regions and storm boundaries. The corrected fields exhibit sharper edges, cleaner separation between wet and dry zones, and overall stronger visual agreement with the ground truth. Notably, fine-scale dry regions, often completely absent in the uncorrected predictions, are successfully recovered, highlighting the mask’s value in restoring both large- and small-scale storm features.
Overall, these results demonstrate the value of combining high-resolution intensity prediction with an explicit binary dry/wet mask. The predicted mask acts as a consistency constraint that guides the precipitation field toward more realistic dry/wet patterns. This two-stage modeling approach substantially reduces overestimation of wet conditions, improves the spatial organization of rainfall features, and ensures better alignment with both statistical and structural aspects of the observed data. Such physically constrained post-processing offers a practical and effective strategy for improving the realism and interpretability of deep learning-based downscaling models.
7. Conclusion
The study provides a comprehensive evaluation of deep learning-based downscaling approaches for high-resolution dry/wet classification using both synthetic and radar-based precipitation datasets. The convolutional encoder-decoder and WGAN were rigorously tested under three distinct training settings—using binary input, intensity input, and a constrained input, in order to assess their ability to reproduce spatially accurate and physically consistent dry/wet patterns. Two primary evaluation metrics were employed: the probability of zero ( $ {P}_0 $
), which measures the accuracy of dry pixel prediction, and the lagged Pearson spatial autocorrelation, which quantifies spatial coherence and structural fidelity across multiple spatial lags. Across all experiments, using intensity input setting consistently improved model performance over the binary input setting, reducing drizzle bias and enhancing the spatial localization of wet regions for both the convolutional encoder–decoder and WGAN. The constrained input setting yielded the most balanced and generalizable results, especially for the WGAN, by reinforcing the extent and continuity of dry regions and reducing the occurrence of false wet predictions. While the convolutional encoder-decoder model tended to produce smoother outputs with somewhat overestimated spatial autocorrelation, it performed stably across different random initializations, with particularly strong results when trained under the intensity input setting. In contrast, the WGAN demonstrated sharper storm boundaries and greater inter-seed consistency, particularly when conditioned on both intensity and dry-region constraint, and their spatial autocorrelations were more closely aligned with the ground truth, especially in the horizontal direction for both types of storm data, synthetic as well as radar-based. Moreover, our results clearly demonstrated that incorporating a dry/wet mask significantly improves the downscaling outputs, effectively correcting the overestimation of wet conditions and allowing for the recovery of fine-scale dry features that were often missed in raw high-resolution predictions. Ultimately, a two-stage approach of separately predicting intensity and dry/wet masks proved highly effective, demonstrating that physically informed conditioning can substantially enhance the spatial accuracy and realism of deep learning-based precipitation downscaling.
$ {P}_0 $
), which measures the accuracy of dry pixel prediction, and the lagged Pearson spatial autocorrelation, which quantifies spatial coherence and structural fidelity across multiple spatial lags. Across all experiments, using intensity input setting consistently improved model performance over the binary input setting, reducing drizzle bias and enhancing the spatial localization of wet regions for both the convolutional encoder–decoder and WGAN. The constrained input setting yielded the most balanced and generalizable results, especially for the WGAN, by reinforcing the extent and continuity of dry regions and reducing the occurrence of false wet predictions. While the convolutional encoder-decoder model tended to produce smoother outputs with somewhat overestimated spatial autocorrelation, it performed stably across different random initializations, with particularly strong results when trained under the intensity input setting. In contrast, the WGAN demonstrated sharper storm boundaries and greater inter-seed consistency, particularly when conditioned on both intensity and dry-region constraint, and their spatial autocorrelations were more closely aligned with the ground truth, especially in the horizontal direction for both types of storm data, synthetic as well as radar-based. Moreover, our results clearly demonstrated that incorporating a dry/wet mask significantly improves the downscaling outputs, effectively correcting the overestimation of wet conditions and allowing for the recovery of fine-scale dry features that were often missed in raw high-resolution predictions. Ultimately, a two-stage approach of separately predicting intensity and dry/wet masks proved highly effective, demonstrating that physically informed conditioning can substantially enhance the spatial accuracy and realism of deep learning-based precipitation downscaling.
These findings underscore the potential of deep learning models, particularly WGAN-based architectures with physically informed constraints for downscaling coarse-resolution precipitation fields into spatially detailed and physically consistent dry/wet patterns. The demonstrated improvements in both statistical accuracy and spatial structure, especially through the use of a predicted dry/wet mask, offer a practical pathway toward more reliable and interpretable downscaling outputs. Such advances are especially valuable in applications requiring high-fidelity dry/wet delineation, including drought monitoring, hydrological modeling, and storm impact assessments. Future work should explore further architectural enhancements and extend evaluations to diverse climatic regimes and storm types to better understand the models’ generalizability and robustness for real-world applications.
Open peer review
To view the open peer review materials for this article, please visit http://doi.org/10.1017/eds.2026.10039.
Supplementary material
The supplementary material for this article can be found at http://doi.org/10.1017/eds.2026.10039.
Acknowledgements
We gratefully acknowledge the financial support provided by the Environmental Institute, University of Virginia, through the Strategic Investment Fund for carrying out this research work.
Author contribution
Conceptualization: S.S., S.M.P., H.M.A., A.M.; Data curation: S.S.; Formal analysis: S.S.; Investigation: S.S., S.M.P., H.M.A.; Methodology: S.S., S.M.P., A.M.; Validation: S.S., A.M.; Visualization: S.S., H.M.A.; Writing - original draft: S.S.; Writing - review & editing: S.S., S.M.P., H.M.A., T.H., A.M.; Funding acquisition: S.M.P., T.H., A.M.; Resources: S.M.P., A.M.; Supervision: S.M.P., T.H., A.M.; Project administration: T.H., A.M.
Competing interests
The authors declare none.
Data availability statement
The CoSMoS R package (Papalexiou et al., Reference Papalexiou, Serinaldi and Porcu2021) used for generating storms, is available at CRAN (R Core Team, 2021; https://cran.r-project.org/web/packages/CoSMoS/vignettes/vignette.html).
The hourly precipitation data used in this study were obtained from the NCEP Multi-Radar/Multi-Sensor (MRMS) system, accessed via the Iowa Environmental Mesonet (IEM) platform (https://mesonet.agron.iastate.edu/GIS/rasters.php?rid=4). The MRMS dataset provides high-resolution precipitation estimates at a 1 km × 1 km spatial scale and is publicly available for research purposes. These data were used to evaluate model performance on real-world storm structures and dry/wet classification accuracy. The code used for model training, inference, and evaluation is publicly available on GitHub at https://github.com/shivamsinghhada/Binary_precipitation_downscaling.
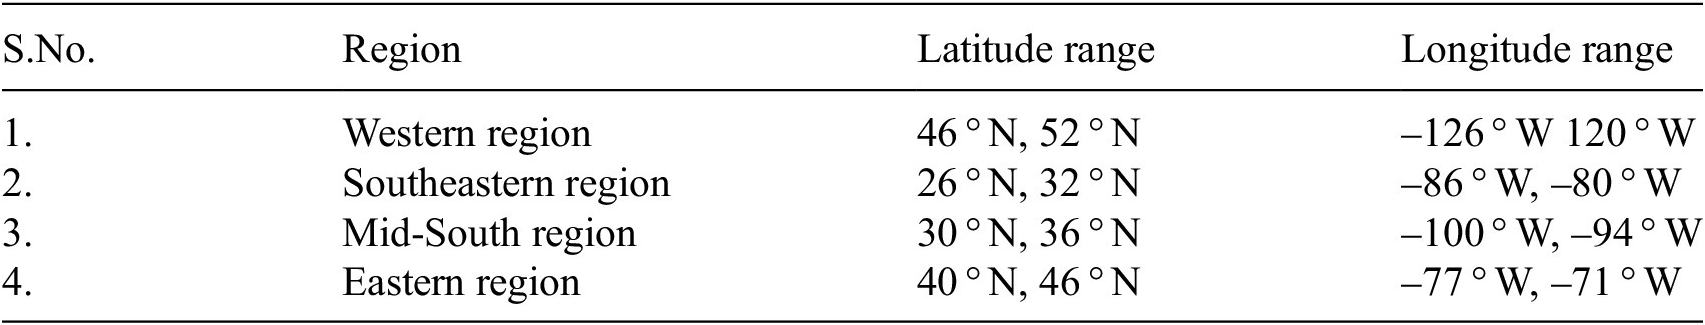


 Open access
Comments
May 19, 2025
Dear Editor,
I am pleased to submit our manuscript entitled “Correcting Dry/Wet Classification Bias in Precipitation Downscaling via Generative Adversarial Networks” for consideration in Environmental Data Science.
In this study, we address a critical limitation in data-driven precipitation downscaling: the systematic overestimation of light precipitation, or “drizzle bias,” which undermines the accurate delineation of dry zones in high-resolution climate products. We develop and evaluate U-Net and Wasserstein GAN models trained on both synthetic and radar-based precipitation datasets, employing multiple conditioning strategies—including intensity fields and dry-region constraints—to predict high-resolution dry/wet classifications. Our results demonstrate that physically informed constraints significantly enhance the spatial structure, sharpness, and reliability of dry/wet delineation, with potential utility as a correction layer for statistical and deep learning downscaling frameworks.
We believe this contribution is well aligned with the scope of Environmental Data Science, particularly its focus on machine learning applications in environmental modeling, and the need for more interpretable and physically consistent data-driven methods in hydrology and climate science.
This manuscript has not been submitted elsewhere and is original work by the authors. We respectfully request that the paper be considered for peer review, and we welcome the opportunity to contribute to your journal.
Thank you for your time and consideration.
Sincerely,
Dr. Shivam Singh
(On behalf of all co-authors)
Postdoctoral Research Associate
University of Virginia
Email: wpa8me@virginia.edu