




Building on Kuznets’ (Reference Kuznets1955) seminal work, the evolution of inequality in Western countries has been a central focus of intensive academic research (Williamson and Lindert, Reference Williamson and Lindert1980; Williamson, Reference Williamson1985; Piketty et al., Reference Piketty, Postel-Vinay and Rosenthal2006; Rossi et al., Reference Rossi, Toniolo and Vecchi2001; Prados de la Escosura, Reference Prados de la Escosura2008). While recent contributions by scholars such as Piketty (Reference Piketty2013) and Alfani (Reference Alfani2024) have advanced the reconstruction of inequality trends, showing how inequality increased through the modern period until the late 20th century, there remains a debate regarding its underlying determinants.Footnote 1 Explanations of inequality in the literature are better understood as differing in emphasis than as belonging to strictly separate economic and political-institutional camps. A number of scholars focus on market processes, capital accumulation, and labour market conditions (see, for instance, Stiglitz, Reference Stiglitz2012), but these factors are generally analysed in connection with the institutional contexts in which they operate. Piketty’s work is a clear example of this approach, since it links long-run economic dynamics to the legal, fiscal, and social institutions that shape the concentration and transmission of wealth (Piketty, Reference Piketty2013). Other contributions foreground political institutions, public policy, and power relations more explicitly, examining how they structure market outcomes and distributive patterns (Acemoglu et al., Reference Acemoglu, Johnson, Robinson, Aghion and Durlauf2005; Hacker and Pierson, Reference Hacker and Pierson2010). Taken together, this literature suggests that inequality emerges through the interaction of economic mechanisms with institutional arrangements and asymmetric power structures (Milanovic et al., Reference Milanovic, Lindert and Williamson2011; Acemoglu and Robinson, Reference Acemoglu and Robinson2012).
In this sense, several authors try to disentangle the determinants of inequality in pre-industrial societies. While van Zanden (Reference van Zanden1995) shows how economic growth could influence inequality, Alfani and Di Tullio (Reference Alfani and Di Tullio2019) and Schaff (Reference Schaff2023) depict how the increasing capacity of States affected pre-industrial inequality. Moreover, Puga and Trefler (Reference Puga and Trefler2014) and Schaff (Reference Shaff2024) indicate how political control of pre-industrial institutions significantly shaped inequality in the Venetian Republic and in Germany, respectively. Additionally, Bavel (Reference Bavel2022) shows how associational organisations developed mechanisms to help their community, preventing increases in wealth concentration among them. Similarly, research on Spain has shown that pre-industrial inequality was closely linked to the way agrarian economies were structured. The concentration of landownership affected access to productive assets, regional crop specialisation created differing income opportunities, and rural institutions shaped bargaining power and the allocation of surplus (Tello and Badia-Miró, Reference Tello and Badia-Miró2018; Santiago-Caballero, Reference Santiago-Caballero2011; Nicolini and Ramos-Palencia, Reference Nicolini and Ramos-Palencia2021; Martínez-Galarraga and Prat, Reference Martínez-Galarraga and Prat2025; Mas-Ferrer, Reference Mas-Ferrer2023). In this sense, the influence of agriculture on inequality derived from its centrality in preindustrial societies and the unequal social and institutional relations embedded within it.
This paper seeks to contribute to the literature by examining the factors that shaped land inequality at the municipal level in Aragon (Northern Spain) during the mid-19th century. This inquiry is significant for three key reasons. First, as Federico (Reference Federico2005) underscores, agriculture was the dominant global sector until the 20th century, making land a primary source of income, power, and wealth. Similarly, Pinilla (Reference Pinilla2004) highlights the agricultural sector’s crucial role in economic development, particularly during the early phases of modern economic growth in the 19th century. Understanding the evolution of land wealth accumulation is especially important in the case of Spain, where the primary sector employed over half the population until the mid-20th century. Second, recent studies have emphasised the critical role of land access in Spanish history during the 19th and 20th centuries (Simpson and Carmona, Reference Simpson and Carmona2020; Robledo, Reference Robledo2022). Thus, comprehending the determinants of specific patterns of land distribution and accumulation is essential. Finally, from the late 18th century onwards, Spain’s property market began transitioning to a capitalist structure (Garcia Sanz, Reference García Sanz, García Sanz and Garrabou1985; Gallego, Reference Gallego1998; Millán, Reference Millán2000; Pan-Montojo, Reference Pan-Montojo2018). Regions with a strong agricultural focus, significant population growth, and potential for land expansion became attractive for profitable investments in land (Gallego, Reference Gallego2001). Investigating these factors sheds light on how the transition to a market economy in a predominantly agrarian and pre-industrial society during the mid-19th century influenced inequality through property accumulation.
Thus, this article examines how first‑nature factors – geography – and second‑nature factors – market access and institutions – shaped the distribution of land in a pre‑industrial, agrarian economy. This article focuses on Aragón as a useful case study for examining the determinants of land inequality in a predominantly rural and non-industrialised context. The relevance of this region lies in the fact that it combined agrarian predominance, limited industrial development, and marked internal variation in landholding patterns. Analysing Aragón therefore makes it possible to explore how institutional arrangements, geography, and access to markets interacted in shaping the distribution of land, the principal asset in pre-industrial economies. Thus, it can help clarify the mechanisms through which different agrarian structures emerged and thus contribute to broader debates on the links between land inequality and subsequent trajectories of development. From this perspective, the central aim of the article is to use Aragón to shed light on the broader problem of how unequal agrarian societies were formed on the eve of industrialisation.
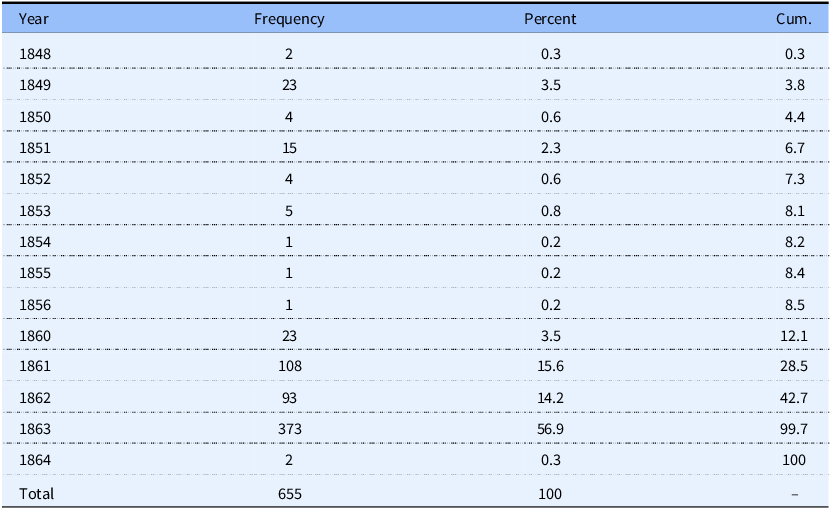
To achieve this objective, the study uses a highly detailed micro-database of land property at the taxpayer level, derived from the amillaramietos (wealth cadastres) for 635 municipalities in the provinces of Huesca and Zaragoza in northeastern Spain, created between 1848 and 1864. This dataset encompasses around 150,000 taxpayers and is closely comparable to the sources employed by Alfani for Italy (e.g., Alfani and Di Tullio, Reference Alfani and Di Tullio2019). Land inequality is reconstructed by calculating the share of land wealth held by the top 10%, top 1%, and top 0.1% of the population. Similarly, the land wealth accumulated by the bottom 50% is measured, along with the share held by those between the bottom 50% and the top 10% (the middle 40%). Additionally, the Gini index is calculated, along with the percentage of households without any land, assuming each taxpayer represents a household within the municipality. This approach enables a deeper understanding of the varying patterns of wealth distribution and inequality across different societal groups. Thus, the use of amillaramientos’ data, in conjunction with population census data and GIS information, enables the exploration of the factors that influenced the distribution of land. Nevertheless, the selection of this region is motivated by three factors. First, the availability of comprehensive data for all municipalities in the region, provided by the amillaramietos, facilitates a detailed analysis of inequality in a pre-industrial, agrarian society such as mid-19th century Spain. Second, the region encompasses a variety of agrarian systems characteristic of Spain during this period, ranging from evenly distributed communities in the Pyrenees to municipalities specialising in wine and olive oil production, although in this last crop, Aragón did not reach the degree of specialisation of other Spanish regions. Finally, unlike studies that focus on the exceptional case of Catalonia, this paper adopts an approach consistent with Santiago-Caballero (Reference Santiago-Caballero2011) and Nicolini and Ramos-Palencia (Reference Nicolini and Ramos-Palencia2021), analysing a region more representative of Spain as a whole. As the primary employer and accounting for more than 50% of exports during the 19th century, agriculture – and consequently land – represented the principal source of wealth across much of Spain. Therefore, Aragon serves as a valuable case study for agrarian regions in Spain, offering insights into land distribution prior to the onset of industrialisation.
This article aims to enrich the literature on the distribution of wealth, with a specific emphasis on land. Following the methodological lead of Piketty, Alfani, and other scholars, it relies on extensive microdata reconstructions to recover the structure of wealth inequality and the determinants that shaped it. A principal contribution of the study, despite limitations discussed below, is the exhaustive transcription and reconstruction of the amillaramiento tax registers for 635 municipalities in northern Spain. This reconstructed dataset provides a detailed snapshot of landholding patterns in the mid‑19th century and documents the pronounced socioeconomic inequality of the region. The top decile controlled the majority of both land and wealth, with the top 1% and especially the top 0.1% holding very large shares. Yet, the overall level of inequality was similar, with evidence for early 18th-century Catalonia and the early 19th-century United States (Martínez-Galarraga and Prat, Reference Martínez-Galarraga and Prat2025; Alfani, Reference Alfani2024). The findings show a spatial pattern of land distribution. The top 10%, 1%, and 0.1% concentrated their holdings in municipalities with smoother terrain, better access to markets, and larger populations. Moreover, institutions further shaped land distribution. Stronger state presence and being under Royal jurisdiction in the late 18th century were associated with higher land inequality, likely through regressive fiscal mechanisms (Alfani and Di Tullio, Reference Alfani and Di Tullio2019). In addition, the historical concentration of liberal professionals and artisans – more closely tied to the top decile in Aragon – was also linked to greater land inequality.
The remaining sections of this paper are structured as follows. Section Historical Background provides an overview of the general historical background and the case study under analysis. In the section, Inequality reconstruction: sources and variables, the sources and data are described. Section Methodology and results presents the methodology used to analyse the data and the resulting findings. Finally, the section Conclusions concludes the paper.
Historical background
As underscored by García Sanz (Reference García Sanz, García Sanz and Garrabou1985), Spain was subject to a series of structural reforms since the mid-18th century. By the mid-19th century, the dismantling of feudal structures and institutions, along with the disentailment of properties from the Church, religious entities, commonly and publicly owned properties, and entailed estates, facilitated the emergence of market-driven and capitalist relationships, replacing Ancien Régime ones (Robledo, Reference Robledo2004; Pan-Montojo, Reference Pan-Montojo2018). As articulated by Gallego (Reference Gallego2001), this transformation created a context where areas with superior connectivity, productivity, and higher urbanisation rates experienced increasing incentives for land acquisition, given the enhanced ease of bringing products to market. Moreover, similar to other European countries and most of the world during the 19th century, agriculture was the dominant sector in Spanish society, as two-thirds of the population worked in the primary sector up to 1910 (Federico, Reference Federico2005).Footnote 2 This resulted in agriculture dominating everyday life for most of Spanish society, shaping its dynamics, social relations, and economic development. For instance, Artola Blanco et al. (Reference Artola Blanco, Bauluz and Martínez-Toledano2021) calculated that by 1900 around 40% of the gross personal assets in Spain were agricultural land.
In this sense, the area of study, which comprises the provinces of Huesca and Zaragoza in Aragon (Figure 1), acted as a source for foodstuff, especially wheat for the more populated and industrialising Spanish regions during the mid-19th century, highlighting the importance of agriculture in this region. As Pinilla (Reference Pinilla Navarro1995) and Germán and Forcadell (Reference Germán, Forcadell and Garrabou1988) pointed out, Aragón supplied wheat to Barcelona through the Ebro River, although it was severely affected by the arrival of the foreign cereals by the end of the century (Sabio Alcutén, Reference Sabio Alcutén1989). For instance, in order to keep up with the rising demand for food from the increasing population, croplands in Aragon expanded during the first half of the 19th century (Pinilla, Reference Pinilla Navarro1995). In this context, the mid-19th-century expansion of the railroad facilitated the commercialisation of agricultural goods from the Ebro Valley. Notably, rail lines linking Zaragoza with Pamplona, Bilbao, and Barcelona were strategically established to integrate the agricultural produce of the Ebro Valley with the industrial Basque and Catalan regions (Barquín, Reference Barquín2007; Ormaechea, Reference Ormaechea2017).

Thus, structural reforms in the first half of the 19th century, which integrated agricultural land into the market, made agriculture the primary source of wealth in Aragón. This allowed the Aragonese elites to leverage the region’s climatic and geographical advantages, positioning agricultural products in nearby regional markets for greater profits, while regions like Catalonia industrialised. As a result, agriculture remained the main driver of economic growth in this still pre-industrial society throughout the 19th century. Opportunities created by the phylloxera plague in France in the late 19th century, the expansion of the railway, and the definitive capitalist transformation of the land market reinforced land accumulation and market integration as the primary sources of wealth – and consequently, inequality – in the region, mirroring trends in other parts of Spain and Europe where industrialisation had yet to take hold.
Figure 1 illustrates the municipalities examined in this study, encompassing all the municipalities within the Aragonese provinces of Huesca and Zaragoza.Footnote 3 While these municipalities accounted for only 6.5% of Spain’s total land area and 4.2% of its population in 1860, they offer a representative snapshot of the Spanish economy during that era. Table 1 provides an overview of the main employment sectors for 1860 in the provinces of Huesca and Zaragoza and Spain.Footnote 4 Although in the analysis population variables are extracted from the 1787 census, Table 1 shows a snapshot of the region under study during the creation of the amillaramiento, which is the main data source for this article.
% of Population (over 16 years old) by employment in 1860

Source: Own elaboration from the population census of 1860.
As it can be seen in Table 1, the economic structure of Huesca and Zaragoza is closely parallel to that of the rest of Spain. The primary distinction lies in the relatively lower level of industrialisation within the study area, as indicated in columns 2 and 6. This underlines the prominence of agriculture in the economic landscape of the Aragonese society, where land was the primary recipient of investments, as opposed to industries, as was the case in Catalonia (Garrabou et al., Reference Garrabou, Plana and Saguer2001). Additionally, while the number of farm day labourers was similar between Aragon and Spain, ownership and rental patterns exhibited variations. On one hand, renting in Aragon appeared to be less common compared to Spain. On the other hand, notable disparities in ownership were observed in Huesca in comparison to the province of Zaragoza and Spain. Although the 1860 population census does not explicitly define the category ‘owners’, its placement beside ‘tenants’ in the census’ table and the simultaneous listing of other owner types indicate that it refers specifically to landowners. Under this interpretation, the reported figures suggest a more dispersed pattern of landownership in Huesca than in Zaragoza or in Spain overall.
This inference must be tempered by the census’s method of recording professions or trades, which may not reflect individuals’ actual economic activities. An individual could declare ‘shoemaker’ as a trade while working seasonally as an agricultural day labourer when artisan work was unavailable. Therefore, the statistics in Table 1 should be treated with caution. They capture broad tendencies rather than precise occupational or landholding statuses, and they are consistent with the view that Huesca and Zaragoza followed a productive‑structure pattern broadly similar to the national one. In conclusion, despite some distinctions between the area under study and the broader Spanish context, the examination of a substantial number of municipalities (over 650) and their diverse characteristics, as it will be seen in the next section, renders this region a robust representation of mid-19th-century Spain.
Inequality reconstruction: sources and variablesFootnote 5
Sources
The primary data source for this study is the amillaramientos, a property cadastre established by each municipality following the fiscal reform of 1845 (Comín and García García, Reference Comín and García García1995). This cadastre was used to tax individuals owning land and/or buildings within Spanish municipalities. It recorded detailed information about property owners and the characteristics of their holdings (Vallejo Pousada, Reference Vallejo Pousada2000). Similar to the estimi used by Alfani (e.g., Alfani, Reference Alfani2015; Alfani and Di Tullio, Reference Alfani and Di Tullio2019), the amillaramientos required each municipality to document and valuate all property owners, including those with land, buildings, or animals within its jurisdiction. The amillaramientos thus provided a comprehensive list of individuals, detailing their properties in terms of number and value, including all property holders within the municipality, regardless of whether they resided locally or elsewhere.
Before discussing the source in detail, three remarks are necessary. First, with respect to the possibility that a proprietor may hold land in different municipalities, it is important to note that this study focuses on the distribution of land within municipalities. Therefore, although an individual resident of municipality A may also hold land in neighbouring municipality B and thus appear on B’s amillaramiento, this should not bias the estimates or affect the study’s conclusions. Second, the amillaramiento recorded both proprietors and tenants. However, this study includes exclusively proprietors, and when tenants appear (which was relatively uncommon), the assessed value of the leased property is identified, subtracted from the tenant’s total recorded holdings, if any, and incorporated into the corresponding proprietor’s land value to preserve a consistent measure of ownership for the analysis.
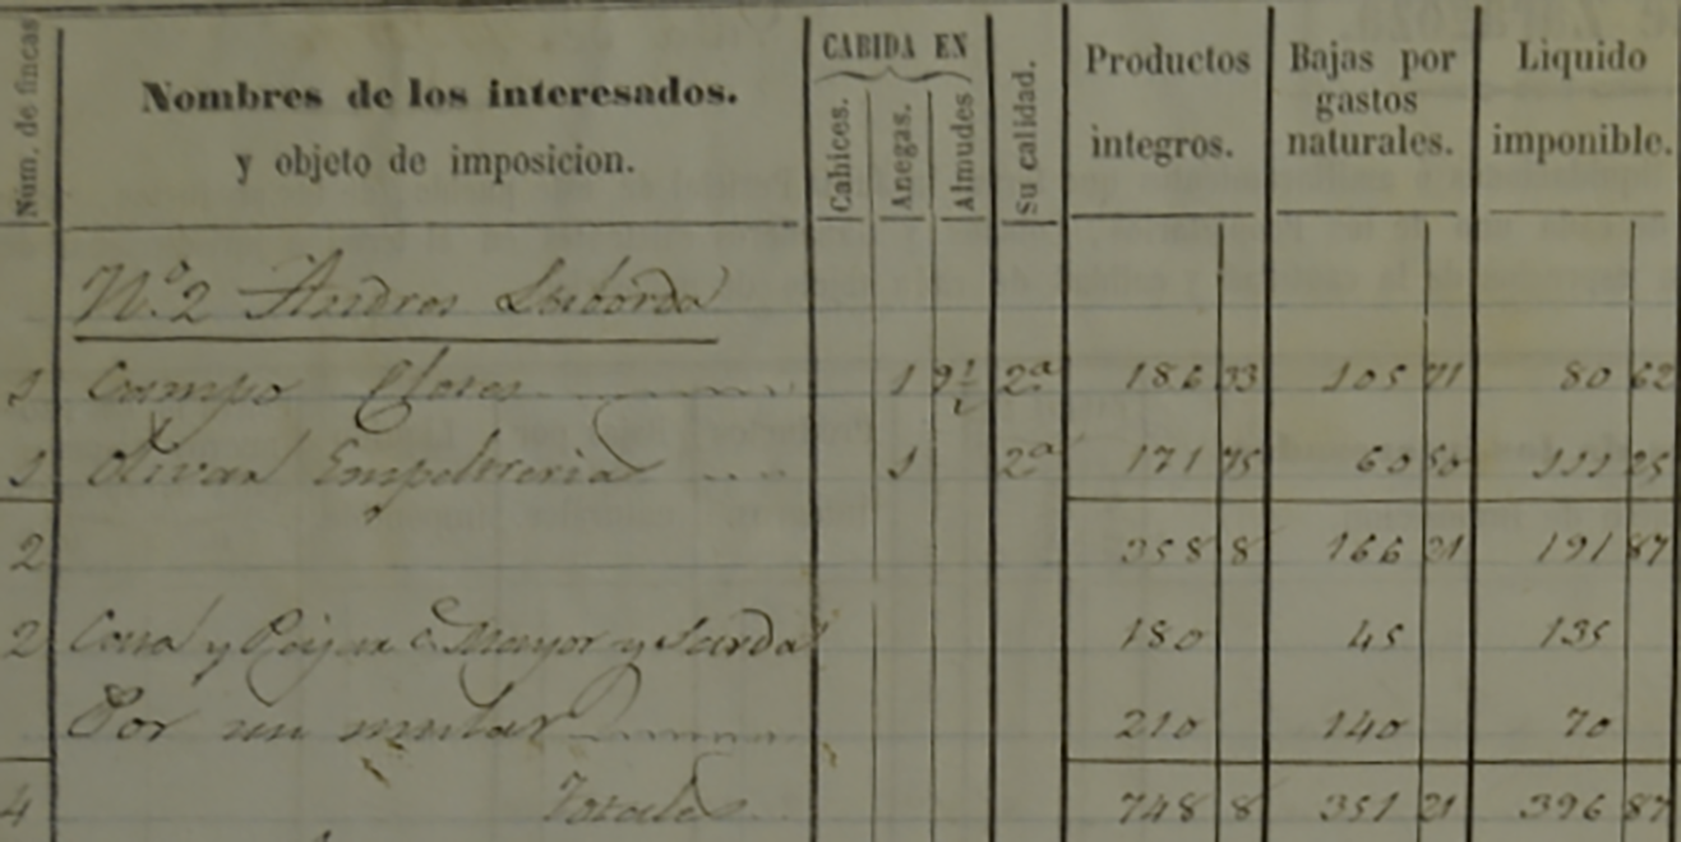
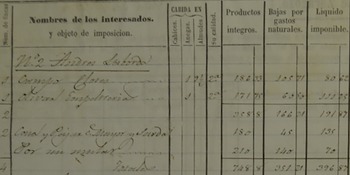
Figure 2 illustrates a portion of an amillaramiento from a municipality in the Zaragoza province.Footnote 6 All amillaramientos in the two provinces analysed here followed this standardised template. The first column lists the taxpayer’s name, such as Andrés Laborda in Figure 2, followed by a detailed inventory of properties owned within the municipality. In this example, Andrés Laborda owned a cereal field and an olive grove, with their area and quality specified in adjacent columns. He also owned a house with a straw loft and a mule. The final three columns on the right display the estimated income from each property, the associated costs, and the taxable amount. From this data, the taxpayer’s name and the taxable amount for land were transcribed, resulting in a dataset comprising 148,184 taxpayers across the provinces of Huesca and Zaragoza between 1848 and 1864.Footnote 7 Although the information of livestock was recorded, not all the municipalities gathered this information, and therefore, only land wealth was included. Moreover, as noted by Tello and Badia-Miró (Reference Tello and Badia-Miró2018) in their analysis of Catalonia employing the same data source, it is important to acknowledge that this study exclusively focuses on property distribution related to land holdings. Consequently, this study provides a partial depiction of inequality, as it does not encompass industrial properties, financial assets, or income distribution. Nonetheless, Artola Blanco et al. (Reference Artola Blanco, Bauluz and Martínez-Toledano2021) estimated that by 1900, approximately 50% of gross personal assets in Spain consisted of land, with the remainder comprising financial and business assets. Therefore, it can be assumed that in 1860, the distribution was at least similar to that of the early 20th century, suggesting that this study will analyse around half of the total asset value owned by Spaniards. Moreover, it is essential to emphasise that the region under study was primarily oriented towards agricultural production, with industrialisation only commencing towards the end of the 19th century, and this process was primarily within the agro-industry sector (German and Pinilla, Reference Germán and Pinilla1990). Hence, while the study of inequality is confined to the distribution of land, this limitation is relatively minor given the economic landscape of the region during the period under examination.
Amillaramiento of Alborge, 1860.Footnote 21
Source: Amillaramientos, Alborge 1850, 1851 y 1860, Archivo Histórico Provincial de Zaragoza, A-4008/2.
Finally, previous research has pointed to important problems of land concealment in this source (Pro, Reference Pro Ruiz1995). In the data used here, the area reported in the amillaramientos represents only 58.2% of the actual land, implying an overall concealment rate of around 40%. This underreporting, however, seems to have been concentrated primarily in grazing and pasture lands. When cropland area is reconstructed from local early 20th-century maps (Minutas MTN50) and compared with the cropland reported in the amillaramientos, the discrepancy declines markedly to around 16%. This suggests that, as indicated above, land concealment in this region affected mainly grazing and pasture lands rather than cropland. Consequently, this issue should not substantially distort the analysis, since the values of these lands were nonetheless recorded and can therefore be taken into account in the overall assessment.
Amillaramientos’ variables
The data from the amillaramientos allow for the calculation of wealth distribution and inequality through various measures. Wealth distribution within the top decile is assessed by determining the wealth shares of the top 10%, 1%, and 0.1%. To provide a more comprehensive understanding of inequality, the wealth share of the bottom 50% is also calculated, along with the share held by those positioned between the bottom 50% and the top 10% (the middle 40%). Additionally, the Gini index is computed to offer an overall measure of inequality. Together, these six variables provide insights into the distribution of land within each municipality. It is important to stress that these variables are measured in terms of land value rather than land area. Consequently, low-value land uses such as forest, pasture, and grazing land, although they may be highly concentrated in terms of area, would account for a relatively small share of total land value and thus exert only a limited influence on the level of concentration attributed to each owner. However, it has not been possible to reconstruct and extract the total land area held by each taxpayer from the amillaramientos, so this alternative approach cannot be implemented at present.
To complement these measures, the study also estimates the number of households without land properties. In doing so, the total number of taxpayers residing outside the municipality – identified in the source as terratenientes or foráneos – is subtracted from the total number of taxpayers recorded in the amillaramiento of a given municipality. The number of households is then derived from the Population Census of 1860, which provides this information at the municipal level. The number of households without property is calculated as the inverse of the percentage of resident taxpayers (assumed families) who own property within the municipality relative to the total number of households. However, in some cases, multiple taxpayers may belong to the same household – such as siblings who jointly inherited property from their parents – making it impossible to fully account for these cases. Therefore, the variable ‘families without land’ should be considered as a lower-bound estimate of the actual number of landless households.
An analysis of the wealth data for the 148,184 taxpayers reveals that the top 10% controlled 60.9% of land wealth, with the top 1% owning 22.5% of land wealth, while the top 0.1% held 6.9%, and 0.74 for the Gini index. Although these figures align closely with those calculated by Martínez-Galarraga and Prat (Reference Martínez-Galarraga and Prat2025) for early 18th-century Catalonia, they are lower than the levels observed in Italy, France, and the United Kingdom during the mid-19th century (Alfani, Reference Alfani2024). For instance, while many European countries appeared to reach a plateau in wealth accumulation by the top decile (top 10%) toward the late 19th century, around 80% of the wealth – before the decline in inequality witnessed in the early 20th century – Aragon exhibited inequality levels in the mid-19th century comparable to those of Italy and the United Kingdom during the 16th century (Alfani, Reference Alfani2024). However, wealth inequality in Aragon exceeded that of Germany in the late 18th century and was similar to levels observed in the United States until the mid-19th century (Alfani, Reference Alfani2024). Among the remaining 90% of the population, the middle 40% held 34.2% of land wealth, while the bottom 50% possessed 4.9% of land wealth, with 17.2% landless households.
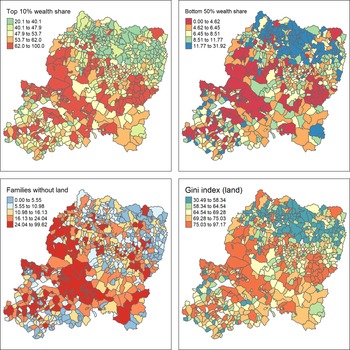
Figure 3 illustrates the spatial distribution of land wealth for the top 10%, the bottom 50%, families without land, and the Gini Index. A common trend across all four maps is that wealth was more evenly distributed in the northern areas, whereas it was more concentrated in the Ebro Valley, particularly from Zaragoza towards the northwest frontier with Navarre. However, some differences emerge among the indicators depicted. For instance, while the bottom 50% seems to hold more land in the north and northwest of the region, fewer families were landless in the northeast part of Aragon.
Inequality, land wealth owned by the top 10% and bottom 50%, families without land, and the Gini index.
Source: Own elaboration with information from the amillaramientos

Variables
The first variable considered is roughness, which measures the degree of elevation heterogeneity within each municipality. This variable is calculated following Riley et al.’s (Reference Riley and DeGloria1999) Terrain Ruggedness Index, which quantifies topographic variability. Geographic Information System (GIS) techniques are employed to compute the index, and the natural logarithm is applied to normalise the values. The expected effect of roughness on inequality is negative, meaning that higher index values – indicating steeper terrain – are anticipated to correlate with lower levels of inequality. This expectation is based on the premise that steep slopes restrict the expansion of cultivated land and present higher variability in productivity for land (Pinilla, Reference Pinilla Navarro1995). Thus, those municipalities with lower roughness and, therefore, more productivity and capacity of expansion will present higher demand for the acquisition of land, leading to higher values and higher potential rents and returns, as suggested by Gallego (Reference Gallego2001).
For instance, in the mountainous areas of Aragon, agricultural activity was largely confined to valleys, limiting cultivation to subsistence farming with little capacity for trade or export. As in other parts of Spain, these areas specialised in livestock farming, as grazing pastures were more productive and profitable than croplands. A specific case illustrating this dynamic is the town of Bierge, located in Huesca at the foothills of the Pyrenees. With an elevation ranging from 448 to 829 metres within an area of 20 km2, the local wealth evaluation committee, which was in charge of creating the amillaramiento in the early 1860s, reported that the town’s croplands were insufficient to meet the cereal consumption needs of its inhabitants, necessitating cereal imports from neighbouring municipalities.Footnote 8 The committee further noted that, as in many other Pyrenean towns, the steep slopes resulted in significant variations in soil quality, restricting highly productive croplands to just a few hectares.Footnote 9 In contrast, the Ebro Valley and surrounding plains were better suited for cereal production, allowing for specialisation and export to other Spanish regions, particularly Catalonia (Sabio Alcutén, Reference Sabio Alcutén2002). This is evident in the negative correlation between per capita wealth recorded in the Amillaramiento and terrain roughness, suggesting that municipalities with smoother terrain were wealthier.Footnote 10
As discussed earlier, existing literature has emphasised the significant role of state development since the early modern period in shaping inequality dynamics (Alfani and Di Tullio, Reference Alfani and Di Tullio2019; Schaff, Reference Schaff2023). To assess the impact of the Spanish State’s expansion on land distribution, two variables are employed. The first variable is derived from the 1787 Population Census and assigns a dummy value of 1 to municipalities under Royal jurisdiction, and 0 otherwise. During the Ancien Régime, municipalities outside Royal jurisdiction – those controlled by the nobility, the Church, or religious military orders – were subject to the economic, administrative, and judicial authority of these institutions. In contrast, municipalities under Royal jurisdiction were governed by multiple layers of royal bureaucrats and administrators. This dummy variable serves to capture the potential influence of prolonged state presence on land distribution.
Similarly, a second dummy variable is constructed using data from the same 1787 Population Census, assigning a value of 1 if the municipality employed a worker directly on the monarchy’s payroll and 0 if none were present. The use of this variable follows the arguments elaborated by Soifer (Reference Sofier2008), Acemoglu et al. (Reference Acemoglu, Garcia-Jimeno and Robinson2015), and Garfias (Reference Garfias2018), and it aims to provide a more precise measure of the state’s direct presence, distinguishing it from the broader jurisdictional measure. While the Royal jurisdiction variable reflects the general extent of state influence, the presence of state-employed workers captures the effect of a more tangible and operational state presence. Such workers likely possessed superior tools, knowledge, and capacity to implement policies, conduct inspections, and enhance state capacity compared to regular bureaucrats in other municipalities. According to the literature, these two variables – which are not correlated – are expected to be associated with higher levels of inequality. This is because, during the period under study, the state typically operated under a regressive taxation system. Consequently, municipalities with a longer historical trajectory of state presence, whether in a general sense through Royal jurisdiction or more specifically through the presence of state-employed workers, are anticipated to exhibit higher inequality levels.
In addition to the aforementioned variables, this study introduces the number of pósitos per inhabitant in each municipality in 1773. This variable seeks to capture the extent to which credit institutions such as pósitos may have influenced land accumulation and access to resources among poorer households.Footnote 11 Pósitos were public institutions managed by local councils – though some were supported by pious foundations, which are also included in the data – that provided seeds and capital to farmers in need (Martínez-Soto, Reference Martínez Soto2007).Footnote 12 By offering these resources, pósitos enabled peasants to finance the agricultural cycle or invest in improvements without resorting to private moneylenders. Accordingly, as argued by Deininger and Binswanger (Reference Binswanger and Deininger1997), access to such institutions could be expected to reduce inequality, particularly by enabling poorer families to obtain resources in times of crisis.
In terms of market access, the primary variable considered is the distance between each municipality and Zaragoza, the largest city in the region under study. This distance, measured in travel hours, is calculated based on the Roman road network depicted in Figure 1, sourced from the Mercator-E project.Footnote 13 The use of this ancient network helps mitigate potential endogeneity concerns, as the expansion of modern roads and railways could have been influenced by the existing wealth or inequality of municipalities. By relying on a road network established approximately 2,000 years ago, the analysis avoids biases that might arise from more recent infrastructure developments. The expected effect of this variable is that municipalities closer to Zaragoza will exhibit higher levels of land inequality. Zaragoza’s market likely generated greater demand for agricultural products, leading to higher prices. Thus, as proximity to the city would imply lower transportation costs, producers would obtain higher profit margins compared to those in more distant areas, making this land more demanded. Thus, as von Thünen’s model suggests, spatial specialisation was influenced by the proximity to Zaragoza (O’Kelly and Bryan, Reference O’Kelly and Bryan1996). Municipalities closer to the city had a higher proportion of their land dedicated to cereals, olive groves, and vineyards, rather than grazing lands and pastures, reflecting economic and logistical advantages associated with market accessibility. This, in turn, is expected to have led to increased rents and greater investment opportunities, as Donaldson and Hornbeck (Reference Donaldson and Hornbeck2016) highlighted for the USA, which could enhance wealth accumulation among the local elites.
Population-related variables, which aim to capture the market size within each municipality, are derived from the 1787 Population Census. Specifically, the natural logarithm of the population in 1787 is calculated, along with the compound annual population growth rate between 1787 and 1860. Additionally, population density is computed by dividing the total population of 1787 by the municipal area in square kilometres. Based on insights from the literature (e.g., Wegge, Reference Wegge2021), these variables are expected to increase inequality. Larger, more densely populated, and growing markets are likely to drive increased demand for foodstuffs, leading to higher rents and greater investment opportunities, which in turn could contribute to wealth accumulation among the elites.
Finally, the proportion of liberal professionals and artisans relative to the total population in 1787 is calculated to assess the potential impact of the middle class on land distribution. This variable is introduced based on the argument of Bavel (Reference Bavel2022), as this middling group could organise and, therefore, counteract the accumulating power of the elite. However, two factors may suggest a different effect of Bavel’s (Reference Bavel2022) argument in the case of Aragon. The relatively small population size of Aragonese municipalities in the 19th century, with a median of 556 inhabitants in 1860, meant that liberal professionals and artisans were often part of the elite in many of these municipalities. Thus, in Aragon, the organisations or institutions established by this group to support one another may have contributed to their entrenchment within the elite. Moreover, the predominance of agriculture in Aragon’s economy resulted in a large portion of the population being farmers or farm day labourers, whose incomes depended on weather and seasonal workdays. In opposition to this, professionals such as lawyers, masons, and teachers likely had more stable and regular incomes compared to day labourers or small landowners, enabling them to accumulate wealth over time. Taking the municipality of Jaca, located in northern Huesca – with a population of approximately 4,000 inhabitants in 1860 – as an example, a primary school teacher earned a daily wage of 4.4 Pesetas1913.Footnote 14 In contrast, data from Jaca’s amillaramiento indicate that the daily wages of agricultural day labourers varied significantly, ranging from a maximum of 3 Pesetas1913 during the harvest season to a minimum of 0.2 Pesetas1913 for tasks such as mule driving to transport the harvest to market. The most common daily wage for agricultural work in Jaca was 1.5 Pesetas1913.Footnote 15 Moreover, agricultural labour generally required fewer working days throughout the year compared to teaching. Assuming an equal number of working days, this wage disparity suggests that the savings capacity of day labourers was approximately one-third of that of a primary school teacher, highlighting the substantial economic advantage enjoyed by professionals in accumulating wealth. Therefore, this variable – representing the percentage of middle-class individuals within each municipality – is expected to have a positive effect on inequality. A historically significant presence of this group may indicate the persistence of a local elite capable of accumulating and consolidating wealth across generations.
Descriptive statistics
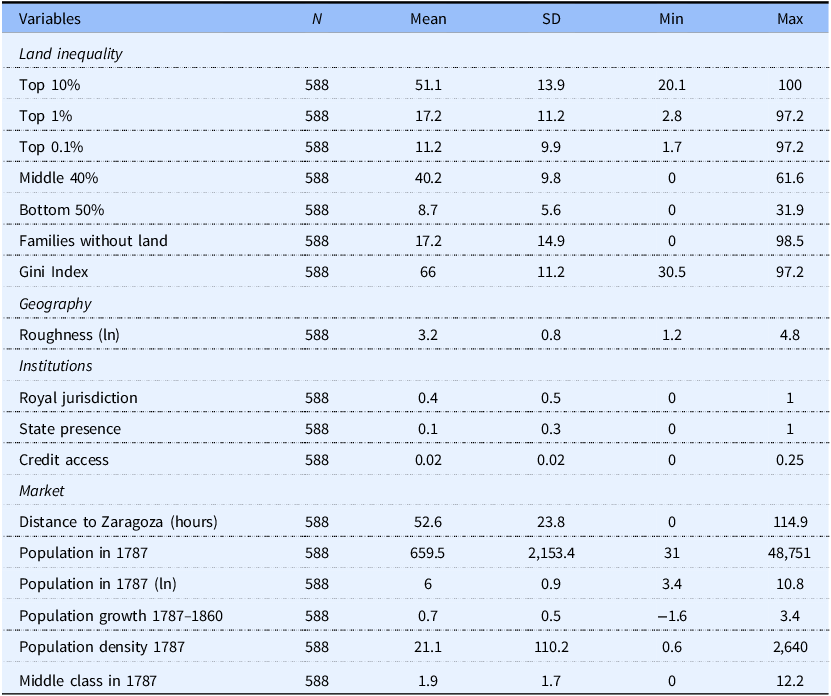
Table 2 presents the summary statistics for the variables discussed above. Although the original dataset comprised 635 municipalities, data from the 1787 Population Census is missing for 46 municipalities in the province of Zaragoza. Consequently, only 588 municipalities are included in Table 2, as they constitute the sample used in the econometric analysis. The average values shown in Table 2 are different from those expressed above, as the ones depicted below represent the average value of the 588 municipalities, while the values mentioned before indicate the pooling of the information for the 150.000 taxpayers. The identical values reported for the top 1% and the top 0.1% shares arise from the small number of proprietors in some municipalities, which causes the 1% and 0.1% thresholds to correspond to the same number of owners – typically a single proprietor in municipalities with fewer than 100 owners. Accordingly, the maximum value shown corresponds to a municipality in which a single individual held 97.2% of the wealth.Footnote 16
Summary statistics
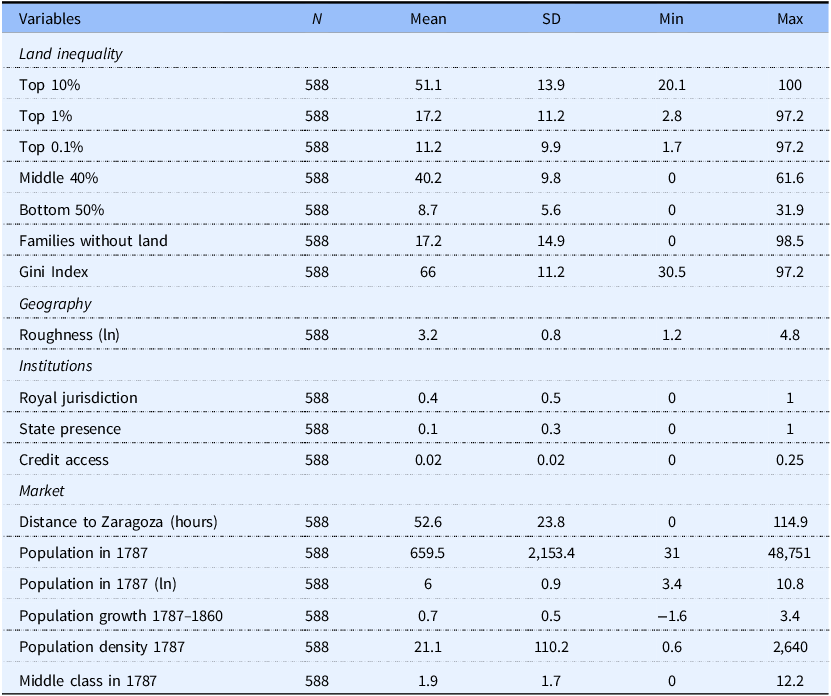
Regarding the explanatory variables, there is considerable variation in terrain roughness, with the average level being relatively high. In terms of state presence, approximately 40% of Aragonese municipalities were under Royal jurisdiction, while only about 10% had a worker directly employed by the State. With respect to market access, Table 2 shows that the average municipality was located approximately two days’ travel from Zaragoza. Additionally, population figures exhibit significant variation across municipalities, ranging from the large city of Zaragoza to small villages with fewer than 25 inhabitants. This diversity is also reflected in differences in population growth rates and population density. Finally, the data indicate that the middle class constituted a small proportion of the total population, representing approximately 2% of the population in 1787.
Methodology and results
This section assesses the determinants of inequality by using the municipality-level information presented above. The spatial patterns seen in Figure 3 indicate that there might be a spatial correlation in the dependent variables, which is confirmed with the Moran’s I test for all dependent variables. Using an OLS regression would result in spatially correlated errors, leading to biased estimates. To address this issue, a spatial regression model is applied, accounting for the spatial dependence of the dependent variable. The spatial matrix threshold is set at 50 kilometres, as lower thresholds still exhibited spatial correlation in the residuals.Footnote 17 The final equation is as follows: $Ine{q_i} = \;\alpha + \;{\beta _1}{X_i} + {\beta _2}P{J_i} + {u_i}\;$
Where Ineq is one of the seven land inequalities measured in municipality i. Moreover, X comprises the Geography, Institutions, and Market variables described above (see Table 2). The PJ term represents the Partido Judicial fixed effects.Footnote 18 The Partido Judicial was the intermediate administrative level between the province and the municipality, and it was introduced in order to account for potential omitted variables for the comparison of similar municipalities within the Partido. Finally, the u accounts for the heteroskedasticity-consistent standard errors.
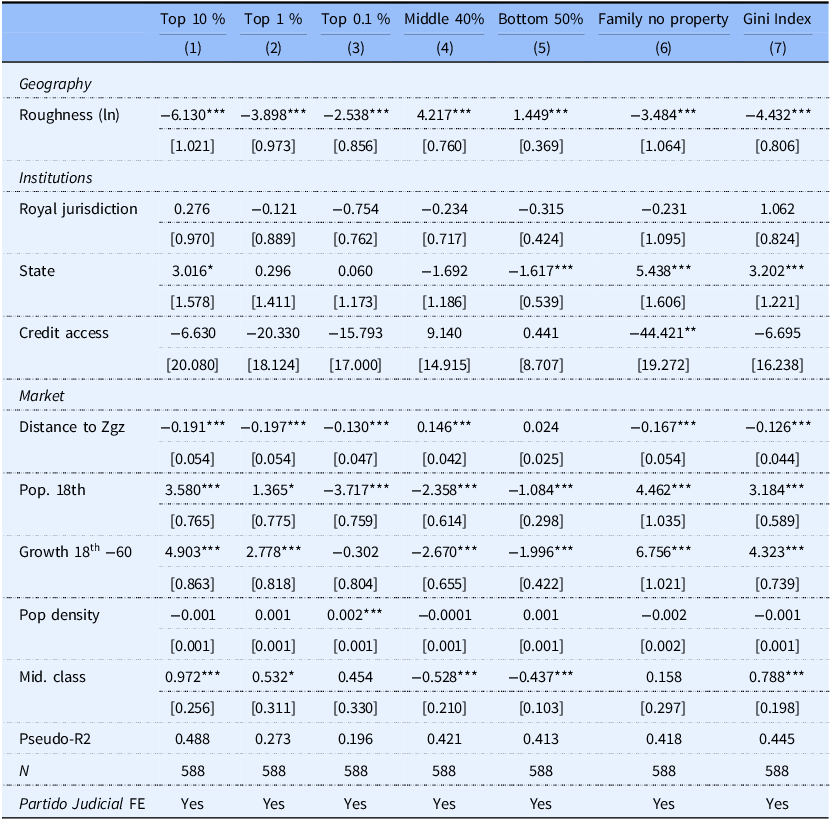
Table 3 displays the results of Equation (1), using as dependent variables the measures of land inequality.Footnote 19
Land inequality spatial regressions
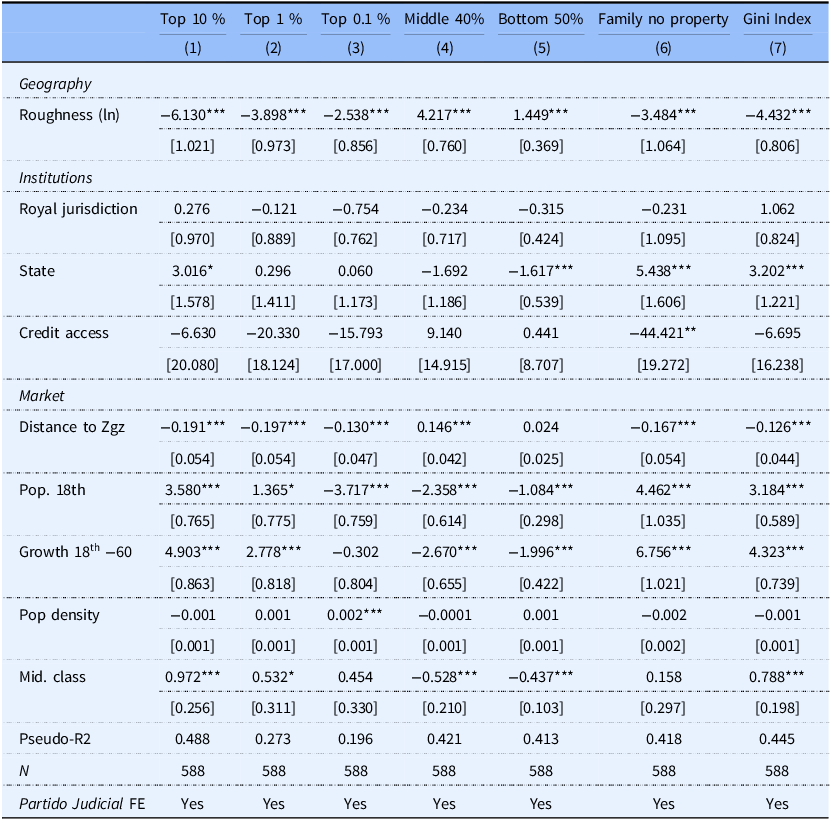
Intercept omitted. Standard errors are clustered by district in brackets, and statistical significance: ***1%, **5%, and *10%.
Geography
The geography, measured here as roughness, significantly influenced land accumulation by pre-industrial elites. Lower roughness correlated with higher accumulation rates, greater Gini coefficients, and more landless families. This relationship stemmed from geographical constraints on productivity: greater roughness implied lower soil quality or limited agricultural expansion, reducing land profitability. Consequently, elites avoided accumulating land in these areas. This had notable implications for wealth distribution, as in rougher municipalities, the middle 40% and bottom 50% accumulated more land. However, it must be borne in mind that these areas were also the poorest in per capita assessed wealth. Thus, greater land accumulation by the lower 90% in less productive regions did not necessarily imply better economic conditions compared to less rugged, more unequal, but likely wealthier and more productive municipalities. This suggests that the elite adopted a rational strategy, prioritising land accumulation in municipalities with higher productivity and expansion potential, as these areas offered better returns.
These results suggest that landownership was less concentrated in mountainous regions. In these areas, however, forests, pasture, and grazing land tended to be more prevalent than other types of land use. Because this paper examines inequality in land value rather than in land area, any potential positive association between greater concentration in land area – particularly in pastures and forests – in mountainous municipalities is not captured in the results. Instead, the analysis reflects the higher-value land uses, such as cereals, vineyards, and orchards, that were more characteristic of the lowlands. Nevertheless, when the area shares of different crops are included in the regression (results not reported), the results for roughness remain unchanged. This suggests that land productivity was an important factor across Aragonese municipalities, including those in which pasture and forest occupied a larger share of the land.
Institutions
Regarding institutions, the presence of the State in a municipality led to lower land accumulation by the bottom 50%, reducing their wealth by 18.6%, increasing landless families by 31.6%, and raising the Gini coefficient by 4.9%. This aligns with Alfani’s argument (Alfani and Di Tullio, Reference Alfani and Di Tullio2019; Alfani, Reference Alfani2024) that the pre-industrial state was funded through a regressive fiscal system. The findings suggest that where the state was present and had greater capacity for oversight and taxation, it exerted stronger extractive pressure. As a result, lower-income families (bottom 50%) were the most affected, reducing their ability to accumulate land (column 5) and forcing some into landlessness (column 6).
Moreover, access to credit yielded the expected outcomes: it curbed asset accumulation by the elite (columns 1 to 3) and facilitated land acquisition by both the middle 40% and the bottom 50% of the population, with a stronger effect observed in the former. However, the only statistically significant result is the number of landless families. In this case, pósitos appear to have helped prevent certain households from falling into landlessness, as these public institutions likely offered more favourable credit conditions than private moneylenders, thereby reducing the risk of property loss during periods of crisis or default.
Thus, this reflects that access to credit through the public institution of the pósito had only a minimal impact on wealth distribution. This limited effect is likely explained by the severe crisis these institutions experienced from the late-18th century onwards (Martínez-Soto, Reference Martínez Soto2007), which probably constrained their capacity to function as a reliable source of credit for peasant and low-income households. Nevertheless, the results remain consistent with the existing literature, which highlights how access to credit could play a role in mitigating inequality in wealth accumulation.
Market
Market forces can be analysed through access (distance) and local market effects (population and middle classes). Regarding access, proximity to Zaragoza, the region’s main city, significantly influenced elites’ land accumulation. With an average municipal distance of 52.6 hours, being one day closer (one standard deviation below the mean) corresponded to around 27% more land wealth for both the top 1% and the top 0.1%, while the middle 40% saw an 8.6% decline. The top 10% gained only 8.9%, suggesting that land accumulation primarily benefited the uppermost elite (top 1% and 0.1%), who leveraged transport and trade with Zaragoza at the expense of the middle strata. These findings indicate shorter distances, which could reduce transportation costs, potentially increasing agricultural profits and fostering production specialisation around Zaragoza. As Von Thünen theorised in the 19th century, the greater wealth of elites near cities may have resulted from specialised crops with higher yields. This could be seen in Aragon, as municipalities closer to Zaragoza had a higher proportion of their land dedicated to cereals, olive groves, and vineyards, rather than grazing lands and pastures, as mentioned above. This created a self-reinforcing cycle for the top 1% and 0.1%, as higher profits enabled further investment and greater returns through market access.
As it can be seen, this process occurred at the expense of the middle 40%, who may have been tempted to cultivate the same higher-value crops, ultimately facing bankruptcy due to their inability to compete with the elite’s superior resources. As a result, they would be forced to sell their plots to that elite. Another possible explanation is that the middle 40% held more productive or larger parcels of land than the bottom 50%, making their properties more attractive targets for acquisition by the elite.
Regarding population, the findings align with David Ricardo’s argument on land rent: higher population increases food demand, driving up rents. Consequently, in more populous and fast-growing municipalities, land became more profitable, leading elites to accumulate more (columns 1 and 2), exacerbating inequality (column 7). This also resulted in fewer families accessing land and a reduced capacity for accumulation (columns 4–6). However, the uppermost elite (top 0.1%) did not follow this pattern. As shown in column 3, they held less land in more populous municipalities, a seemingly counterintuitive result given the accumulation trends of the top 10% and top 1%. A possible explanation is that, in these areas, the top 0.1% prioritised investments in other assets. Unlike land, which in the pre-industrial period lacked fertilisers and machinery and was subject to unpredictable factors (climate, labour availability, or tenancy opportunities), commerce or pre-modern industries may have offered more attractive returns. As Garrabou et al. (Reference Garrabou, Plana and Saguer2001) note, this was particularly evident in Catalonia, where large agricultural estates were not necessarily the preferred investment for the elite. Thus, in more populous municipalities, with more dynamic sectors outside agriculture, the top 0.1% might find other sectors more attractive than investment in land.
Finally, the presence of a middle class, including professionals and artisans, was associated with greater inequality. In 1787, these groups comprised an average of 1.9% of Aragón’s total population, meaning they likely represented 5–10% of families. Given this proportion, they were probably more aligned with the top 10% than with the bottom 50% or even the middle 40%. This is reflected in increased land accumulation by the top 10%, though with a relatively small impact, while the rest of the population (columns 4 and 5) saw reduced capacity for accumulation. The greatest effect was on the bottom 50%, as one standard deviation above the average number of middle-class people led to 9.1% less land wealth accumulated by this group, in opposition to 2.2% by the middle 40%. This suggests that the liberal professionals and artisans may have extracted wealth from the bottom 50%, though without driving them into landlessness as state presence did. As mentioned above, this outcome reflects the region’s predominantly agrarian society, where most people depended on land. In contrast, professionals such as lawyers, notaries, teachers, goldsmiths, or blacksmiths likely had more stable incomes, enabling them to accumulate wealth and invest in land – though not necessarily for direct cultivation, but as a source of complementary income and status.
Conclusions
This article tries to understand land distribution in pre-industrial Aragón by the mid-19th century, focusing on municipalities in the provinces of Zaragoza and Huesca. Understanding this reality, and comparing it with other studies for Spanish and European rural and pre-industrial regions and areas undergoing industrialisation, helps reveal how elites accumulated wealth in different socio-economic contexts.
In this sense, the level of disaggregation employed here highlights that the elite did not form a monolithic group. For instance, the wealthiest elite within the top decile (top 0.1%) behave differently regarding population dynamics from the broader elite. Thus, it is crucial not only to identify the general determinants of elite wealth accumulation and its impact on inequality but also to understand the behaviour in pre-industrial agrarian regions, such as Aragon, and in more developed or industrialised regions. Comparing these patterns is essential for a deeper understanding of inequality.
This study shows that in a non-industrialised, predominantly agricultural region, elites concentrated their wealth in municipalities with higher land productivity or greater proximity to major markets, aligning with Gallego’s (Reference Gallego1998, Reference Gallego2001) arguments. Moreover, the article also reflects how various factors highlighted in the literature influenced wealth distribution in pre-industrial, agrarian Aragón. For instance, following the arguments of Alfani and Di Tullio (Reference Alfani and Di Tullio2019), state expansion in in the late 18th century Aragón seems to be influencing land distribution and the access to property for the poorer strata in the mid-19th century. Moreover, contrary to Bavel’s (Reference Bavel2022) findings, the historical presence of professionals and artisans contributed to rising land accumulation by the elite. This may be linked to Aragón’s predominantly agrarian economy and the relatively small size of its municipalities. In a society where most people depended on unstable agricultural incomes, professionals and artisans, benefiting from more stable and likely higher earnings, could integrate into the local elite. It is therefore plausible that, in an agrarian society, these professionals, together with the elite, regarded land – especially the most productive plots and those located closest to markets – as an asset to be accumulated, whether for the returns it generated or for the social status it conferred. This pattern would change over the course of the century, and particularly during the twentieth century, as Simpson (Reference Simpson2024) suggests; it would also have differed in regions where industry offered a more attractive outlet for investment, as Garrabou et al. (Reference Garrabou, Plana and Saguer2001) suggest for Catalonia.
Appendix
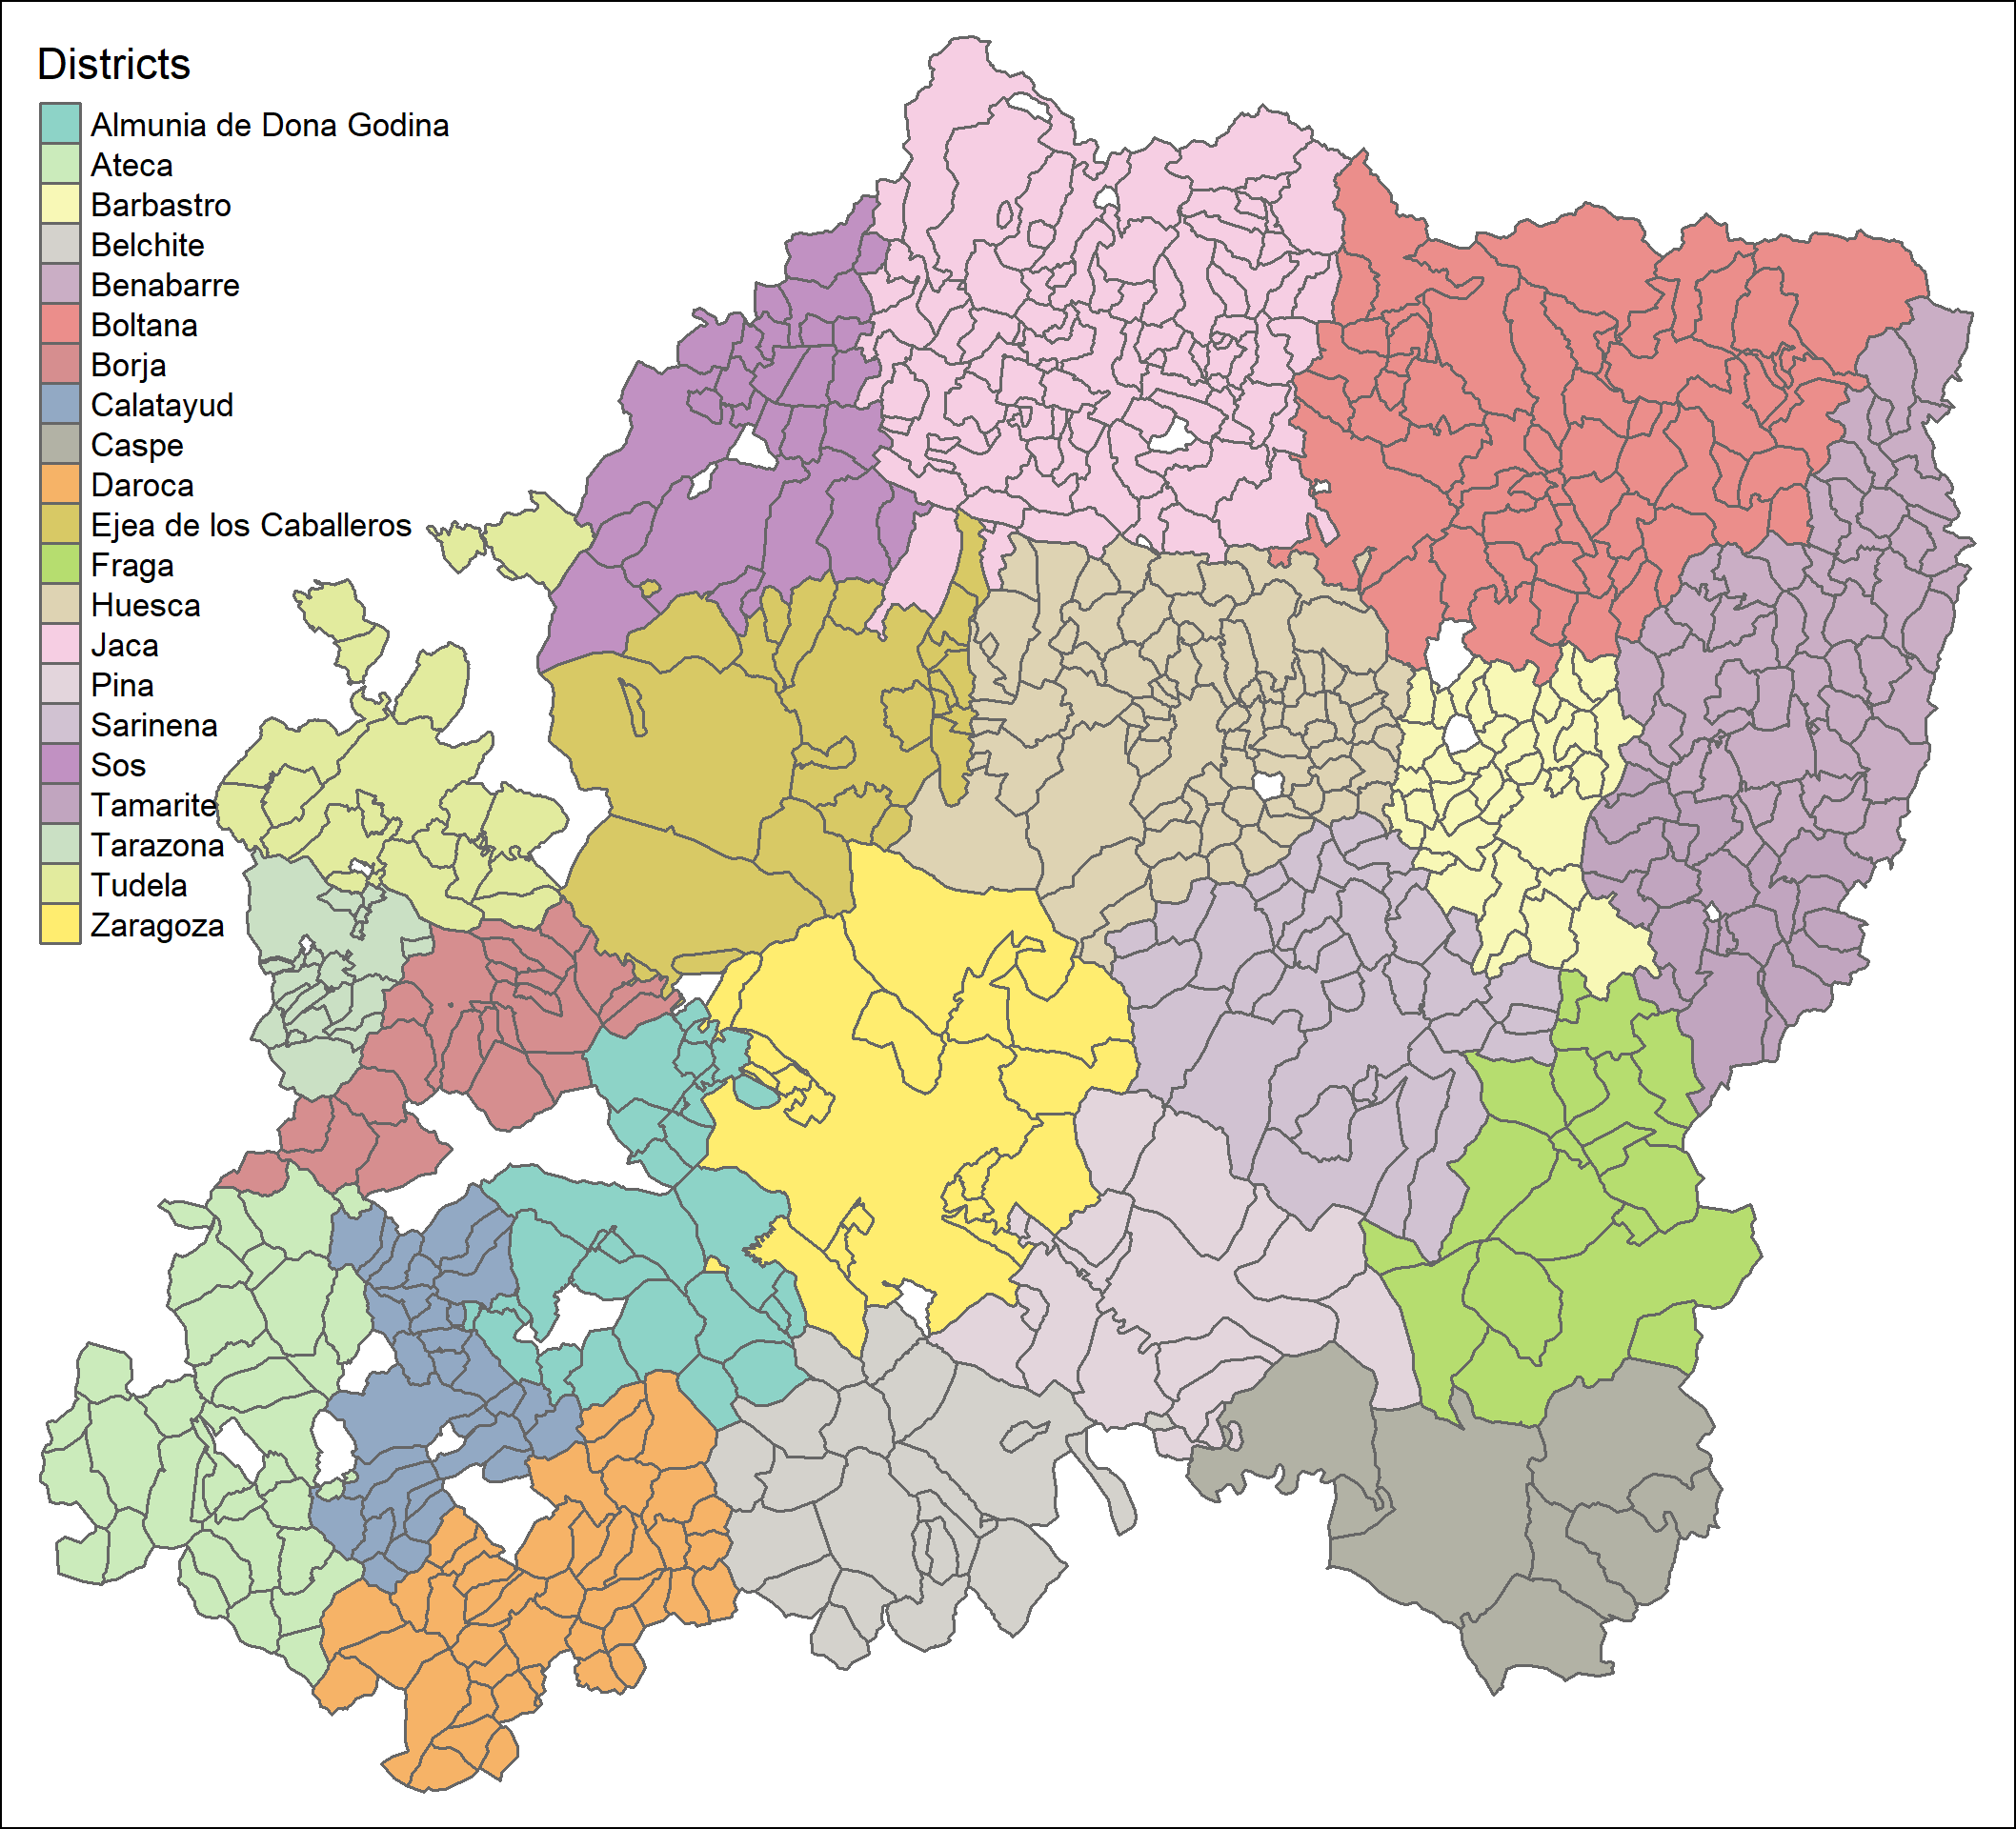
Districts

Year distribution




 Open access

